Water-energy futures for Melbourne: the effect of water strategies, water use and urban form - Kenway, S.J., Turner, G.M., Cook, S. and Baynes, T ...
←
→
Page content transcription
If your browser does not render page correctly, please read the page content below

Water-energy futures for Melbourne:
the effect of water strategies, water use
and urban form
Kenway, S.J., Turner, G.M., Cook, S. and Baynes, T
Water for a Healthy Country Flagship Report
October 2008

Water for a Healthy Country Flagship Report series ISSN: 1835-095X

Australia is founding its future on science and innovation. Its national science agency, CSIRO, is a
powerhouse of ideas, technologies and skill.

CSIRO initiated the National Research Flagships to address Australia’s major research challenges and
opportunities. They apply large scale, long term, multidisciplinary science and aim for widespread adoption
of solutions. The Flagship Collaboration Fund supports the best and brightest researchers to address
these complex challenges through partnerships between CSIRO, universities, research agencies and
industry.

The Water for a Healthy Country Flagship aims to achieve a tenfold increase in the economic, social and
environmental benefits from water by 2025. This report has been prepared by a team from CSIRO
including Steve Cook (Scenario formulation, urban hydrology analysis, report compilation), Graham Turner
(Systems modelling, scenario design and outputs, virtual water analysis), Steven Kenway (Project
concept, focus, leadership and report structure and finalisation), Tim Baynes (Energy and water analysis,
water account establishment) and Jim West (energy account establishment and modelling). The work
builds on a substantial body of work involved in developing the Australian Stocks and Flows Framework
(ASFF) and the Victorian Regional Stocks and Flows Framework (VRSFF).

For more information about Water for a Healthy Country Flagship or the National Research Flagship
Initiative visit www.csiro.au/org/HealthyCountry.html

Citation: Kenway, S.J. et al. 2008. Water-energy futures for Melbourne: the effect of water strategies,
water use and urban form. CSIRO: Water for a Healthy Country National Research Flagship.
Copyright and Disclaimer
© 2008 CSIRO To the extent permitted by law, all rights are reserved and no part of this publication
covered by copyright may be reproduced or copied in any form or by any means except with the written
permission of CSIRO.

ISBN 978 0 643 09566 3
Important Disclaimer
CSIRO advises that the information contained in this publication comprises general statements based on
scientific research. The reader is advised and needs to be aware that such information may be incomplete
or unable to be used in any specific situation. No reliance or actions must therefore be made on that
information without seeking prior expert professional, scientific and technical advice. To the extent
permitted by law, CSIRO (including its employees and consultants) excludes all liability to any person for
any consequences, including but not limited to all losses, damages, costs, expenses and any other
compensation, arising directly or indirectly from using this publication (in part or in whole) and any
information or material contained in it.

Cover Photograph:

From CSIRO’s ScienceImage: www.scienceimage.csiro.au
File: RK1538
Description: Aerial view of Melbourne City Skyline and the Yarra River
Photographer: Robert Kerton
© 2002 CSIRO

Water-Energy Futures for Melbourne

ACKNOWLEDGEMENTS
The authors would like to thank a range of reviewers for comments at various stages of the report
preparation.

    Water-Energy Futures for Melbourne                                                              Page iii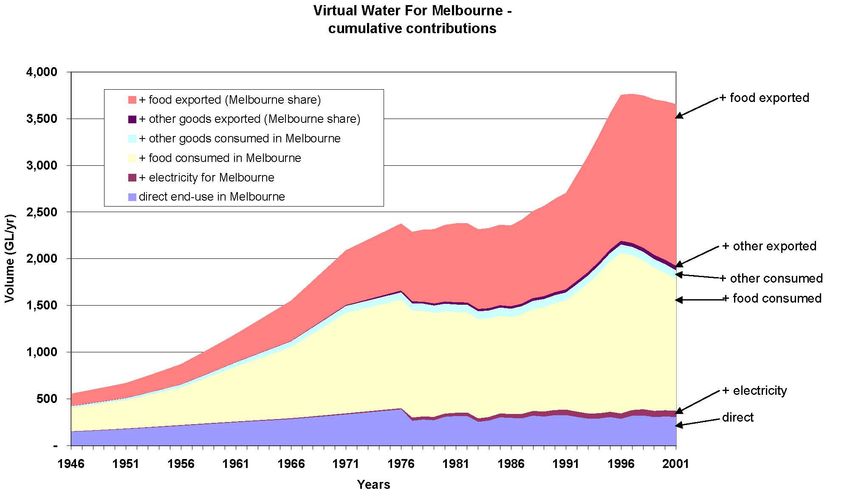
ABBREVIATIONS AND NOTATION

a                  annum (year)
ABARE              Australian Bureau of Agricultural Resource Economics
ABS                Australian Bureau of Statistics
ASFF               Australian Stocks and Flows Framework
BAU                Business as usual
CO2-e             carbon dioxide equivalent – An index that integrates various greenhouse gases associated
                  with a system by using the global warming potential of each to weight the contributions.
                  Note that approximately 300 kg C02-e/GJ (approximately 1 kg C02-e/kWh) is the
                  recommended conversion factor for indirect emissions factors (Full Fuel Cycle including
                  Scope 2 and 3) for consumption of purchased electricity in most Australian States
                  (Department of Climate Change 2008). Consequently use of 100 GWh (0.36 PJ) is
                  factored to contribute approximately 100,000 t of CO2-e.
CSIRO              Commonwealth Scientific and Industrial Research Organisation
GHG               Greenhouse Gases (GHGs common to the water industry include Carbon Dioxide (C02),
                  Methane (CH4) and Nitrous Oxide (N2O).
GJ                 Giga Joule (109 Joules)
GL                 Giga Litre (109 Litres)
HWS                Hot water system
J                  joule (one watt second)
kWh                kilowatt hour (3.6 MJ or 3.6 x 10⁶J)
LGA                Local Government Area
ML                 megalitre
PJ                 Peta Joule (1015 Joules)
TJ                 Tera Joule (1012 Joules)
Virtual Water Refers to the quantity of water required to manufacture, and supply to the point of use, a
              product, material or service. Also referred to as embodied water, embedded water or
              hidden water.
VRSFF              Victorian Regional Stocks and Flows Framework
WWTP               wastewater treatment plant

     Water-Energy Futures for Melbourne                                                            Page iv
EXECUTIVE SUMMARY

This report presents an analysis of water and energy futures for Melbourne. The backdrop to the work is
regional and national water stress, which increasingly attributes to climate change, a shift towards more
energy-intensive future water sources and a struggle to constrain growth in energy consumption. The
work has been undertaken to initiate dialogue regarding the substantial, complex and often ignored
relationships between water and energy policy and management.

An important sub-theme of the work is the desire to describe the influence of relevant policy levers in
context with the total energy and water throughput of Melbourne. The report aims to create a more
quantitative and sustainability-oriented context for decision-making including the “virtual” water
consumption by Melbourne in electricity and food.

Six scenarios were designed to identify the potential influence of three key policy considerations on
future water and associated energy needs: urban form, residential end-use and the type of water supplies
provided. The scenarios were analysed through to the year 2045 using the Victorian Regional Stocks and
Flows Framework (VRSFF) model. VRSFF is comprised of linked calculators that account for many
dynamics of the “physical” economy such as land use, demographics and water and energy accounts. The
model has been calibrated to replicate trends from the 1970s through to 2001.

The study has demonstrated that by 2045:

    •   A compact urban form over a sprawling Melbourne could reduce growth in residential water
        consumption by approximately 100 GL/year, primarily through reduced outdoor water use. If
        Melbourne’s urban growth and operation progresses without efforts to conserve energy, water or
        land, residential water use increases by about 50% relative to 2001 and residential energy use
        increases by 200% over the same time period.
    •   Compared to “business as usual”, adopting water demand management strategies could directly
        save 45 GL/year of water. Using solar hot water systems (HWS) could indirectly offset an
        additional 10 GL/year due to reduced water demand for electricity generation.
    •   Using increased solar hot water systems, (80% on new dwellings and 20% of existing) could
        save 0.14 PJ/year in the water system. It could also save around 30 PJ/year through reduced
        residential energy use.
    •   Compared to conventional water supply services, desalination increases energy consumption for
        water services by approximately 3 PJ/year which leads to a tripling of current energy use for
        water service provision. However, this increase is marginal in the context of the anticipated
        growth in Melbourne’s residential and total urban energy use (approximately 200 and 2000
        PJ/year respectively).

The report does not attempt to provide a definitive analysis of all links between water and energy use or
to rank or judge any particular solution. However, it does demonstrate how the application of whole of
system analytical techniques such as the stocks and flows framework can provide new insights to inform
the development of effective integrated resource management policies.

Recommendations are made to progress the understanding and management of water-energy interactions
including:

    •   Improved characterisation of energy use through the water cycle;
    •   Analysis of regional plans and strategies;
    •   Collaborative development of more detailed scenarios; and
    •   Development of reporting indicators and requirements to help widen the knowledge sets.

    Water-Energy Futures for Melbourne                                                               Page v
TABLE OF CONTENTS

1.      Introduction ....................................................................................................... 1
        1.1      Background ............................................................................................................... 1
        1.2      Driving Forces ........................................................................................................... 3
        1.3      Report Objectives, Focus and Outline ...................................................................... 5

2.      Modelling Approach.......................................................................................... 6
        2.1      Victorian Regional Stocks and Flows Framework..................................................... 6

3.      Scenario Descriptions ...................................................................................... 8
        3.1      Scenario Overview .................................................................................................... 8
        3.2      Common Assumptions.............................................................................................. 9
        3.3      Scenario Descriptions ............................................................................................... 9
                 3.3.1         Scenario Set 1 (Compact Urban Form)................................................................. 9
                 3.3.2         Scenario Set 2 (Urban Sprawl) ........................................................................... 11

4.      Scenario Analysis and Discussion ................................................................ 12
        4.1      Water Use, Energy Use and Overview of Impacts.................................................. 14
                 4.1.1         Urban Form ......................................................................................................... 17
                 4.1.2         Water End-use and Solar Hot Water Systems ................................................... 18
                 4.1.3         Water Services ................................................................................................... 19
        4.2      Virtual Water ........................................................................................................... 22

5.      Conclusions, Recommendations and Research Needs ............................... 23
        5.1      Conclusions............................................................................................................. 23
        5.2      Recommendations and Research Needs ............................................................... 24

Appendix A Overview of the VRSFF Model ............................................................ 26
        Water Accounting .............................................................................................................. 26
        Urban Form of Melbourne ................................................................................................. 28

Appendix B Water and Energy Assumptions ......................................................... 33
        Water-Energy Intensity Assumptions ................................................................................ 33
        Reliability of Rainwater Tanks ........................................................................................... 34

Appendix C VRSFF Land Use and Water Intensity Assumptions ......................... 36

References................................................................................................................ 38

     Water-Energy Futures for Melbourne                                                                                                                  Page vi
List of Figures
Figure 1 Greater Melbourne Region water delivery system.......................................................................... 2

Figure 2 VRSFF spatial representation of settlement pattern..................................................................... 10

Figure 3 Residential water demand for Melbourne.................................................................................... 15

Figure 4 Energy required for water services ............................................................................................... 15

Figure 5 Surface water flow in Yarra Water Management Area ................................................................. 16

Figure 6 Water required by dwelling type ................................................................................................... 17

Figure 7 Residential energy demand – Melbourne ..................................................................................... 19

Figure 8 Water demand for electricity production – Latrobe...................................................................... 20

Figure 9 Fraction of river flow by-passing dam – conventional versus desalination.................................. 21

Figure 10 Virtual water flows – Melbourne (Cumulative* Volumes)........................................................... 22

Figure 11 The System of Environmental-Economic Accounting for Water (SEEAW) framework developed
    by the United Nations Statistics Division [2007], effectively covered by the VRSFF Water Account .. 26

Figure 12 Influence diagram summarising the data connections (shown by arrows) from modules higher
    in the hierarchy of the water account to lower modules ...................................................................... 27

Figure 13 Stocks (barrels) and flows (pipes) variables from the “dam account” module .......................... 28

Figure 14 Spatial pattern of low density residential development in 2002 ................................................. 29

Figure 15 Spatial pattern of medium density residential development in 2002 ......................................... 29

Figure 16 Spatial pattern of high density residential development in 2002................................................ 30

Figure 17 Spatial pattern of low density residential development in 2100 representing Scenario Set 2
    through to 2100 ................................................................................................................................... 30

Figure 18 Spatial pattern of low density residential development in 2100 representing Scenario Set 1
    (compact urban form) .......................................................................................................................... 31

Figure 19 Spatial pattern of medium density residential development in 2100 representing Scenario Set 1
    (compact urban form) .......................................................................................................................... 31

Figure 20 Spatial pattern of high density residential development in 2100 representing Scenario Set 1
    (compact urban form) .......................................................................................................................... 32

Figure 21 Volumetric reliability for 1 KL rainwater tanks – Melbourne surface waters .............................. 35

List of Tables
Table 1 Scenario summary........................................................................................................................... 8

Table 2 Scenario results (water and energy overview)............................................................................... 12

Table 3 Water supply breakdown ............................................................................................................... 13

     Water-Energy Futures for Melbourne                                                                                                         Page vii

1.     INTRODUCTION

1.1        Background
There is increasing urgency in Victoria for the development of policy that offers solutions to the long-
term security of Melbourne’s water supply. Policy decisions are being formed against a backdrop of
current water stress due to lower than average inflows, predicted future water shortages due to increased
demand driven by population growth and a shift to a drier climate due to projected impacts of human-
induced climate change.

In the haste to provide solutions to the challenges of water supply shortages, there remains the need to
consider the future implications of policy options and interactions with other sectors such as energy
services, greenhouse gas emissions and demographics. In moving forward with resolution of water
supply issues, it is important to ensure that inter-linked problems are not exacerbated.

Based on current water supplies and projected demand, it has been forecast that Melbourne will face a
shortfall in supply of 205 GL/year by 2055 (Department of Sustainability and Environment 2005). This is
driving the need to consider alternative sources such as desalination and reuse which have implications
for energy demand and greenhouse gas emissions. This has been a sticking point for their policy support,
particularly desalination, because the solution contributes to the problem.

While the energy use and greenhouse emissions of water supply options are often discussed, there has
been relatively little discussion regarding the significance of these increases or the wider implications of
their adoption. The approach adopted for this study aimed to investigate these implications as well as to
consider related drivers of water use and urban form.

The Victorian government has released the Central Region Sustainable Water Strategy: Action to 2055
(Department of Sustainability and Environment 2006) which proposes a number of solutions for the
projected Greater Melbourne water shortages. Solutions floated include wastewater recycling, seawater
desalination and end-use demand management strategies. The Victorian government has recently
released the water strategy for Melbourne, Our Water Our Future, which identifies desalination and
transfers from the Goulburn catchment as the preferred options in securing Melbourne’s water supply.
Desalination would increase the energy required to deliver water services because Melbourne’s potable
water supply is largely supplied by gravity from ranges to the east of Melbourne (Figure 1) and the
system uses more passive treatment processes because its catchments are largely protected and deliver
relatively clean water.

This report specifically aims to inform and promote discussion regarding the links between urban water
and energy policy. As such it sets out to explore existing trends and potential shifts affecting water and
energy services and the implications of these factors over the next 40 years for a limited scenario set. The
report does not attempt to provide a definitive analysis of the many links between water, energy and
greenhouse emissions. This would be a difficult task given the current state of knowledge and the limited
scope of this exploratory study. However, it does attempt to provide an example of the type of approach
that may elucidate these linkages and identify areas necessary for knowledge development. The report
focuses on energy specifically because current knowledge regarding greenhouse gas emissions
throughout the water cycle is less well developed. In Victoria, most electric energy is sourced from
brown coal-fired power plants. This produces around 387 kg of carbon dioxide equivalents (C02-e) per
GJ of power generation (WSAA 2005) or 1.444 kg of C02-e per kWhr of generation (Sustainability

Water-Energy Futures for Melbourne                                                           Page 1

Victoria 2004). In the Latrobe Valley around 1 GL of water is consumed for every 2 PJ of power
produced.

A particular focus of the report is the interactions between water services and energy demand. Water
utilities use large amounts of energy to treat and deliver water to residential and industry end-users which
then consume more energy in heating, pumping and using the water. Wolff (2004) makes the point that
there is the need to better understand the energy implications of water policy decisions. There has been
recent analysis and discussion of national-level linkages between climate, energy and water (Proust et al.
2007). This report aims to contribute to this debate with a focus on urban systems.

Source: Kenway et al. (2008)

                               Figure 1 Greater Melbourne Region water delivery system

An additional focus of the report is that of “virtual water” movement. There is strong current debate
regarding urban and rural water sharing including the use of water for power generation. The water
necessary to sustain cities can be sourced from well outside city boundaries and includes water to
produce agricultural food and fibre, energy and other products. Preliminary analysis of this virtual or
embedded water was undertaken to characterise the total dependence of Melbourne on water as well as to
describe the flows and again commence an exploration of the interrelationships that exist in this area.

This report does not consider the implications of alternative population and energy supply policy,
although the modelling framework is designed for such analysis. However, all scenarios do include the
projected implications of climate change for Victoria (e.g. Howe et al. 2005). Given the dynamic nature
of water and energy policy and knowledge at present, the scenarios developed by the research team can
be expected to date, possibly rapidly. The important point though is that improved understanding is
needed regarding the implications of water management on energy as well as energy management on
water.

Water-Energy Futures for Melbourne                                                          Page 2
This work aims to act as a preliminary demonstration of this analysis. Further liaison with industry and government is recommended to test in more detail a wider or more characterised scenario set. 1.2 Driving Forces In order to explore the likely implication of different policy options a range of scenarios have been defined. This section briefly outlines the driving forces that the scenarios have been constructed around. Numerous drivers are providing the stimulus for exploring options for the provision of urban water supply and implications for energy demand. Drivers include projected climate change impacts, such as decreasing inflows to water catchments, the need to stabilise and decrease emission of greenhouse gases, population growth and land use change. There is also emerging tension nationally between the provision of water and power provision. Because most power provision requires water (e.g. for boiler steam and cooling), in the ongoing drought there is a strategic need to reserve some water supplies to ensure continued power production. These drivers create a significant challenge in developing policy for water and energy security while at the same time responding to the local need for environmental protection and the global need to reduce greenhouse emissions. The following paragraphs describe the scenario drivers within the current political and social setting and the trajectories of these drivers as explored within scenarios. The driving forces used have a high degree of uncertainty around future trajectory and in many cases are politically dynamic. Therefore, the scenarios described don’t have the purpose of simulating what is most likely to happen in the future, but instead explore alternative directions that highlight trade-offs, physical limitations and interactions between different sectors. Population Population in the Melbourne Statistical Division is projected to grow from 3.47 million people recorded in the 2001 census to 4.8 million in 2031 (Department of Sustainability and Environment 2005). There are projected to be a number of fundamental shifts in Victoria’s demographics over this period, which include a rapidly ageing population, declining fertility rates and decreasing household size. The population scenario used in this report is consistent with the projections of Victoria in Future 2004 (Department of Sustainability and Environment 2005). Population growth will further pressure the supply of water resources from natural catchments, which will drive the need to explore alternative options for urban water supply. The projected population for Melbourne is consistent across all scenarios. Climate change Human-induced climate change, which is linked to the burning of fossil fuels that emit greenhouse gases, is likely to impact on inflows to Victoria’s water catchments. Howe et al. (2005) show that under the assumptions of most climate change scenarios Victoria is likely to receive less rainfall and display higher evaporation rates. This decreased rainfall will drive the demand for alternative water sources. Urban form The Melbourne population is currently predominately accommodated in low density separate dwellings, which has resulted in considerable sprawl of the city. This urban form impacts on end-use water demand, with the majority of these dwellings having gardens that require irrigation. The land use pattern also has Water-Energy Futures for Melbourne Page 3
implications for infrastructure provision. In response to some of the issues associated with urban sprawl
the Victorian government has released Melbourne 2030 (Department of Infrastructure 2002), which sets
a strategy for the growth of the metropolitan area to accommodate an expanded population. A key
direction of this strategy is the setting of urban growth boundaries to limit the sprawl of the urban area,
with future growth increasingly directed away from the urban fringe towards higher density development.
This study aims to inform similar decisions.

The proposed move to increased density in Melbourne’s urban form has been a very contentious political
issue due to perceived effect on land prices and suburb character. There have been a number of
adjustments to the urban growth boundary since it was enacted five years ago. The last census revealed
that population growth was still occurring most rapidly at the rural urban fringe; while in a number of
older inner city suburbs the population was stable or actually had declined. The complete realisation of
the Melbourne 2030 vision for urban growth remains a significant challenge. Scenarios used for this
report compared increased urban density and continued sprawl.

Water end-use

Demand management strategies, such as low-flow showerheads and water efficient washing machines,
have the potential to not only significantly reduce overall water demand, but also reduce the energy
associated with the end-use of water. Water end-uses, in particular water heating, are a significant part of
overall residential energy consumption and therefore greenhouse gas emissions. In Melbourne, the
majority of households (77%) use gas as the primary energy source for water heating, while 19% use grid
electricity for water heating and less than 1% have system primarily fuelled by solar power (ABS 2005).
The energy source for water heating has significant implications for greenhouse gas emissions, with
electric storage systems releasing 4 tonnes of C02-e per year compared to gas systems of 1 tonnes of
C02-e per year and gas boosted solar systems 0.1 tonnes of C02-e per year (based on 140 litre hot water
consumption per day) (Australian Greenhouse Office 2001).

In Victoria, water heating accounts for 27% of total residential energy demand (ABS 2005). Other
significant household demands for energy are heating and cooling (39%) and appliance use, including
lighting (30%). Therefore, a demand management strategy that focuses on a shift to cleaner energy
sources for water heating, such as solar and increased efficiency of hot water appliances could be
expected to significantly reduce residential energy use. As the majority of Melbourne households use gas
as an energy source for water and space heating, a focus on appliances and hot water would also address
the majority of household greenhouse gas emissions (Australian Greenhouse Office 2005).

Scenarios explored in the report compare an increased uptake of solar hot water systems (HWS) and
demand management strategies, especially in new dwellings, with a baseline that assumes continuation of
current mix of energy sources for water heating and no increased uptake of water efficient appliances. At
the time of writing new homes in Victoria are required to have either a rainwater tank or a solar HWS
installed. The increased uptake of many demand management strategies, such as more efficient washing
machines, may largely depend on government incentives or statutory requirements, as in many cases the
economic payback period does not justify the investment at current water and energy prices.

Water services

Current water stress in Melbourne has led to the consideration of alternative water sources. Scenarios
used for this report propose two alternatives for comparison with conventional water supply for
Melbourne, where water is captured in protected catchments remote from the urban area. The first
alternative simulates increased uptake of rainwater tanks and local industrial or irrigation wastewater
recycling using limited or no additional treatment of Melbourne’s wastewater flows.

Water-Energy Futures for Melbourne                                                          Page 4
This scenario assumes 20% of low density houses have rainwater tanks used for toilet flushing installed
to ensure negligible energy use. Currently rainwater tank uptake in Melbourne is estimated at 6% of
households (Marsden Jacob Associates 2007). The second alternative assumes that new potable demand
will be satisfied by desalination plants. Desalination has been identified as a preferred option in
Victorian government’s Our Water Our Future for securing Melbourne’s potable water supply.

1.3        Report Objectives, Focus and Outline
A key objective of this work was to improve the understanding of the complex interrelationships between
urban water and energy and improve debate on this topic which is often focussed on very specific
options. An important sub-objective was the desire to describe the influence of relevant policy levers
(particularly water policy) in context with the total energy and water throughput of Melbourne: or
Melbourne’s metabolism. Metabolic analysis also typically includes all material (including water and
nutrients) and energy flows (refer for example, to Sahely et al. 2003; Newman 1999, Pamminger et al.
2008 and Kenway et al. 2008); however this report is focused specifically on water and energy. In so
doing the report aims to create a more quantitative and sustainability-oriented context and methodology
for decision-making. A final objective was to evaluate the efficacy of the Stocks and Flows Framework
and the VRSFF model in undertaking such analysis.

The concepts and issues explored in this work included the water and energy use implications of:

•   city-scale water management options focused on major alternative water supply options as well as
    decentralised options including rainwater tanks
•   water end-use characteristics including demand management and use of solar hot water systems
•   future configurations of Melbourne or options relating to urban form
•   the total flows of water to Melbourne including virtual or embedded/embodied water.

The structure of this report is as follows.

Section 1 (this section) provides brief background context to the project and outlines some of the driving
forces that scenarios have been constructed around.

Section 2 provides an overview of the Stocks and Flows Framework approach and gives a more detailed
description of VRSFF model as applied in this project.

Section 3 describes the scenarios that were applied within VRSFF, which includes the technical
assumptions behind the scenarios.

Section 4 presents the results of the scenarios implemented in VRSFF. It also draws out the implications
of the scenario outputs, with particular focus on the interactions between sectors and the trade-offs or
synergies that might be involved in implementing different water policy options.

Section 5 offers some conclusions together with research needs in this area.

Water-Energy Futures for Melbourne                                                        Page 5
2. MODELLING APPROACH 2.1 Victorian Regional Stocks and Flows Framework The Victorian Regional Stocks and Flows Framework (VRSFF) was developed to comprehensively cover the physical economy of Victoria. The VRSFF defines key stocks and flows of materials (including water) and energy and the interconnections between them in physical units (e.g. kilograms, litres, joules) rather than dollar values. It can be used for exploring the physical implications of pursuing different future development pathways or policy options. The VRSFF is based on systems theory that focuses on the interconnections and interdependence between different parts of the system, with the system in this case being defined as the Victorian physical economy. This means the model is equipped to explore interactions between different parts of the system, such as water, energy, land use and climate. The VRSFF is a set of linked calculators that account for many of the important dynamics in the physical economy, such as land use change, demographics and water and energy accounts. The model is implemented as a dynamic simulation that enables a future pathway for a physical stock (e.g. land, water) to be set and then evaluated for physical feasibility. This allows for cross-checking by mass balance the future trajectory of a variable according to physical laws and relationships. This enables the VRSFF to identify tensions or feedbacks in the system; for example, under a projected climate change scenario and assumed population projection it could be explored at what point current water supply services would not be able to meet demand. This approach can highlight the implications of different futures over the long term that can be used to improve policy decisions in the present. The Stocks and Flows approach has previously been applied in Australia to analyse, at a 5-years time step, the Australian physical economy, such as the Future Dilemmas report that explored implications of different population scenarios for Australia and interactions with technology, resources and the environment (see Foran and Poldy 2002). A key point of difference between VRSFF and some earlier Stocks and Flows frameworks is that VRSFF has a higher degree of spatial resolution which enables more detailed tracking of variables such as dwelling types. The coverage and level of detail of the VRSFF water account closely matches that of the physical account of the System of Environmental-Economic Accounting for Water (SEEAW) framework developed by the United Nations Statistics Division [2007]. Appendix A contains an overview of the VRSF model. Historical data sources for the VRSFF are many and include, for example, decades of information on population from ABS Censuses; time series on energy consumption from ABARE; land use zoning and GIS data from the Department of Sustainability and the Environment and water data from multiple locations such as the ABS Water Accounts, State Water Reports, Murray Darling Basin Commission Reports, State of the Environment Reports and the Victorian Water Review. For a full account refer to Baynes et al. (2007). Relevant data from outside the direct water arena include, Victoria in Future 2004 population projections; Melbourne 2030 policies; Victorian Greenhouse Strategy; Our Water Our Future and the Victorian Regional Scenarios draft report. Except for the variables that we have described in the report to do with specific scenario settings, the remainder of the controls variables were set in keeping with the historical trend established by the calibration. Climate variables were established using output from CSIRO and Department of Sustainability and Environment modelling and analysis. Water-Energy Futures for Melbourne Page 6
The current version of the water account framework covers, in annual time-step:

•   water requirements across all sectors of the Victorian economy and society (informed by other
    components of the VRSFF) at Local Government Area (LGA) level, including water recycling by
    centralised treatment plants and re-use of water (within industry or sector)
•   water availability by 29 water basins, influenced by many factors, including climate variables and
    land-use (informed by other components of the VRSFF)
•   water stocks or flows including surface (rivers, wetlands) and major storage (dams)
•   soil (groundwater/aquifers) water discharge from all water uses, tracking water quality as unpolluted,
    blackwater, greywater, stormwater
•   water transfers between water regions and inter-state
•   additions to and extractions from all water stocks, by centralised systems; or self-extracted means
•   energy required to treat and move water for potable treatment and pumping sewage treatment and
    pumping; desalination; and inter-region transfers.
The spatial coverage of the framework is the state of Victoria, with the accounts maintained in each of
the 29 water regions of Victoria at yearly time-steps. Appropriate geographical connections such as
transfers between states are also included. The water regions are major catchment basins and are linked
in the framework according to the river networks.

The VRSFF analytical system has features in common with system dynamics which is an approach to
understanding the behaviour of complex systems over time. System dynamics is different from other
approaches in the use of stocks, flows and feedback loops. These elements help describe how even
seemingly simple systems can display baffling non-linearity and cyclical patterns. The common features
in VRSFF includes the evolution of stocks (with age profiles), linking of stock and flow variables in
causal chains of influence and the use of a diagrammatic interface and time series output (see also
Appendix A).

An innovative difference of the work with VRSFF is the deliberate removal of automated feedback loops
within the model code related to the social or economic domain. This has particular importance for
exploring the many behavioural, technological and engineering options that influence the physical world
(e.g. water, energy). For example, a strength of VRSFF is that storage (dam) volumes can, under some
circumstances, exceed their capacity or become negative depending on the various settings that
ultimately determine the inputs and outputs to the storage. Clearly this is physically impossible; however,
the tension forces the analysis to investigate the drivers of the tension rather than automating this
process. This sort of tension can be solved by a wide range of options, such as changing the proportion of
river flow that is stored, modifying the storage capacity, changing abstractions, employing inter-basin
water transfers, or simulating alternative population growth, economic structure or climate change.
Keeping the feedback loops associated with these dynamics non-automated greatly enhances the ability
to identify key factors resulting in the tension. It is then possible to design and explore (manually or
through auxiliary feedback code) a wide range of responses that alleviate the tension.

The model is grounded with several decades of historical data (Baynes et al. 2007; Turner et al. 2007a;
Turner et al. 2007b) that are used to calibrate the model for simulation over the next 50 to 100 years.
This provides confidence in the simulation due to the wide range of data inputs, the multiple “cause and
effect” chains influencing output variables, and the fact that independently sourced data corresponding to
output variables (e.g. storage levels and energy used in the water sector) are simultaneously reproduced.
It also means that all variables have historical data which provide context for understanding past changes
and the foundation for creating meaningful scenarios.

Water-Energy Futures for Melbourne                                                         Page 7
3. SCENARIO DESCRIPTIONS
3.1 Scenario Overview
Six scenarios were developed to explore the impact of potential policy choices (Table 1). The key
objective was to investigate a set of factors that influence the water system and its interaction with the
energy system. The scenarios were created to examine the implications of potential and plausible options.
Therefore, driving factors were set in different ways according to the scenarios – rather than, for
example, all changed by the same percentage. Consequently, judgements made about the calculated
outcomes of the scenarios, or comparisons between them, should take into account the specific
differences between various settings, such as the degree of change in urban form compared with that in
recycling, for example. Each scenario was created from a combination of changes to urban form, water
end-use and water services (see Table 1), with the combinations designed to facilitate broad comparisons
(see Table 2).
There are two main scenario sets. Scenario Set 1 explores a shift away from urban sprawl to higher
density development. The Scenario Set 2 models a future population which continues to be
accommodated in low density housing that perpetuates Melbourne’s urban sprawl.
Variations within sub-scenarios focus on changes to end-use demand and water services. End-use
scenarios address a more rapid uptake of water demand management measures and solar HWS or a
baseline approach with minimal additional demand management or uptake of solar hot water beyond the
current mandatory installation of a rainwater tank or solar hot water system on all new dwellings. Water
services scenarios considered include continued use of conventional systems to meet demand (1a, 2a and
2c), or a shift to increased use of rainwater tanks and wastewater recycling (1b) or meeting new demand
through desalination (2b, 2d). The reuse scenarios assumed local (on-site) recycling requiring marginal
additional energy that is typically used, for example, in industry and mining and not treated to high
standards. In effect, these scenarios represent policy levers at three very different levels. Urban form
depicts the potential influence that our choices around future cities could have. In contrast water end-use
and water-services represent the potential influences at household and water strategy or utility levels.
Table 1 Scenario summary
Population Scenario Urban Form Water end-use Water services Sub
set No.
Melbourne 2030 Conventional – Potable water 1a
Increased uptake and
guidelines – Limit to supplied from protected
retrofitting of demand
Victoria in Future 2004 Projections
1 urban sprawl and catchments
management options and
focus on high density Alternative sources- rainwater 1b
solar hot water systems
development tanks and wastewater reuse
Conventional – Potable water 2a
Baseline – no adoption of supplied from protected
demand management or catchments
Urban Sprawl – solar HWS New demand met by 2b
low density housing desalination
2 continues in Conventional – Potable water 2c
Greenfield sites Increased uptake and supplied from protected
without constraint retrofitting of demand catchments
management options and New demand met by 2d
solar hot water systems desalination
Water-Energy Futures for Melbourne Page 83.2 Common Assumptions
All scenarios have the following base assumptions:
• By 2050 Victoria’s population grows to approximately 6.7 million of which 4.9 million live in the
Melbourne statistical division (Victoria in Future2004 population projections).
• There is 2% per capita growth in material and energy consumption.
• The present methods of electricity generation continue into the future.
• A “medium” climate change scenario (Howe et al. 2005; Jones 2005) corresponding to an average
global temperature increase of 1.5oC by 2050, involving decreased rainfall, increased evapo-
transpiration and increased dam evaporation.
• Agricultural water use is initially capped at approximately 2001 levels though ultimately increases in
water use are allowed in response to climate change impacts.
• Residential outdoor water use increases due to climate change impacts (Moran 2005).
• Dam levels are maintained at 2001 levels through a 50/50 combination of diversions from rivers and
inter-region transfers where possible, otherwise solely from river diversions.
3.3 Scenario Descriptions
3.3.1 Scenario Set 1 (Compact Urban Form)
This scenario set sees future urban growth in Melbourne increasingly accommodated within high and
medium density residential dwellings. There is some brownfield development, which sees existing low
density dwellings demolished for higher density redevelopment. The Urban Growth Boundary as defined
in Melbourne 2030 restricts the spread of urban development.
Scenario 1a (water demand management and solar hot water systems, conventional
water supply)
This scenario explores a shift to solar HWS, with 20% of existing dwellings and 80% of new residential
dwellings moving to solar (gas boosted) HWS. Existing dwellings are assumed to move proportionally
from the current energy source mix for HWS, which shows 77.5% of Melbourne households have gas
HWS and 19.1% electric (ABS 2005).
Scenario 1a also explores a number of demand management strategies that have the purpose of reducing
end-use demand from residential dwellings. In this case the demand management strategies explored are
low-flow showerheads and water efficient washing machines. The uptake is consistent with solar HWS
as 80% of new dwellings and 20% of existing dwellings implementing the demand management options.
It is assumed that low-flow showerheads reduce water consumption by 40% over conventional systems
and that water efficient washing machines use 30% less water.
In VRSFF these assumptions were incorporated as assuming low-, medium- and high density residential
development use of water at 413, 354 and 358 L/year/m2 respectively. With demand management
measures in place these were assumed to drop to 379, 325 and 329 L/year/m2 respectively. For more
detail on these assumptions refer to Appendix C.
Water-Energy Futures for Melbourne Page 9This scenario is based on a “Business As Usual” (BAU) approach for potable water supply, with drinking
water sourced from protected catchments remote from the urban area.
Scenario 1b (water demand management and solar hot water systems and alternative
water supplies)
This scenario is consistent with 1a and assumes the same urban growth pattern, shift to solar HWS and
demand management strategies. However, there are the following exceptions in the area of water supply
services where a number of alternatives are explored to augment supply:
20% of wastewater collected at centralised treatment plants is treated and used locally by
industry with minimal energy investment for treatment or pumping.
20% of wastewater generated in heavy industry, such as mining and manufacturing, is treated to
a standard required for non-potable applications with minimal energy investment for treatment or
pumping. The wastewater treatment occurs proximal to where treated wastewater is used for non-
potable applications.
Residential rainwater tanks are used. This option simulates 20% of separate dwellings installing
an onsite rainwater tank that is used for toilet flushing with mains back-up and for minimal
energy cost (i.e. designed to flow gravitationally). Appendix B contains more detailed
information on the assumptions and data used to model the reliability of supply from onsite
rainwater tanks. More recent data suggest that rainwater tank pumps can use substantial energy
per volume of water (Gardner et al. 2006).
Figure 2 shows the spatial extent of Melbourne’s urban area analysed for this project. In the map, darker
shading indicates a higher proportion of land area used for residential dwellings within a growth
boundary for Melbourne 2030. The urban form of Melbourne and extent of different density residential
areas analysed for Scenario Set 1 is in Appendix A.
Figure 2 VRSFF spatial representation of settlement pattern
Water-Energy Futures for Melbourne Page 103.3.2 Scenario Set 2 (Urban Sprawl) This set of scenarios differs from Scenario Set 1 in that it assumes that urban growth in Melbourne continues to occur at the urban fringe with low density dwellings. This pattern of growth results in the continued sprawl of Melbourne’s urban area. This pattern of urban growth is consistent for all of the sub- scenarios. Scenario 2a (no adoption of demand management or solar hot water systems, conventional water supplies) This scenario is very much a passive scenario in that there are no real changes implemented to address potential shortfalls in Melbourne’s water supply. It is BAU for water services and there are no demand management strategies or shift to solar HWS. Scenario 2b (no adoption of demand management or solar hot water systems, desalination for new water demand) This scenario explores the use of desalination plants to meet all new demand. At the time of analysis, desalination has been identified by the Victorian government as a preferred option to augment water supplies. An issue that is consistently raised regarding desalination is the energy required to remove salt from seawater and the resultant greenhouse gas emissions. This analysis assumed 17,753 J/L for the production of water by desalination and negligible energy for provision of water via rainwater tanks (refer to Appendix B). This scenario assumes no limit to low density urban growth and no adoption of end-use demand management strategies. Scenario 2c (water demand management and solar hot water systems and conventional water supplies) The key element of this scenario is the implementation of a number of end-use demand management strategies. In other regards there is very little shift from the current situation with Melbourne’s urban sprawl continuing unchecked and water services supplied as usual. This scenario explores a shift to solar HWS, with 20% of existing dwellings and 80% of new residential dwellings moving to solar (gas boosted) HWS. Existing dwellings are assumed to move proportionally from the current energy source mix for HWS, which shows 77.5% of Melbourne households have gas HWS and 19.1% electric (ABS 2005). Scenario 2c also explores a number of demand management strategies that have the purpose of reducing end-use demand from residential dwellings. In this case the demand management strategies explored are low-flow showerheads and water efficient washing machines. The uptake is consistent with solar HWS as 80% of new dwellings and 20% of existing dwellings implementing the demand management options as clarified in scenario 1a. Scenario 2d (water demand management and solar hot water systems, desalination for new water demand) Scenario 2d incorporates the same elements as scenario 2c in regards to urban form and end-use demand management strategies. The differentiation between the scenarios is water services. In this scenario all new demand is met through desalination plants. Water-Energy Futures for Melbourne Page 11
4. SCENARIO ANALYSIS AND DISCUSSION
This section presents the results of scenarios analysed with the VRSFF model. The results are structured
in thematic sections that focus on comparison of scenarios to elucidate the impacts in different areas.
Table 2 and Table 3 summarise key outputs for each of the scenarios mapped against the key drivers.
Other outputs, such as effects on river flow or water quality are discussed in more detail later. The base
case for comparison purposes is taken as 2001, as this is the starting point for the simulation with years
prior to 2002 populated with historical data.
Table 2 Scenario results (water and energy overview)
Water Melbourne in 2001, (VRSFF Melbourne in 2045,
Water service end-use Urban Base Case) (population = 4.80 million)
options options form population = 3.47 million )
Continued low density development at urban
Energy2 demand for water services (PJ/year)
Energy demand for water services (PJ/year)
Total Melbourne energy3 demand (PJ/year)
Total residential energy demand (PJ/year)
Total residential energy demand (PJ/year)
Demand management and solar HWS
Residential water demand (GL/year)1
Residential water demand (GL/year)
Rainwater tanks & wastewater reuse
Increasing density in selected LGAs
Total Melbourne energy (PJ/year)
Conventional water services
Business as usual
Desalination
Scenario
fringe
1a 380 1.3 260
1b 350 1.3 260
2a 510 1.7 290
2b 330 1.1 95 1100 510 4.8 290 3200
2c 470 1.6 260
2d 470 4.2 260
1
Refer to Table 3 for a breakdown of the water demand and supply, 2Excludes additional new transport (pumping) energy for
desalination or reuse which could be in the order of 0.3 PJ/year by 2045 assuming lifting 150GL water to 200m elevation.
3
Includes energy from coal-fired electricity, gas, and petroleum and is approximately Melbourne’s pro-rata share of total state
energy use on a population basis.
Water-Energy Futures for Melbourne Page 12Table 3 Water supply breakdown
Water Requirement (GL/year) Water Supply Sources (GL/year)
Residential Commercial, Total Conventional Reuse Raintanks Desal Total1
Industrial and Centralised
Scenario
Other water
use1
2001 330 200 530 520 10 1 0 530
1a 375 200 575 555 20 1 0 575
1b 375 200 575 535 30 8 0 575
2a 510 200 710 690 20 2 0 710
2b 510 200 710 510 20 2 176 710
2c 470 200 670 650 20 2 0 670
2d 470 200 670 500 20 2 150 670
1
Non-residential water use was not a focus of this study: 2001 data are cited from public reports (WSAA 2005) and no estimate
of future growth was made, for consistency 200 GL non-residential use has been included in the “Total” but this excludes any
growth in non-residential water use. Rows may not total due to rounding.
The study has demonstrated that by 2045:
• The influence of a compact urban form over a sprawling Melbourne (scenario 1a versus scenario 2c)
could impact water consumption by approximately 100 GL/year.
• Water demand management and solar hot water system installation (scenario 2a versus scenario 2c)
could save directly around 45 GL/year of water (due to water demand management, while solar HWS
could indirectly save around 10 GL/year in reduced water use due to lower electricity generation).
Additionally, the alternative water end-use in scenario 2c results in energy savings of 0.14 PJ/year
for water services as well as about 36 PJ/year in residential energy use due primarily to solar HWS.
Demand management is expected to contribute to reduced energy associated with in-house water
heating; however, it was not able to be separated in this analysis. Note that apart from energy use
associated with the water system, implications of scenarios on Melbourne’s total energy consumption
were not assessed.
• The worst case scenario results if Melbourne’s urban growth and operation progresses without
efforts to conserve energy, water or land. For example, scenario 2a results in residential water use in
2045 increasing by about 50% relative to 2001. This is mostly due to population growth (about 95%
of the effect) while the remainder is due to household outdoor watering increasing in response to
medium level climate change. Similarly, residential energy use increases by 200% over the same
period.
• Desalination (scenarios 2b & 2d) results in approximately tripling the current energy used for water
services to a total of around 4.5 PJ/year. However when viewed in context of total energy use for
Melbourne this growth is marginal. The relatively large amount of energy used for residential
purposes including water heating suggests that water conservation strategies which address end-use
Water-Energy Futures for Melbourne Page 13of water will have more chance of significantly influencing total urban energy use than focussing on
water strategy options alone.
• Rainwater tanks and wastewater reuse for low quality local applications (scenario 1b versus 1a) in a
compact urban form could yield a small (~1%) benefit on river flow; however, the energy influence
was not able to be separated in this study. Treatment to higher levels and significant transport would
require substantial additional energy investments; however, this would be expected to be less energy
than desalination as treatment of wastewater to a standard suitable for non-consumptive urban uses
requires approximately half the treatment energy of desalination. Similarly, some reuse options may
offset energy needs for pumping treated wastewater (e.g. from Melbourne’s Eastern Treatment to
Boags’ Rocks) or to irrigation sites, and some may not.
These results are further explained in the more detailed analysis that follows. The results highlight the
role that policy levers in the areas of water services, residential dwelling mix and urban form have on
shaping water and energy futures generally. The analysis is not intended to rank or judge any approach
because the settings were chosen for creating plausible scenarios only. This means that driving forces of
the water system performance cannot be directly compared; however, other scenario settings could be
made to provide appropriate consistency to aid comparison, for example, a common volume of water
supplied by the various means.
In the subsequent graphical outputs the black lines (to 2001) relate to historical data that are either
observed or calibrated in the VRSFF model, while the coloured lines track the projected future pathway
under different scenario assumptions. The scenarios have been modelled out to the year 2045.
4.1 Water Use, Energy Use and Overview of Impacts
Figure 3 compares the total residential water demand across all scenarios. This shows scenarios with a
compact urban form (1a & 1b) have the lowest overall water demand. Scenarios simulating a
continuation of low density urban sprawl and no demand management (2a & 2b) have relatively high
levels of end-use demand. This figure also demonstrates that urban form has a greater impact on reducing
demand than end-use demand management strategies alone. The scenarios incorporating enhanced end-
use demand management, but no change in urban form (2c & 2d) show a relative reduction in residential
demand of approximately 50 GL while scenarios with compact urban form and demand management
strategies (1a & 1b) have reduced demand by approximately 150 GL (compared with 2a & 2b).
The influence of urban form in these scenarios is predominantly associated with reduced outdoor
watering due to the loss of backyards through infill and multi-storey dwellings. Substantial high-rise
development (significantly lower per capita land-footprint than for separate dwellings) was required to
accommodate population growth within the Melbourne 2030 urban growth boundary. An additional
factor in the impact of urban form is the slightly lower water intensity (per unit floor area) of high-rise
residential dwellings.
Water-Energy Futures for Melbourne Page 14You can also read