Copper is the new oil - Green Metals - Hot Chili Limited
←
→
Page content transcription
If your browser does not render page correctly, please read the page content below
13 April 2021 | 10:28PM BST

                                                           Green Metals

                                                           Copper is the new oil

                                                           No decarbonisation without copper. After a year of the global pandemic, with its         Nicholas Snowdon
                                                                                                                                                    +44(20)7774-5436 |
                                                           supply chain disruptions, race for PPE, testing kits and vaccines, the critical          nicholas.snowdon@gs.com
                                                                                                                                                    Goldman Sachs International
                                                           importance of securing sufficient raw materials in combating society’s problems has
                                                                                                                                                    Daniel Sharp
                                                           never been more in focus. This importance extends to the next greatest challenge of      +44(20)7774-1875 |
                                                                                                                                                    daniel.sharp@gs.com
                                                           our time: climate change. The critical role copper will play in achieving the Paris      Goldman Sachs International

                                                           climate goals cannot be understated. Without serious advancements in carbon              Jeffrey Currie
                                                                                                                                                    +44(20)7552-7410 |
For the exclusive use of TONY.GIARDINI@TRILOGYMETALS.COM

                                                           capture and storage technology in the coming years, the entire path to net zero          jeffrey.currie@gs.com
                                                                                                                                                    Goldman Sachs International
                                                           emissions will have to come from abatement - electrification and renewable energy.
                                                           As the most cost-effective conductive material, copper sits at the heart of capturing,
                                                           storing and transporting these new sources of energy. In fact, discussions of peak oil
                                                           demand overlook the fact that without a surge in the use of copper and other key
                                                           metals, the substitution of renewables for oil will not happen. Though much ink has
                                                           been spilled discussing the stranding of hydrocarbon assets, in our view there has
                                                           been insufficient focus on securing the resources required to build new, sustainable,
                                                           energy infrastructure. As we have long argued, moving the global economy toward
                                                           net zero emissions remains a core driver of the structural bull market in commodities
                                                           demand, in which green metals – copper in particular – are critical.

                                                           The green transition will support a surge in copper demand. At the core of
                                                           copper’s carbonomics is the need for the world to shift away from a production

                                                                                                                                                                                    cad17838227545df9bd8aca261090f3b
                                                           system based on the chemical energy of hydrocarbons (oil and gas), to one based on
                                                           a range of sustainable sources – electromagnetic (solar), kinetic (wind) and
                                                           geothermal. Copper has the necessary physical properties to transform and transmit
                                                           these sources of energy to their useful final state, such as moving a vehicle or
                                                           heating a home. Leveraging our equity analysts’ carbonomics analysis across EVs,
                                                           wind, solar, and battery technology, we quantify this demand in a bottom-up model,
                                                           estimating that by 2030, copper demand from the transition will grow nearly 600%
                                                           to 5.4Mt in our base case and 900% to 8.7Mt in the case of hyper adoption of green
                                                           technologies. We estimate that by-mid decade this growth in green demand alone
                                                           will match, and then quickly surpass, the incremental demand China generated
                                                           during the 2000s. Ripple effects into non-green channels mean the 2020s are
                                                           expected to be the strongest phase of volume growth in global copper demand in
                                                           history.

                                                           The copper market is unprepared for this critical role. Crucially, the copper

                                                           Investors should consider this report as only a single factor in making their investment decision. For Reg AC
                                                           certification and other important disclosures, see the Disclosure Appendix, or go to
                                                           www.gs.com/research/hedge.html.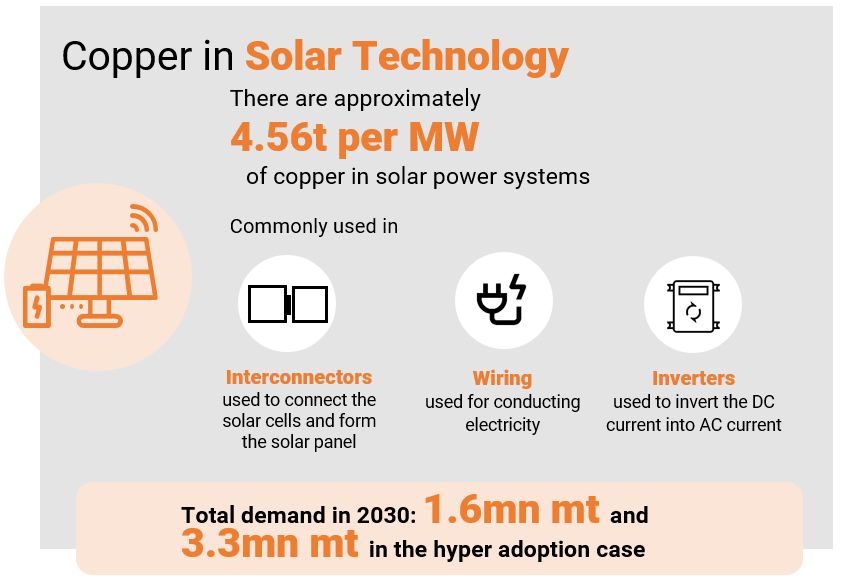
Goldman Sachs                                                                                  Green Metals

                                                                           market as it currently stands is not prepared for this demand environment. The market is
                                                                           already tight as pandemic stimulus (particularly in China) have supported a resurgence in
                                                                           demand, set against stagnant supply conditions. Moreover, a decade of poor returns
                                                                           and ESG concerns have curtailed investment in future supply growth, bringing the
                                                                           market the closest it’s ever been to peak supply. Indeed, we see the copper market
                                                                           sleepwalking to a classic case of the “Revenge of the old economy”, just as oil did
                                                                           during the 2000s commodity boom. The mining sector remains wary of a pivot towards
                                                                           growth after the price collapse in the mid-2010s severely punished any front-footed
                                                                           producers. Even as copper prices have rallied 80% over the last 12 months, there have
                                                                           been no material greenfield project approvals. Coronavirus has only compounded this
                                                                           dynamic, creating enough uncertainty to freeze companies’ investment decisions. This
                                                                           combination of surging demand and sticky supply has reinforced current deficit
                                                                           conditions and foreshadows large open-ended deficits from mid-decade. We now
                                                                           estimate a long-term supply gap of 8.2Mt by 2030, twice the size of the gap that
                                                                           triggered the bull market in copper in the early 2000s.
For the exclusive use of TONY.GIARDINI@TRILOGYMETALS.COM

                                                                           Sticky supply threatens to deplete copper stocks by mid-decade. Copper is a
                                                                           predominantly long-cycle commodity – it takes 2-3 years to extend an existing mine and
                                                                           as long as 8 years to establish a new greenfield project. This long lead time for the
                                                                           majority of copper supply, combined with the mining sector’s resistance towards new
                                                                           capex, leaves the copper market running out of runway to secure the necessary supply
                                                                           to meet demand in the second half of the decade. Perversely, this means copper prices
                                                                           must rise now to incentivise enough supply to solve prospective deficits, or risk chronic
                                                                           scarcity pricing in the second half of the decade. Copper is so integral to the green
                                                                           transition – a global effort underpinned by government support – that the supply
                                                                           requirements necessitate a spike in copper prices. History has seen many examples of
                                                                           commodities solving similar mid-term depletion risks with extreme nearer-dated price
                                                                           spikes, not least US natural gas and nickel in the early 2000s where projections for
                                                                           severe shortages were countered by significant increases in price, and followed by the

                                                                                                                                                                         cad17838227545df9bd8aca261090f3b
                                                                           required supply innovation. Copper, lacking any obvious productivity innovations on the
                                                                           horizon, needs higher prices to stimulate a record set of established short cycle (scrap,
                                                                           demand substitution) and long cycle (mine investment) responses.

                                                                           Copper on a necessary path to $15,000. To capture the precise dynamics of this
                                                                           process we construct long-run models of scrap supply and substitution, as well as
                                                                           extend our balance out to 2030. The immediate conclusion is that current copper prices
                                                                           ($9,000/t) are too low to prevent a near-term risk of inventory depletion, while our
                                                                           current long-term copper ($8,200/t) is not high enough to incentivise enough greenfield
                                                                           projects to solve the long-term gap. If copper remains at $9,000/t through the next two
                                                                           years, then we estimate the resultant deficits would generate a depletion of market
                                                                           inventories by early 2023. Based on our scrap and demand modelling, we believe that
                                                                           the most probable path for copper price from here – that both avoids depletion risk and
                                                                           as well as a sharp surplus swing – is to trend into the mid-teens by mid-decade. We
                                                                           now project copper to average $9,675/t in 2021, $11,875/t in 2022, $12,000/t in 2023
                                                                           before a material step-up to $14,000/t in 2024 and $15,000/t in 2025. In this context, we
                                                                           upgrade our 12-month target to $11,000/t.

                                                           13 April 2021                                                                                             2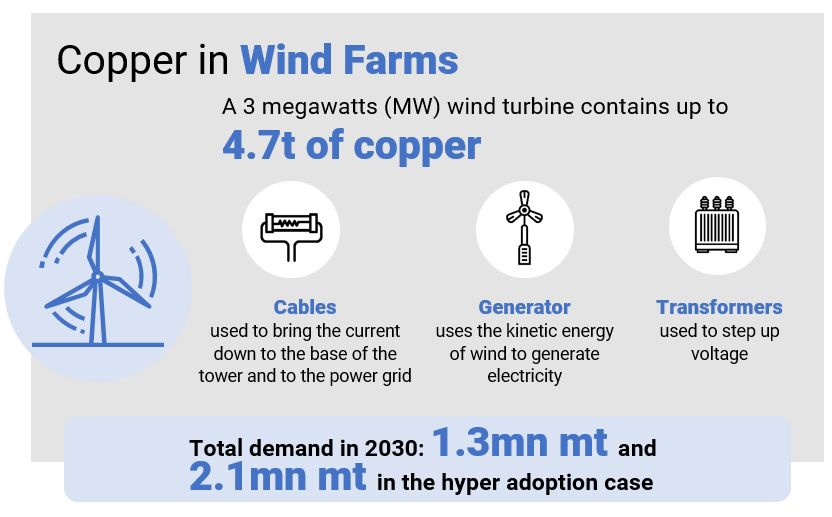
Goldman Sachs                                                                                                                                                     Green Metals

                                                                                                     The metal research team would like to thank Annalisa Schiavon, an intern on the Metals
                                                                                                     team, for her contribution to this report.

                                                           Exhibit 1: Copper prices will be forced materially higher in coming              Exhibit 2: ...to prevent the depletion of copper stocks as green
                                                           years...                                                                         demand surge coincides with a current peak in mine supply
                                                           Historical and forecasted copper price at $2021                                  Historical and forecasted copper global visible stocks

                                                            15000    $/t              Copper Price at $2021               Old GS Forecast   Global visible             Historical                               GS base case (15K by 2025)
                                                                                      New GS Forecast                                        stocks (kt)               Prices stay at 9K                        Prices at 11K
                                                                                                                                             1,600
                                                            13000
                                                                                                                                             1,200
                                                            11000
                                                                                                                                               800

                                                             9000                                                                              400

                                                                                                                                                 0
                                                             7000
                                                                                                                                              -400                                                               Stocks
                                                             5000                                                                                                                                                depletion
                                                                                                                                              -800                                                               starting from
                                                                                                                                                                                                                 Sep 2022
                                                             3000                                                                            -1,200

                                                                                                                                             -1,600
                                                             1000
                                                                                                                                                   2003      2005   2007   2009    2011    2013   2015   2017    2019    2021    2023   2025
                                                                 1960 1965 1970 1975 1980 1985 1990 1995 2000 2005 2010 2015 2020 2025
For the exclusive use of TONY.GIARDINI@TRILOGYMETALS.COM

                                                           Source: World Bank, Goldman Sachs Global Investment Research                     Source: Wind, Woodmac, Goldman Sachs Global Investment Research

                                                                                                                                                                                                                                                 cad17838227545df9bd8aca261090f3b

                                                           13 April 2021                                                                                                                                                                     3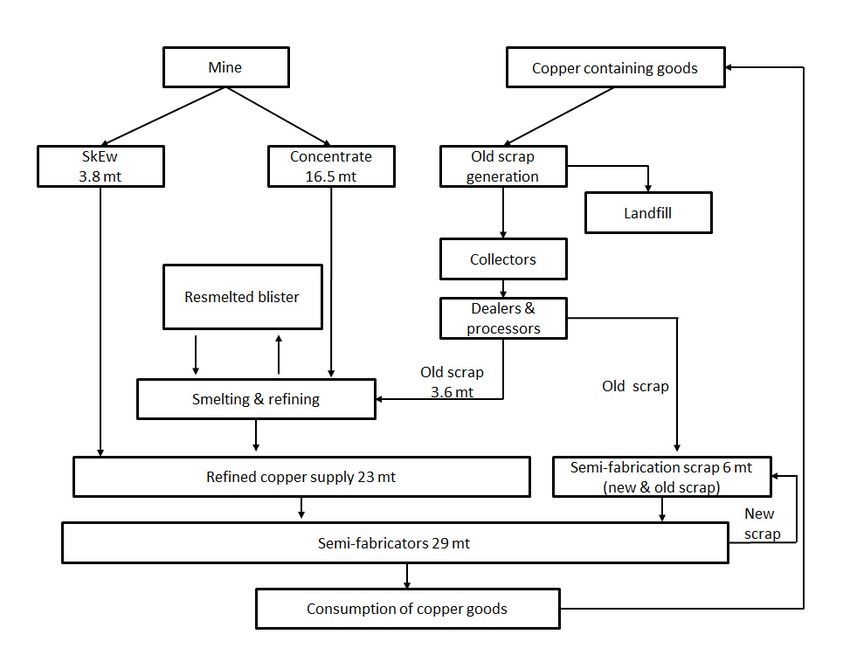
Goldman Sachs Green Metals
Copper’s path to $15,000 in 6 charts
Exhibit 3: Copper market starts the 2020s in an already tight state on Exhibit 4: Acceleration in green electrification trends is set to drive
post-pandemic demand resurgence set against a stagnant and strongest decade in copper demand growth post-2000
disrupted supply dynamic Copper demand, per year, from green sectors
Stocks to consumption ratio
5 Stocks as number of weeks of 6000 kmt Total Charging Points Projection
consumption (total visible) Demand
Total EV Demand
5000
4 Total Wind Demand
Total Solar Demand
4000
3
End of End of
2010 3000
2015
2
March 2021
End of 2000
1 2021
End of
2022
1000
0
0 2000 4000 6000 8000 10000 12000 14000
0
For the exclusive use of TONY.GIARDINI@TRILOGYMETALS.COM
Copper price in $2021 ($/t) 2011 2013 2015 2017 2019 2021E 2023E 2025E 2027E 2029E
Source: Woodmac, Wind, Goldman Sachs Global Investment Research Source: Goldman Sachs Global Investment Research
Exhibit 5: Mine supply will fall well below demand after 2024... Exhibit 6: ...driving largest long-term supply gap on record
Copper mine supply growth vs copper demand growth, yoy % LT supply gap and copper price
% Copper mine supply growth (3yr ma) Copper demand growth (3yr ma) kt 10 year supply gap Copper price lagged 1 year (RHS) $/t
6
8500 10000
5
7500 9000
4
3 8000
6500
2
7000
1 5500
6000
0
4500
-1 5000
-2 3500 4000
-3
2000
2001
2002
2003
2004
2005
2006
2007
2008
2009
2010
2011
2012
2013
2014
2015
2016
2017
2018
2019
2020
2021
2022
2023
2024
2025
2026
2027
2028
2029
2030
2500 3000
cad17838227545df9bd8aca261090f3b
2004 2006 2008 2010 2012 2014 2016 2018 2020
Source: Woodmac, Goldman Sachs Global Investment Research Source: Woodmac, Goldman Sachs Global Investment Research
Exhibit 7: With these trends at play, if copper prices stay at current Exhibit 8: We believe a long-term copper price near $10,000/t is
levels, depletion risk is real by 2023; a sustained rally is needed needed to incentivise necessary volume of probable projects to
now to mitigate that risk into mid-decade solve deficits towards end of 2020s
Global copper balance Risk-adjusted PIP curves
kt Global balance at 9k Global balance at GS forecast
400 $/t Copper price
15000 12% IRR incentive price
200 15% IRR incentive price
12000
0
9000
-200
6000
-400
-600 3000
-800 0
-1000 -3000
-1200 -6000
-1400
-9000
-1600 3 569 1031 2162 2825 3669 4582 5210 6513 7349 7858
Cumulative Paid Production (kt)
2020 2021E 2022E 2023E 2024E 2025E
Source: Woodmac, Goldman Sachs Global Investment Research Source: Woodmac, Goldman Sachs Global Investment Research
13 April 2021 4Goldman Sachs Green Metals
Quantifying the green copper demand revolution
Metals are at the heart of the new commodity super cycle, and green demand is at the
heart of the metals price rally. As we detail in Box 1 below for copper, the physical
properties of transition metals (aluminum, copper, lithium, cobalt) make them critical to
transforming the basis of our energy system away from hydrocarbons toward
sustainable sources. However, the precise implications of this transition to net zero
emissions has not yet been explicitly mapped into metal’s demand more broadly. In the
first of the Green Demand series, we conduct a bottom-up analysis of the demand
from green channels, using our sector expert projections for each copper-containing
green technology as well as institutional estimates for the precise copper intensity of
each technology, and how this intensity will likely change over time.
This analysis has produced a green demand balance (see Exhibit 25), which is then
incorporated into our broader balance. It is important to note that this estimate forms a
For the exclusive use of TONY.GIARDINI@TRILOGYMETALS.COM
first-pass for estimating green demand, as both the rate of adoption of new
technologies will likely be revised in coming years as the transition accelerates. Our
analysis shows that in aggregate ‘green’ copper amounted to 1Mt in 2020, just 3% of
total global copper. However, our modeling suggests under our base case, a rapid
acceleration in green demand growth from here rising to 2.6Mt by 2025 (9% total global
demand) and then 5.4Mt in 2030 (16% of total global demand). We estimate that green
demand will grow at average annual growth rate of 20% y/y in the 2020s, generating
just under 500kt per year of growth in demand volumes.
Exhibit 9: We project a surge in green-related copper demand from Exhibit 10: Green demand will rise from just 3% of total global
just under 1Mt in 2020 to 5.4Mt in 2030 demand in 2020 to close to 16% by 2030
Copper demand, per year, by green sector Green copper demand as percentage of total copper demand
6000 kmt Total Charging Points Projection 18%
Demand Green demand as
Total EV Demand percentage of total
16%
copper demand
cad17838227545df9bd8aca261090f3b
5000
Total Wind Demand
14%
Total Solar Demand
4000
12%
3000 10%
8%
2000
6%
1000
4%
0 2%
2011 2013 2015 2017 2019 2021E 2023E 2025E 2027E 2029E 2019 2020 2021E 2022E 2023E 2024E 2025E 2026E 2027E 2028E 2029E 2030E
Source: IEA, IRENA, ICA, CDA, Goldman Sachs Global Investment Research Source: Woodmac, Goldman Sachs Global Investment Research
13 April 2021 5Goldman Sachs Green Metals
Why Copper Is Key for Electrification
In order to understand the central role copper will play in the coming green revolution, it is important to
understand how its unique chemical structure gives it a range of useful properties. Copper is a transition
metal with a single valence election, giving it the following three properties that make copper the first-best
affordable material for use in cables, batteries, transistors and inverters – all key technologies on the path
to net zero.
1. Ductility. Copper is a ductile metal – that is, it can be rolled into sheets and pulled into wires without
breaking. When solid, copper is an array of positive ions surrounded by a sea of mobile valence
electrons. When a force is applied to the metal, the free-flowing electrons can slip in between the
stationary cations and prevent them from coming in contact, shattering the metal. Other elements with
a single valence electron – such as silver and gold – have similar properties, but are not available in
industrial quantities.
For the exclusive use of TONY.GIARDINI@TRILOGYMETALS.COM
2. Electrical conductivity. The delocalised electrons in copper are free to move throughout the ion array
in 3-dimensions and, crucially, can cross grain boundaries, allowing charge to flow across the metal
easily. Moreover, the transfer of electromagnetic energy is strongest when there is little resistance. The
most effective conductors of electricity are metals that have a single valence electron that is free to
move and causes a strong repelling reaction in other electrons. This is the case in the most conductive
metals, such as silver, gold, and copper.
3. Thermal conductivity. Heat energy is picked up by the electrons as additional kinetic energy is passed
along the material. As a result, the best conductors have free electrons that can carry this energy along
their length. The energy is transferred throughout the rest of the metal by the moving electrons. Apart
from silver, copper is the best.
4. Low reactivity. Copper is low in the reactivity series, with minimal corrosion of the metal due to a
natural protective coating that forms during oxidisation – similar to stainless steel. However, stainless
steel is substantially less ductile and its thermal conductivity is 30 times worse than that of copper.
cad17838227545df9bd8aca261090f3b
13 April 2021 6Goldman Sachs Green Metals
How Will Power the Next Generation of Clean Tech
ROTOR BLADES
WIND TURBINES
GEARBOX
Copper demand from wind energy
NACELLE will account for 20% of green
GENERATOR demand, with copper intensity
expected to grow as offshore
projects that require twice as
CABLES much copper become more
prevalent.
TOWER
For the exclusive use of TONY.GIARDINI@TRILOGYMETALS.COM
ELECTRIC VEHICLES
CHARGING STATION
Electric vehicles have
CABLES
more than 5 times the
copper of ICE vehicles
and by the end of decade BATTERY
they will account for MOTOR
around 40% of the green
copper demand.
FRAME
SOLAR PANELS
PANEL SURFACE
Copper is key for efficiency
cad17838227545df9bd8aca261090f3b
and performance of PV
panels and thanks to their
CELL fast declining cost and
deployment they will be the
INTERCONNECTORS second driver of green
demand after EVs.
CURRENT COLLECTOR
ENERGY STORAGE ANODE (graphite)
In EVs copper is mostly used for SEPARATOR
batteries and in the future the CATHODE
development of grid energy (different formation) Li+
storage systems will represent ELECTROLYTE
a key upside risk for green (lithium salts)
copper demand. CURRENT COLLECTOR
Source: World Bank, ICA, Copper Alliance, Goldman Sachs Global Investment Research
13 April 2021 7Goldman Sachs Green Metals
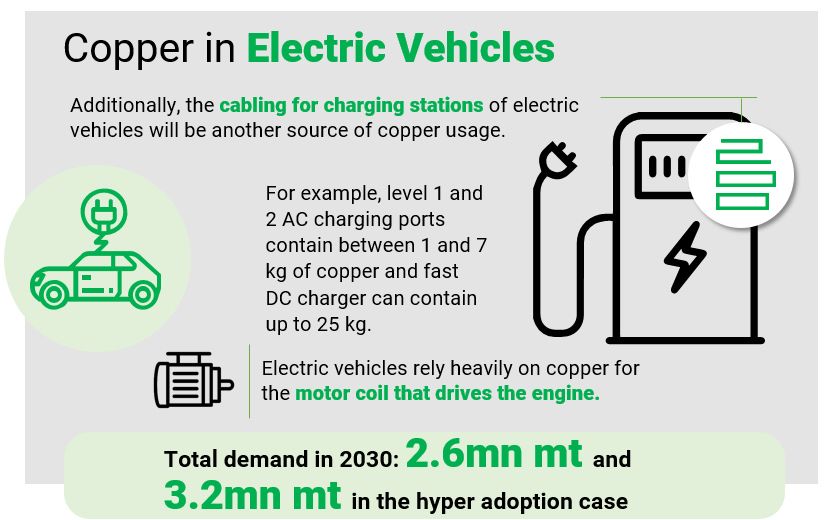
Electric Vehicles - Surge in adoption to support most significant green boost to copper
demand
Of the three drivers of green copper demand in the coming decade, electric vehicles
(EVs) will be the item most salient to households, and the source of demand that is
most likely to face volatile revisions to adoption rates, based on consumer demand
trends rather than long-run utility scale investments in wind and solar. We see copper
demand from EVs accelerating throughout this decade, with GS equity analysts
projecting this year 5.1mn EVs to be sold (vs a stock of more than 1.2bn vehicles), rising
to peak at 31.51mn EVs a year in 2030 (see Exhibit 13). To forecast the annual
installations of charging units we map their growth to GS EVs sales forecast, implying
that 30mn charging units will be installed in 2030. We forecast EV-related demand to
amount to 2.4Mt of copper by 2030 (vs. 210kt in 2020) with an additional 153kt of
copper demand coming from charging stations (vs 14kt in 2020). We expect this
demand to grow at a rate of 31% a year for the remainder of the decade.
For the exclusive use of TONY.GIARDINI@TRILOGYMETALS.COM
cad17838227545df9bd8aca261090f3b
Source: Copper Alliance, Goldman Sachs Global Investment Research
A standard EV’s copper content (on average 60-83 kg per car) is four times larger than
that of an ICE (on average 15-20 kg per car), with total wiring length of c.1km. Copper is
found inside EV batteries, motor coils, inverters and wiring. The copper content inside
Lithium-ion batteries (the most used for EVs) ranges between 0.5 kg/kWh for a NCA
battery type to 0.7 kg/kWh for a NMC 811 type. The remaining vehicle components,
mainly the electric motor and the wiring system that carries the current to all the
electronic parts of the car, account for around 40 kg/unit of copper. In addition, copper is
a crucial component for EV infrastructure, required for the cabling of charging poles. The
metal intensity ranges from 2 kg for an AC level 1 charger, 7 kg for an AC level 2 charger
to 25 kg for a DC fast charger. In Exhibit 12, we decompose copper demand from EVs
13 April 2021 8Goldman Sachs Green Metals
by technology type, based on our auto analyst’s sector forecasts and by-technology
intensity table.
This acceleration is being driven by increasingly supportive regulation in both Europe and
China. In fact, our auto analysts now calculate that the cost economics of a BEV on a
like-for-like basis are €5-6k worse per unit than a comparable ICE vehicle. While the
outlook is not as sharp in the US, President Biden’s recent commitment to transition the
federal vehicle fleet to EVs signals a shift in US policy toward the sector, with the Biden
administration also proposing a large EV charging infrastructure investment and
reinstating EV tax credits in their latest $2.2trn infrastructure package.
Exhibit 11: Electric vehicles contain substantially more copper than Exhibit 12: We see copper demand from EVs growing to c.2.4Mt by
traditional ICEs the end of the decade
Copper content by type of vehicle (kg) Copper demand by EVs components
Battery Inverter Elctric Motor HV Wire
15 Other LV Wire Charging Ports Total
For the exclusive use of TONY.GIARDINI@TRILOGYMETALS.COM
3,000
Projection
39
ICE vehicle 60 2,500
HEV
2,000
PHEV 83
BEV 370 1,500
Hybrid electric bus
89
Battery electric bus 1,000
500
0
2020 2022E 2024E 2026E 2028E 2030E
Source: ICA, Goldman Sachs Global Investment Research Source: ICA, IEA, Goldman Sachs Global Investment Research
Exhibit 13: Charging point infrastructure will lag the adoption of Exhibit 14: While some EV stations will be government provided,
EVs the majority will remain private investments
Annual EVs sales and charging points installations (mn units) Charging points by source
mn units EV sales Charging points Private Public Total
mn
cad17838227545df9bd8aca261090f3b
35 180
Projection
30 160
140
25
120
20 100
15 80
60
10
40
5
20
- 0
2020E 2021E 2022E 2023E 2024E 2025E 2026E 2027E 2028E 2029E 2030E 2019 2021E 2023E 2025E 2027E 2029E
Source: IEA, Goldman Sachs Global Investment Research Source: IEA, Goldman Sachs Global Investment Research
Solar - Sharp acceleration from mid decade, 400kt in 2021 to 1.6Mt by 2030
Of all the core copper-containing green technologies, solar remains the one with the
largest potential upside, as the ultimate power distribution method leads to a wide
range of copper intensity across different production methods (see Exhibit 15). Taking a
weighted average of different technologies, solar contains around 2.4kt of copper per
GW of capacity with 66% of this demand coming from China, 20% from Europe and
13 April 2021 9Goldman Sachs Green Metals
17% from the US. Over the next decade, we see solar demand rising to 1.6Mt at a rate
of c.15% a year. Epitomising the transfer of power from oil to renewables, the Middle
East will account for a large share of this growth. Copper is an essential element in solar
PV technologies owing to its high conductivity and cost, giving it a higher conductivity
per $/t than silver or gold, critical to maximising the conversion ratio of photovolatic to
electrical energy. Moreover, its durability is crucial for a technology that has an average
life cycle of 25 to 30 years. Higher copper-intensity, “thin-film” technologies like CIGS
have achieved some market penetration to date (c.15% of total MW installed), and have
the potential to increase future market share if production inefficiencies are reduced in
coming years.
Exhibit 15: Solar intensities by source and project type Exhibit 16: Copper solar demand to reach 1.6Mt in 2030
Copper intensity of use in sola PV panels Copper demand coming from solar PV systems by country
1,800 kt Row China US EU
1,600
For the exclusive use of TONY.GIARDINI@TRILOGYMETALS.COM
1,400
1,200
1,000
800
600
400
200
0
2020 2021E 2022E 2023E 2024E 2025E 2026E 2027E 2028E 2029E 2030E
Source: ICA, European Commission, World Bank, CDA, Goldman Sachs Global Investment Source: IRENA, ICA, Goldman Sachs Global Investment Research
Research
cad17838227545df9bd8aca261090f3b
13 April 2021 10Goldman Sachs Green Metals
For the exclusive use of TONY.GIARDINI@TRILOGYMETALS.COM
Source: Copper Alliance, Goldman Sachs Global Investment Research
Outside the solar panel, copper is used extensively in all the other elements that
contribute to the functioning of the system and that are generally called balance of
system (BOS). The current produced by the solar PV panels is transported with cables to
the inverter (in distributed scale installation) or transported to a transformer that will
step up the voltage for the transmission to the grid (in a utility scale installation). Our
cad17838227545df9bd8aca261090f3b
sector experts see total solar capacity reaching 370 GW in 2035 with 60% of that
coming from utility scale installation and 40% from DG.
Exhibit 17: We now expect wind and solar capacity additions in the US of over 280 GWs by 2030
Revised GS renewable forecast, 2018YE-2030
700 Offshore Wind
Distributed Generation 29
600 113
Utility-Scale Solar Solar
141
500 Onshore Wind 29
28
43
GWs
400 33
64 229 229
300 69
78
200 28
19 23 33
44 241 241
100 14
23 29 33
82 84 90 105
0
2016 2017 2018 2019 RPS States Corporate PPAs Non-RPS States Cumulative New Distributed Total 2035
Utility-Scale Generation Renewables
Installations
Source: DSIRE, SNL, Goldman Sachs Global Investment Research
13 April 2021 11Goldman Sachs Green Metals
Wind - Copper demand from turbines set to triple from 400kty currently to 1.3Mt by 2030
Energy is the largest emitter of carbon globally, accounting for 73% of emissions in
2017, and with the electrification of transport and the growing computing demands of AI,
energy consumption globally is expected to rise 26% over the next 30 years, requiring a
growing renewable energy capacity that will drive wind farm growth in the coming
decade. Indeed, we see wind-related copper demand reaching 1.3Mt a year by 2030,
growing at a rate of 12.4% annually. The end use demand for copper varies widely
across all turbine models, ranging from 8t to 48t per tower. Wind turbines demand
copper primarily for generators, power cable conductors and earthing cables. These
cables are on average 15cm thick and weigh around 60-80kg/m. Copper intensity
depends on two factors, the turbine generator (geared/direct drive) and the type of
installation (on shore/offshore), with copper use per GW ranging from 4kt/GW in
onshore installations up to 13.5kt/GW for offshore. The main use of copper in offshore
windfarms is for the ultra-high voltage cables used to transport the power back onshore,
leading them to be the largest source of copper demand in wind power (Exhibit 22).
For the exclusive use of TONY.GIARDINI@TRILOGYMETALS.COM
Exhibit 18: Renewable energy will go from 15% of total energy Exhibit 19: ...to 90% in 2050
production in 2019... Energy production by source
Energy production by source
RES RES & Hydrogen
c.15% in 2019 Nuclear c.90% in 2050
Fossil Fuels
RES 4% Gas
13% 4%
16% Oil
H2 2%
2% H2
15%
Gas Current 2050E
22%
Oil RES
34% 75%
Nuclear
13%
cad17838227545df9bd8aca261090f3b
Source: Goldman Sachs Global Investment Research Source: Goldman Sachs Global Investment Research
Exhibit 20: We expect China’s power generation to triple by 2060, Exhibit 21: c.37% of US power generation is carbon free
driven by solar, wind, nuclear and hydro power generation 2019 US power generation mix (TWh)
China electricity generation (thousand TWh)
25 GS Projections Solar, 2.5% Other…
China power generation
Hydro, 6.2%
20
(thousand TWh)
15 Wind, 6.9% Natural Gas,
38.6%
10
US power generation
5 (2019)
Nuclear, 19.4%
4,401 TWh
0
2000
2002
2004
2006
2008
2010
2012
2014
2016
2018
2020
2022
2024
2026
2028
2030
2032
2034
2036
2038
2040
2042
2044
2046
2048
2050
2052
2054
2056
2058
2060
Coal Natural gas Oil Other, 0.3%
Nuclear Hydro Solar
Onshore wind Offshore wind Other (biomass, geothermal)
Oil, 0.5% Coal, 23.9%
H2CGGT Coal +CCUS
Source: BP Statistical Review, Goldman Sachs Global Investment Research Source: BP, Goldman Sachs Global Investment Research
13 April 2021 12Goldman Sachs Green Metals
As turbine distance from shore is set to grow – particularly in Europe, in the coming
decade, we see near 400kt additional copper demand from offshore wind farm cables in
the EU alone by 2030. The distance these cables need to travel requires higher density
copper rather than aluminum, which is traditionally used in overhead grid networks due
to its lightweight nature. Support for these offshore projects is only set to grow, with
the European Commission publishing EU Strategy on Offshore Renewable Energy, with
a 2030 objective of 60 GW of installed offshore capacity. Moreover, in December 2020
the US Congress extended credits on wind (and solar) power with the Consolidated
Appropriations Act, while China’s 2060 goal translates to a $16trn investment over the
next 40 years. Of the total investment, $2trn will go into onshore installations and
$0.7trn for offshore projects.
Exhibit 22: Wind installations out to 2035 Exhibit 23: Sharp increase expected in EU wind generation
GW capacity over the next decade
Onshore >4x 91
GW Offshore
For the exclusive use of TONY.GIARDINI@TRILOGYMETALS.COM
100
19
90
80
70 23
60
39
50 2x
7
40
22 12
30 50
2
20 10
20
10 11
0 2011-20E 2021E-30E 2031E-50E
2021E
2024E
2027E
2030E
2019A
2020E
2022E
2023E
2025E
2026E
2028E
2029E
2031E
2032E
2033E
2034E
2035E
Solar Onshore Offshore
Source: Goldman Sachs Global Investment Research Source: Goldman Sachs Global Investment Research
cad17838227545df9bd8aca261090f3b
Source: Copper Alliance, Goldman Sachs Global Investment Research
13 April 2021 13Goldman Sachs Green Metals
Even though the absolute consumption of copper is set to increase with the size of the
turbines, the relative content per MW generated will decrease as designs will be more
resource efficient. According to JRC this decrease will be of only 5% by assuming an
increase turbine capacity (for off shore wind turbines) of 1.5MW by 2030. However
offshore wind farms may become more copper intensive if floating foundation become a
viable solution. This type of foundation could be deployed for wind farms at greater
distances from the shore than the ones with fixed foundations, therefore the length of
transmission cables (usually made with copper) would be greater.
Exhibit 24: China’s net zero path implies a $16trn clean tech infrastructure investment opportunity by 2060
Cumulative investment opportunity across sectors for China net zero by 2060 (US$ tn)
18.0
Cumulative investments to net zero China by 2060
0.5 16.0
16.0 0.8
14.0 1.4
For the exclusive use of TONY.GIARDINI@TRILOGYMETALS.COM
12.0 2.7
0.4
0.3
(US$ tn)
1.2
10.0
0.5
8.0
2.1
0.5
6.0
0.9 Hydro & other RES
4.0 0.7 Offshore wind
2.0
Onshore wind
2.0
1.9 Solar
0.0
Renewable Nuclear Power Energy Transport Biofuels Hydrogen Industrial Hydrogen CCUS Natural China
power power networks storage EV + plants processes pipeline sinks net zero
(batteries) FCEV (SMR+ infrastructure 2060
infrastructure electrolyzer) Total…
Source: Company data, Goldman Sachs Global Investment Research
cad17838227545df9bd8aca261090f3b
Assessing the dilution risks to copper in the green demand outlook
Given the relative immaturity of the wind, solar and EV sectors, all remain in phases of
constant improvement to achieve better performances and higher material efficiency.
Although this process will affect copper use, we think that it is unlikely to change the
bigger picture. In wind and solar systems, copper is not a technology-specific material,
rather it is used for the structure that usually is not deeply affected by material efficiency
improvements. In EVs the lower intensity of usage can potentially come from the
substitution of copper with aluminium; however, this comes at a cost of lower energy
efficiency and reliability. The potential, yet moderate, fall of intensity of use in the
examined technologies is counter balanced by the new green copper uses, that are not
modelled but should be taken into account as an upside risk for the future decades as
our analysts see them as key in the path to net zero.
In that context, in e-hydrogen fuel cells, copper is used in alloy with nickel to form the
anode catalyst in solid oxide fuel cell type and then in wires and other conductive parts.
Furthermore, our analysts see an increase of the demand of renewable energy coming
from green hydrogen starting from 2030 as the electrolysis requires a great amount of
renewable energy. Copper will also play a role in batteries for grid storage, another
13 April 2021 14Goldman Sachs Green Metals
important piece that will allow renewable energy sources to be widely used in the
future. Copper is used both inside the battery in the current collector and outside for the
wiring, cabling and switches that connect the renewable energy system to the energy
storage device. Finally, copper is also considered among the key materials for the
carbon capture and storage technologies that, according to our analysts, are
complementary to carbon conservation ones to achieve affordable net zero emissions.
GS Global green copper demand model
Exhibit 25: Quantifying green copper demand by sector and region
('000's tonnes) 2020 2021E 2022E 2023E 2024E 2025E 2026E 2027E 2028E 2029E 2030E
Solar
EU 57.8 56.6 60.9 60.5 60.8 65.7 64.7 65.5 64.7 64.7 65.5
% change 15% -2% 8% -1% 1% 8% -2% 1% -1% 0% 1%
US 53.7 46.6 49.8 35.6 35.6 35.5 35.5 35.5 35.4 35.4 35.4
% change 25% -13% 7% -29% 0% 0% 0% 0% 0% 0% 0%
China 145.3 159.7 185.7 258.4 245.6 278.9 306.8 337.4 371.2 408.3 449.1
% change 60% 10% 16% 39% -5% 14% 10% 10% 10% 10% 10%
Row 121.5 154.5 206.5 315.9 334.9 400.6 480.7 576.8 692.2 830.6 996.8
% change -1% 27% 34% 53% 6% 20% 20% 20% 20% 20% 20%
Total Solar Demand 378 417 503 670 677 781 888 1,015 1,163 1,339 1,547
For the exclusive use of TONY.GIARDINI@TRILOGYMETALS.COM
Wind
EU 89 129 179 129 108 127 141 202 204 204 234
% change 9% 46% 38% -28% -16% 18% 10% 44% 1% 0% 15%
US 42 38 42 66 96 52 52 76 76 76 76
% change 26% -10% 11% 57% 47% -46% 0% 46% 0% 0% 0%
China 184 141 182 202 222 242 265 308 383 459 504
% change 64% -23% 29% 11% 10% 9% 9% 16% 24% 20% 10%
Row 81 103 121 143 168 199 235 278 330 393 467
% change -7% 27% 17% 18% 18% 18% 18% 18% 19% 19% 19%
Total Wind Demand 396 412 523 539 594 620 692 864 993 1,131 1,280
Electric Vehicles
EU 95 174 228 276 330 402 518 627 730 832 944
% change 124% 83% 31% 21% 19% 22% 29% 21% 16% 14% 13%
US 28 63 102 141 203 304 342 381 432 496 560
% change 13% 126% 63% 38% 44% 50% 13% 11% 13% 15% 13%
China 77 116 155 203 253 319 373 429 486 547 608
% change 228% 50% 33% 31% 24% 26% 17% 15% 13% 12% 11%
Row 9 14 26 41 54 73 88 135 178 236 307
% change 31% 54% 77% 58% 33% 34% 22% 53% 32% 32% 30%
Total EV Demand 210 368 511 661 840 1,098 1,322 1,572 1,826 2,110 2,419
Charging Points
EU 3.5 6.1 8.6 11.4 14.8 17.8 24.1 30.8 37.3 42.9 50.1
% change 76% 40% 33% 29% 20% 35% 28% 21% 15% 17%
US 3.1 5.7 6.8 8.9 12.1 16.8 18.5 20.8 24.0 28.6 34.3
% change 83% 19% 32% 36% 38% 11% 12% 15% 19% 20%
China 6.1 10.2 13.0 16.3 19.9 25.7 29.5 34.3 39.7 46.3 54.8
% change 67% 26% 26% 22% 29% 15% 16% 16% 17% 18%
Row 2 3 3 4 5 7 8 10 12 14 14
% change 71% 31% 27% 20% 27% 21% 21% 20% 20% -3%
Total Charging Points Demand 14 25 32 41 52 67 80 96 113 132 153
By Region
EU Renewable Demand 246 366 476 477 513 613 748 926 1,036 1,143 1,293
cad17838227545df9bd8aca261090f3b
US Renewable Demand 127 153 200 251 347 408 448 513 567 636 706
China Renewable Demand 412 427 535 679 740 866 974 1,108 1,280 1,460 1,615
RoW Renewable Demand 214 275 357 503 562 679 812 1,000 1,212 1,473 1,784
Global Copper Demand 998 1,221 1,569 1,911 2,163 2,566 2,982 3,547 4,095 4,712 5,398
% change 39% 22% 28% 22% 13% 19% 16% 19% 15% 15% 15%
Source: ICA, IRENA, IEA, Goldman Sachs Global Investment Research
Green demand driving the tightest forward copper balances in history
Green electrification related demand will have a significant tightening effect on the
global copper balance over the next decade (see Exhibit 51). On our base case green
projections, global copper demand growth will trend at a materially higher rate this
decade than in either of the previous decades. Moreover, we expect the annual average
demand growth volumes from green sources alone to be on a par with that from China
during the 2000s. Set against a current peak in base case mine supply timed for 2024
and open-ended contraction thereafter (given current projects), this steers the copper
market on a clear tightening path through the course of the decade. The copper market
already faces a clear metal deficit in both 2021 and 2022, which we expect to lower the
market exchange stock to consumption ratio to a near record low by H2-22. While we
13 April 2021 15Goldman Sachs Green Metals
project a softening window in metal fundamentals to occur in 2023/24, the current peak
in global mine supply during that period will sow the seeds for the beginning of large
deficits from the second half of 2024 onward. The consequence of these fundamental
trends it that by the end of the decade the long-term supply gap stands at 8.2Mt. This is
the highest long-term supply gap on record and nearly double where the peaks in
long-term supply gap stood in both the 2000s and 2010s, when real copper prices hit
$10,420/t and $11,440/t respectively.
Green electrification to support strongest decade for global copper demand growth in
the post-2000 era
The most obvious conclusion from integrating green demand into the broader global
balance context is that we project the global copper demand trend growth to be
significantly higher in the 2020s (3.1%) versus both the 2000s (1.2%) and 2010s (2.5%).
In volume terms, global refined copper demand will grow on average nearly 1Mty in the
2020s, which compares to just over 400kty in the 2010s. Over the course of the decade
For the exclusive use of TONY.GIARDINI@TRILOGYMETALS.COM
that additional growth in demand converts into an additional 65Mt refined copper
requirement in this decade versus the previous. The addition of green electrification
related demand provides a significant accelerator to global copper demand dynamics.
On non-green demand areas, after a phase of above-trend growth rates in 2021/22
related to the post-pandemic cyclical recovery (~4% average annual growth rate), we
see this portion of aggregate consumption decelerating to a trend close to a 2% annual
growth rate over the remainder of the decade, in line with the equivalent growth rate in
the 2010s. This masks some differentiation between sector, largely related to green
trends. We expect grid-related demand to benefit most given the accelerated
investments related to distribution requirements around renewables and EV
infrastructure, while conversely traditional (ICE) transportation related demand will face
a sustained phase of contraction given demand diversion towards EV.
Exhibit 26: Global copper demand growth is set to trend at a Exhibit 27: Green demand growth volumes will start to surpass
cad17838227545df9bd8aca261090f3b
matterially higher rate in the 2020s versus the 2000/10s previous bull cycle China demand growth from mid-decade
Global copper demand growth, by decade China and green copper demand growth
Global copper demand growth (2001 - 2010)
% Global copper demand growth (2011 - 2020) kt
1400 China copper demand growth (2000 - 2010) Green demand growth (2020 - 2030)
6.0 Global copper demand growth (2021 - 2030)
5.0 1200
4.0
1000
3.0
800
2.0
1.0 600
0.0 400
-1.0
200
-2.0
-3.0 0
1 2 3 4 5 6 7 8 9 10 0 1 2 3 4 5 6 7 8 9 10
Year Year
Source: Woodmac, Goldman Sachs Global Investment Research Source: Woodmac, Goldman Sachs Global Investment Research
13 April 2021 16Goldman Sachs Green Metals
Mine supply peaks in 2024, open-ended contraction thereafter just as green demand
accelerates
The other defining feature of expected copper fundamental trends in the 2020s pertains
to the peak in base case mine supply in 2024 and (current) open-ended contraction
thereafter. After a 5-year period of essentially no growth in mine supply up to and
including 2021 (GSe 21Mt, +1.1% yoy), we expect a brief but strong phase of mine
supply growth in 2022-23 (~6% average annual growth). This would, however, represent
a final window for mine supply growth given global mine supply then peaks in 2024 at
close to 24Mty before falling to 23Mt by 2026 and 21.5Mt by 2030 on our estimates.
These production projections reflect our base case mine projections plus additional
assumed supply from a proportion of known probable brownfield (70%) and greenfield
(50%) projects. Probable projects are classified by Woodmac as (1) high-quality but not
advanced projects operated by established producers and (2) projects owned by single
asset operators with robust technical and economic qualities (but as yet not financed).
For the exclusive use of TONY.GIARDINI@TRILOGYMETALS.COM
Without the inclusion of this portion of probable projects (which essentially represent a
pre-approval of some likely but still unapproved projects), global mine supply would peak
in 2023. How has the copper market got into this position? There’s not an absolute
shortage of copper deposits; rather it is a reflection of the mining sector’s focus on
deleveraging and balance sheet conservatism after the 2014-15 metals price collapse.
This came after a surge in supply investment following the copper price rally in 2010-11.
Committed copper related growth capex is on a downward path from 2021. There has
been no indication of a pivot towards growth yet from the mining sector despite the
stronger copper price environment. Given the lead times on copper projects – 2-4 years
for brownfield additions (at existing mines) and 6-8 years for greenfield projects – we
would note that the earliest mine level responses can emerge is into mid-decade. Given
the size of deficits starting from the same point, approvals and investments in mine
projects have to start now.
cad17838227545df9bd8aca261090f3b
Exhibit 28: Mine copper supply growth decelerates sharply from Exhibit 29: Copper growth capex currently fades into mid-decade
peak timing in 2024, contrasting with green underpin to demand just demand accelerates on green channel
trend growth Global copper capex and demand growth
Mine copper supply and demand growth
% Copper mine supply growth (3yr ma) Copper demand growth (3yr ma) $ mn Global copper growth capex Copper demand growth (3yr ma) %
6 12000 6.0
5
10000 5.0
4
3 8000 4.0
2
6000 3.0
1
0 4000 2.0
-1
2000 1.0
-2
-3 0 0.0
2000
2001
2002
2003
2004
2005
2006
2007
2008
2009
2010
2011
2012
2013
2014
2015
2016
2017
2018
2019
2020
2021
2022
2023
2024
2025
2026
2027
2028
2029
2030
2000
2001
2002
2003
2004
2005
2006
2007
2008
2009
2010
2011
2012
2013
2014
2015
2016
2017
2018
2019
2020
2021
2022
2023
2024
2025
Source: Woodmac, Goldman Sachs Global Investment Research Source: Woodmac, Goldman Sachs Global Investment Research
13 April 2021 17Goldman Sachs Green Metals
Cumulative metals deficits into mid-decade present elevated risk of stock depletion
The combination of the green transition based demand acceleration and peak in mine
supply by mid-decade underpins a tightening path in copper fundamentals over the
course of this decade. However even before these trends start to materially influence
the balance, we project sizeable market deficits both this year (242kt) and then in 2022
(201kt). As we have laid out previously, these deficits reflect the tightening influence
from a robust cyclical and policy driven demand environment and at least initially COVID
restraining supply dynamic. The net impact of these twin metal deficits will be to reduce
market inventories to the lowest level since the mid-2000s, and in turn the tightest
market conditions since the same point. There will then follow a softening window in
metal fundamentals in 2023 (309kt surplus) as strong mine supply supports increased
metal supply, while the cyclical support recovery in demand post pandemic starts to
fade. This will only be a brief softening phase as the refined market then moves back to
close to balanced in 2024 (107kt surplus) before a phase of increasingly large deficits
play out from 2025 (325kt deficit). On this base case path, inventories fall sharply into
For the exclusive use of TONY.GIARDINI@TRILOGYMETALS.COM
mid-decade but avoid depletion. However, we would note that thereafter mega sized
deficits begin (2Mt in 2026, 3.6Mt in 2027) which as per the next comment, feed into
the record sized long-term gap. The deficits from 2026 will have to be predominantly
solved by growth in mine supply from as yet unidentified sources.
Exhibit 30: Copper market faces deficits in 2021-22, a brief surplus Exhibit 31: Projected deficits could lead to a depletion in inventory
in 2023 before mega deficits from mid-decade unless prices follow a path into the mid-teens by 2025
Global copper balance Copper stocks by source
kt Global refined copper balance Global visible Historical GS base case (15K by 2025)
stocks (kt) Prices stay at 9K Prices at 11K
400 1,600
300
1,200
200
800
100
400
0
0
-100
-400 Stocks
cad17838227545df9bd8aca261090f3b
-200 depletion
-800 starting from
-300 Sep 2022
-1,200
-400
2018 2019 2020 2021 2022 2023 2024 2025
-1,600
2003 2005 2007 2009 2011 2013 2015 2017 2019 2021 2023 2025
Source: Woodmanc, Goldman Sachs Global Investment Research Source: Wind, Goldman Sachs Global Investment Research
Long-term supply gap now at a record 8.2Mt, nearly double the gap in the mid-2000s
The final key conclusion for copper market fundamentals is with regard to the significant
increase in long-term supply gap (10 year forward shortfall, 2030 for current year). We
now see at a 8.2Mt shortfall, which compares 5.6Mt in Q4-20 and 4.5Mt in 2019. This is
the highest long-term supply gap on record and 60% larger than the supply gap we
projected in 2004/05 (for 2014/15), which we would view as comparable years to 2021 in
terms of stage in bull cycle. The supply gap is essentially a 10-year forward balance,
albeit with positive adjustments to mine supply projections to include a portion of
probable projects (70% brownfield, 50% greenfield) as well as an extension to 20% of
mine closure volume. The long-term supply gap will never be fully closed as there is an
inherent lag in long dated supply responses relative to expected demand conditions on
13 April 2021 18Goldman Sachs Green Metals
the same time frame. However, neither can the long-term gap sustainably rise to levels,
which means those long-term deficit dynamics actually evolve into nearer dated deficit
outcomes. That however is the current direction of travel for the copper market. In that
context, as Exhibit 33 shows, whenever the supply gap spikes higher there is a strong
positive correlation with the copper price. The key increment on reducing the gap size
will come from the approval of possible brownfield and greenfield mine projects, which
are not included in our base case projections.
Exhibit 32: Long-term supply gap now projected at over 8Mt by 2030 Exhibit 33: Record long-term supply gap implies significant further
Refined copper supply and demand upside to copper prices
LT supply gap and copper price
kt Refined copper supply Copper demand kt 10 year supply gap Copper price lagged 1 year (RHS) $/t
36000
8500 10000
34000
7500 9000
32000
8000
30000 2030 gap 6500
8238 kt
For the exclusive use of TONY.GIARDINI@TRILOGYMETALS.COM
28000 7000
5500
26000 6000
4500
24000 5000
22000 3500 4000
20000
2019 2020 2021 2022 2023 2024 2025 2026 2027 2028 2029 2030 2500 3000
2004 2006 2008 2010 2012 2014 2016 2018 2020
Source: Woodmac, Goldman Sachs Global Investment Research Source: Woodmac, Goldman Sachs Global Investment Research
Solving the path to net zero for copper
We have established that on current trends, the copper market faces both a running
inventories to critical levels – if not a depletion – in solving near-term metals deficits and
shortage of approved mine projects to solve the current record (and expanding)
cad17838227545df9bd8aca261090f3b
long-terms supply gap. In order to prevent these extreme scenarios, a material softening
response is required in the copper market. To prevent the risk of inventory depletion by
mid-decade, we see a necessary combination of near-dated positive supply response
(scrap, brownfield approvals) and negative demand adjustment (substitution) to soften
the profile of deficits on that time horizon. On a longer dated balance basis – and
focused on the large deficits in the second half of the decade – a substantial pivot to
growth investment is needed now in terms of greenfield copper mine projects to
materially lower the long-term supply gap. These adjustments have to happen to prevent
copper being a constraint on the energy transition, and perhaps just as important, have
to start now given the multi year time lags particularly in terms of mine response.
The copper price is ultimately the means for generating these fundamental adjustments.
We have modelled both scrap and substitution effects into our supply-demand balance
as a function primarily of our price forecasts and other economic variables, as well as
reviewing the available greenfield project economics. The immediate conclusion in this
context is that current copper prices ($9,000/t) are too low to prevent a risk of inventory
depletion, while our current long-term copper ($8,200/t) is not high enough to
incentivise enough greenfield projects to solve the long-term gap. If copper remains at
13 April 2021 19Goldman Sachs Green Metals
$9,000/t through the next three years, then the resultant deficits would generate a
depletion of market inventories by early 2023 (Exhibit 34). Based on our scrap and
demand modeling, we believe that the most probable path for copper price from here –
that both avoids depletion risk and as well as a sharp surplus swing – is to trend into the
mid-teens by mid decade. We now project copper to average $9,675/t in 2021, $11,875/t
in 2022, $12,000/t in 2023 before a material step up to $14,000/t in 2024 and $15,000/t
in 2025. This means the metal balances into mid-decade remain manageable without
depletion occurring. Whether prices need to rise further post-2025, will then depend on
whether the price rally has supported enough mine supply response by that stage.
Exhibit 34: Copper balance would move into stock depletion level Exhibit 35: We now project copper to trade up to $15,000/t by
deficits if copper prices do not trend higher as we forecast mid-decade to mitigate depletion risks
Global copper balance Historical and forecasted copper price
kt Global balance at 9k Global balance at GS forecast 15000 $/t Copper Price at $2021 Old GS Forecast
400
New GS Forecast
200 13000
0
For the exclusive use of TONY.GIARDINI@TRILOGYMETALS.COM
11000
-200
-400 9000
-600
7000
-800
-1000 5000
-1200
3000
-1400
-1600 1000
2020 2021E 2022E 2023E 2024E 2025E 1960 1965 1970 1975 1980 1985 1990 1995 2000 2005 2010 2015 2020 2025
Source: Woodmac, Goldman Sachs Global Investment Research Source: World Bank, Goldman Sachs Global Investment Research
Exhibit 36: Scrap and substitution volumes under GS base case Exhibit 37: Higher price profile modestly reduces the size of the LT
increase sharply into mid-decade supply gap, but sustained high prices key to solving via project
Scrap and substitution volumes approvals
Historical and forecasted LT supply gap
kt Scrap Substituion (RHS) kt 10-year supply gap
cad17838227545df9bd8aca261090f3b
Historical 9K strip to 25’ + 8200 LT
(kt)
9K strip to 25’ + 10K LT GS base case
11000 800 10500
9500
700
10000 8500
600 7500
9000
6500
500
5500
8000
400 4500
7000 3500
300
2500
6000 200
2018 2019 2020 2021E 2022E 2023E 2024E 2025E
Source: ICA, Goldman Sachs Global Investment Research Source: Woodmac, Goldman Sachs Global Investment Research
13 April 2021 20Goldman Sachs Green Metals
Demand substitution: Record lost volumes by mid-decade on price extremes but limited
aggregate impact
When a resource becomes scarce in an economy, profit-maximising firms naturally look
to replace the scarce resource with a more plentiful substitute where technically
possible, with copper no exception. Copper’s main competitor – aluminium – has similar
but inferior electrical and thermal properties, allowing for imperfect substitution across a
range of goods, from power cable to wiring. Yet capturing the precise rate of
substitution – as a function of the relative price of copper and aluminum –faces
challenges of sparse data, underlying technological shifts and the endogenous
relationship between new copper growth, price and aluminium demand that can create
spurious correlations. To clean the data of these secular trends, we trim our data set to
analyse the marginal increases in substitution during periods of a high copper-aluminium
price ratio. Given the limited length of global data series, we restrict our analysis to the
US copper/aluminum consumers only. We find that in those years when the
copper-aluminium price ratio is more than two standard deviations above the mean, we
For the exclusive use of TONY.GIARDINI@TRILOGYMETALS.COM
see a substantial (but lagged) substitution effect emerging. For example, in 1966, 1974
and 2009 when the real copper-aluminium price ratio was at 3.50, 4 and 3.4 respectively,
the years after the peak in (1967, 1975) saw copper demand growth decrease by 3% and
9%. However, emblematic of the inherent instability in substitution estimates, during
the high copper prices of the 1970s, copper was losing c.3% of its market share of car
radiator’s a year – yet this was more driven by high oil prices incentivising manufacturers
to look for ways to make car’s lighter, rather than a direct result of high copper prices.
More recently, the copper market saw a lagged substitution effect as the copper
aluminium price ratio reached new highs during China’s commodity super cycle,
reaching a peak of 471kt in 2007 and remaining at a high level until 2010. Going forward,
we see substitution being driven in part by copper prices, but also by technological
constraints. Indeed, we see substitution risk in green demand as low, partly because the
physical properties of copper make substitution difficult. Although the aluminium
cad17838227545df9bd8aca261090f3b
winding wire in EVs can be used for electric motors due to its lighter weight, and
similarly in wind turbines and solar, PV systems aluminium can used the transformer
and transmission power cables. The lower conductivity reduces the engine efficiency
and increase maintenance costs. Moreover, in almost all renewable technologies, the
cost of copper is a fraction of the final cost. In construction, substituting building copper
wire for aluminium, creates minimal cost savings to the overall project and stricter
safety standards constrain the use of aluminium. For supply demand model, we have
assumed that substitution volumes rise to new extremes given the record strength of
price. We have used the peak substitution rate from previous peaks as the initial guide
over 2021-23 (~500kty) before accelerated rate in 2024/25 (700kty). In other words, we
assume in our model that the loss demand volumes to substitution ultimately trend to
levels well above anything seen in history.
13 April 2021 21Goldman Sachs Green Metals
Exhibit 38: Under our base case we project a surge in substitution Exhibit 39: Substitution from copper to aluminium will be a key
volumes to new record levels by the mid-2020s channel of losses though we also expect aluminium prices to trend
Historical and forecasted net substitution volumes higher into mid-decade
Copper aluminium substitution volumes and price ratio
Net substitution kt
Historical GS Base case 9k scenario Copper aluminium substitution Copper aluminium price ratio (RHS) %
(kt)
800 270 5
Projection
700
220 4
600
500
170 3
400
300 120 2
200
100 70 1
0
20 0
Source: ICA, Goldman Sachs Global Investment Research Source: ICA, Goldman Sachs Global Investment Research
For the exclusive use of TONY.GIARDINI@TRILOGYMETALS.COM
cad17838227545df9bd8aca261090f3b
13 April 2021 22Goldman Sachs Green Metals
Scrap supply: Unable to close long-term deficit
Scrap is often seen as the balancing residual of the copper market; able to plug deficits
by incentivising short run supply surges, making the scrap response function of great
concern to investors. However, it is important to distinguish the different sources of
scrap, and the limits those sources have on tackling what are huge open ended deficits
stretching out over half a decade. As Exhibit 40 shows, copper scrap flows from two
sources: 1) ‘new scrap’ directly from the semi’s manufactures, as offcuts (tailings) of
piping and wiring can be immediately melted down to be reused in the semis
production process and 2) ‘old scrap’ from recycling appliances, demolishing buildings
and melting copper alloys like brass.
Exhibit 40: Copper scrap can be split into new scrap from semi-finished goods production and old scrap for the recycling of old copper
containing goods
Scrap flow model (2019 data)
For the exclusive use of TONY.GIARDINI@TRILOGYMETALS.COM
cad17838227545df9bd8aca261090f3b
Source: Goldman Sachs Global Investment Research
‘New scrap’ supply is relatively insensitive to price, with semi’s manufacturers capturing
the maximum amount of spare copper in their production process. Accordingly, this
source of scrap grows only with actual copper demand and acts as a residual that
reduces refined copper demand in the balance. The more important long-term driver is
old copper scrap, whose supply response function can be decomposed into two parts.
13 April 2021 23Goldman Sachs Green Metals
First, old scrap generation from recycling copper-containing goods at the end of their
life. This is a combination of the lifecycle-weighted sum of past copper consumption and
the current discount rate used by households and firms when deciding whether to scrap
their durable asset (car, plant, etc). Then, there is the scrap destocking effect – the pull
on copper scrap inventory in scrapyards but not processed and sent to secondary
copper smelters or brass mills.
An often cited argument by investors is that after the rapid growth of Chinese copper
consumption in the 2000s, the world is headed for an onshore scrap surge that is likely
to severely crimp primary refined copper demand. What this logic fails to take into
account is that, while China’s copper growth was exceptionally strong during the 2000s,
ex-China demand stagnated. In other words, China was consuming metals on behalf of
other countries and global copper consumption growth didn’t jump when Chinese
demand growth picked up. As a result, we expect global scrap generation growth to
remain steady although we are likely to see China increasingly shift from using imported
For the exclusive use of TONY.GIARDINI@TRILOGYMETALS.COM
scrap to using domestically generated scrap. For more detail on the precise dynamics of
scrap supply please see our copper scrap primer.
Exhibit 41: To capture the potential future scrap supply, we take the Exhibit 42: ...and historical copper use, to capture available
life of copper-containing goods... recyceable copper
Probability density estimate of service life by sector Historical and projected copper use
0.18 Probability Density 30000 kmt Consumer Machinery
Estimate
Transport Network
0.16
25000 Construction End of life Copper availble
0.14 Projection
20000
0.12
Construction
0.1 Machinery 15000
Transport
0.08
Network 10000
0.06 Consumer
5000
0.04
0.02 0
Service Years
1980
1982
1984
1986
1988
1990
1992
1994
1996
1998
2000
2002
2004
2006
2008
2010
2012
2014
2016
2018
2020
2022
2024
2026
2028
2030
cad17838227545df9bd8aca261090f3b
0
0 10 20 30 40 50 60 70 80 90 100
Source: US Bureau of Economic Analysis (BEA), OECD, Goldman Sachs Global Investment Source: ICA, US Bureau of Economic Analysis (BEA), OECD, Goldman Sachs Global Investment
Research Research
A long-run model of scrap supply
To capture both these short- and long-run dynamics, we decompose total scrap supply
into a structural or trend component, and a cyclical component. The structural
component remains the convolution of by-sector non-parametric estimators of life-cycle
distributions (see Exhibit 41) projected onto the history of by sector copper
consumption, while the cyclical component (scrap supply minus trend) remains a
function of the logarithim of real copper price moves and economic uncertainty (old
scrap destocking) combined with new scrap supply modelled by global IP (new scrap
from product tailings). Given the fact that the use of scrap can itself affect the price of
copper, we construct an instrumental variable to isolate the moves in the refined copper
price unrelated to scrap. Specifically, we model changes in the copper price using
changes in the price of aluminium. We then use these predicted changes in the copper
price in the scrap model instead of actual copper price changes.
13 April 2021 24You can also read


