Investor Presentation - February 2021 - Scotiabank
←
→
Page content transcription
If your browser does not render page correctly, please read the page content below
Investor
Presentation
February 2021

Caution Regarding Forward-Looking Statements

From time to time, our public communications often include oral or written forward-            changes to accounting standards, rules and interpretations on these estimates; global
looking statements. Statements of this type are included in this document, and may be          capital markets activity; the Bank’s ability to attract, develop and retain key executives;
included in other filings with Canadian securities regulators or the U.S. Securities and       the evolution of various types of fraud or other criminal behaviour to which the Bank is
Exchange Commission, or in other communications. In addition, representatives of the           exposed; disruptions in or attacks (including cyber-attacks) on the Bank’s information
Bank may include forward-looking statements orally to analysts, investors, the media           technology, internet, network access, or other voice or data communications systems
and others. All such statements are made pursuant to the “safe harbor” provisions of           or services; increased competition in the geographic and in business areas in which we
the U.S. Private Securities Litigation Reform Act of 1995 and any applicable Canadian          operate, including through internet and mobile banking and non-traditional
securities legislation. Forward-looking statements may include, but are not limited to,        competitors; exposure related to significant litigation and regulatory matters; the
statements made in this document, the Management’s Discussion and Analysis in the              occurrence of natural and unnatural catastrophic events and claims resulting from such
Bank’s 2020 Annual Report under the headings “Outlook” and in other statements                 events; the emergence of widespread health emergencies or pandemics, including the
regarding the Bank’s objectives, strategies to achieve those objectives, the regulatory        magnitude and duration of the COVID-19 pandemic and its impact on the global
environment in which the Bank operates, anticipated financial results, and the outlook         economy and financial market conditions and the Bank’s business, results of
for the Bank’s businesses and for the Canadian, U.S. and global economies. Such                operations, financial condition and prospects; and the Bank’s anticipation of and
statements are typically identified by words or phrases such as “believe,” “expect,”           success in managing the risks implied by the foregoing. A substantial amount of the
“foresee,” “forecast,” “anticipate,” “intend,” “estimate,” “plan,” “goal,” “project,” and      Bank’s business involves making loans or otherwise committing resources to specific
similar expressions of future or conditional verbs, such as “will,” “may,” “should,”           companies, industries or countries. Unforeseen events affecting such borrowers,
“would” and “could.”                                                                           industries or countries could have a material adverse effect on the Bank’s financial
                                                                                               results, businesses, financial condition or liquidity. These and other factors may cause
By their very nature, forward-looking statements require us to make assumptions and            the Bank’s actual performance to differ materially from that contemplated by forward-
are subject to inherent risks and uncertainties, which give rise to the possibility that our   looking statements. The Bank cautions that the preceding list is not exhaustive of all
predictions, forecasts, projections, expectations or conclusions will not prove to be          possible risk factors and other factors could also adversely affect the Bank’s results, for
accurate, that our assumptions may not be correct and that our financial performance           more information, please see the “Risk Management” section of the Bank’s 2020 Annual
objectives, vision and strategic goals will not be achieved.                                   Report, as may be updated by quarterly reports.

We caution readers not to place undue reliance on these statements as a number of              Material economic assumptions underlying the forward-looking statements contained
risk factors, many of which are beyond our control and effects of which can be difficult       in this document are set out in the 2020 Annual Report under the headings “Outlook”,
to predict, could cause our actual results to differ materially from the expectations,         as updated by quarterly reports. The “Outlook” sections are based on the Bank’s views
targets, estimates or intentions expressed in such forward-looking statements.                 and the actual outcome is uncertain. Readers should consider the above-noted factors
                                                                                               when reviewing these sections. When relying on forward-looking statements to make
The future outcomes that relate to forward-looking statements may be influenced by             decisions with respect to the Bank and its securities, investors and others should
many factors, including but not limited to: general economic and market conditions in          carefully consider the preceding factors, other uncertainties and potential events. Any
the countries in which we operate; changes in currency and interest rates; increased           forward-looking statements contained in this document represent the views of
funding costs and market volatility due to market illiquidity and competition for              management only as of the date hereof and are presented for the purpose of assisting
funding; the failure of third parties to comply with their obligations to the Bank and its     the Bank’s shareholders and analysts in understanding the Bank’s financial position,
affiliates; changes in monetary, fiscal, or economic policy and tax legislation and            objectives and priorities, and anticipated financial performance as at and for the
interpretation; changes in laws and regulations or in supervisory expectations or              periods ended on the dates presented, and may not be appropriate for other purposes.
requirements, including capital, interest rate and liquidity requirements and guidance,        Except as required by law, the Bank does not undertake to update any forward-looking
and the effect of such changes on funding costs; changes to our credit ratings;                statements, whether written or oral, that may be made from time to time by or on its
operational and infrastructure risks; reputational risks; the accuracy and completeness        behalf.
of information the Bank receives on customers and counterparties; the timely
development and introduction of new products and services; our ability to execute our          Additional information relating to the Bank, including the Bank’s Annual Information
strategic plans, including the successful completion of acquisitions and dispositions,         Form, can be located on the SEDAR website at www.sedar.com and on the EDGAR
including obtaining regulatory approvals; critical accounting estimates and the effect of      section of the SEC’s website at www.sec.gov.
                                                                                                                                                                                             2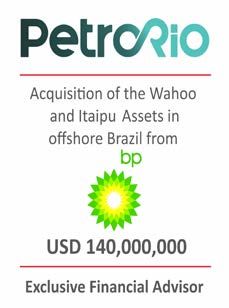
TABLE OF CONTENTS
Scotiabank Overview                                   4

Business Line Overview: Canadian Banking             19

Business Line Overview: International Banking        24

Business Line Overview: Global Wealth Management     32

Business Line Overview: Global Banking and Markets   36

Risk Overview                                        39

Treasury and Funding                                 46

Appendix 1: Core Markets: Economic Profiles          53

Appendix 2: Canadian Economic Fundamentals           62

Appendix 3: Bail-in and TLAC                         66

Appendix 4: Covered Bonds                            70

Appendix 5: Additional Information                   74

Contact Information                                  79

                                                          3
Leading Bank in the Americas
Core Markets1 Business Lines2
#3 in Canada #3 in P&C Banking
#3 in Peru
#4 in Chile #2 in Capital Markets
#5 in Mexico
#6 in Colombia #3 in Wealth
1 Core Markets rankings based on latest available market share data on loans for publicly traded banks as of February 22, 2021
2 Business
4
Line rankings based on Total Revenue or Total Net Income for publicly traded banks in Canada for the fiscal year ended October 31, 2020Leading Bank in the Americas1
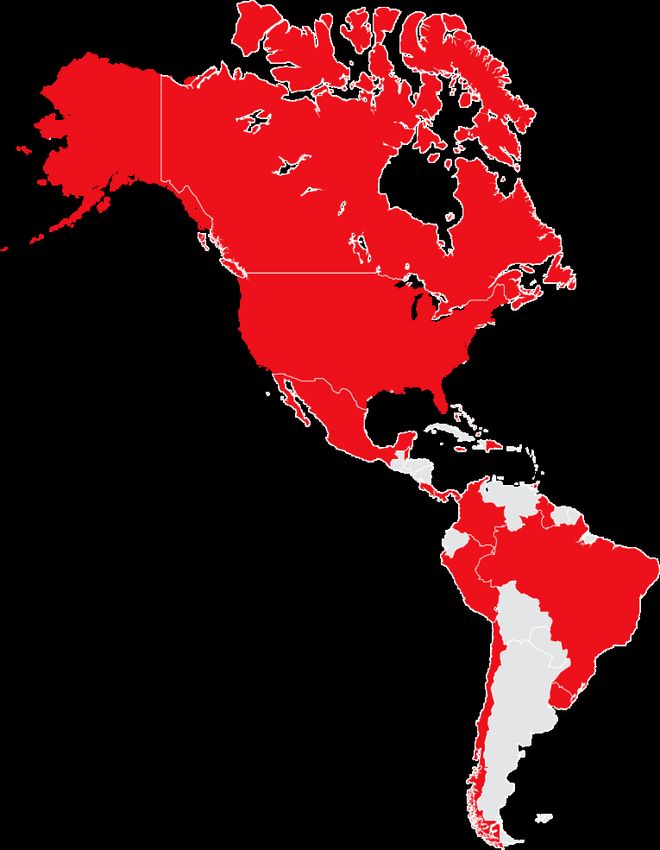
Core markets: Canada, US, Mexico, Peru, Chile and Colombia
7th largest bank by assets1 in the Americas
Change
Scotiabank2 Q1/21 Y/Y
Full-Service,
Universal Bank Revenue $8,072MM +3%
Net Income $2,418MM +6%
Canada
Return on Equity 14.4% +50 bps
Mexico
Peru Operating Leverage +3.4% n.a.
Chile Productivity Ratio 51.8% (160 bps)
Colombia
Caribbean Total Assets $1.2T +1%
Uruguay CET1 Ratio 12.2% +80 bps
Ranking by Market Share3
Wholesale Canada #3
Operations USMCA USA Top 10 FBO
USA Mexico #5
Pacific
UK Peru #3
Alliance
Singapore
Countries Chile #4
Australia
(PAC)
Ireland Colombia #6
Hong Kong SAR
China
Earnings by C&CA
Other
Brazil
Malaysia Market2,4
India PAC
3%3%
Japan 17%
U.S.A
7% Canada
70%
1 Rankingby asset as at February 18, 2021, Bloomberg; 2 Adjusted for acquisition and divestiture-related amounts, impact of
additional pessimistic scenario in ACLs, Derivative Valuation Adjustment, and impairment charge on software asset. Revenue
growth, Net Income growth, and Operating Leverage excludes divested operations; 3 Ranking based on market share in loans as
of December 2020 in Mexico, Peru and Chile, as of November 2020 in Colombia, as of October 2020 in Canada for publicly
traded banks; 4 Adjusted net income attributable to equity holders of the Bank for the 3 months ended January 31, 2021
5Well-Diversified Business with Strong Returns
Earnings by Business Line1,2 Earnings by Market1,2,4
Colombia
Wealth Asia 1% Europe
Management Caribbean and 2% 1%
Central America
19% C&CA
Global Peru %
3
Wealth
Chile
4%
Management
Canadian Personal & 6%
19%
Banking Commercial Mexico
P&C Banking 6%
Q1/21 Q1/21
EARNINGS MIX
40%
57% U.S. EARNINGS MIX Canada
Global
$2.3B 3 Per 7% $2.3B 3 70%
Wholesale Banking and
Banking Markets
24% 24%
International
Banking P&C
17%
21.6%
15.0% 14.9%
13.1%
11.6%
22.0%
17.9% 17.3% 14.4%
8.7%
Canadian International Global Wealth Global Banking All Bank
3-year average ROE Banking Banking Management and Markets
1 Netincome attributable to equity holders for the 3 months ended January 31, 2021; 2 Adjusted for acquisition and divestiture-related amounts, impact of additional pessimistic scenario in ACLs, Derivative
Valuation Adjustment, and impairment charge on software asset; 3 Excludes Other segment; 4 Earnings from Brazil and Other net to nil 6Business Lines (Q1/21 Results)
Activity Personal & Commercial Banking Wealth Management Capital Markets
Canadian International Global Wealth Global Banking
Business Line Banking Banking Management and Markets
Products • Mortgages • Mortgages • Asset Management • Corporate Banking
• Auto Loans • Auto Loans • Private Banking • Advisory
• Commercial • Commercial • Private Investment • Equities
Loans Loans Counsel • Fixed Income
• Personal Loans • Personal Loans • Brokerage • Foreign Exchange
• Credit Cards • Credit Cards • Trust • Commodities
NIAEH1 ($MM) $915 $398 $425 $543
% All-Bank1 40% 17% 19% 24%
% Target 35-40% 25-30% ~15% 15-20%
Productivity
45.3% 54.2% 58.1% 46.0%
Ratio1
ROE1 22.0% 8.7% 17.9% 17.3%
Total Assets2 ($B) $368.3 $199.4 $27.5 $395.2
Employees3 17,185 45,878 7,093 2,097
1 Adjusted figures for the 3 months ended January 31, 2021
2 Average balance for the 3 months ended January 31, 2021
3 As at January 31, 2021
7Why Invest in Scotiabank?
Leading bank in the • Six core markets: Canada, US, Mexico, Chile, Peru and Colombia
• ~94% of earnings from the Americas
Americas
• Only universal bank with full presence in all Pacific Alliance countries
• Unique Americas footprint provides diversified exposure to higher
growth, high ROE banking markets
Diversified exposure to high
• 229 million people in the Pacific Alliance countries comprise the 6th
quality growth markets largest economy in the world
• Competitive scale and increasing market share in core markets
Increasing scale and market
• Competitive advantages in technology, risk management, and funding
share in core markets versus competitors
• Strong Canadian risk management culture with strong capabilities in AML
Strong risk culture: solid credit and cybersecurity
quality, well provisioned • Focus on secured and investment-grade lending
• $7.8 billion in allowances as of Q1/21
• Increased Digital Adoption to 51% in Q1/21
Acceleration in Digital • Enhanced All-Bank Digital metrics to include Active Digital Users, Active
Mobile Users, and Self-Serve Transactions in Q1/21
Banking
• Named “Best Bank in North America for Innovation in Digital Banking” (2020)
• #1 ranking for “Online Banking Satisfaction” - J.D. Power 2020
8Focused on Higher Return Markets
Higher Banking ROEs in Canada and Latam
(Latest Reporting Period)
20%
15.3%
14.3%
15%
11.0%
12.4% 10.0%
10% 3-year average ROE
10.2%
9.6%
7.2% 5.6%
5%
2.5%
0%
Canada Latam Asia US Europe
>85% of All-Bank
earnings
Return on equity based on latest reporting period as of February 19, 2021
Canada and US figures are average for five largest and 10 largest market share banks in each country, respectively. Latam figures are average of 8 banks across Mexico, Peru, Chile, Colombia, and Brazil
Sources: Bloomberg LLP, Company Financial Reports 9Q1 2021 Financial Performance
$MM, except EPS Q1/21 Y/Y Q/Q
Reported
YEAR-OVER-YEAR HIGHLIGHTS
Net Income $2,398 3% 26% • Adjusted EPS2 +3% (+30% Q/Q)
Pre-Tax, Pre Provision Profit $3,864 4% 12%
Diluted EPS $1.86 1% 31%
• Adjusted pre-tax, pre-provision profit2 +5% (+11% Q/Q)
Revenue $8,072 (1%) 8% • Adjusted revenue2 +1% (+8% Q/Q)
Expenses $4,208 (5%) 4% o Net interest income2 down 1%, or up 1% ex. divestitures
Productivity Ratio 52.1% (220 bps) (200 bps)
Core Banking Margin 2.27% (18 bps) 5 bps o Non-interest income2 up 3%, or 5% ex. divestitures
PCL Ratio1 49 bps (12 bps) (24 bps) • Core banking margin -18 bps (+5 bps Q/Q)
PCL Ratio on Impaired Loans1 49 bps (6 bps) (5 bps) o Driven by higher liquid assets, lower margins in both
Adjusted2 International Banking and Canadian Banking, and
Net Income $2,418 3% 25% changes in business mix
Pre-Tax, Pre Provision Profit $3,892 5% 11%
o Q/Q improvement driven by higher contribution from
Diluted EPS $1.88 3% 30% asset/liability management activities and higher margins
Revenue $8,072 1% 8% in Global Banking and Markets and International Banking
Expenses $4,180 (2%) 4%
• Adjusted expenses2 -2%; Operating leverage of +3.0%
Productivity Ratio 51.8% (160 bps) (150 bps)
PCL Ratio1 49 bps (2 bps) (24 bps) • Strong ROE of 14.4%
PCL Ratio on Impaired Loans1 49 bps (4 bps) (5 bps)
ADJUSTED NET INCOME2 YEAR-OVER-YEAR ($MM) ADJUSTED NET INCOME2,3 BY BUSINESS SEGMENT ($MM)
85
124 7 +1%
(101)
(41) -32%4 +20%
+34%
2,344 2,418
908 915
615 398 425 451 543
318
Q1/20 Net interest Non interest PCLs Non-interest Taxes Q1/21 Canadian Banking International Global Wealth Global Banking
Income income expenses
Banking Management and Markets
1 Includes provision for credit losses on certain assets – loans, acceptances and off-balance sheet exposures
2 Refer to Non-GAAP Measures on slide 37 for adjusted results
3 Attributableto equity holders of the Bank
Q1/20 Q1/21
4 Y/Y growth rate is on a constant dollar basis
10Earnings and Dividend Growth
Earnings per share (C$)1,2 Total shareholder return3
Scotiabank Big 5 Peers (ex. Scotiabank)
2009-2019 CAGR: +8.0%
2010-2020 CAGR: +3.2%
10.3% 10.3% 10.0% 9.7%
$5.36 8.6%
6.5%
$3.31
$1.88
5 Year 10 Year 20 Year
2020
2009
Q1/21
2010
2011
2012
2013
2014
2015
2016
2017
2018
2019
Dividend per share (C$)
+6% $3.60
CAGR
$1.96
$0.90
2009 2010 2011 2012 2013 2014 2015 2016 2017 2018 2019 2020 Q1/21
1Reflects adoption of IFRS in Fiscal 2011; 2 Excludes notable items for years prior to 2016. For 2016 onwards, results adjusted for acquisition and divestiture-related amounts, impact of additional
pessimistic scenario in ACLs, Derivative Valuation Adjustment, and impairment charge on software asset; 3 As of January 31, 2021
11Strong Capital Position
CET1 Ratio
+10 bps +6 bps 12.2% 1
11.8% +27 bps -4 bps
Q4 2020 Earnings less Organic RWA Pension Other Q1 2021
Reported Dividends (ex. FX) Remeasurement (Including FX) Reported
Internal capital generation
Strong Capital Levels
15.5% 15.7%
14.6% 14.0% 14.9%
2.1% 2.2% 2.1%
2.1% 2.1% 1.4%
1.1% 1.5% 1.5%
1.0%
11.4% 10.9% 11.3% 11.8% 12.2%
Q1/20 Q2/20 Q3/20 Q4/20 Q1/21
CET1 Tier 1 Tier 2
1 Includes ~22 bps benefit from OSFI’s partial inclusion of stage 1 and 2 ECL
12Scotiabank in the Pacific Alliance
Pacific Alliance
Chile Mexico Peru Colombia Total/Average
Scotiabank Market Share1 13.8% 7.8% 16.2% 5.3% 10.4%
1
Market Share Ranking 4th 5th 3rd 6th n.a.
Strengths All Products Auto and Mortgages All Products Credit Cards, Personal All Products
Average Total Loans (C$B) 2
$46.7 $31.1 $21.0 $11.4 $110.3
3
Revenue (C$B) $0.5 $0.6 $0.5 $0.3 $1.9
Net Income after NCI3,4 (C$MM) $133 $130 $73 $22 $358
ROE2,3,4 9% 16% 10% 7% 11%
# of Employees5,6 7,847 9,804 10,297 6,296 34,244
Total Deposit Growth7,8 Total Loan Growth7,8 Productivity Ratio4 Total PTPP Growth4,7,8
+6% +3%
Y/Y Y/Y Chart-2%
Title
1,097
Y/Y
64% 59%
111 110 110 58% 1,020
78 79 78 120 959
9 9 12 11 11 58% 121
10 51% 51% 120
44% 311
23 24 24 44 46 43% 46% 309
47 267
36% 34%
18 17 33% 363
19 22 308
22 21 345
50
26 28 29 33 31 31 283
254 227
Q1/20 Q4/20 Q1/21 Q1/20 Q4/20 Q1/21 Q1/20 Q4/20 Q1/21 Q1/20 Q4/20 Q1/21
Mexico Peru Chile Colombia Mexico One Month Lag
1 Ranking based on publicly traded banks by total loans market share, as of December, 2020; except Peru and Colombia as of November, 2020 5 Employees are reported on a full-time equivalent basis
6 Asof January 31, 2021
2 For the three months ended January 31, 2021
7 Y/Y and Q/Q growth rates (%) are on a constant dollar basis
3 For the three months ended January 31, 2021, not adjusted for currency
4 Results on an adjusted basis
8 May not add due to rounding 13Digital Progress: All-Bank
• Enhanced All-Bank Digital metrics to include Active Digital Users, Active Mobile Users and Self-Serve Transactions
• Canada: Growth in digital adoption as customers use self-service channels for daily financial transactions
• Pacific Alliance: Strong increase in digital sales with improvement in digital account opening process in Mexico and Chile
Digital Adoption (%)1 +43.9%
6,728 7,524 7,591
Active Digital 6,316
+43.1% 5,276
Users (#’000)3
50% 51%
43% 44%
36% 2018 2019 Q1/20 Q4/20 Q1/21
+70.1%
2018 2019 Q1/20 Q4/20 Q1/21 5,903 6,052
Active Mobile 4,513 4,965
3,559
Users (#’000)2,3
Digital Sales (%)
2018 2019 Q1/20 Q4/20 Q1/21
+93.0%
42% +17.8%
36%
28% 30% Self-Serve
74% 78% 80% 87% 87%
22%
Transactions
(%)3
2018 2019 Q1/20 Q4/20 Q1/21 2018 2019 Q1/20 Q4/20 Q1/21
1 CB Digital Adoption definition updated to reflect new addressable customer base, excluding indirect-channel acquisitions
2 2018 and 2019 use historical estimation based on available mobile user data for Colombia and Chile
3 New Digital metric introduced Q1/21. Please see Appendix for additional definitions
14Technology Strategy
$
● Build a strong and ● Cloud-first strategy ● Rebalance core ● Maintain consistent
scalable platform for automation and technology spending investment in
foundation speed towards modernization technology
Investments in Technology
11.9%
10.1%
Tech expense ● Common systems
as % of revenue
7.8% ● Software re-use, best practice-sharing
● Consistent software design
$3,710 ● Customer-focused micro-services
$2,430 Tech expense ● Analytics on real-time data
$1,200 (in $millions)
● Strong cyber-security foundation
2010 2015 2020
15Fintech Strategy
Partnerships Focus Areas Proof of Concepts1
• Credit adjudication
• Accessibility
• Natural language
processing
• Personal financial
management
• Customer experience
and self-service
• Machine-learning
modelling
• IT Modernization
• Fraud
• Anti-Money Laundering
1 Selected proof of concepts with fintech partners
16Environmental, Social & Governance
Environmental Social Governance
• Over $28 billion mobilized to reduce the • Launched ScotiaRISE in January 2021, a 10- • Ranked in the top 1% of global financial
impacts of climate change out of $100 billion year, $500 million initiative to promote institutions for Corporate Governance by the
target by 20251 economic resilience among disadvantaged Dow Jones Sustainability Index
groups
• Established a dedicated ESG Equity Research • Strengthened approach to responsible
Team and launched a Sustainable Finance • Invested almost $85 million in communities procurement and supplier diversity by joining
Group within Global Banking and Markets in which we operate, through donations, Canadian Aboriginal and Minority Supplier
community sponsorships, employee Council
• Published inaugural Green Bond Report volunteering, and other types of community
outlining the impact and use of proceeds investment • 46% of Board Directors are women2. We first
from Scotiabank’s US $500 million 3.5 year established a Board Diversity Policy in 2013
Green Bond issued in 2019 • Contributed over $16 million to support
people and communities most at risk during • Spearheaded the development of Project
• Implemented a Climate Change Risk Rating the pandemic, including direct contributions Shadow, a public-private partnership
tool for all business banking loans as a for COVID-19 relief, as well as support of designed to combat online child sexual
mandatory part of credit due diligence hospitals and healthcare professionals exploitation by enhancing methods to detect,
report and disrupt suspicious financial
• Established multi-year partnership with the • Launched renewed five-year Diversity and transactions
Institute for Sustainable Finance at Queen’s Inclusion Goals, with a focus on people who
University as part of Climate Change Centre identify as Black, Indigenous Peoples, Visible • Developed new internal training on ethics in
of Excellence Minorities, People with Disabilities and artificial intelligence (AI) and delivered a data
Women ethics workshop for executives
1 Since November 1, 2018; 2 As of October 31, 2020 17ESG Spotlight – Retail Banking
Key focus areas Recent achievements
• Introduced Canada’s first sustainable investing tools through Scotiabank’s iTrade. Over 20,000
ESG Investing
Leadership in users interacted with the sustainable investing tool in 2020.
ESG Education • iTrade continues to deliver online learning modules to customers interested in learning more
about ESG issues.
• Launched four ESG focused funds in 2020, the Scotia Low Carbon Funds (Global Equity, Global
Leadership in Balanced, & Canadian Fixed Income) & the Dynamic Energy Evolution Fund.
ESG Funds • These funds add to other ESG investing offerings, the ESG Equity Guided Portfolio, the Jarislowsky
Fraser Fossil Fuel Free Funds and the MD Fossil Fuel Free Funds.
• Scotiabank in Mexico has offered customers since 2019 an incentivized credit plan to purchase an
Green Vehicles
Leadership in electric or hybrid vehicle through CrediAuto’s Green Credit Program. The program offers benefits
EV Incentives like a preferential interest rate and an “environmentally friendly bonus” to make cleaner-running
vehicles more accessible.
• Scotiabank is a market leader in financing electric vehicles, having financed 43% of EVs in Canada
Leadership in in 2020.1 Scotiabank EV units financed in Canada have grown ~800% from 2015 to 2020.
EV Financing • We have an exclusive relationship with Polestar as well as a semi-exclusive relationship with Tesla.
Units financed in Canada for Teslas have grown 2,650% since 2015.
• Scotiabank operates 27 Aboriginal Banking Centres in Canada providing communities with our full
Leadership in range of banking services.
Aboriginal Banking • The First Nations Leasehold program provides financing options for leasehold interests on First
Housing
Nations land being developed with residential housing.
• Scotiabank’s StartRight® program addresses the unique banking needs of newcomers in Canada.
Leadership in • The Scotiabank StartRight® permanent resident mortgage program and the Scotiabank
Newcomers Banking StartRight® temporary resident mortgage program help facilitate newcomers’ financing of home
purchases.
1 Represents bookings from Scotiabank subvented partners only.
18Business
Line Canadian Banking
Overview
19Canadian Banking: Overview
Canadian Banking provides a full suite of financial advice and banking solutions, supported by an excellent customer experience, to
over 11 million Retail, Small Business and Commercial Banking customers. Through Tangerine, Canadian Banking also provides digital
banking solutions to over 2 million customers.
Business Mix Residential Financial Results
Retail Mortgages
67% 63%
$MM Q1/21 Y/Y Q/Q
Revenue Average Reported
Mix1, 2 Loan Mix1
Net Income3 $911 7% 17%
$2.6B $366B
12% Auto Pre-Tax, Pre Provision Profit $1,444 (2%) 5%
14%
33% 2% 9% Revenue $2,648 (2%) 3%
Business and
Business Banking Government Loans Credit Other Personal Expenses $1,204 (2%) 2%
Cards Loans
PCLs $215 (33%) (35%)
Adjusted Net Income3 ($MM) and NIM4 (%) Productivity Ratio 45.5% (10 bps) (70 bps)
2.36% 2.33% 2.26% 2.26% 2.26% Net Interest Margin4 2.26% (10 bps) -
PCL Ratio5 0.23% (13 bps) (14 bps)
908 915 PCL Ratio on Impaired Loans5 0.23% (7 bps) (4 bps)
481 782
433
Adjusted3
Q1/20 Q2/20 Q3/20 Q4/20 Q1/21 Net Income3 $915 1% 17%
Pre-Tax, Pre Provision Profit $1,450 (2%) 5%
Medium-Term Financial Objectives Expenses $1,198 (2%) 2%
Target6 PCLs $215 (14%) (35%)
NIAT Growth3 5%+ Productivity Ratio 45.3% (10 bps) (70 bps)
Productivity RatioLoan Portfolio
• High Quality Residential Mortgage Portfolio 82%
o 36% insured; remaining 64% uninsured has an LTV of 52%1 Real Estate
Secured Lending
o Mortgage business model is “originate to hold”
o New originations2 in Q1/21 had average LTV of 64.4%
o Majority is freehold properties; condominiums represent
approximately 15% of the portfolio
• Market Leader in Auto Loans DOMESTIC RETAIL
LOAN BOOK3
o $38.7 billion retail auto loan portfolio with 8 OEM relationships (4
exclusive)
$328B
o Prime Auto and Leases (~92%)
o Stable lending tenor with contractual terms for new originations
averaging 78 months (6.5 years) with projected effective terms of 53
months (4.5 years)
• Prudent Growth in Credit Cards
o $6 billion credit card portfolio represents ~2% of domestic retail loan 4% 12%
book and ~1% of the Bank’s total loan book Unsecured
Automotive
o Organic growth strategy focused on payments and deepening
relationships with existing customers
2%
Credit Cards
1 LTV calculated based on the total outstanding balance secured by the property. Property values indexed using Teranet HPI data
2 New originations defined as newly originated uninsured residential mortgages and have equity lines of credit, which include mortgages for purchases
refinances with a request for additional funds and transfer from other financial institutions
3 Spot Balance as of January 31, 2021; Percentages may not add to 100% due to rounding
21Residential Mortgages
• Four Distinct Distribution Channels: 1. Broker (~57%); 2. Branch (~20%); 3. Mobile Salesforce (~23%) and 4. eHOME
FICO® Distribution – Canadian Uninsured Portfolio1, 2 Q1/20 Q4/20 Q1/21
63% Canada
Average FICO® Score
Canada 792 Total Originations ($B) 11.2 16.6 16.1
GTA 795 Uninsured LTV 64% 64% 64%
GVA 793 Greater Toronto Area
Total Originations ($B) 3.7 5.0 5.2
15% Uninsured LTV 63% 63% 63%
9% 10%
3% Greater Vancouver Area
Total Originations ($B) 1.4 1.9 1.9
< 635 636 - 706 707 - 747 748 - 788 > 788 Uninsured LTV 63% 63% 62%
Canadian Mortgage Portfolio3: $250B (Spot balances as at Q1/21, $B) 36%
$132.8 Insured
Freehold - $214B Condos - $36B
$17.2
(85%) (15%)
Total
$115.6 $47.9 Portfolio3:
$12.6 $31.5 $250 billion
$3.8 $17.1
$35.3 $2.1 $11.2 $0.2 $9.8 $0.7
$27.7 $15.0 $11.0 $9.1
Ontario BC & Territories Alberta Quebec Atlantic Provinces Manitoba &
Saskatchewan
% of
portfolio 53.1% 19.1% 12.6% 6.8% 4.5% 3.9% 64%
1 FICO ® distribution for Canadian uninsured portfolio based on score ranges at origination. FICO is a registered trademark of Fair Isaac Corporation
Uninsured
2 LTV calculated based on the total outstanding balance secured by the property. Property values indexed using Teranet HPI data
3 Includes Wealth Management 22Automotive Finance
• Canada’s leader in automotive finance
• Provide personal and commercial dealer financing solutions, in partnership with seven leading global
automotive manufacturers in Canada
• Portfolio decreased 4.0% year-over-year1. Personal down 2.1%, Commercial down 18.4%
Exclusive Relationships
Commercial 12%
MAZDA VOLVO POLESTAR JAGUAR/LAND ROVER
AVERAGE
Near-Prime 7% ASSET MIX
Retail
Semi-Exclusive Relationships*
$43.2B1
100% Secured 81% Prime
Retail HYUNDAI CHRYSLER GENERAL MOTORS TESLA
* 1 to 2 other financial institutions comprise Semi-Exclusive relationships
Market Share Asset Growth
Prime Retail Market Share2 Near-Prime Retail Market Share3 Commercial Floorplan Market Share4
$44.4B
$43.5B
$42.3B
27% $39.7B
23%
36% $37.1B
64%
77% 73%
2016 2017 2018 2019 2020
1 For the three months ended January 31, 2021; 2 CBA data as of October 2020, includes RBC, CIBC, Canadian Western Bank, National Bank, TD, Scotiabank, Laurentian Bank; 3 DealerTrack Portal data, includes
all Near-Prime Retail providers on DealerTrack Portal, data for January 2021 originations; 4 Includes BMO, CIBC, RBC, Scotiabank, TD, HSBC, Canadian Western Bank, Laurentian Bank, data as of June 2020 23Business
Line International Banking
Overview
24International Banking
International Banking has a strong and diverse franchise with more than 10 million Retail, Corporate, and Commercial customers.
International Banking continues to offer significant potential for the Bank, with a geographical footprint encompassing the Pacific
Alliance countries of Mexico, Colombia, Peru and Chile as well as Central America and the Caribbean.
Business Mix Financial Results
Business
Loans
53%
$MM Q1/21 Y/Y2 Q/Q2
Asia Credit
Revenue Reported
Cards 6% Loan Mix
1
2% Mix1 78% Latin
America Auto 2% $144B Net Income3 $389 (21%) 54%
$2.6B
20% 12% Pre-Tax, Pre Provision Profit $1,159 (7%) 4%
C&CA 27%
Personal
Revenue $2,561 (10%) 1%
Loans Residential
Expenses $1,402 (11%) (2%)
Mortgages
PCLs $525 (5%) (29%)
3,6 4
Adjusted Net Income ($MM) and NIM (%) Productivity Ratio 54.7% (100 bps) (120 bps)
Net Interest Margin4 4.03% (48 bps) 6 bps
4.51% 4.28% 3.99% 4.03%
3.97% PCL Ratio5 149 bps (8 bps) (58 bps)
615 PCL Ratio Impaired Loans5 150 bps 5 bps (8 bps)
59 398
556
197 53
283 Adjusted4
197 283 398
52 1 Net Income3 $398 (32%) 47%
Q1/20 Q2/20 Q3/20 Q4/20 Q1/21 Net Income – Ex Divested Ops.3 $398 (24%) 47%
Ex. Divested Ops Divested Ops Pre-Tax, Pre Provision Profit $1,172 (12%) 3%
Expenses $1,389 (7%) (2%)
Medium-Term Financial Objectives PCLs $525 10% (29%)
Target7
Productivity Ratio 54.2% 130 bps (60 bps)
NIAT Growth6 9%+
PCL Ratio5 149 bps 13 bps (58 bps)
Productivity RatioPAC Fundamentals Driving Growth
Strong Sound Macro Favourable
Governance Environment Demographics
● Democratic countries ● Diversified economies ● 229 million people with
with open economies with strong GDP median age of 30 years
growth
● Independent central ● Strong domestic
banks with inflation ● Resilience to economic consumption
targets and political cycles
● Much lower banking
● Free trade agreements ● Investment Grade- penetration compared to
and free-floating rated Canada
currencies
● Low Debt/GDP ratios ● Among the fastest
● Business-friendly with lower fiscal growing smartphone
environments deficits compared to markets in the world
G7
● Considerable growth in
● Increasing adoption of middle class
banking services
26Scotiabank in Mexico
Business Overview
Customers ~3.8MM Corporate/
Market Position by Loans4
23.4%
Commercial
Employees ~10,100 58%
Branches1 530 Loans 15.1%
$31.2B 13.2%
10.5%
Average Loans $31B 29%
7.8% 6.9%
Average 2% 5% 6%
Residential
$29B Mortgages
Deposits 3.8%
Credit Auto Personal 2.1%
Total NIAT2,5 $310MM Cards Loans
ROE3 9.1% Retail 84% 16%
Loans
Productivity3 55.1% Secured Unsecured BBVA Banorte Santander Banamex Scotiabank HSBC Bajio Regio
PTPP Productivity Ratio Operating Leverage
+14%
CAGR 58.6%
7.5%
6.9%
924 978 1,087
738
55.4% 1.9%
55.0%
54.4%
-0.9%
2017 2018 2019 2020
Constant currency
All figures in CAD$ including Wealth Management 2017 2018 2019 2020 2017 2018 2019 2020
1 Includes bank and wealth branches; does not include 177 Credito Familiar branches
2 LTM Q1/21
3 Adjusted as Reported
4 Source: CNBV as of December 2020
27
5 Adjusted after NCIScotiabank in Peru
Business Overview
Customers1 ~4.5MM Corporate/
Market Position by Loans4
Commercial 33.1%
Employees1 ~10,800 57%
Residential
Branches1 308 13% Mortgages 21.1%
Loans
$21.3B 16.2%
Average Loans $21B 12.7%
Average 0% 19%
$17B 3% 8%
Deposits Auto Personal
Loans
Other Credit
Total NIAT2,5 $281MM Cards
Retail 37% 63% BCP BBVA Scotia Interbank
ROE3 8.3% Loans
Secured Unsecured
Productivity3 34.7%
PTPP Productivity Ratio Operating Leverage
+9%
CAGR 6.8%
39.3%
1,508 1,498
1,279 5.0%
1,157
37.5%
35.1% 1.8%
35.2%
0.3%
2017 2018 2019 2020
Constant currency
All figures in CAD$ including Wealth Management 2017 2018 2019 2020 2017 2018 2019 2020
1 Including subsidiaries
2 LTM Q1/21
3 Adjusted as Reported
4 Market share as of November 2020. Scotiabank includes SBP, CSF and Caja CAT
28
5 Adjusted after NCIScotiabank in Chile
Business Overview
Market Position by Loans4
Customers1 ~2.8MM Corporate/
Commercial 46% 18.7%
Employees ~7,900 16.8%
Branches1 131 Loans
14.0% 13.8%
$46.7B
Average Loans $47B 0% 37% Residential
9.6%
Auto 5% Mortgages
Average Credit
$24B 12%
Deposits Cards
Personal
Total NIAT2,5 $377MM Loans
ROE3 6.5% Retail 79% 21%
Loans
Productivity3 43.4% Secured Unsecured Santander Chile BCI Scotiabank Itaú
PTPP Productivity Ratio Operating Leverage
+30%
CAGR 49.5%
1,202 1,185 13.3%
789
535
8.5%
44.7%
43.3% 4.3%
43.4%
2017 2018 2019 2020 0.0%
Constant currency
All figures in CAD$ including Wealth Management 2017 2018 2019 2020 2017 2018 2019 2020
1 Includes affiliates & consumer microfinance
2 LTM Q1/21
3 Adjusted as Reported
4 Market share as of December 2020, includes only private banks, Source: CMF
29
5 Adjusted before NCIScotiabank in Colombia
Business Overview
Market Position by Loans4
Customers1 ~2.8MM Corporate/
Commercial 26.1%
43%
Employees ~6,500 Residential
19% Mortgages
Branches 152 Loans 16.7%
$11.5B
Average Loans $11B 1%
12.3%
10.2%
Auto 19% 6.2%
Average 5.3%
$10B 19% Personal 4.3%
Deposits Loans
Credit
Cards
Total NIAT2,6 -$34MM
ROE3 -2.8% Retail 34% 66%
Loans Bancolombia Davivienda Bogotá5 BBVA Occidente5 Scotiabank Popular5
Productivity3 58.2% Secured Unsecured Colpatria
PTPP Productivity Ratio Operating Leverage
+3%
CAGR
59.8%
664
519 507 -1.8%
460 -2.4%
54.5%
52.6% 53.4%
-6.4% -7.6%
2017 2018 2019 2020
Constant currency
All figures in CAD$ including Wealth Management
1 As of October 2020
2017 2018 2019 2020 2017 2018 2019 2020
2 LTM Q1/21
3 Adjusted as Reported
4 Market share as of December 2020
5 Members of AVAL Group: Banco de Bogotá, Banco de Occidente, Banco Popular and Banco AV Villas. AVAL is 2nd in market share in terms of Loans (25%) and 1st in Deposits (27%)
30
6 Adjusted after NCIOther Regions
Leading Caribbean & Central American franchise
Caribbean & Central America Asia
• Leading bank serving retail, commercial, and China: ~18% interest in Bank of Xi’an
corporate customers
• CAD $955MM carrying value as of
• Major markets include the Dominican Republic, January 31, 2021
Jamaica, Trinidad & Tobago, Costa Rica,
Panama and The Bahamas • Bank of Xi’an reported $511MM of net
• Sharpened geographic footprint by exiting income for the twelve months ended
higher risk, low growth jurisdictions including October 31, 2020, of which
Haiti, El Salvador, Puerto Rico, US Virgin Scotiabank’s share is 18%
Islands, British Virgin Islands, Belize and 8 of
the Leeward Islands
Dominican Republic: #4 bank
• Acquired Banco Dominicano del
Progreso in 2019
31Business Global Wealth
Line
Overview Management
32Global Wealth Management
3rd Largest Wealth Management Business in Canada1
Global Wealth Management is focused on delivering comprehensive wealth management advice and solutions to clients
across Scotiabank’s footprint.
Business Overview2 Financial Results
11% 12%
Revenue
20% $MM, except AUM/AUA Q1/21 Y/Y Q/Q
AUM AUA
$1.4B $314B $546B Reported
88% 80% Net Income4 $418 37% 29%
89%
Pre-Tax, Pre Provision Profit $573 36% 31%
International Canada Revenue $1,390 20% 19%
3,4 3 Expenses $817 11% 13%
Adjusted Net income ($MM) and ROE (%)
17.9%
13.8% 14.3% 14.3%
PCLs $4 nmf nmf
13.7%
425 Productivity Ratio 58.8% (490 bps) (350 bps)
62
AUM ($B) $314 5% 8%
318 314 332 333 363
AUA ($B) $546 10% 9%
Q1/20 Q2/20 Q3/20 Q4/20 Q1/21
Adjusted2
Ex. Performance Fees Performance Fees Net Income4 $425 34% 28%
Pre-Tax, Pre Provision Profit $582 34% 29%
Medium-Term Financial Objectives
Target5 Expenses $808 12% 13%
Earnings Growth 8%+ PCLs $4 nmf nmf
Productivity RatioGlobal Wealth Management
# 1 in earnings growth1 | #2 in revenue growth1 | #1 operating leverage relative to peers1
3rd Largest Wealth Management Business in Canada1
Investment Management Distribution Channels
A broad selection of actively managed investment A powerful advisory and distribution network
solutions from our innovative manufacturing platform. across Canada and Latin America.
Mutual Funds Private Investment Counsel
Full-Service Brokerage
ETFs Private Banking
Trust Services
Pooled Funds
Online Brokerage
Segregated Portfolios Retail Bank Branch Network
Mobile Advice Team
Institutional Asset Management
3rd Party Distributors
Branch / mobile advice team
1 Fiscal Year 2020 results
34Global Wealth Management
Strong investment performance, increasing scale
Market-Leading Capabilities
Award-Winning Investment Management Award-Winning Distribution
• #2 in Retail Mutual Fund Net Sales in Canada • Largest Private Investment Counsel business in
(IFIC, January 2021) Canada
• Won 20 Refinitiv Lipper Fund Awards for 2020 – • 2021 World’s Best Private Banks awards in Peru and
more than any other firm (ScotiaFunds and Dynamic Bahamas (Global Finance)
Funds)
• #2 Bank-Owned Brokerage Firm (Investment
• Won 41 FundGrade A+ Awards for 2020 - more than Executive Brokerage Report Card, 2020)
any other bank or independent fund company
(ScotiaFunds and Dynamic Funds)
• #1 in physician market share in Canada (MD
Financial)
• Named Fund Provider of the Year by Wealth
Professional (Dynamic Funds)
• #2 in 2020 Best Bank-Owned Online Broker
(MoneySense Magazine)
• Top 3 Greenwich Leader in Canadian Institutional
Investment Management Service
(Jarislowsky Fraser)
AUM AUA
• Straight A’s in the 2020 Principles for Responsible
Investment report (Jarislowsky Fraser) +6%
+11% CAGR
CAGR
Investment Performance Highlights
292 502
76% of assets in the top two quartiles over
five-year period – 1832 Asset Management 193
404
75% of core funds in the top two quartiles over
five-year period – Jarislowsky Fraser 2016 2020 2016 2020
35Business
Line Global Banking
Overview and Markets
36Global Banking and Markets
Global Banking and Markets (GBM) provides corporate clients with lending and transaction services, investment banking advice and
access to capital markets. GBM is a full service wholesale bank in the Americas, with operations in 21 countries, serving clients across
Canada, the United States, Latin America, Europe and Asia-Pacific.
Business Overview Financial Results
Asia
Canada Business
5% Global 47% Banking $MM Q1/21 Y/Y Q/Q
Europe
7% 56% Equities
Geographic 18% Revenue By Reported
Revenue1 Business Line1
Net Income2 $543 46% 18%
$1.3B $1.3B
Pre-Tax, Pre Provision Profit $722 41% 15%
32%
US 35% Revenue $1,336 15% 10%
FICC
Expenses $614 (6%) 5%
2, 3 3 PCLs $20 (17%) (68%)
Adjusted Net Income ($MM) and ROE (%)
Productivity Ratio 46.0% (1,000 bps) (220 bps)
17.5% 17.3%
15.4% 14.6% PCL Ratio4 0.08% (1 bp) (16 bps)
14.0%
PCL Ratio Impaired Loans4 0.06% (8 bps) (7 bps)
451 523 600 460 543 Adjusted3
Net Income2 $543 20% 18%
Q1/20 Q2/20 Q3/20 Q4/20 Q1/21 Pre-Tax, Pre Provision Profit $722 17% 15%
Revenue $1,336 5% 10%
Medium-Term Financial Objectives
Target5 PCLs $20 11% (68%)
NIAT Growth ~5% Productivity Ratio 46.0% (550 bps) (220 bps)
Productivity Ratio ~50% PCL Ratio4 0.08% 1 bp (16 bps)
Operating Leverage Positive
1 TEB Revenue for the 3 months ended January 31, 2021. Note GBM Latam revenue contribution is reported in International Banking results; 2 Attributable to equity holders of the Bank; 3 Adjusted for impact
37
of additional pessimistic scenario; 4 Provision for credit losses on certain assets – loans, acceptances and off-balance sheet exposures; 5 3-5 year target from 2020 Investor DayGBM in US and Latam
Delivering the full bank to meet our Americas clients’ needs
• Wholesale bank in the US: • Wholesale bank in Latam:
US1 Latam1 Advisory, financing and risk
Corporate & Investment
Banking, Capital Markets, management solutions, and
Cash Management and Trade $427 million Revenue $404 million access to capital markets
Finance • Only full-service
• Top 10 foreign bank corporate/commercial bank
$39 billion Average Loans $45 billion
organization (FBO) in the US with local presence in all Pacific
Alliance countries
• Client list focused on S&P $79 billion Average Deposits $23 billion
500, investment grade • Enhanced connectivity to rest
corporates of Americas, Europe and Asia
$166 million Total NIAT $174 million • Top tier lending relationships
• Current sectors of strength
include: Power & Utilities and with local and multi-national
Energy. Focus areas for corporate clients
53.8% Productivity 29.7%
growth include Consumer • Focused on Pacific Alliance
/Industrial /Retail (CIR), expansion and modernization
Technology, and Healthcare 5 Offices 9 of technology platforms
US$710,000,000 $7,500,000,000
COP$122,500,000,000 5.375% Senior Secured Notes
Green Tranche due 2030 Senior Credit Facilities US$180,000,000
COP$227,500,000,000 US$1,050,000,000
Senior Secured Term Loan,
$10,000,000,000
Tranche B & C Project Finance
Flexible Facility, Working Capital Senior Notes
Facility & Letter of Credit Facility
Global Coordinator & Joint Lead Arranger, Joint
Lender Joint Bookrunner / Joint Lead Joint Bookrunner Bookrunner and LC
Arranger & Hedge Provider Provider
1 Figures for fiscal Q1 /21 38Risk
Overview
39Risk Snapshot
RWA Breakdown1 Credit Exposure by Country2,3 Credit Exposure by Sector1,2,4
Canada
Real Estate and Construction 6.3%
Chile Financial Services 4.9%
Credit Risk 66%
2% 2% U.S. Wholesale and Retail 3.9%
4%
12% $407B 86% Operational Risk
4% $611B1 Other International Technology and Media 2.8%
5% Mexico Other 2.8%
Market Risk 5% C&CA Utilities 2.6%
7% 7%
Peru Agriculture 2.4%
Colombia Automotive 1.9%
Personal & Commercial Lending Energy 1.9%
Transportation 1.5%
Canadian Banking1,2 International Banking1,2 Food and Beverage 1.4%
Health Care 0.9%
Mining 0.8%
70% Secured
Secured Sovereign 0.8%
6%
$328B $66B Hospitality and Leisure 0.8%
94%
Unsecured Metals 0.4%
Unsecured 30%
Forest Products 0.4%
Chemicals 0.2%
1 As at January 31, 2021
2% of total loans and acceptances
3 As at October 31, 2020
40
4 Regulated/contracted midstream has been moved from Energy to Utilities as of Q1/21. Prior periods have been restated to conform to the current presentationWell Provisioned
Total ACLs ($MM) HIGHLIGHTS
7,820 7,810
7,403 181 • $7.8 billion in total ACLs, up $2.7 billion, or 53%
182
6,079 1,957 1,994 220 since Q1/20
74 1,776 +53%
5,095 1,643 • Performing loan ACLs increased 60% since Q1/20,
1,533 74 or $2.1 billion
5,445 5,682 5,596 • Total ACLs represents ~12 quarters of net write-
4,362 offs
3,488
Q1/20 Q2/20 Q3/20 Q4/20 Q1/21
Performing Loan ACLs Impaired Loan ACLs Other4
Total PCLs ($MM)1,2,3 and PCL Ratio2 HIGHLIGHTS
119 bps 136 bps
• Total PCL ratio2 of 49 bps decreased 2 bps Y/Y and
2,181 24 bps Q/Q
73 bps
51 bps 1,846 149 2
2 49 bps • The Q/Q improvement was driven by lower PCL on
155 752
1,131 performing loans, mainly related to retail in
670 3
771 764
International Banking driven by the more
18 330 62 4 favourable macroeconomic outlook
250 1,019 1,278 215 20
503 736 525
Q1/20 Q2/20 Q3/20 Q4/20 Q1/21
International Banking Canadian Banking Global Banking and Markets Other3
1 Includes provision for credit losses on debt securities and deposit with banks of $nil in Canadian Banking, $nil in International Banking (Q1/20: -$1 million, Q2/20: $1 million, Q4/20: -$1 million), $nil in Global
Banking and Markets (Q3/20: $1 million, Q4/20: -$1 million), $nil in Global Wealth Management (Q3/20: -$1 million) and $nil in Other (Q1/20: $1 million , Q2/20: -$2 million, Q4/20: $2 million)
2 Refer to Non-GAAP Measures on slide 37 for adjusted results
3 Other includes provisions for credit losses in Global Wealth Management of $4 million (Q2/20: $2 million, Q3/20: $1 million, Q4/20: $3 million)
4 Includes ACLs on off-balance sheet exposures and ACLs on acceptances, debt securities and deposits with financial institutions
41Historical PCL Ratios on Impaired Loans
1
All Bank
0.70% 0.59% 0.56%
0.60% 0.50% 0.49% 0.49%
0.47% 0.45%
0.50% 0.36% 0.40% 0.42% 0.43%
0.34% Avg:
0.40% 0.32% 41 bps
0.30% 0.24%
0.20% 0.12%
0.10%
0.00%
2007
2008
2009
Q1/21
2010
2011
2012
2013
2014
2015
2016
2017
2018
2019
2020
0.50% 1
Canadian Banking
0.40% 0.37% 0.35%
0.32%
0.28% 0.28% 0.29% 0.29%
0.30% 0.23% 0.23% 0.23% 0.23% 0.24% 0.23% Avg:
0.19% 0.18% 26 bps
0.20%
0.10%
0.00%
2007
2008
2009
Q1/21
2010
2011
2012
2013
2014
2015
2016
2017
2018
2019
2020
1
International Banking
1.75% 1.49% 1.50%
1.50% 1.27% 1.24% 1.26% 1.29% 1.30%
1.21%
1.25% 0.90% 1.00% 0.86% Avg:
1.00% 103 bps
0.75% 0.75%
0.75%
0.44%
0.50% 0.25%
0.25%
0.00%
2007
2008
2009
Q1/21
2010
2011
2012
2013
2014
2015
2016
2017
2018
2019
2020
Average (2007 - Q1/21)
1 Provision for credit losses on certain assets – loans, acceptances and off-balance sheet exposures 42Canadian Retail: Loans and Provisions 1
Mortgages Auto Loans
216 224
96 106 91
4 2
0 0 1 4 2 1
1
105
89
1 94 99 81
Q1/20 Q2/20 Q3/20 Q4/20 Q1/21 Q1/20 Q2/20 Q3/20 Q4/20 Q1/21
Lines of Credit2 Credit Cards
164 169
1,002
896
80 79 62 385 400 322
87 74 60 321
73 65 377 445 401 312
Q1/20 Q2/20 Q3/20 Q4/20 Q1/21 Q1/20 Q2/20 Q3/20 Q4/20 Q1/21
PCL as a % of avg. net loans (bps) PCLs on Impaired Loans as a % of avg. net loans (bps)
Loan Balances Q1/21 Mortgages Auto Loans Lines of Credit2 Credit Cards Total
Spot ($B) $250 $39 $32 $6 $3283
% Secured 100% 100% 63% 2% 94%4
1 Includes Wealth Management. PCL excludes impact of additional pessimistic scenario
2 Includes Home Equity Lines of Credit and Unsecured Lines of Credit
3 Includes Tangerine balances of $6 billion and other smaller portfolios
4 82% secured by real estate; 12% secured by automotive 43International Retail: Loans and Provisions
Mexico Chile Caribbean & CA
1.8x 1.2x 1.7x
2271 409 1621 2141,2,3 3683
Markets with 191
Greater 550 591
556
Weighting to 279 321 457
Secured 231 208 246 228
280
248 159 155
191 181 261
160 187 178 221
238 81 157 141
250 267 253 243
148 150 154 175 190
218 203 163 251 87 170 231 221 195 204
54 156 2 138 165
1 1
Q2/19 Q3/19 Q4/19 Q1/20 Q2/20Q3/20Q4/20 Q1/21 Q2/19 Q3/19 Q4/19 Q1/20 Q2/20Q3/20Q4/20 Q1/21 1
Q2/19 Q3/19 Q4/19 Q1/20 Q2/20Q3/20Q4/20 Q1/21
Peru Colombia
2.6x 2.2x
4471,2 1,161 4221 913
Markets with
1,322 1,552
Greater 1,152
Weighting to 1,290
939
Unsecured 545
970 764 1,065 738
473 471 549 531
402 395 361 471 439
491 579 542 361
470 143
372 424 455 377 420 406 245
2 1 1
Q2/19 Q3/19 Q4/19 Q1/20 Q2/20Q3/20Q4/20 Q1/21 Q2/19 Q3/19 Q4/19 Q1/20 Q2/20 Q3/20 Q4/20 Q1/21
PCL as a % of avg. net loans (bps) PCLs on Impaired Loans as a % of avg. net loans (bps)
Loan Balances Q1/21 Mexico Peru Chile Colombia Caribbean & CA Total4
Secured ($B) $11 $3 $21 $2 $9 $46
Unsecured ($B) $2 $6 $5 $4 $3 $20
Spot Total ($B) $13 $9 $26 $6 $12 $66
1 PCL excludes impact of additional pessimistic scenario
2 Adjusted for acquisition-related costs, including Day 1 PCL impact on acquired performing loans
3 Excludes impact of divested operations
4 Total includes other smaller portfolios
44Sectors Most Impacted by COVID-191
Real Estate:
Most Impacted Sectors as a % of Total Loans Office and Retail
Canada
C&CA
4.7% 9% $B %IG
4.1% 4.0% Mexico 3% 56% Office REIT 1.1 73%
4.0%
$9.1B Office Real Estate 3.7 50%
11% (1.5% of total
U.S. loans) Retail REIT 1.3 95%
Q2/20 Q3/20 Q4/20 Q1/21 7%
Other 1% Retail Real Estate 3.1 54%
13%
Europe Total2 9.1 61%
Latin America
Other 27%
Canada
Hospitality & Leisure
9% $B %IG
Energy – E&P and C&CA
Oilfield Services: 1.2% Hotels 3.8 22%
Total Loans Real Estate – Office $4.9B Cruise Lines 0.3 0%
and Retail: 1.5% (0.8% of total 17%
loans)
Gaming 0.7 0%
$626.0B Transportation – Air
Travel: 0.4%
33%
4%
Latin
America
U.S.
10%
Total2 4.9 18%
Hospitality & Mexico
Leisure: 0.8%
Mexico
Transportation:
Canada
Latin
America 7%
14% Air Travel
5% $B %IG
C&CA
Total COVID-19
8%
$2.6B Aircraft Finance 1.1 99%
High Impact: 4.0% (0.4% of total
Other Airlines 0.3 4%
loans)
14%
1 Sectors which have experienced the greatest disruption in normal business activities and impact to 52% Airports 1.1 57%
revenue due to the COVID-19 pandemic (including, but not limited to, government-mandated
closures) relative to other sectors Europe
2 May not add due to rounding
Total2 $2.6 69%
45Treasury
and
Funding
46Highlights
Strong liquidity, stable funding and continued reduction in wholesale funding
• Liquidity well in excess of regulatory requirements
o LCR of 129%, -9% Q/Q and +2% Y/Y
o Pacific Alliance countries ended the quarter with LCRs of 135-185%
o HQLA of $213B, +$3B Q/Q and +$45B Y/Y, is substantially comprised of Level 1 assets
• Stability of funding reflected in NSFR of 115%
• 23.3% TLAC is above 22.5% regulatory minimum required by November 1, 2021
• Reduction in wholesale funding moderated as excess system liquidity substantially absorbed
o Continued growth in deposits mitigating requirement for wholesale funding
o Reduced term funding to mitigate cost while balancing NSFR, TLAC and overall funding stability
• Funding metrics continue to improve
o Wholesale funding at $197B, down $3B Q/Q and $74B Y/Y
o Wholesale funding / total assets improved Q/Q from 17.6% to 16.9%
47Funding Strategy
Diversified funding sources
Funding Programs1
US Debt & Equity Shelf
(senior / subordinated debt, preferred and common shares)
• Increase contribution from customer deposits Limit – USD 40 billion
Global Registered Covered Bond Program
• Continue to reduce wholesale funding (uninsured Canadian mortgages)
Limit – CAD 100 billion
utilization while building TLAC
EMTN Shelf
Limit – USD 20 billion
• Maintain balance between efficiency, stability
of funding and pricing relative to peers CAD Debt & Equity Shelf
(senior / subordinated debt, preferred and common shares)
Limit – CAD 15 billion
• Diversify funding by type, currency, program,
tenor and source/market START ABS program (indirect auto loans)
Limit – CAD 15 billion
• Utilize a centralized (head office managed) Australian MTN program
funding and associated risk management Limit – AUD 8 billion
approach Singapore MTN program
Limit – USD 12 billion
Halifax ABS shelf (unsecured lines of credit)
Limit – CAD 7 billion
Principal at Risk (PAR) Note shelf
Limit – CAD 6 billion
Trillium ABS shelf (credit cards)
Limit – CAD 5 billion
USD Bank CP Program
1In addition to the programs listed, there are also CD programs in the following currencies: Limit – USD 35 billion
Yankee/USD, EUR, GBP, AUD, HKD 48Wholesale Funding
Wholesale funding diversity by instrument and maturity1,6,7
Term Funding Maturity Table
16% (Excluding Sub Debt And Mortgage Securitization)
Bail-inable Notes
1%
Asset-Backed
(Canadian Dollar Equivalent, $B)
Securities
24%
Senior Notes 15% $23
$25
$23
Covered Bonds $21 3
9
3
11
$197B
Asset-Backed
Commercial Paper3
14%
Mortgage
Securitization4
2%
$9 $9 20
18 2
16 3
12
22% 4%
Subordinated
7
6
Bearer Deposit Notes,
Commercial Paper &
Short-Term Certificate
2%
Deposits from Banks2
Debt5
< 1 Year 2 Years 3 Years 4 Years 5 Years 5 Years >
of Deposits Senior Debt ABS Covered Bonds
1 Excludes repo transactions and bankers acceptances, which are disclosed in the contractual maturities table in the MD&A of the Interim Consolidated Financial Statements. Amounts are based on
remaining term to maturity.
2 Only includes commercial bank deposits raised by Group Treasury.
3 Excludes asset-backed commercial paper (ABCP) issued by certain ABCP conduits that are not consolidated for financial reporting purposes.
4 Represents residential mortgages funded through Canadian Federal Government agency sponsored programs. Funding accessed through such programs does not impact the funding capacity of the
Bank in its own name.
5 Although subordinated debentures are a component of regulatory capital, they are included in this table in accordance with EDTF recommended disclosures.
6 As per Wholesale Funding Sources Table in MD&A, as of Q1/21.
7 May not add to 100% due to rounding.
49Deposit Overview
Strong growth in personal & business and government deposits
Personal Deposits Personal Deposits
(Spot, Canadian Dollar Equivalent, $B)
$244 $250 • Majority of Q/Q growth from Canada
$222 $223 $224
$201 $211
$246
• Continued impact of system liquidity from
$225 $225 $235 central banks and government relief
$204 $215
programs
3Y CAGR – 7.5% • Important for both relationship purposes
and regulatory value
Q4/20
Q1/18
Q3/18
Q1/19
Q3/19
Q2/18
Q2/19
Q1/20
Q3/20
Q1/21
Q2/20
Q4/18
Q4/19
Business & Government Deposits1 Business & Government
(Spot, Canadian Dollar Equivalent, $B)
$270 $276
• Continuing to leverage relationships to grow
$221 $227 $263 $274 deposits
$197
$170 $179 $223 • Focusing on deposits with regulatory value
$211
$197
$168
3Y CAGR – 17.5%
Q4/20
Q1/18
Q3/18
Q1/19
Q3/19
Q2/18
Q2/19
Q1/20
Q3/20
Q1/21
Q2/20
Q4/18
Q4/19
1 Calculated as Business & Government deposits less wholesale funding as per Wholesale Funding Sources table in the MD&A, adjusted for Sub Debt. Excludes Financial Institution deposits.
50Wholesale Funding Utilization
Declining reliance on wholesale funding
Wholesale Funding / Total Assets Continued Reduction in
Wholesale Funding
24.6%
23.9% 23.5% • Driven by deposit growth and continued
balances with central bank liquidity facilities
o Reduced term funding to mitigate cost while
balancing NSFR, TLAC and overall funding stability
16.9% o TLAC of 23.3% is above 22.5% regulatory minimum
required by November 1, 2021
Q4/20
Q1/18
Q3/18
Q1/19
Q3/19
Q2/18
Q2/19
Q1/20
Q3/20
Q1/21
Q2/20
Q4/18
Q4/19
Money Market Wholesale Funding / Money Market Funding
Total Wholesale Funding Continues to be Subdued
44.7%
39.9%
38.4% • Opportunistic utilization of short-term
funding
26.1%
Q4/20
Q1/18
Q3/18
Q1/19
Q3/19
Q2/18
Q2/19
Q1/20
Q3/20
Q1/21
Q2/20
Q4/18
Q4/19
51Key Metrics
Well funded Bank with very strong liquidity and stable funding
• Liquidity Coverage Ratio (LCR)
o Maintained elevated levels of liquidity, well in excess of regulatory requirements
o Supported by central bank liquidity related to pandemic response
o LCR of 135-185% in Pacific Alliance countries
141% 138%
128% 132% 129%
125% 123% 125% 127%
Q1/19 Q2/19 Q3/19 Q4/19 Q1/20 Q2/20 Q3/20 Q4/20 Q1/21
• High Quality Liquid Assets (HQLA)
o Substantially comprised of Level 1 assets
o Strong annual growth but moderated Q/Q: +$3B Q/Q and +$45B Y/Y
$227
$210 $213
$188
$158 $158 $160 $165 $168
Q1/19 Q2/19 Q3/19 Q4/19 Q1/20 Q2/20 Q3/20 Q4/20 Q1/21
• Net Stable Funding Ratio (NSFR)
o Public disclosure started Q1/21 115%
o NSFR is well in excess of 100% regulatory requirement
Q1/21
52You can also read