Piramal Enterprises Limited Investor Presentation - August 2018

Page created by Vernon Mccarthy
 
CONTINUE READING
Piramal Enterprises Limited Investor Presentation - August 2018
Piramal Enterprises Limited
Investor Presentation
August 2018
Piramal Enterprises Limited Investor Presentation - August 2018
Piramal Enterprises Limited – Investor Presentation                                                                                                                                                     Page 2

Disclaimer
 Except for the historical information contained herein, statements in this presentation and any subsequent discussions, which include words or phrases such as 'will', 'aim',
 'will likely result', 'would', 'believe', 'may', 'expect', 'will continue', 'anticipate', 'estimate', 'intend', 'plan', 'contemplate', 'seek to', 'future', 'objective', 'goal', 'likely', 'project',
 'on-course', 'should', 'potential', 'pipeline', 'guidance', 'will pursue' 'trend line' and similar expressions or variations of such expressions may constitute 'forward-looking
 statements'.

 These forward-looking statements involve a number of risks, uncertainties and other factors that could cause actual results to differ materially from those suggested by the
 forward-looking statements.

 These risks and uncertainties include, but are not limited to Piramal Enterprise Limited’s ability to successfully implement its strategy, the Company’s growth and expansion
 plans, obtain regulatory approvals, provisioning policies, technological changes, investment and business income, cash flow projections, exposure to market risks as well as
 other risks.

 Piramal Enterprises Limited does not undertake any obligation to update forward-looking statements to reflect events or circumstances after the date thereof.

 These materials are not a prospectus, a statement in lieu of a prospectus, an offering circular, an invitation or an advertisement or an offer document under the Indian
 Companies Act, 2013 together with the rules and regulations made thereunder, the Securities and Exchange Board of India (Issue of Capital and Disclosure Requirements)
 Regulations, 2009, as amended, or any other applicable law in India. The securities referred to herein have not been and will not be registered under the U.S. Securities Act of
 1933, as amended, and may not be offered or sold in the United States, except pursuant to an applicable exemption from registration. No public offering of securities is being
 made in the United States or in any other jurisdiction.

 Note: Figures in previous periods might have been regrouped or restated, wherever necessary to make them comparable to current period.
Piramal Enterprises Limited Investor Presentation - August 2018
Piramal Enterprises Limited – Investor Presentation                                                                                                                                             Page 3

     Piramal Enterprises Limited: Business Overview
                                                                                                                                                        FY18 Revenues:
                                                                                      Piramal Enterprises                                           Rs. 10,639 Cr ($1.6 Bn)

                            Financial Services                                                      Pharma                                          Healthcare Insight and Analytics

                      FY18 Revenue Contribution: 47%                                    FY18 Revenue Contribution: 42%                                  FY18 Revenue Contribution:11%

            Wholesale Lending                                                 Global Pharma                                                    Decision Resources Group (DRG)
            •    Loan Book of Rs. 46,995 crs ($7 bn)                          • Strong portfolio of differentiated branded                     •   Serving a large number of healthcare
            •    ROE of 19%2; GNPA ratio of 0.3%                                  generic products                                                 companies
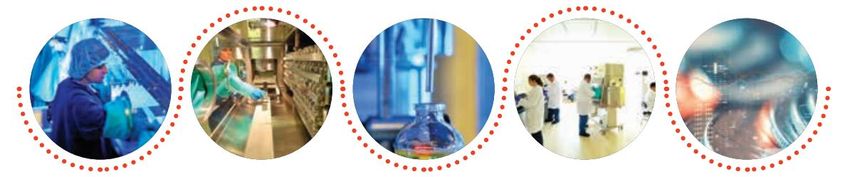
                                                                              • Distribution to 100+ countries                                 •   Leveraging proprietary data
            Alternative Asset Management                                      • Integrated solutions across APIs, formulations                 •   Offers information and analytical insights
            • Marquee partners: CDPQ, APG, Bain, CPPIB                            and delivery systems
                                                                                                                                               •   Global team of over 1,200 eminent industry
                                                                              • 13 sites (9 USFDA inspected) across US, UK                         experts (380+ in India)
            Housing Finance                                                       and India
            • Launched HFC in Sep 2017 and expanded                                                                                            •   Recurring revenue model and high client
               presence to Mumbai, Pune, Delhi-NCR and                                                                                             retention
               Bengaluru
                                                                              India Consumer Products
            Diversified Retail Exposure via Shriram                           •   Among the leading Indian OTC players
            • Strong position in CVs, SME, Insurance                          •   Pan-India distribution network

                      FY2018 Capital Employed1 : 58%                                    FY2018 Capital Employed1 : 25%                                 FY2018 Capital Employed1 : 17%

Note: 1) As per books. Excludes unallocated portion of capital employed to various business segments;   2) ROE for current reported period Q1FY2019 is considering Cash Tax and other synergies from merger
Piramal Enterprises Limited Investor Presentation - August 2018
Piramal Enterprises Limited – Investor Presentation                                                                                                                             Page 4

   Efficient capital allocation over years
     Demonstrated track record of delivering value through focus on operating excellence, timely investments as well as disciplined exits

              Loan Book Rs.46,995 Cr (on B/S)                                             ~Rs.6,652 Crores invested in
               & Alternative AUM Rs.7,620 Cr                                                        Pharma
                                                                                                                                                           8 businesses successfully built
              6 year loan book CAGR: 122%1                                             7 Year Revenue CAGR :          16%1                               across multiple sectors, 3 new
              Q1 FY19 ROE : 19%                                                        Q1FY19 Global Pharma                                             businesses in building up phase
              Q1 FY19 GNPA ratio: 0.3%                                                  EBITDA Margin : 20%
                                                                                        8 acquisitions in last 3 years

        Rs.4,583 Crores invested in                              Capital                         ~Rs.5,000 Crores invested in                             Company has made over 50
              Shriram Group                                     allocation                      Healthcare Insight and Analytics                       acquisitions till date. Most of these
                                                                                                 Around 20% appreciation in                              acquisitions were successful
      Around 16% annualized
                                                                                                  USD (relative to INR) since
       return on STFC and SCUF
                                                                                                  investment
                                                                                                 Peers trading at attractive
                                                                                                  valuations in US
                                                    Rs.5,680 Cr of capital returned                                                                     Over the preceding 30 years, more
                                                      to shareholders since 2010
                                                                                                                                                            than 90% of our key capital
                                                   Buyback of Rs.2,508 Cr                                                                             allocation decision turned out to be
                                                   Annual dividends of Rs.2,568 Cr2                                                                                successful
                                                    & Special dividend of Rs. 604 Cr
                                                   FY2018 Dividend Payout – 29 %
Note: 1) CAGR is calculated based on reported annual numbers;     2) Excludes any dividend payout upon conversions of CCDs & related Rights till book closure date
Piramal Enterprises Limited Investor Presentation - August 2018
Piramal Enterprises Limited – Investor Presentation                                                                                                                                                 Page 5

   Delivering robust growth - track record
                                                                                                                                                                                              (In Rs. Crores)

                                     Total Revenues1                                                                                        Adjusted Net Profit1,2.3

       6 yrs CAGR – 29%                                                                                          6 yrs CAGR – 55%

                                                                                       10,639
                                                                                                                          Net Profit             Net Profit Margin %

                                                                                                                    5%         (6%)        (11%)           8%           14%         15%           15%

                                                                          8,547

                                                                                                                                                                                                    1,551
                                                                                                                                                                                      1,252
                                                              6,381

                                                                                                                                                                         905
                                                 5,123
                                     4,503
                        3,544

                                                                                                                                                            421
                                                                                                                    112
            2,352

                                                                                                                                  (227)

                                                                                                                                               (501)
          FY12         FY13        FY14         FY15        FY16        FY17         FY18
                                                                                                                   FY12         FY13         FY14         FY15 2       FY16          FY17         FY18 3

Note:
1) FY2016, FY2017 and FY2018 results have been prepared based on IND AS, prior periods are IND GAAP; 2) FY2015 net profit excludes exceptional gain on sale of 11% stake in Vodafone India partly offset by
the amount written down on account of scaling back of our investments in NCE research.; 3) FY2018 adjusted net profit excludes synergies on account of merger of subsidiaries in Financial services segment
Piramal Enterprises Limited Investor Presentation - August 2018
Piramal Enterprises Limited – Investor Presentation                                                                                                                                                                      Page 6

      Consistently delivering strong performance                                                                                                                                                                  (In Rs. Crores)
                                                                                 Revenues                                                                                       Net Profits
                   Period                   Reported Period                  Previous Period                  % YoY Change                  Reported Period                  Previous Period                  % YoY Change
                   Q1FY15                            1,182                            965                            +22%                             55                             (147)                            NM
                   Q2FY15                            1,243                           1,131                           +10%                             41                              (32)                            NM
                   Q3FY15                            1,400                           1,286                           +9%                              224                             (11)                            NM
                   Q4FY15                            1,298                           1,121                           +16%                             100                            (311)                            NM
                   Q1FY16                            1,401                           1,182                           +19%                             169                             55                            +206%
                   Q2FY16                            1,504                           1,243                           +21%                             235                             41                            +473%
                   Q3FY16                            1,786                           1,400                           +28%                             307                             224                            +37%
                   Q4FY16                            1,691                           1,298                           +30%                             193                             100                            +93%
                   Q1FY17                            1,776                           1,401                           +27%                             231                             169                            +36%
                   Q2FY17                            1,966                           1,504                           +31%                             306                             235                            +30%
                   Q3FY17                            2,342                           1,786                           +31%                             404                             307                            +32%
                   Q4FY17                            2,463                           1,691                           +46%                             311                             193                            +61%
                   Q1FY18                            2,254                           1,776                           +27%                             302                             231                            +31%
                   Q2FY18                            2,536                           1,966                           +29%                             384                             306                            +25%
                   Q3FY18                            2,858                           2,342                           +22%                             490                             404                            +21%
                   Q4FY18                            2,991                           2,463                           +21%                            3754                             311                             21%
                   Q1FY19                            2,902                           2,254                           +29%                            3825                             302                             27%

                                      12 consecutive quarter of delivering                                                                       12+ consecutive quarter of delivering
                                       Revenue growth higher than 20%                                                                            Adjusted Net Profit growth over 20%
Note:
1. FY2016, FY2017 and FY2018 results have been prepared based on IND AS, prior periods are IND GAAP; 2. FY2015 quarterly net profit numbers exclude exceptional gain from Vodafone transaction and exceptional loss from NCE shutdown;
3. NM – Not measurable; 4. Q4FY2018 is adjusted net profit excludes synergies on account of merger of subsidiaries in Financial services segment; 5. Q1FY2019 adjusted net profit excludes Exceptional Item of write off of Imaging assets
Piramal Enterprises Limited Investor Presentation - August 2018
Piramal Enterprises Limited – Q4
                                    Investor
                                       & FY2017
                                             Presentation
                                                 Results Presentation                                                                                     Page 7

   Various business segments growing consistently over years

                                               Metrics showing YoY revenue growth

                                  FY13                   FY14                FY15                 FY16                  FY17                  FY18
     Businesses
                             H1          H2         H1          H2      H1          H2       H1          H2        H1          H2        H1          H2

Pharma                                                           Financial Services
Financial Services

Healthcare Insight &      Before acquisition
Analytics                      of DRG
Total Revenues

            > 20%                     11%-20%                        1%-10%                   0%                     < 0%
Piramal Enterprises Limited Investor Presentation - August 2018
Piramal Enterprises Limited – Investor Presentation                                                                                  Page 8

   Strong performance trend in Financial Services
                         Financial Services Performance                            •    Growth: PEL’s loan book has grown at a robust CAGR of
                                                                                        122% over last 6 years.
                                                                (In Rs. Crores)         — Consistently delivering 60%+ YoY growth in loan
              Loan Book               ROE (%)
                                                                                           book in each of the last 14 quarters
         NR1       15%        16%      20%      25%+         25%+       19%             — During Q1FY2019 loan Book grew 64% YoY to Rs.
                                                                                           46,995 Crores
         6 yrs Loan Book                                               42,168
           CAGR 122%                                                  Financial Services
                                                                                  • ROE: The Company has recorded an ROE of 25%+ over
                                                                                       last 10 consecutive quarters prior to the fund raise
                                                                                       through QIP and Rights Issue
              Gross NPA ratio as on
              31 Mar 2018 is 0.3%                            24,975
                                                                                   • Asset Quality: Consistently maintaining a healthy asset
                                                                                     quality; GNPA below 1% since last 10 quarters
                                                13,338

                                                                                   • Portfolio Diversification: The consistent robust growth
                                      4,766
       350
                 2,016       2,861                                                   in loan book is an outcome of our strong diversification -
                                                                                     Launched 22 products across various business verticals
       FY12       FY13       FY14     FY15      FY16         FY17       FY18         in last few years
Note:
1.    NR – Not Reported
Piramal Enterprises Limited Investor Presentation - August 2018
Piramal Enterprises Limited – Investor Presentation                                                                                           Page 9

   Consistent performance trend in Pharma
                             Pharma Performance
                                                                (In Rs. Crores)
                                                                                         •     Growth: PEL’s Pharma revenue has grown at a
               Pharma Revenue 1            Global Pharma EBITDA Margin (%)
                                                                                               CAGR of 16% over last 7 years

         10%      11%       14%     16%      16%      17%       20%       22%            •
                                                                                      Profitability: Global Pharma (accounts for 92% of
                                                                                      Pharma revenues) has delivered a strong growth in
           7 yrs Revenue                                                              EBITDA margins from 10% in FY2011 to 22% in
                                                                        Financial Services
             CAGR 16%
                                                                          4,322       FY2018
                                                                3,893
                                                       3,467                             •     Quality & Compliance: Since FY2011, PEL
                                             3,008
                                   2,715                                                       successfully cleared 32 USFDA inspections, 106
                           2,339
                                                                                               other regulatory audits and 877 customer audits
                 1,906
       1,537
                                                                                         •     Differentiated Model: Our differentiated business
                                                                                               model has ensured that we perform better than
       FY11      FY12      FY13     FY14     FY15      FY16     FY17      FY18                 most of the other Indian Pharma companies

Note:
1.    Pharma Revenue includes Global Pharma & Consumer Products Revenue. Global Pharma revenue accounted for 92% of the Pharma revenue during FY18
Piramal Enterprises Limited Investor Presentation - August 2018
Piramal Enterprises Limited – Investor Presentation                                                                                                                                                        Page 10

    Returns to shareholders consistently outperforming all benchmarks
   Consistently delivered strong shareholder returns – significantly                                                  Rs.5,680 Crores3,4,5 returned to shareholders since sale of
   higher than benchmarked indices¹                                                                                   Domestic Formulations business in 2010
                                                                                                                     (Rs. Crores)
                        5 year Annualized Return2                                           6,593%
                                                                                                                                Normal dividend                    Special dividend                 Buyback
         PEL                         40%                                                                                                                                                                               5
                                                                                                                                                                                                       4525      5,680
        Nifty                        14%
                                                                                                                                                                                            362
                                                                                                                                                                                 302
                      Nifty       PEL                                                                                                                                345
                                                                                                                                                          906
                                                                                                                                                           604
                                                                                                                                                302        302
                                                                                                                       2,709        302
                                                                                                    1143%
                                                                              871%                                                                                                         4,866
                                                                                                                                                                     4,219      4,564
                                                450%           446%                                                                            3,011   3,313
                                                                                                                                                  FY2017  Dividend Payout – 29 %
                                                                                                                                   2,709
                                 192%                                                                                   2,508
                  121%                                 70%            95%            140%
    6% 17%                41%            37%
                                                                                                                         201
      1 yr           2 yrs          3 yrs          4 yrs          5 yrs          10 yrs         20 yrs
                                                                                                                        FY11       FY12       FY13        FY14       FY15       FY16       FY17       FY18       Total
                                                                                                                                                                                   Annualized return to
                                Revenue CAGR for                                                      Net Profit CAGR for
                23%               last 30 years                                       29%                last 30 years                                        29%*                  shareholders over
                                                                                                                                                                                      last 30 years
Notes:
1) Total shareholder returns are as on 30 Apr 2018. Assumes re-investment of dividend in the stock (Source : Bloomberg);      2) Annualized returns are as on 30 Apr 2018;    3) Of the buy back of 41.8 mn shares shown in
FY11, buyback of 0.7 mn shares happened in FY12;        4) Capital returned to shareholder through dividends doesn’t include amount paid under Dividend Distribution Tax;    5) Excludes any dividend payout upon
conversions of CCDs & related Rights till book closure date
Piramal Enterprises Limited – Investor Presentation                                                                                           Page 11

Board of Directors
                                                         AJAY PIRAMAL
                                                         CHAIRMAN
                                                         AWARDED “ASIA BUSINESS LEADER OF THE YEAR” BY CNBC ASIA
                                                         NON - EXECUTIVE DIRECTOR, TATA SONS LIMITED
                                                         CHAIRMAN, SHRIRAM CAPITAL LIMITED
                                                         CO – CHAIR, UK–INDIA CEO FORUM

              DIRECTORS                                                     INDEPENDENT DIRECTORS

             DR. SWATI PIRAMAL                                                                                     DR. R MASHELKAR
             VICE-CHAIRPERSON                          N VAGHUL                                                    EMINENT SCIENTIST
             EMINENT SCIENTIST                         FORMER CHAIRMAN,                                            FORMER DG, CSIR
             AWARDED PADMA SHRI                        ICICI BANK                                                  AWARDED PADMA VIBHUSHAN

              NANDINI PIRAMAL
              EXECUTIVE DIRECTOR,                      KEKI DADISETH                                                S RAMADORAI
              OTC, HR, QUALITY & RISK                  FORMER CHAIRMAN,                                             FORMER VICE-CHAIRMAN,
              MBA, STANFORD                            HINDUSTAN UNILEVER LTD                                       TCS

             ANAND PIRAMAL                             PROF. GOVERDHAN MEHTA
             NON-EXECUTIVE DIRECTOR,                   EMINENT SCIENTIST                                           SIDDHARTH (BOBBY) MEHTA
             HEADS PIRAMAL REALTY                      FORMER DIRECTOR - IISc                                      FORMER PRESIDENT & CEO
             MBA, HARVARD                              AWARDED PADMA SHRI                                          TRANSUNION

             VIJAY SHAH                                                                                            GAUTAM BANERJEE
             EXECUTIVE DIRECTOR,                       DEEPAK M SATWALEKAR                                         SENIOR MD & Co-CHAIRMAN,
             25+ YEARS WITH GROUP                      FORMER MD & CEO,                                            ASIA OPERATING COMMITTEE,
             TURNAROUND BUSINESSES                     HDFC STANDARD LIFE                                          BLACKSTONE, SINGAPORE
Piramal Enterprises Limited – Investor Presentation                                                                               Page 12

Robust Governance Mechanism
                                                               Board of Directors
                                                                                           Legal, Risk, Quality and Compliance teams are
                                                                                       independent and report directly to the Board members

                                                              Board Sub-committees

                 PHARMA                                           FINANCIAL SERVICES              HEALTHCARE INSIGHT & ANALYTICS

                                                  5 Investment Committees for Real Estate
                                                       Lending, RE Fund Management,              Healthcare Insight & Analytics
    Pharma Operations Board
                                                  Corporate Finance Transactions, Emerging                   Board
                                                   Corporate Lending and Housing Finance
                                                  •   Executive Directors
• Executive Directors                             •   Independent Directors                   • Independent Director
• Key Business CEOs                               •   Financial Services CEO                  • Business CEO
• External Experts                                •   External Experts                        • External Expert
                                                  •   Business Vertical Heads
Piramal Enterprises Limited – Investor Presentation   Page 13

Top Institutional Investors invested in the company
Piramal Enterprises Limited – Investor Presentation                                                                        Page 14

Strategic partnerships

   Total AUM - €479 Bn                          Total AUM - US$37 Bn         Total AUM - C$317 Bn       Total AUM - C$60 Bn

    Alliance Partner –                           Alliance Partner –            Alliance Partner –       Alliance Partner –
 Infrastructure Financing                    Distressed Asset Investing       Real Estate Financing    Real Estate Financing

 Total AUM – US$22 Bn                          Market Cap - US$62 Bn         Market Cap - US$66 Bn    Market Cap - US$113 Bn

       PEL invested in                                  JV Partner              PEL had invested       Acquirer – Domestic
       Shriram Group                                                           in Vodafone India      Formulations Business

Note: Market Capitalisation data as on 2nd Aug 2018. Source: Yahoo Finance
Piramal Enterprises Limited – Investor Presentation                                                                                                    Page 15

  Values Create Value
                                                                                                                        Tenured Leadership
                                      Partnerships

                  Long term partnerships with financial and                                               Professional management team
                  operational partners
                                                                                                          Experienced leadership with domain expertise
                  Pharma business developed through relationships
                  Long-standing relationships with global partners
                  including Allergan (JV since 1996), Bain (JV for
                  distressed debt)
                                                                                                                Alignment with Minority Shareholder Interests
                                                                             Knowledge
                                                                     Financial Services
                                                                             Action                            Largest effective promoter shareholding among
                                                                             Care                              Financial Institutions
                                                                             Impact                            No equity investments of Promoters outside of
                           Shriram –Shared Vision
                                                                                                               Piramal Group
           Retail exposure through investments in Shriram                                                      No inter-group lending to Piramal Realty
           Group
                                                                                                               ESOP program funded by Promoters since 1996
           Opportunity to invest in Shriram Group emerged due
           to matching set of values
           Mr. Ajay Piramal is the Chairman of Shriram Capital
                                                                                         Business Ethics, Integrity and Corporate Governance

                                                                                          32 US FDA Inspections cleared since 2011
                                                                                          High asset quality – GNPA1 of 0.3% in Q1 FY2019
                                                                                          Reputed and experienced Board
Note:
(1) Based on 90 days past due (DPD)
Piramal Enterprises Limited – Investor Presentation   Page 16

Financial Services
Piramal Enterprises Limited – Investor Presentation                                                                                                                       Page 17

   Diversified exposure across both wholesale and retail financing

                                                                                      Financial Services

                                   Wholesale business                                                       Retail business                          Distressed Asset Platform

                      Lending                            Alternative AUM                    Housing Finance               Investments in Shriram            India Resurgence Fund
                   Loan Book –                                AUM –                          Loan Book –                   Total investments –               JV with Bain Capital
                   Rs. 45,391 Cr                            Rs. 7,620 Cr                     Rs. 1,604 Cr                      Rs. 4,583 Cr                         Credit

  Real Estate          CFG                  ECL           Real Estate           CFG                              SCL               STFC              SCUF
    Loans -          Loans –            Loans –             AUM –             AUM –
 Rs.34,814 Cr      Rs.9,414 Cr        Rs.1,163 Cr                                                             20% stake         10% stake          10% Stake
                                                          Rs.5,790 Cr       Rs. 1,830 Cr

CFG – Corporate Finance Group;                    ECL – Emerging Corporate Lending;               HFC – Housing Finance Company;            SCL – Shriram Capital Limited;
STFC – Shriram Transport Housing Finance;         SCUF – Shriram City Union Finance

                       Strong portfolio with a total investments, loans and assets under management of over Rs.59,000 Crores
Piramal Enterprises Limited – Investor Presentation                                                                                                                                                                              Page 18

Building a robust and scalable financial services platform….
Continued scaling up of loan book

                                                                                                                                                                                                                                    22,400
(in Rs. Crores)
                                                                                                      Outstanding loan book                             Loans approved but yet to be disbursed

                                                                                                                                                                                                                           42,168
 •         Total Loan Book grew 64% YoY to Rs. 46,995 Crores as on 30 June 2018; Rs. 22,400
           Crores of loan approved but yet to be disbursed

                                                                                                                                                                                                                  38,036
 •         Long term debt instruments of PCFHL were rated ‘AA+; Stable’, they were earlier

                                                                                                                                                                                                         33,261
           rated ‘AA; Stable’ by CARE Ratings for the erstwhile company

                                                                                                                                                                                                                                    46,995
                                                                                                                                                                                                28,648
 •         Robust asset quality :
                                                                                              Financial Services

                                                                                                                                                                                       24,975
              — Gross NPAs ratio (based on 90 dpd) remained stable at 0.3% in Q1 FY2019

                                                                                                                                                                              22,651
                                                                                                                                                                     19,640
              — Provisioning maintained at 1.8%

                                                                                                                                                            15,998
                                                                                                                                                   13,338
                                                                                                                                          11,069
                                                                                                                                 9,020
                                                                                                                        7,611
                                                                                                               4,766
                                                                                                      3,933
                                                                                             3,602
                                                                                    3,193
                                                                           2,861
                                                         2,650

                                                                  2,590
                                                2,588
                                       2,016
                              1,349
                     812
            498
  350
  Mar-12

                                       Mar-13

                                                                           Mar-14

                                                                                                               Mar-15

                                                                                                                                                   Mar-16

                                                                                                                                                                                       Mar-17

                                                                                                                                                                                                                           Mar-18

                                                                                                                                                                                                                                    Jun-18
            Jun-12

                                                Jun-13

                                                                                    Jun-14

                                                                                                                        Jun-15

                                                                                                                                                            Jun-16

                                                                                                                                                                                                Jun-17
                                                                                             Sep-14
                     Sep-12

                              Dec-12

                                                         Sep-13

                                                                  Dec-13

                                                                                                      Dec-14

                                                                                                                                 Sep-15

                                                                                                                                          Dec-15

                                                                                                                                                                     Sep-16

                                                                                                                                                                              Dec-16

                                                                                                                                                                                                         Sep-17

                                                                                                                                                                                                                  Dec-17
 Alternative Assets Under Management was Rs. 7,620 Crores as on 30 June 2018
Piramal Enterprises Limited – Investor Presentation                                                                                                                                    Page 19

   ….through consistently expanding product portfolio
                                                                                                                                                                                     +11
                                                                                                                                                                               Loan against property
                                                                                             Total no. of products - 22                                                       Top-up on existing loan
                                                                                                                                                                                     Small CF
                                                                                                                                                                                  Home loans
                         Alternative Asset
                                                                 Real Estate                                                                                                   Loan against shares
                           Management
                                                                                                                                                                              Loan against property
                        Corporate Finance                   Emerging Corporate
                                                                 Lending                                                                                                           Senior debt
                                                                                                                                                                              Working Capital term
                      India Resurgence Fund                    Housing Finance                                                                                                        loan
                                                                                                                                                                                 Capex Funding
                                                                                             Financial Services                                                                 Promoter Funding
                                                                                                                                                           +3                    Project Finance
Products added

                                                                                                                                                     India Resurgence Fund    India Resurgence Fund
                                                                                                                                                      Acquisition Funding      Acquisition Funding
                                                                                                                                     +2             Lease Rental Discounting Lease Rental Discounting
                                                                                                                            Corporate Finance - AUM Corporate Finance - AUM Corporate Finance - AUM
                                                                                                            +3                   Senior Lending         Senior Lending          Senior Lending
                                                                                                      CF - Commercial           CF - Commercial         CF - Commercial         CF - Commercial
                                                                                                      CF - Residential          CF - Residential        CF - Residential        CF - Residential
                                                                                     +1             Loan Against Shares       Loan Against Shares     Loan Against Shares     Loan Against Shares
                                                                         Mezzanine & Structured    Mezzanine & Structured    Mezzanine & Structured Mezzanine & Structured Mezzanine & Structured
                                                          +1                    Lending                   Lending                    Lending                 Lending                 Lending
                            1                   Mezzanine Lending         Mezzanine Lending         Mezzanine Lending          Mezzanine Lending       Mezzanine Lending       Mezzanine Lending
                    Real Estate – AUM               Real Estate – AUM          Real Estate – AUM     Real Estate – AUM         Real Estate – AUM       Real Estate – AUM        Real Estate – AUM

                         FY2006                        FY2012                      FY2013                FY2015                    FY2016                  FY2017                     FY2018
                 Note : CF – Construction Finance
Piramal Enterprises Limited – Investor Presentation                                                                                           Page 20

 Enhancing diversification in the lending portfolio; significantly lowering overall risk profile
  Trend of changing portfolio mix (%)
                    Mezzanine RE                                       RE Construction Finance - Residential      RE Construction Finance - Commercial
                    RE Lease Rent Discounting                          Corporate Finance Group                    Emerging Corporate Lending
                    Housing Finance

   Total                 7,611                11,069                   15,998          22,651            28,648             38,036           46,995
(In Rs. Crores)

    100%
                   17%     15%       15%        12%         16%         12%      15%     12%      15%      13%
                                                                                                                     18%      17%
                                                 6%                     5%                7%                                          19%     20%
      80%          4%                                       6%                   7%                        6%
                           18%                                                                     8%                         10%
                                     23%                                                                              9%              9%       9%
                                                28%                                                                            7%
                                                            34%         38%                                                           6%       7%
      60%                                                                        40%     44%
                                                                                                  43%      46%
                                                                                                                     39%
                                                                                                                              40%     40%
      40%          76%                                                                                                                        39%
                           65%       59%        53%
      20%                                                   44%         45%
                                                                                 38%     35%      29%      30%       29%      24%     21%     19%
        0%
                  Mar-15 Jun-15 Sep-15 Dec-15 Mar-16 Jun-16 Sep-16 Dec-16 Mar-17 Jun-17 Sep-17 Dec-17 Mar-18 Jun-18

 Note : RE – Real Estate; CFG Loan book includes old education loans
Piramal Enterprises Limited – Investor Presentation                                                                                                                           Page 21

   Strong trend of growth in income; maturing of the book
  Rapidly growing income from Financial Services business                                         Strong trend of cumulative exits / repayments1,2
  (in Rs. Crores)                                                                                 (in Rs. Crores)
                                                                            4,981                                                                                                  28,948
            6 yrs CAGR 60%
                                                                                                           Loan Book

                                                                                                           Asset Management

                                                                 3,352
                                                                                Financial Services
                                                                                                                                                                          13,625

                                                     1,740
                                                                                                                                                               8,531

                                           937                                                                                                     4,799
                               726
        297        389                                                                                                                 2,150
                                                                                                                830        1,027
                                                                                                    223

       FY12        FY13       FY14        FY15        FY16       FY17        FY18                  FY11        FY12        FY13        FY14        FY15        FY16        FY17    FY18

Notes:
1. FY2016, FY2017 & FY2018 numbers are as per IND AS and prior period are as per IND GAAP.   3.   Exits from Asset Management business have been included on calendar year basis
2. Excludes our investment in Vodafone India, which was exited during FY2015
Piramal Enterprises Limited – Investor Presentation                                                                             Page 22

Consistently expanding loan book across segments
Rapidly growing Real Estate (incl. Housing Finance) loan book               Strong growth in Corporate Finance and ECL portfolio
(in Rs. Crores)                                                             (in Rs. Crores)
                                                                                                                         9,125
                                                              33,043
                                                                               3 yrs CAGR 126%
        5 yrs CAGR 88%

                                                    21,209   Financial Services

                                                                                                           3,766
                                        11,166
                                                                                                 2,172

                            3,972
                                                                                  794
    1396        1568

   As on       As on       As on       As on       As on      As on           As on          As on        As on         As on
  Mar 2013    Mar 2014    Mar 2015    Mar 2016    Mar 2017   Mar 2018        Mar 2015       Mar 2016     Mar 2017      Mar 2018
Piramal Enterprises Limited – Investor Presentation                                                                                         Page 23

 Real Estate end-to-end financing model
                                            Private              Mezzanine              Construction           Lease Rent               Housing
     Particulars
                                            Equity                Lending                 Finance              Discounting              Finance
                                                              Post land purchase till
                                                                                                                 Lease rental
Stages of lending for a                Primarily for land       commencement of         For construction of                           Providing housing
                                                                                                                discounting for
       project                             purchase           construction (Phase of         projects                               loans to home buyers
                                                                                                              commercial projects
                                                               obtaining approvals)
                                   Off Balance Sheet (Third
                                    Party Funds with PEL                                                                             On Balance Sheet
      Current Size                  sponsor commitment          On Balance Sheet         On Balance Sheet     On Balance Sheet
                                          upto 7.5%)
                                        Started in 2006;
Year of commencement                   acquired by PEL in              2011                   2015                  2016                   2017
                                              2011

      Current Size                       Rs.5,151 Crores          Rs.8,974 Crores        Rs.21,561 Crores      Rs.4,279 Crores         Rs.1,604 Crores

       Yield / IRR                           20-24%                  14-17%                  13-15%                9-11%*                 9-11%*

           Tenor                            4-6 years                3-5 years              4-6 years            7-15 years             20-30 years

* To down-sell a portion of the portfolio to maintain ROE
Piramal Enterprises Limited – Investor Presentation                                                                                                              Page 24

     How will we grow rapidly and create a sizeable HFC?
 Significant opportunity from existing developer                                Leveraging Brickex                               Focusing on Tier II and Tier III cities
                  relationships
   130+
 Developers       Particulars                 Unsold Total                                                                   Targeting to open 24 branches by 2020
                  (Rs. 000‘ Crores)           Value1 Value1
                                                              10,000+ Distributors          Brickex is India’s leading
                 Total projects financed by                                                B2B aggregation platform
                                                60    118
                 PEL                                                                           focusing on sales &
                 Total projects with
                                                                                           marketing of Real Estate                                              Tier I
   382+                                        151    296                                    and Financial Services
  Projects       developers (PEL customers)                                                                                    50%                50%
                                                                                           products with a network
                                                                                            of 10,000+ distributors                                              Tier II & III
                      Tapping even a portion of the
                   existing developers’ customer base                                           across Tier I cities
                   can create a significant opportunity

       Extending loans to the self-employed                             LAP, Small Construction Finance                                   Affordable housing

                                                              Small Construction Finance
                                                                                                                         •    Our development partners entering affordable
                                   Salaried                   •   Target top developers in Tier II & III cities               segment
                                     30%                      •   Leveraging Brickex for market insights / sourcing            o To selectively fund based on existing
                          FY2020                              Loan against property (LAP)                                        relationship

                                                              •   To enter the market through Piramal ecosystem          •    Higher margins with selective use of
                     Self-employed                                                                                            syndication/down selling
                           70%                                •   Specialised underwriting cell for self-employed

Note: 1) Values are based on Sept 2017
Piramal Enterprises Limited – Investor Presentation                                                                                  Page 25

HFC : Measures to reduce costs and enhance returns
           Hub and Spoke model (Branch light)                                            Latest technology

                        •    Consistency in decision making                          •   Leveraging Fintechs, etc.
                        •    Better control                                          •   Transparency on application status
                        •    Scalability with optimum cost                           •   Quick turnaround time

            Leveraging group’s shared services                        Sourcing from developers (B to B to C Model) and Brickex

                        •    Manage non-core activities efficiently                 •    Lower cost compared with DSAs, connectors, etc.
                        •    Greater economies of scale                             •    Properties sold through Brickex will be referred to
                                                                                         our HFC for loans – low cost of sourcing

       Usage of data, analytics and bureau insights                         Diversification and expected rating upgrade

                       •     For setting up credit policy framework                 •    Improve leveraging capability

                       •     For early warning signals                              •    Reduce cost of borrowings
                                                                                    •    Enhance ROE for overall Financial Services
Piramal Enterprises Limited – Investor Presentation                                                                                                        Page 26

Corporate Finance Group
                 • Diversified offering across sectors including senior debt,
 Type of                                                                                             • Average tenure of around 5-6 years and lock in period
                   project finance, acquisition finance, promoter finance,            Tenure
 product                                                                                               for 1-2 years.
                   and mezzanine investments

                 • Mostly first charge & escrow on existing / future
Nature of                                                                             Security
                   revenues, fixed / movable assets, pledge of shares,                               • 1.5-2x times
 security                                                                              cover
                   corporate guarantee, etc.

                 • Loan book grew 163% YoY to Rs.9,414 Crores as on 30
Loan book                                                                              Yield         • Yield range widened to 14-17%
                   June 2018

Sector Agnostic
                                                                                                                         Auto
Structured Finance          Renewables        Infra        Cement        E’tainment       Services        Telecom                      Logistics      Others
                                                                                                                       Component
Transactions

Senior lending                                                                                                           
Promoter funding                                                                                                                                      
Loan against shares                                                                                         
Mezzanine lending                                                                                                                       
Project Finance                  
Piramal Enterprises Limited – Investor Presentation                                                                          Page 27

Launch and progress of Emerging Corporate Lending
          Target segments
 Financing requirements of emerging and mid-market companies

          Products offered
 Senior Debt, Loan against Property, Lease Rental Discounting, Promoter Financing, Structured Debt, Loans against Shares etc.

              Ticket size
 Offering solutions with ticket size ranging from Rs.10 Crores to Rs.125 Crores

    Sector-agnostic platform
 Funding diverse sectors including auto ancillaries, manufacturing, pharma, services, hospitality, etc.

             Risk profile
 Low Risk Portfolio with deals backed by cashflows

           Progress so far
 Loan book of Rs.1,163 Crores as on 30 June 2018; disbursed Rs.257 Crores during Q1FY2019
 Set up team of 21 people including underwriting, investment, dedicated business operations, legal and asset management functions
 For deal origination, senior relationship managers are based in Mumbai, Delhi, Chennai, Hyderabad, Pune and Ahmedabad
   — Bangalore to be staffed in Q2FY2019
Piramal Enterprises Limited – Investor Presentation                                                                                        Page 28

Borrowing profile
                                                    PEL Financial Services Borrowings Mix
                   Funding mix by investor                                           Funding mix by type of instrument

             35%                             Banks                                                                       Term loans
                                                                                                   22%
                                  6%                                               26%
                                             Mutual Funds
                                                                                                                         NCDs / Bonds
               As on                         Insurance/Pensions/PFs                       As on
                                    7%
              30 June                                                                    30 June           7%            Commercial Paper
                                             Others
               2018                2%                                                     2018                           Others
                                             FIIs
                                   1%                                                                    1%
                                             NBFCs                                                                       Tier II
             49%                                                                          44%

                                                              As on 30 June 2018
                                 Tenure-base                                                Fixed vs. Floating
                                                Short Term
                                   35%          Borrowings                                                       Floating
                                                                                                   43%
                                                Long term                           57%                          Fixed
                       65%                      Borrowings
Piramal Enterprises Limited – Investor Presentation                                                                          Page 29

Merger of Piramal Finance and Piramal Capital with Piramal Housing
Finance
             Before Merger                                 Restructuring Mechanics                          After Merger

                                                    Issue of shares
                    PEL                                  to the              PEL                                PEL
                                                    shareholders of
                        100%                                                   100%
                                                      PFL and PCL
                                                                                                                   100%

    PFL                           PCL                            PFL                   PCL                     PHFL
        100%
                                                                      100%
                                                                                                    PHFL’s name has been changed to
  PHFL                                                          PHFL
                                                                                     PFL & PCL         Piramal Capital & Housing
                                                                                   merged in PHFL            Finance Limited

Note :
PEL – Piramal Enterprises Ltd.               PCL – Piramal Capital Ltd.
PFL – Piramal Finance Ltd.                   PHFL – Piramal Housing Finance Private Ltd.
Piramal Enterprises Limited – Investor Presentation                                                                         Page 30

Synergies from the merger
    Improve profitability and risk adjusted returns                                        Enhance lender base

  Synergies expected to improve the annual ROE of the                      Open up avenues for combined entity to raise funds from
Financial Services business by 2-3% in the next few years                                   diversified lenders

             Improvement in credit rating                                              Optimum capital adequacy
                                                             Synergies
Diversified portfolio comprising both retail and wholesale     from
                                                                               Optimum capital adequacy will improve returns
                shall improve credit rating                   Merger

             Reduction in borrowing cost                                  Higher allocation from Mutual Funds on lending to HFCs

  Borrowing cost expected to go down by 25 to 50 basis                     Mutual Fund can lend higher amount to HFCs as against
                        points                                                     NBFCs (40% vs. 25% of overall lending)

                     Merger to improve ROE of Financial Services business in a range of 2-3% every year
Piramal Enterprises Limited – Investor Presentation                                                  Page 31

Performance metrics
PEL Financial Services (excluding Shriram) performance against various parameters
     Particulars                                                                       Q1 FY2019
     Total Loan Book size                                                           Rs. 46,995 Crores
     Total Equity in Loan Book and AUM business                                     Rs.9,855 Crores
     Average Yield on Loans                                                              13.9%
     Average Cost of Borrowings                                                           8.5%
     Net Interest Margin                                                                  7.1%
     Cost to Income Ratio                                                                18.0%
     Total Provisioning                                                                   1.8%
     Gross NPA ratio (based on 90 dpd)                                                    0.3%
     ROA                                                                                  3.6%
     ROA (considering Cash Tax and other synergies from merger)                           4.2%
     ROE                                                                                  17%
     ROE (considering Cash Tax and other synergies from merger)                          19%+

    Note: Provisioning numbers are in line with IND AS
Piramal Enterprises Limited – Investor Presentation                                                                                                           Page 32

Consistently delivering exceptional performance quarter after quarter
Trend of key ratios
                                      FY2016                                     FY2017                                     FY2018                        FY2019
                         3M         6M        9M        12M        3M         6M          9M       12M        3M          6M         9M        12M           3M
Loan Book              138%        150%      181%       180%      110%       118%       105%        87%       79%        69%        68%        69%           64%
Growth (%)1

GNPA Ratio (%)          1.5%       1.1%       1.2%      0.9%      0.6%        0.4%       0.5%      0.4%       0.2%       0.2%       0.4%       0.3%         0.3%

ROE (%)                 25%+       25%+      25%+       25%+      25%+       25%+       25%+       25%+      25%+       25%+        21%2       19%2         19%3

Note :
1. As on end of reported period
2. ROE calculation also takes into account the capital allocation from recent fund raise. During Q3 FY2018, Rs 2,300 Crores was allocated to financial services.
    In Q4 FY2018, the entire Rs.5000 crores of estimated allocation got allocated towards financial services business
3. ROE considers cash tax and includes other synergies on account of merger of subsidiaries in Financial services segment
Piramal Enterprises Limited – Investor Presentation                                                                                             Page 33

Performing better than the best performing banks and NBFCs of India
                                                                                                                            25%
      X-axis : FY2018 Gross NPA Ratio (%)
      Y-axis : FY2018 ROE (%)
      Size of the circle : FY2018 Loan book growth (%)
                                                                                                                            22%
                                                                                                                   PEL
         PEL’s Financial Services business
         Banks & NBFCs

                                                                                                                                   FY2018 RoE (%)
                                                                                                                            19%

                                                                                                                            16%

                                                                                                                            13%

                                                                                                                             10%
             2.5%                      2.0%                       1.5%                       1.0%           0.5%         0.0%
                                                           FY2018 Gross NPA ratio (%)
Note: Banks and NBFCs includes Bajaj Finance, HDFC Ltd, HDFC Bank, Kotak Bank, IndusInd Bank and Yes Bank
Piramal Enterprises Limited – Investor Presentation   Page 34

Measures to ensure healthy asset quality
Piramal Enterprises Limited – Investor Presentation                                                                                            Page 35

Review and governance mechanism
                                                              Board of Directors
                                                                                                                Legal and Risk teams are
                                                                                                           independent and report directly to
                                                       Board Sub-committee for Financial Services                 the Board members
                                                This sub-committee comprise of Executive Directors,
                                                      Independent Directors & External Experts

     5 Investment Committees for Real Estate Lending, RE Fund Management, Corporate Finance Transactions, Emerging Corporate Lending
                                                            and Housing Finance

  These investment committees comprise of Executive Directors, Managing Director, Independent Directors, External Experts and Business Heads

                                                               Deal Clearance Committee

   Independent Risk                  Independent
                                                                Asset Management Team          Finance & compliance            Brickex
  Management Team                     Legal Team

                                                              Investment Teams
Piramal Enterprises Limited – Investor Presentation                                                                                            Page 36

Stringent controls across stages of lending
                                                             Controls at Pre-qualification stage
                                                                                                Real Estate lending in Tier I cities of
                                                                                               Mumbai, Pune, Bengaluru Hyderabad,         98%
                    Presence in only Tier 1 cities                                                      Chennai and NCR

                    ‘Grade A’ developers having strong track record                              Portfolio comprising of Grade A
                                                                                                             Developers
                                                                                                                                          70%+

                                                              Controls at Pre-approval
                                                            Financial     Services stage
                    Sensitivity analysis not just based on sales and cost but also based
                                                                                               Deals with underwriting assumptions
                                                                                               based also on delay in velocity by 6 to    100%
                     on velocity
                                                                                                            12 months
                    Proprietary risk scoring system to avoid bias
                                                                                                       Deals with Escrow A/C              100%
                    Structuring each transaction uniquely to address any specific risks
                     associated with the project                                               Deals with a ‘Minimum Selling Price’
                                                                                                clause ensuring collection of sales       100%
                    Strategic alliances with global funds serving as external validation of        value into our Escrow A/C
                     underwriting and reassures investment thesis
                                                                                                Deals with fixed IRR & obligation to
                    Security and cash cover of 1.5x-2x based on conservative                   pay without any linkage to market         62%
                     underwriting assumptions                                                    performance or sales realization
Piramal Enterprises Limited – Investor Presentation                                                                                  Page 37

Constant asset monitoring ensuring healthy asset quality
         Developers                   130+               Transactions                 239+              Projects pan India           382+

                                                                                                      Site Visits / month            190+

            Constant monitoring by local teams in each city and dedicated asset              Developer sales MIS monitored per
             monitoring team                                                                                month                    100%
                                                   Financial Services
                   — Monthly / Quarterly site visits to assess the project progress           Project escrow Accounts monitored
                                                                                                           per month                 100%
                   — Monthly performance review with regard to sales units, value &
                     price, collections and various costs                                    Transaction coverage in Early Warning
                                                                                                        Signal Meetings              100%
                   — Computation of monthly cash cover to ensure adherence to
                     stipulated cash cover                                                    Projects under construction stage /
                                                                                                          completed                  80%

                                                       Gross NPA ratio of 0.3%
Piramal Enterprises Limited – Investor Presentation                                                                            Page 38

Sample images of the construction sites - Proof of site visits with date
and time
   Oct’16 – RCC work in progress                          Apr’17 – façade work in progress    Dec’17 – façade work nearing completion

                                                           Financial Services

                                                    Monthly construction progress monitored
Piramal Enterprises Limited – Investor Presentation                                                                                                                               Page 39

  Sample of Site Visit Report
                            Expected
Tower Name                                      Dec 07, 2016              Nov 23, 2016              Oct 20, 2016            Sep 20, 2016             Aug 16, 2016              Jul 18, 2016
                         completion date

 No. of Labours on
                                                  400 - 425                 400 - 425                 400-425                  430-450                  360-380                  310-330
 site

 Tower 1 : 4B + G + 22
 Flr.
                                                                           Financial Services
                                            Work in progress on        Work in progress on      Work in progress on      Work in progress on      Work in progress on      Work in progress on
 RCC                       Mar, 2017
                                            18th and 19th floors           18th floor.           14th & 15th floor.       12th & 13th floors.      9th & 10th floors.       6th & 7th floors.

 Block Work                 Jun, 2017      12th floor in progress.     9th floor in progress.   6th floor in progress.   4th floor in progress.   3rd floor in progress.   2nd floor in progress.

                                           Gypsum started on 1st
 Plastering / Gypsum        Sep, 2017                                            -                        -                        -                        -                        -
                                               and 2nd floor.

                                            Awaiting for material
 Flooring                   Dec, 2017      to start with flooring in             -                        -                        -                        -                        -
                                                  next week.

 Finishes                   Jun, 2018                  -                         -                        -                        -                        -                        -

                          Dashboard of site visits and stalled projects separately highlighted to the MD on a monthly basis
Piramal Enterprises Limited – Investor Presentation                                                                                  Page 40

 Sample of overall Portfolio Performance Review Sheet
O/s Summary (Rs crs)
                                                                   No. of                      Pune /  Bengaluru /
Category                                                                        Mumbai                                 NCR   Chennai   Total
                                                                   Deals                     Ahmedabad Hyderabad
 Green
   – No Issue over next 6 months
 Yellow
   – No issue ; however, closely monitor for next 6 months
 Orange
   – Envisage stress over next 6 months
                                                                 Financial Services
 Red
   – Default
Total
 Note: Colour coding is done after factoring in the project performance vis-à-vis budget on the following parameters

 1.   Sales Velocity in terms of units, area and value
 2.   Pricing – per sq ft and ticket size
 3.   Collections
 4.   Approval timelines
 5.   Construction cost incurred
 6.   Cash cover
 7.   Ability to meet principal and interest obligations
 8.   Site visit findings
Piramal Enterprises Limited – Investor Presentation   Page 41

Distressed Investment Opportunity
Piramal Enterprises Limited – Investor Presentation                                                                                                                                                               Page 42

    Distressed Investment Opportunity
                                         Industry Overview                                                                                        Our Differentiated Positioning and Strategy
 Stressed Loans (% of Bank Loans in India)1
                       GNPA        Restructured                                                                                                                           Board and          Sponsors track
                                                                                                                                                                         investment             record in
                                                                                                                                                                         committee             turnaround
                                                       12.5%                                                                                                              with deep
     9.1%                                                                                                                                                                                     investments
                                                                                                                                                                           insights
                             Mar '13                                            Mar '18                                                                 Flexible and
                                                                                                                                                                                                              Preferential
                                                                                                                                                          efficient
•    India must resolve its NPL problem (~USD 220-250 Bn) to fund new asset                                                                             investment
                                                                                                                                                                                                                access to
     creation (key for maintaining 6-7% GDP growth); 11 banks placed in PCAP3                                                                                                                                 stakeholders
                                                                                                                                                          structure
•    RBI firm on ensuring that Debt Restructuring schemes are viable (rated
     investment grade), else pushing banks to recover via IBC/cash settlement                                                                                        Ability to carry              Tailored
•    Stress lies in industrial sectors (power, steel, cement), export businesses                                                                                       out deep                  investment
                                                                                                                                                                                                  approach
     (textiles, pharma) & domestic underfed sectors (hospitals, hotels)                                                                                                 business
                                                                                                                                                                       diligence
•    Enforcement via IBC has been slower than anticipated due to litigations &
     delays in hearing; however both these issues are getting addressed

                           Overview of India Resurgence Fund                                                                                                              Progress so far
                   •    Investment across the capital stack (debt and equity) & across
                                                                                                                               •    Active pipeline of ~USD 1 Bn of debt (to be acquired through IBC/directly
 Product                all sectors (other than real estate), with a view to drive control
                                                                                                                                    from banks) across various sectors such as cement, chemicals, steel, etc.
                        and restructuring with active participation in turnaround
                                                                                                                               •    The fund has received SEBI AIF approval for investing
                   •    Partnership with Bain Capital Credit, a multi-asset alternative                                        •    The partnership has also received in-principal approval from the RBI for
  Partner
                        investment firm with AUM of USD 37 Bn2                                                                      setting up an Asset Reconstruction Company
Note 1: Source: RBI Financial Stability Report
Note 2: Data estimated as of January 1, 2018. Bain Capital Credit AUM includes Bain Capital Credit, LP, its subsidiaries and credit vehicles managed by its AIFM affiliate.
Note 3: PCAP stands for RBI’s Prompt Corrective Action Plan under which various restrictions were imposed on certain banks by RBI (including on lending), with the objective of restoring their financial health
Piramal Enterprises Limited – Investor Presentation   Page 43

Partnership with Shriram – Strategic in nature
Piramal Enterprises Limited – Investor Presentation                                                                                                                 Page 44

 Partnership with Shriram – Strategic in nature
Acquired ~10%                Acquired 20%                  Acquired ~10%                 Total
 stake in STFC                stake in SCL                  stake in SCUF           investments in     •     Market capitalization of c. Rs.                 443 bn
   Invested                     Invested                      Invested              Shriram Group            (US$6.6bn) for listed entities1,2
Rs.1,636 Crores             Rs.2,146 Crores                Rs.801 Crores           Rs.4,583 Crores
                                                                                                       • US$ 21.8 bn3 of assets under
                                                                                                             management
             Share Price Performance since investments (Rs. per share)
                                                                                                       • 3,500+ branches3
    Shriram Transport Finance                               Shriram City UnionServices
                                                                Financial      Finance
                                                                                                       •     Customer base of 19.9+                   mn3
                              1,393                                              1,922                 •     Exposure to retail financing segments
                                                                                                             including: Used and New CVs, Small and
               +93%                                                     +60%                                 Medium Enterprises, Consumer and Gold
                                                                                                             loans, Life Insurance and General Insurance

       723                                                   1,200                                     • Leading player in used Commercial
                                                                                                             Vehicle and Micro, Small and Medium
                                                                                                             Enterprises financing

                                                                                                     Note: FX rate: 1 USD= Rs. 65
                  4                                                     4                            (1) Listed entities include Shriram Transport Finance and Shriram City Union
    10 May 2013            2 Aug 2018                      5 Jun 2014          2 Aug 2018            Finance (2) As of 2nd Aug, 2018 (3) As of 31st March, 2018 (4) PEL’s purchase
                                                                                                     price on the respective date of investment - Doesn’t include related costs in
                                                                                                     acquiring these stakes
Piramal Enterprises Limited – Investor Presentation                                                                         Page 45

Future Roadmap: On track to create one of the largest well-diversified
Financial Services businesses of India
                                            Building an Integrated Financial Services Business
 •   Continue to grow real estate loan book by launching relevant, innovative and customized solutions
 •   Further growing the recently launched products such as commercial construction finance and LRD
 •   Continue to diversify loan book through focus on non – real estate space through Corporate Finance Group and Emerging
     Corporate Lending Group
 •   Scale up Housing Finance through:
      –   Developer relationships through point of presence loan origination
                                                         Financial Services
      –   Brickex network
      –   Enter into tier I and tier II cities
 • Maintain focus on asset quality while generating higher risk adjusted ROEs
 • Contribute in taking Shriram to the next level
 • Optimize liability franchise
    – Further deepen and diversify funding sources
    – Target credit rating improvement
 • Continue to enhance technology usage to improve efficiency through:
    – Use of analytics for decision making
    – Automation of system and processes to improve Turnaround Time (TAT)
Piramal Enterprises Limited – Investor Presentation   Page 46

Pharma
Piramal Enterprises Limited – Investor Presentation                                                                         Page 47

Pharma business portfolio delivering strong growth within and outside
India
                                                         Piramal Pharma
                                                         FY2018 Rev: Rs.4,513 Crores

                           Global Pharma                                                India Consumer Products
                     FY2018 Rev: Rs.3,976 Crores                                         FY2018 Rev: Rs.537 Crores*
                  • End-to-end manufacturing                                           • Strong portfolio of OTC brands
                    capabilities
                                                                                       • 8 brands among top 100 OTC
                  • 13 manufacturing facilities                                          brands
                  • Portfolio of niche branded generic                                 • Large distribution network
                    products
                                                                                       • Among top 5 OTC players
                  • Distribution to >100 countries
                                                                                       Note * Includes Allergan JV Revenue
Piramal Enterprises Limited – Investor Presentation                                                                                                Page 48

  Eight value accretive acquisitions to boost growth
                                     Global Pharma
                                                                                              Growing largely organically since Abbott deal
        Coldstream (Injectables)                   Injectable anaesthesia & pain
                                                       management products                    Pharma Revenues* (in Rs. Crores)
                                                                                                                                                        4,513
                                                                                                7 yrs CAGR 16%
                                                                                                                                                4,054

                                                                                                                                        3,632
                                                Intrathecal severe spasticity & pain
          Ash Stevens (HPAPI)
                                                      management products
                                                                                                                                3,122
                                                                                                                       2,819

                                                                                                              2,440

                                                                                                      1,988
                                India Consumer Products
                                                                                              1,605
4 brands from Pfizer     5 brands from Organon      Baby-care brand-        Digeplex and
                             India & MSD BV             Little’s          associated brands

                                                                                              FY11    FY12     FY13    FY14     FY15    FY16    FY17    FY18

                                                                                              Notes: * Includes Allergan JV revenues
Piramal Enterprises Limited – Investor Presentation   Page 49

Global Pharma
Piramal Enterprises Limited – Investor Presentation                                                                Page 50

Global Pharma : How are we rapidly moving up the value chain ?
                                1    Acquired global businesses to enter into niche capabilities
                                                   Injectable                 HPAPI

                                    2    Expanding manufacturing capacities in niche areas
             ADC                                   Injectable         Inhalation Anaesthesia       Drug Discovery
Piramal Enterprises Limited – Investor Presentation                                                                                Page 51

    Global Pharma: How are we rapidly moving up the value chain ?
3    Adding differentiated hospital branded generic products              4 Strong product portfolio to leverage global distribution network
     organically and inorganically
       Controlled substances             Injectable Anaesthesia

            Desflurane                         Intrathecal

• Leverage global distribution               network        by   adding   • Entry barrier – Complex to manufacture, sell and distribute
  differentiated products                                                   resulting in limited competition

• Differentiated offerings – Niche branded generics and                   • Expands addressable market size from US$ 1 bn Inhalation
  controlled substances                                                     Anaesthesia market to US$20 bn generic hospital product market
                   Our strategy of moving up the value chain will enable us boost growth and enhance margins significantly
Piramal Enterprises Limited – Investor Presentation                                                                          Page 52

Creating a solid product portfolio
                                                                  Product Portfolio

                                          Injectable Anaesthesia /             Intrathecal Severe
          Inhalation                                                            Spasticity / Pain
         Anaesthesia                         Pain Management                                               Other Products
                                                                                  Management

         Desflurane                                Sublimaze*                      Gablofen®                Generics API

         Sevoflurane                                 Sufenta*                    Products under          Vitamins & Premixes
                                                                                  development

          Isoflurane                                 Rapifen*
                                                                                       Acquired from
                                                                                      Mallinckrodt LLC       Differentiated
          Halothane                                                                     in Mar 2017
                                                    Dipidolor*                                                  branded
     To be launched in FY19                                                           Acquired from             hospital
                                                  Hypnomidate                            Janssen                generics
                                                                                      Pharmaceutica
                                        * Controlled substances                        in Oct 2016
Piramal Enterprises Limited – Investor Presentation                                                                                                Page 53

Integrated in capabilities: Discovery – Clinical Development - Commercialisation

                                                                                                                             On-               Off-
  Discovery           Preclinical           Phase 1           Phase 2                   Phase 3            Launch
                                                                                                                            patent            patent

   CRO                Development (CDMO & Generic API)                                     Late Phase & Commercial (CDMO), Generic API
Discovery        Early Phase API        Early Phase Formulation                Late Phase API (including high                Late Phase Formulation
Ahmedabad,       (including high                                               Potency)                                      (OSD's & Steriles
India            Potency)               Mumbai, Ahmedabad – India                                                            (Injectables & FFS))
                 Ennore,India |         Lexington, KY                          Digwal, India            Aurora, Canada       Pithampur, India | Morpeth,
                 Aurora,Canada |        Grangemouth (ADC), UK                  Ennore, India            Riverview, USA       UK | Lexington, KY |
                 Riverview, USA                                                Morpeth, UK,                                  Grangemouth (ADC), UK

                                                               Special services

                Antibody Drug          High Potent (HPAPIs)   Clinical Trial Supplies        Regulatory, Patents,   Vitamins & Nutrition
              Conjugates (ADC)           Riverview (USA)          Morpeth (UK)               Pharma co-vigilance      Solutions Mahad
              Grangemouth (UK)                                                                    Mumbai                   (India)
Piramal Enterprises Limited – Investor Presentation                                                                                                 Page 54

13 manufacturing facilities both in East and West – All key sites US FDA
inspected
     LEXINGTON                            MORPETH                          MUMBAI                               CHINA
     High potent injectable                API & Formulation               API & Formulations Development       Sourcing Office
     development and manufacturing         Development & Manufacturing
     USFDA                                                                     MAHAD                                 PITHAMPUR
                                           USFDA, MHRA
                                                                               Vitamins & Minerals Premixes          Formulations Manufacturing
        RIVERVIEW
                                                                               USFDA*, WHO-GMP                       USFDA, MHRA
         HPAPI Development &
                                                       GRANGEMOUTH                AHMEDABAD                             DIGWAL
         Manufacturing
                                                       ADC Manufacturing          2 Sites :
         USFDA                                                                                                          2 sites :
                                                       USFDA, MHRA                •   Drug Discovery
          AURORA                                                                  •   Formulation Development           •    API Development & Manufacturing

           API Development &                                                                                                USFDA, MHRA
           Manufacturing                                                                                                •    Anaesthesia Manufacturing
           USFDA, MHRA
                                                                                                                             ENNORE
                                                                                                                              API Development &
                                                                                                                              Manufacturing

                         BETHLEHEM

                         Anaesthesia
                         Manufacturing
                         USFDA, MHRA
Piramal Enterprises Limited – Investor Presentation                                                                               Page 55

  Global Pharma : Strengthening presence in key geographies

                                                      Strong presence in North America               Expanding presence in Europe
Manufacturing Faculties                   • Aurora : API Development & manufacturing          • Grangemouth : ADC Manufacturing
                                          • Lexington : Sterile Development & Manufacturing   • Morpeth : API & Formulation Development &
                                          • Riverview : HPAPI Development & Manufacturing       Manufacturing

                                          • Bethlehem : Anaesthesia Manufacturing
% Global Business Revenues                                                                                         29%
                                                                  38%
(as on 31st Mar 2018)
% Global Business Assets
(as on 31st Mar 2018)                                             24%                                              43%

Distribution Presence                               30% market share in US in Inhalation       Expanding presence in key countries including
                                                               Anaesthesia                               UK, Italy, Germany, etc.

Distribution Model                                      Through direct sales force               Through direct sales force and distributors
Piramal Enterprises Limited – Investor Presentation                                                                                  Page 56

Global Pharma : Strengthening presence in key geographies
                                        Strong presence in India

                                         Manufacturing facilities in India
                                               • Mumbai : API & Formulations Development
                                               • Digwal : API Development & Manufacturing and Anaesthesia Manufacturing
                                               • Pithampur : Formulations Manufacturing
                                               • Ahmedabad : Drug Discovery and Formulations Development
                                               • Ennore : API Development & Manufacturing
                                               • Mahad : Vitamins & Minerals Premixes

                                         33% of Total Assets of Global business is in India

                                        Expanding Presence in Japan

                                         One of the two approved generics in the market for Sevoflurane, with leading market share

                                         Leading market share for Fentanyl with the only currently approved generic in the market
Piramal Enterprises Limited – Investor Presentation                                                              Page 57

How are we performing in the areas of compliance, quality and reliability ?
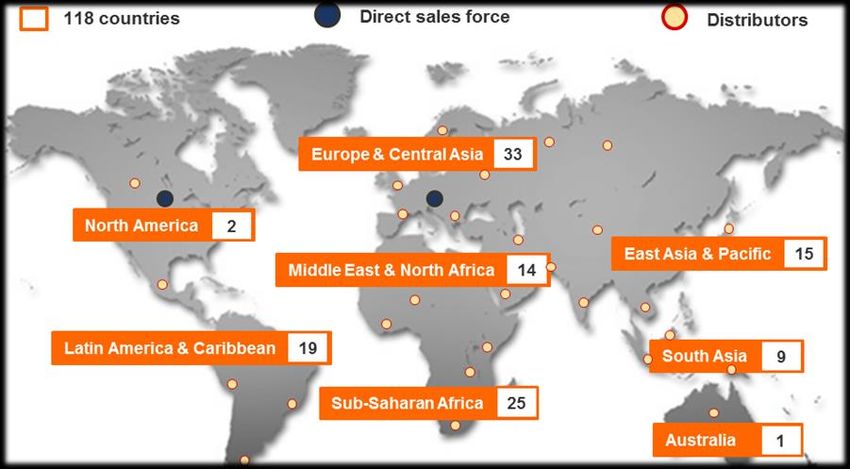
Since 2011, cleared all inspections :                     Recognized at reputed global forums :
                                                            • Global Pharma Services won the CMO Leadership Award 2018
•     32 USFDA inspections                                    in all six categories in March 2018 at New York
                                                            • PEL won the ‘manufacturing Supply Chain Operational
•     106 other regulatory inspections                        Excellence in Pharmaceuticals” at 7th Manufacturing Supply
                                                              Chain Awards in Mumbai - February 2018
•     877 customer audits                                   • PEL won the ‘Regulatory Procedures and Compliance’ award
                                                              at CPhI Pharma Awards (2017) in Germany in Oct 2017
Piramal Enterprises Limited – Investor Presentation                                                                                           Page 58

   Global Pharma : Growth Strategy
• Continue to add more products both organically and inorganically to leverage          Strong revenue growth track record
  our strong sales and distribution network                                             (In Rs. Crores)
      —    Continue to look for acquisition opportunities in complex products
                                                                                            7 yrs CAGR 16%                                           3,976
      —    Launching latest generation Inhalation Anaesthesia i.e. Desflurane
      —    Integrate the acquired products and generate synergies                                                                            3,517
                                                                                                                                     3,206
• Leverage and expand our end to end manufacturing and service delivering
  capabilities (especially in niche capabilities i.e. injectable, HPAPI, ADC etc.)
                                                                                                                             2,765
      —    Good traction for development business and integrated offerings                                           2,506

      —    Injectable and HPAPI acquisitions           will enhance   cross   selling                        2,169
           opportunities
                                                                                                   1,768
      —    Undergoing capex worth over USD 85 mn to expand capacities and
           capabilities across facilities                                                 1,409

• Further expand our presence in strong markets including US, Europe, Japan etc.

• Continue to maintain focus on quality and compliance
                                                                                          FY11     FY12      FY13    FY14    FY15    FY16    FY17    FY18

                        Continue to actively look for organic and inorganic opportunities to enhance growth
Piramal Enterprises Limited – Investor Presentation                                                                                             Page 59

Global Pharma : Enhancing EBITDA Margin
                                                                                                                                              Industry
                                                                                                                                              standard
                                                                                                                                              Margins
                                                                                                                                              20-25%
                                                                                                                                       22%
                                                                                                                  20%

                                                           16%                                  17%
                                                                              16%
                                        14%
                      11%
    10%

    FY11              FY12              FY13               FY14               FY15              FY16              FY17                 FY18    FY20E

•   Acquired high margin products                                                    •   Backward integration for raw materials
•   Introduction and growth of high margin products (including Desflurane etc.)      •   Further leverage global distribution
•   Manufacturing at facilities with niche high-end capabilities                     •   Optimise yields and manufacturing processes
•   Higher capacity utilization                                                      •   Cost improvement initiatives

                                        EBITDA Margins to significantly improve in coming years
Piramal Enterprises Limited – Investor Presentation                                                                          Page 60

Why can we create a large and profitable global pharma business ?

                                                End-to-end                                                             
                                                                                                      Strong focus on
         Significant market                    manufacturing              Investing to move up
                                                                                                    compliance, quality
            opportunity                     capabilities with niche          the value chain
                                                                                                       and reliability
                                                  offerings

                                                                                                                     
         Potential to grow                                                                          Strong presence in
                                             Well-positioned to create a large, well-diversified
        rapidly and expand                                                                         US, Europe, Japan and
                                                  and profitable global pharma business
              margins                                                                                      India

                                                   Offering                                                        
                                                 complete pool
       Growing organically                                                 Strong portfolio of       Large distribution
                                             of services to large &
        and inorganically                                                  niche products and        network reaching
                                              mid sized Pharma
                                                                                services              >100 countries
                                                   Companies
Piramal Enterprises Limited – Investor Presentation   Page 61

India Consumer Products
Piramal Enterprises Limited – Investor Presentation                                                 Page 62

Strong product portfolio
                                            Eight brands among India’s top 100 OTC brands

                       Most brands are among the top two in their respective representative market
Piramal Enterprises Limited – Investor Presentation                                                Page 63

Developed a large India-wide distribution network
     Wide Distribution Network                                            FY2008   FY2012     Now

                                                          No. of towns
                                                            present
                                                                           16       481       2000

                                                          Total Outlet
                                                           presence
                                                                          24,000   200,000   420,000

                                                         Chemist Outlet
                                                           presence
                                                                          16,000   100,000   220,000

                                                          Field Force
Our chemist coverage is now comparable
       with the top 3 OTC players                                           80       800      2,100
Piramal Enterprises Limited – Investor Presentation                                                                                        Page 64

    Adding products organically and inorganically
                            Products added organically                                          Product portfolios added through acquisition

Instant pain relieving mouth     A non-drowsy anti-allergy
          ulcer gel                                              Oil Balance Face Wash
                                        OTC brand
                                                                      & Face Scrub

                                                                                                                               5 brands from Organon
                                                                                               4 brands from Pfizer Ltd            India & MSD BV

A sore throat pain relief                                            Paan flavoured
                                    A pregnancy test kit
        product                                                         antacid

                               Detoxifies the after effects of     Educational game Jungle   Baby-care brand ‘Little’s’   Digeplex and associated brands
   Ovulation test kit
                                      socializing, etc.             Magic Garden Sciencz
Piramal Enterprises Limited – Investor Presentation                                                                                                                           Page 65

  Strong growth track record
                                                                                                                                                                                 1000
   India Consumer Products revenues
   (In Rs. Crores)
             Consumer Products                         Total Revenue                  JV with Allergan1                   Ranks

             9 yrs CAGR 18%                                                                                                                     537              537

                                                                                                                               426
                                                                                                              357
                                                                                             313
                                                                               271
                                          196               220
                          177
    124                                                                                                                                          375              346
                                                                                              209             243              261
                         125              128               138                170
        76
   FY09                 FY10              FY11             FY12                FY13          FY14            FY15             FY16             FY17             FY18             FY20E
        40                 28              14                10                 7              7                 6               6                 5               5               3

• Integration of acquired portfolios                                                            • Tap e-commerce, rural, exports & alternate opportunities
• Continue to add products both organically (including brand extensions) and through            • Addition of new products or brands will leverage the distribution network; and help fixed
  acquisitions                                                                                    cost amortisation resulting in higher margins
• Reduced stock-outs

Note:        1. Allergan JV revenue includes only PEL’s revenue share of 49%
Piramal Enterprises Limited – Investor Presentation                                                                 Page 66

How Consumer Products business can become a significant play for us?

                                                                                         
                                              Significant market         Strong product
                                                 opportunity                portfolio
                                                                                                               
              Significant                                                                        Leverage large
           margin expansion                                                                         India-wide
                                                 Well-positioned to create a large, well-     distribution network
                                               diversified and profitable India Consumer
                                              Products business focusing on niche areas of
                                                          routine disruption                                   
                                                                                                Launching new
           Asset Light model                                                                     products and
                                                                          Acquiring             extensions
                                                                       leading brands or
                                                   Strong track
                                                                          brands with
                                                      record
                                                                      potential to become
                                                                               #1
Piramal Enterprises Limited – Investor Presentation   Page 67

Overall
Piramal Enterprises Limited – Investor Presentation                               Page 68

Our differentiated business model enabling better performance
vs. peers
Revenue Growth Rates of Top Pharma companies

Top Pharma Companies                                          FY16   FY17   FY18
Sun Pharma                                                    4%     11%    (14%)
Lupin                                                         12%    23%    (9%)
Aurobindo Pharma                                              15%    8%      9%
Cipla                                                         22%    6%      3%
Dr. Reddy’s Lab                                               5%     -9%     1%

Cadila Healthcare                                             11%    0%     24%
Glenmark Pharma                                               17%    20%     0%
Jubilant Lifesciences                                         1%     2%     26%
Peers Average                                                 11%    8%      5%
PEL Overall Pharma business                                   16%    12%    11%
Source : Companies reported numbers, Stock Exchange Filings
Piramal Enterprises Limited – Investor Presentation   Page 69

Healthcare Insight & Analytics
Piramal Enterprises Limited – Investor Presentation                                                                             Page 70

Healthcare Insight and Analytics: At A Glance
  Historically viewed as a syndicated healthcare market research company, Decision Resources Group (DRG) has
               transformed itself into a data-driven, technology enabled, healthcare insights business

                                                            •   Where to invest?
We assist our clients in the Pharma, MedTech, Insurance
                                                            •   How to get approved, contracted and paid?
(Payer), and Provider sectors, addressing many of the
most pressing questions in the healthcare industry:         •   How to prove value?
                                                            •   How to drive commercial success?

                                                            •   Market Research
We do this by leveraging a large team of area experts,
                                                            •   Services
Real World Health Data, sophisticated analytics tools and
data science to deliver:                                    •   Data
                                                            •   Analytics

                                                            •   Embedded in our clients’ workflows

We are increasingly:
                                                            •   Delivering critical client solutions, which have a bespoke front
                                                                end, but which are based upon a series of common back-end
                                                                algorithms
You can also read