The Banking Landscape in a Post Election Environment: How Quickly Things Change . . . Or Do They? - Richard L. Quad Senior Managing Director ...
←
→
Page content transcription
If your browser does not render page correctly, please read the page content below
The Banking Landscape in a Post Election Environment:
                 How Quickly Things Change . . . Or Do They?

                                   Richard L. Quad
                             Senior Managing Director
                             Griffin Financial Group, LLC

MEMBER FINRA/SIPC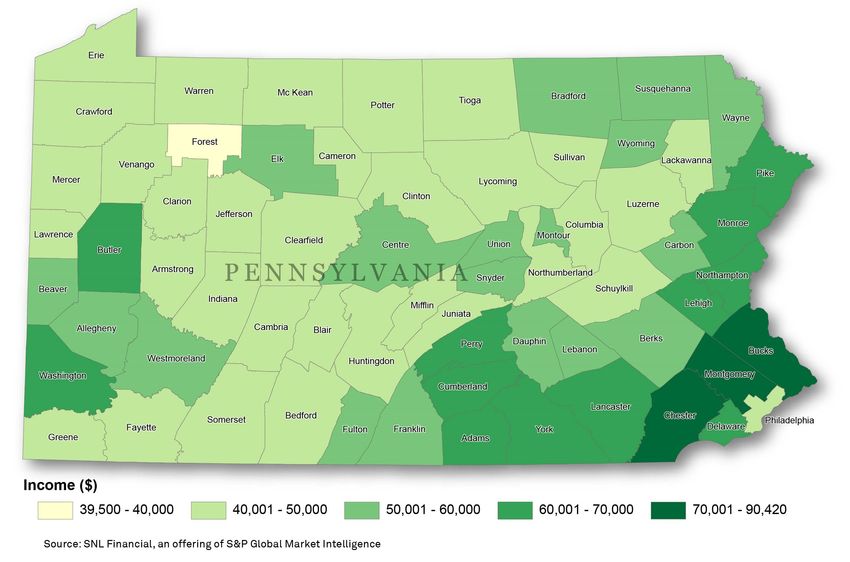
A Busy Year . . . Congratulations to Our Chairman
In a little more than the last year . . .
His bank closed a strategic acquisition in a new market;
His bank converted its entire data processing system;
His bank issued investment grade subordinated debt;
Joe Bower
His bank issued common equity; and . . . . . PBA Chairman
He served as Chairman of the Pennsylvania Bankers Association
Congratulations Joe on a fantastic year as Chairman !
2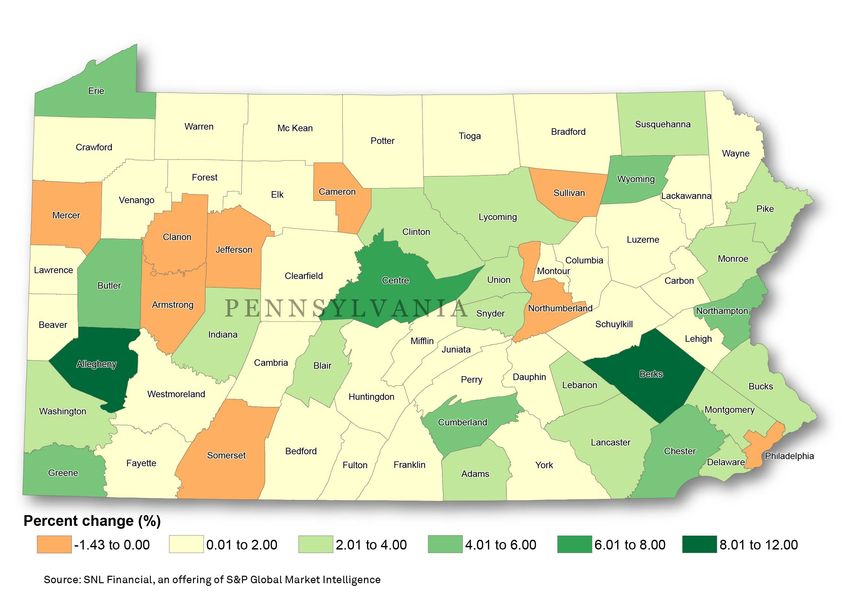
Three Biggest Surprises of the Last Year

 1. Two generational championships . . . in the same year !

                                                              3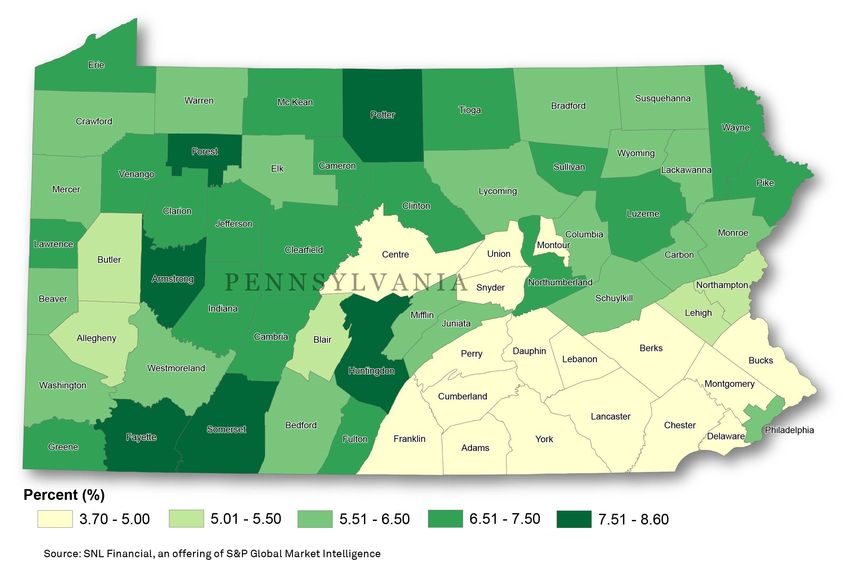
Three Biggest Surprises of the Last Year

 2. Closer to home . . . Penn State, BIG 10 Champions !

                                                          4
Three Biggest Surprises of the Last Year

 3. For the first time since 1988, Pennsylvania votes
    Republican and its electoral votes put Donald Trump
    over the top to victory

                                                          5
Important Disclaimer
Nothing in this presentation is intended to:
Express a political point of view;
Take sides with a political candidate or party;
Support or disagree with the policies of the Trump Administration;
Project outcomes of all things uncertain.
6
A Lot Has Changed in the Trump Administration
Methods of communication
Adds to uncertainty, which can be unsettling;
However, let’s the public hear unfiltered views directly from the President;
Twitter has become a national phenomenon.
Political vocabulary
Cuts through “political correctness”
The political equivalent of SEC “plain English” initiative
Sometimes necessary to backtrack on unintended consequences
The President has been an extremely successful user of social and digital media
7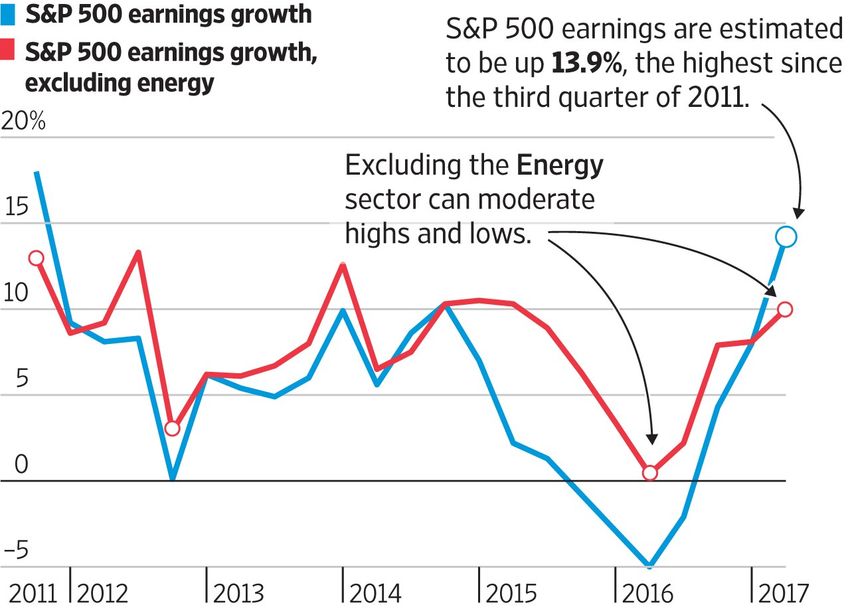
Our Politics Are More Polarizing Than Ever

                                             8
Themes In The New Administration

                              Partisanship
       Volatility

                                                    Growth

                      UNCERTAINTY
  Stimulative
Economic Policy

                                             Likelihood of
                                               progress
                  Interest Rates

                                                             9
Presentation Outline
The Current Environment: Where Are We and How Did We Get Here ?
The Banking Landscape As We Know It
The Bullish View of the Future
The Bearish View of the Future
Summary Observations: What Can We Learn From All This?
An overview of Griffin Financial Group is included in the Appendix.
10The Current Environment:
Where Are We and How Did We Get Here?
11The 2016 Year in Review . . . Before the Election
The 10-Year Treasury began the year at 2.25% and dipped to 1.57% (68 bps) by mid February,
hitting an all time low of 1.34% amid a “lower for longer” rate environment;
An unanticipated affirmative Brexit vote by UK surprised the market in June 2016, although that
surprise was short lived;
Markets eventually calmed as the focused turned to the Presidential election, essentially chilling the
Fed and any prospects of a rate hike prior to December 2016;
Rates recovered with the 10-Year Treasury hitting 1.80% just before the election;
The selection of President Trump was not anticipated, but the “panic” was even shorter-lived than
that of Brexit, with the markets shifting from shock to optimism even before trading began the
following day;
The markets needed to unwind the “Hillary trade” and insert the “Trump trade” which resulted in the
“Trump Bump” creating a solid demarcation point in market prices and record highs across the
board, with the exception of those global companies and industries affected by our anticipated
protectionism:
…Stocks up, bonds down, the curve steepened and the Fed in play
12Where Were We Before the Election?
Reg focus on CRE concentrations encouraging
banks to build capital, change pricing
Jamie Dimon just sounded the alarm on auto loans
The JPMorgan Chase CEO says “someone is going to get
hurt” as financing for autos has flourished in the U.S.
How Worried Should Banks Be About Rise
in Problem CRE Loans?
Warnings of Credit Slippage from Big-Bank Chiefs
The OCC said in its semiannual risk perspective that poor CRE
underwriting amid rapid growth of CRE balances is a worry. "Our
exams found looser underwriting standards with less-restrictive
covenants, extended maturities, longer interest-only periods, limited
guarantor requirements and deficient stress-testing practices,"
Comptroller of the Currency Thomas Curry said during a discussion
of the OCC's report.
13The Impact of the Presidential Election
In ten trading days following the Presidential Election:
The DJIA advanced 3.8%,
The S&P 500 Index advanced 3.0%,
The small cap Russell 2000 advanced 11.7%,
NASDAQ Bank Index soared 18.3%, and
The 10-Year Treasury rebounded 46 basis points
to 2.32%
Price Change (through March 1, peak of election “bump”)
35%
Asset Size Stock Price Change
30%
2016 thru Election to
25% election March 1st
20% > $50 billion 5.4% 33.7%
15%
$10 billion - $50 billion 7.6% 30.2%
$5 billion - $10 billion 10.8% 31.5%
10%
$1 billion - $5 billion 8.2% 30.2%
5%
< $1 billion 8.8% 21.0%
0%
< $1 billion $1 - 5 billion $5 - 10 billion $10 - 50 billion > $50 billion
Pre Election Election to March 1st
Universe includes all banks publicly traded on a national exchange (excludes pink sheets, bulletin board, over the counter). Market data as of 3/1/2017
14What Has Substantively Changed?
Fundamentals have not changed, therefore multiples have widened significantly
Asse t Siz e Ele ction Day March 1st
P/TBV P/E P/TBV P/E
Through March 1, > $50 billion 142.1 14.4 193.7 17.9
$10 billion - $50 billion 173.3 17.3 227.7 21.1
peak of post
$5 billion - $10 billion 195.0 17.4 251.6 22.0
election bump $1 billion - $5 billion 143.6 16.1 188.6 20.5
< $1 billion 109.2 16.1 133.4 18.8
Price / LTM EPS Pre Election
PriceElection
/ TBV to March 1st
22 260
20 220
18 %180
x
16 140
14 100
12 60
< $1 billion $1 - 5 billion $5 - 10 billion $10 - 50 billion > $50 billion < $1 billion $1 - 5 billion $5 - 10 billion $10 - 50 billion > $50 billion
Pre Election March 1st
Pre Election March 1st
Universe includes all banks publicly traded on a national exchange (excludes pink sheets, bulletin board, over the counter). Market data as of 3/1/2017
15Impact on Pennsylvania Banking
Before the election, the five highest valued PA By year end, the five highest valued PA
banks (relative to TBV) were trading at: banks (relative to TBV) were trading at:
210.5% 282.1%
200.6% 276.1%
195.3% 251.6%
195.0% 251.6%
188.5% 245.7%
The median price increase for banks headquartered in Pennsylvania with greater than $1
billion in assets from the election to the end of 2016 was 22.5%;
In aggregate, the market capitalization of this group of Pennsylvania banks increased by $14
billion during that time;
The median increase in earnings among this universe from third quarter 2016 to fourth quarter
2016 was 0.6%.
16National Landscape
For the first time since 2006, the Republicans control the House, Senate, and White House
simultaneously;
Since then, the urgency for policy, regulatory and tax reform, increased for a number of reasons:
The US has the highest statutory corporate tax rate among developed nations;
GDP growth lags below historical averages;
The US manufacturing sector continues to decline;
The global tax system appears not to be functioning as forecast;
Significant migration of business income into partnerships and other “pass-throughs” has
eroded the US tax base;
Corporate inversions further erode the tax base and raise questions of fairness.
Paul Ryan was a driving force behind the development of the House GOP “Blueprint on Tax
Reform” released in June 2016;
The President’s campaign tax plan borrowed heavily from the Blueprint’s concepts;
The Affordable Care Act (“ACA”) has long been an issue for both the House and Senate GOP;
Federalism and excessive regulation have also been particularly sensitive issues.
17National Economic Outlook Since the Election
Stock market at 2016 GDP 1.5%;
record highs consensus for 2017
Consumer and
increase to 2.1%; first
investor confidence
quarter 2017 of 0.7%
highest since 2007 CPI projected to
weakest 1Q in 3 years
increase from 1.3% in
2016 to 2.5% in 2017
Interest rates UP General trends FAVORABLE
Manufacturing
Corporate earnings
production, new
UP 9% in 3Q16 and
manufacturing
14% in 4Q 16; 1Q 17
orders UP
estimated up 14%
Timing, magnitude and uncertainty Consumer debt
Stronger US dollar levels at pre-
around change ENORMOUS recession highs
Recession odds
Prospects for inflation
Bond market selling off, 0-20% in 2017;
increasing in 2017
although investment 40% by end of
grade stronger 2018
18Policy Priorities and the Ability to Move the Needle
Cornerstones of the campaign that have the most potential for stimulating the economy . . .
Tax policy;
Coupled with trade policy, tariffs and the border adjustment tax;
Part of discussion also includes repatriation of foreign earnings and the tax impact.
Regulatory reform;
Infrastructure spending.
. . . have been subsumed by more “political” issues:
Limitations on immigration, reduction in H-1B Visa workers and “the Wall;”
Repeal and replace or modification of ACA;
Supreme Court nominee, Cabinet nominees, and the influence of Russia on the election.
Fiscal and monetary policy seem to be taking shape, with an interest rate increase in March likely
accompanied by multiple additional increases in 2017;
The proposed federal budget highlights a significant increase in defense spending at the expense of
reductions in other government agencies, while entitlement reform, which was a key cornerstone of
the Trump campaign (in terms of not compromising existing promises), remains off limits.
19Impact on Bank M&A
Buyers: Sellers:
Increased currency value; Increased price expectations, currently but
also uncertainty as to what tax reform will do
Expected lower regulatory burden, both for valuations;
ongoing and for transaction approvals;
Better chance to do it alone with higher
Rising rates and steeper yield curve growth and better interest rate environment;
improving margins – more ability to
achieve growth organically; Chance of partners losing interest in favor of
lower risk organic growth in a more favorable
Will stimulus and spending improve economy;
GDP and growth to offset some of the
negative currents pre-election? Uncertainty of underlying valuation of
“currency” received in a sale;
Loss of tax deduction on debt used to
finance transactions; For family held or closely held sellers,
uncertainty as to impact of estate tax and
Impact of rising rates on real estate related reform;
values and the mortgage business;
Will sellers compensate for uncertainty by
Will buyers use some of the increase in receiving incrementally higher prices,
value of their currency to increase demanding more cash, demanding a fixed
purchase prices for deals? price deal and/or tighter collars, or deciding to
wait for clarity as these issues are resolved?
20Beginning of Return to Earth for Bank Stock Prices
Trump Bump to Trump Slump
Price Change
30%
25%
20%
15%
10%
5%
0%
< $1 billion $1 - 5 billion $5 - 10 billion $10 - 50 billion > $50 billion
Pre Election Election to March 1st Election to Today
Pre Election Election to March 1st Election to Today
Price / TBV Price / LTM EPS
260 22
220 20
180 18
%
x
140 16
100 14
60 12
< $1 billion $1 - 5 billion $5 - 10 billion $10 - 50 billion > $50 billion < $1 billion $1 - 5 billion $5 - 10 billion $10 - 50 billion > $50 billion
Pre Election March 1st Today
Pre Election March 1st Today
21Market Optimism and the Trump Bump
Broader Market ETFs by Sector Since November 1, 2016
30%
XLF / Financials – sizable
outperformance
25%
20%
15%
10%
Health Care and Tech in
line with broader market
5%
0%
XRT / Retail – potential for
border tax and online retailing
taking toll
-5%
XLF-Financials S&P 500 XRT-Retail XLV-Health Care XLK-Technology
Market data as of 3/31/2017
22The Banking Landscape As We Know It
23The Number of Banks Continue to Shrink
M&A Serves As The Catalyst
0 0
600 16,000
14,000
500
12,000
400
10,000
Number of banks
T ransactions
300 8,000
6,000
200
4,000
100
2,000
0 0
Traditional, Whole-Bank M&A Government Assisted Total Institutions
The total number of institutions has decreased by 60% since 1991
________
Source: FDIC Statistics at a Glance as of 3/30/2017
24The Big Continue to Get Bigger
Largest 15 banks nationwide by deposits
1996 2016
Total Deposit Total Deposit
Deposits Market Share Deposits Market Share
Rank Company Name ($) (%) Rank Company Name ($) (%)
1 BankAmerica Corp. 119,417,644 3.46% 1 Bank of America Corporation (NC) 1,204,485,508 12.01%
2 Chase Manhattan Corp. 105,476,865 3.06% 2 Wells Fargo & Company (CA) 1,159,470,156 11.56%
3 NationsBank Corp. 98,438,867 2.85% 3 JPMorgan Chase & Co. (NY) 1,155,185,534 11.52%
4 First Union Corp. 89,988,212 2.61% 4 Citigroup Inc. (NY) 493,074,000 4.92%
5 Wells Fargo & Co. 84,372,337 2.44% 5 U.S. Bancorp (MN) 298,344,516 2.98%
6 Banc One Corp. 69,241,667 2.01% 6 PNC Financial Services Group, Inc. (PA) 248,501,083 2.48%
7 Fleet Financial Group 65,897,511 1.91% 7 Toronto-Dominion Bank 214,486,461 2.14%
8 Citicorp 55,742,810 1.62% 8 Capital One Financial Corporation (VA) 207,791,098 2.07%
9 First Chicago NBD Corp. 51,626,372 1.50% 9 BB&T Corporation (NC) 166,995,354 1.67%
10 Norwest Corp. 45,945,374 1.33% 10 Bank of New York Mellon Corporation (NY) 157,726,385 1.57%
11 PNC Bancorp 44,713,463 1.30% 11 SunTrust Banks, Inc. (GA) 155,354,194 1.55%
12 Keycorp 43,402,541 1.26% 12 HSBC Holdings Plc 136,077,412 1.36%
13 Barnett Bank 34,643,408 1.00% 13 Citizens Financial Group, Inc. (RI) 107,151,770 1.07%
14 National City Corp. 34,559,066 1.00% 14 KeyCorp (OH) 105,901,870 1.06%
15 SunTrust Bank 33,137,176 0.96% 15 Fifth Third Bancorp (OH) 104,211,456 1.04%
976,603,313 28.30% 5,914,756,797 59.00%
Over half of the deposits in the U.S.
today are controlled by the top 15 banks
Source: SNL Financial as of 6/30/2016 25
Does not include asset management banks; Banks in red no longer exist today.Same Phenomenon in Pennsylvania
Decrease In Institutions Slightly More Significant
25 500
450
20 400
350
Number of banks
T ransactions
15 300
250
10 200
150
5 100
50
0 0
M&A Transactions Total Institutions
The total number of institutions in PA has decreased by 64% since 1991
________
Source: SNL as of 4/21/17.
26Pennsylvania Even More Concentrated
Largest 15 banks in Pennsylvania by deposits
1996 2016
Total Deposit Total Deposit
Deposits Market Share Deposits Market Share
Rank Company Name ($) (%) Rank Company Name ($) (%)
1 PNC Financial Services Group, Inc. 25,143,321 15.27% 1 PNC Financial Services Group Inc. 85,941,098 23.49%
2 Mellon Financial Corp. 23,821,973 14.47% 2 Wells Fargo & Co. 36,802,976 10.06%
3 Core States Financial Corp. 22,956,311 13.94% 3 Citizens Financial Group Inc. 28,762,923 7.86%
4 National City Corp. 10,357,797 6.29% 4 Bank of New York Mellon Corp. 20,210,134 5.52%
5 First Union Corp. 5,374,160 3.26% 5 BB&T Corp. 14,795,845 4.04%
6 Dauphin Deposit Corp. 3,955,636 2.40% 6 Toronto-Dominion Bank 13,491,538 3.69%
7 Keystone Financial 3,753,055 2.28% 7 F.N.B. Corp. 13,092,577 3.58%
8 Fulton Financial Corp. 2,423,662 1.47% 8 Bank of America Corp. 12,480,587 3.41%
9 Summit Bancorp. 2,121,479 1.29% 9 Banco Santander SA 11,588,452 3.17%
10 First Commonwealth Financial Corp. 2,064,925 1.25% 10 M&T Bank Corp. 11,027,319 3.01%
11 Northwest Bancorp, M.H.C. 1,472,695 0.89% 11 Fulton Financial Corp. 8,774,468 2.40%
12 Bt Financial Corp. 1,306,799 0.79% 12 First Niagara Financial Group 6,390,136 1.75%
13 Susquehanna Bancshares, Inc. 1,303,472 0.79% 13 S&T Bancorp Inc. 5,134,787 1.40%
14 US Bancorp 1,181,081 0.72% 14 Customers Bancorp Inc. 4,888,933 1.34%
15 F.N.B. Corp. 1,129,039 0.69% 15 First Commonwealth Financial Corp. 4,311,933 1.18%
108,365,405 65.80% 277,693,706 75.90%
Over 75% of the deposits in PA. today
are controlled by the top 15 banks
Source: SNL Financial as of 6/30/2016 27
Does not include asset management banks; Banks in red no longer exist today. Banks in green are headquartered outside of PAM&A Landscape – Nationwide Bank Transaction Activity
30 0 0 275
250
25
225
P/TBV %
P/E (x)
200
20
175
150
15
125
10 100
0 0
Mean Deal Value/ Earnings (x) Mean Deal Value/ Tangible Book Value (%)
Source: SNL Financial as of 4/21/2017.
Data includes national announced whole bank transactions, including change of control transactions. 28
2017 national deal value is $10.1 billion (although not all transactions report deal value).Monthly Price-to-Tangible Book Multiples
All bank transactions nationally
182.8
March 1: peak of
171.3
“Trump Bump”
161.9
160.1
147.3 146.8 147.2
139.5
138.2
133.9
128.9
124.4
124.2
122.6 129.9
117.8
Jan-16 Feb-16 Mar-16 Apr-16 May-16 Jun-16 Jul-16 Aug-16 Sep-16 Oct-16 Nov-16 Dec-16 Jan-17 Feb-17 Mar-17 Apr-17
Median P/TBV (%)
Source: SNL Financial as of 4/21/2017. 29
Data includes national announced whole bank transactions, including change of control transactions.M&A Activity by Deal Volume | 2014 – YTD 2017
Data as of April 24, 2017.
Shades Lower Limit Upper Limit
Deal Status: Pending & Completed 0 10
Deal Type: Bank & Thrift Company 10 20
Metric: Deal Volume 20 30
Date Range: 1/1/2014 - 4/21/2017 30 40
40
AK - 0 NA
WA - 11
ME - 2
MT - 12 ND - 7 MN - 40
VT - 1
OR - 6
NH - 3
WI - 38
ID - 2 SD - 7 MA - 24
NY - 15
MI - 21 RI - 1
WY - 2
CT - 3
IA - 22 PA - 35
NV - 0 NE - 27 OH - 31 NJ - 14
IN - 16
IL - 66 DE - 0
WV - 3
UT - 1
MD - 20
CO - 15 KS - 28 VA - 20
MO - 35
CA - 47 KY - 20 DC - 1
NC - 17
TN - 26
OK - 15 AR - 13
NM - 2 SC - 12
AZ - 5
MS - 7
GA - 29
AL - 10
TX - 72
LA - 17
FL - 46
HI - 1
Source: SNL Financial. Includes announced bank and thrift acquisitions from 1/1/2014-4/21/2017. Includes pending, closed and re-capitalizations involving a change in control 30M&A Activity by Average P/TBV | 2014 – YTD 2017
Data as of April 24, 2017.
Shades Lower Limit Upper Limit
Deal Status: Pending & Completed 0 125
Deal Type: Bank & Thrift Company 125 150
Metric: Average Price/ Tangible book (%) 150 175
Date Range: 1/1/2014 - 4/21/2017 175 200
200
AK - NA NA
WA - 114%
VT - ME - 157%
MT - 125% ND - NA MN - 172% 196%
OR - 195%
NH - 181%
WI - 129%
ID - 211% SD - 102% MA - 133%
NY - 144%
MI - 143%
WY - 89%
RI - NA
PA - 148% CT -
IA - 131% NJ -
NV - NA 133%
NE - 134% OH - 149% 131%
IN -
IL - 128% 147% DE - NA
WV -
UT - NA
115% MD - 116%
CO - 121% KS - 123% VA - 143%
MO - 140%
CA - 143% KY - 119% DC - 218%
NC - 164%
TN - 146%
OK - 171% AR - 133%
NM - 152% SC - 117%
AZ - 135%
MS - 150%
GA - 146%
AL - 107%
TX - 174%
LA - 141%
FL - 140%
HI - 116%
Source: SNL Financial. Includes announced bank and thrift acquisitions from 1/1/2014-4/21/2017. Includes pending, closed and re-capitalizations involving a change in control 31M&A Activity by Average P/E | 2014 – YTD 2017
Data as of April 24, 2017.
Shades Lower Limit Upper Limit
Deal Status: Pending & Completed 0 14
Deal Type: Bank & Thrift Company 14 18
Metric: Average Price/ Earnings (x) 18 22
Date Range: 1/1/2014 - 4/21/2017 22 26
26
AK - NA NA
WA - 17.0x
VT - ME - NA
MT - 23.3x ND - NA MN - 18.1x 21.0x
OR - 22.7x
NH - 25.2x
WI - 18.7x
ID - 6.0x SD - 14.0x MA - 31.5x
NY - 23.8x
MI - 21.4x
WY - NA RI - NA
PA - 19.7x CT -
IA - 14.2x
NV - NA NJ - 27.7x
NE - 17.2x OH - 20.0x
IN - 18.7x
IL - 17.7x 21.2x DE - NA
WV -
UT - NA
19.4x MD - 12.9x
CO - 17.8x KS - 20.9x VA - 18.3x
MO - 14.7x
CA - 23.6x KY - 17.8x DC - 27.6x
NC - 21.3x
TN - 16.2x
OK - 17.0x AR - 16.4x
NM - 44.8x SC - 15.8x
AZ - 9.4x
MS -
22.7x
GA - 20.3x
AL - 7.9x
TX - 20.1x
LA - 24.4x
FL -
23.3x
HI - NA
Source: SNL Financial. Includes announced bank and thrift acquisitions from 1/1/2014-4/21/2017. Includes pending, closed and re-capitalizations involving a change in control 32Service Delivery Channels Remain at the Forefront
The primary way in which we interact with our customer is changing...permanently;
Over the next decade, we will have tens of millions of excess square feet of real estate to shed,
retrofit, or reallocate;
We will be spending hundreds of millions of dollars on anti-fraud measures for mobile and online
banking.
100,000 0 0
95,000
90,000
Number
of US 85,000
branches
80,000
75,000
0 0
33
Source: SNL U.S. Deposit Market Share Summary ReportBranch Networks are Rationalizing
Banks are taking advantage of mobile and online banking to reduce the cost and infrastructure in
their branch networks, particularly the largest institutions, who have been selling branches to
smaller community banks
3,500 0 Population per branch 0
3,400
3,300
3,200
3,100
3,000
2,900
2,800
0 0
34
Source: SNL U.S. Deposit Market Share Summary ReportThe Elephant in the Room – Spreads Continue to Shrink
During the surge in the market in the early 2000s, big banks were very aggressive with pricing
and structure of new business . . . as we continue to distance ourselves from the Great Recession
and the economy continues to improve, it is beginning to happen again.
0.00 0.00
4.75 Net interest margin
$10B in Assets
4.25
3.75
3.25
2.75
0.00 0.00
35
Source: SNL Financial as of 12/31/2016Interest Rate Policy Has Not Had a Material Impact
4.8
FOMC Eases Tightens Eases Tightens Eases Tightens
4.6
125 bps 175 bps 550 bps 400 bps 450 bps 75 bps
4.4
4.2
4
3.8
3.6
3.4
3.2
3
PA Banks National
36
Source: SNL Financial 12/31/2016; Median of all banking institutionsYield Curve Slope More Important Than Rate Increases
3.00 4,500
4,000
2.50
3,500
2.00
3,000
Yield curve slope
Nasdaq Bank
1.50 2,500
1.00 2,000
1,500
0.50
1,000
-
500
(0.50) -
Yield Curve Slope Nasdaq Bank
Yield curve slope measured as difference between 10-year Treasury and 2-year Treasury
37
Source: SNL Financial 12/31/2016; Median of all banking institutionsWith Lower Spreads . . . Higher Capital Requirements
Tangible common equity
Banks have more capital to deploy, and are doing so at tighter spreads;
Larger banks used to have more operating leverage than smaller ones, but that has been regulated away.
10.50
$10B in Assets
9.50
9.00
8.50
8.00
7.50
7.00
6.50
0.00 0.00
6.00
38
Source: SNL Financial as of 12/31/2016The Result . . . Lower Returns on Equity
0 0
16
the “old normal”
14
12
the “new normal”
10
ROAE (% )
8
6
4
2
0
> $20 Billion $5 - 20 Billion $1-5 Billion $500 Million - 1 Billion $250 - $500 Million < $250 Million
0 0
39
Source: SNL Financial as of 12/31/2016Closer to Home – Impact on Pennsylvania Banks
12.00
11.00
10.00 the “old normal”
9.00
the “new normal?”
ROAE (%)
8.00
7.00
6.00
5.00
4.00
1995
1996
1997
1998
1999
2000
2001
2002
2003
2004
2005
2006
2007
2008
2009
2010
2011
2012
2013
2014
2015
2016
PA Banks National
Source: SNL Financial 12/31/2016; Median of all banking institutions 40
PA and National medians do not contemplate an after-tax return for S-Corps. PA has 2 S-Corps relative to 2,125 S-Corps nationally.Consistently Harder to Outperform
Pennsylvania-based banks by ROA
2001
In 2001, 31% of banks with assets
1.25% +
31%
0.95% - under $10 billion had a ROA of
1.24%
28% 1.25% or greater and 59% had an
< 0.50%
20% ROA of at least 0.95%
0.50% -
0.94%
42%
2016
0.95% -
1.25% +
1.24%
8%
14%
By 2016, only 8% of banks with < 0.50%
19%
assets under $10 billion had a ROA 0.50% -
0.94%
of 1.25% or greater and 22% had an 52%
ROA of at least 0.95% or greater
41
Source: SNL Financial as of 12/31/2016. Includes banks with total assets under $10 billion at each year endThe Pennsylvania Banking Landscape
Number of institutions Number of branches
0 0 0 0
43
259
1,022
116
416
4,851
Mutuals Stock Credit Unions Mutuals Stock Credit Unions
0 0 0 0
Amount of Deposits ($M)
0 0
39,440 15,729
While the number of credit unions in
Pennsylvania outstrips stock and mutual
banks combined, stock institutions have
378,821 by far the largest number of branches
and largest deposit volume.
Mutuals Stock Credit Unions
0 0
42
Source: SNL Financial as of 12/31/2016The Pennsylvania Banking Landscape
June 2001 June 2016
0 Number of Branches – By Headquarters
0 0 of Bank 0
1,292
1,802
2,432
3,253
In PA Out of PA In PA Out of PA
0 0 0 0
0 Dollars of Deposits ($000) – By
0 0Headquarters of Bank 0
54,378 167,015
195,540
124,918
In PA Out of PA In PA Out of PA
0 0 0 0
43
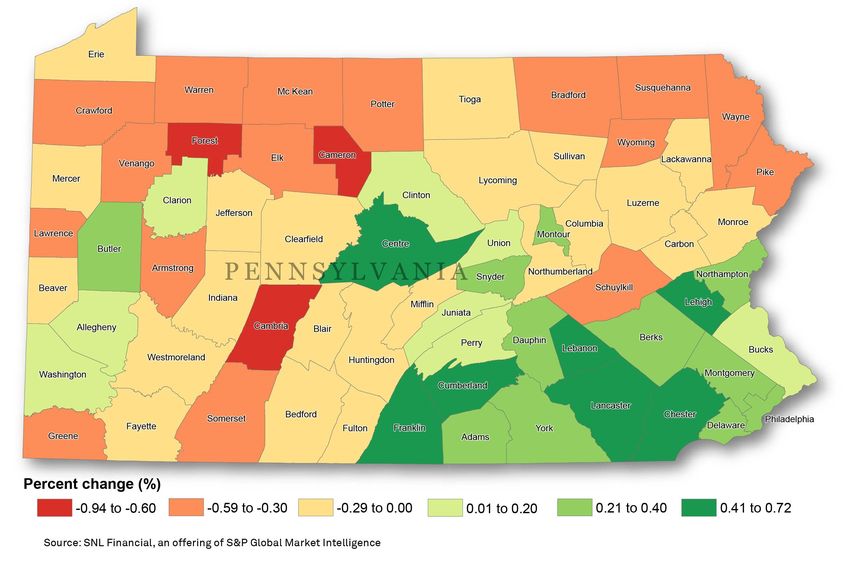
Source: SNL Financial as of 6/30/2016Deposit Growth (5 Year CAGR)
442017 – 2022 Projected Population Growth (CAGR)
45Unemployment Rate
462017 Median Household Income
47The Bullish View of the Future
48The Bullish View of the Future
The bullish thesis that the Trump Bump is for real and sustainable, and that it will mean strong
performance and higher valuations for banks is based on all or a combination of the following:
Bank stocks have been sluggish during the recovery from the last downturn due to a higher
regulatory burden, higher capital ratios, and slower growth – the proposed deregulation of the
Trump administration should unlock some of that trapped value;
Dodd-Frank reform could free up un-deployed capital which could help valuations;
Smaller banks hope to have favorable legislation piggy-backed onto large bank reform.
Banks have been taking business from each other for years during the slow growth recovery,
and the projected 3-4% GDP should stimulate business activity and generate loan demand;
Bringing jobs back to the United States should stimulate the economy generally.
A tax cut helps in two ways – lower taxes at the bank level obviously improve earnings, and
lower taxes for corporate customers create more opportunity to grow and therefore borrow;
Immediate expensing of capital expenditures is a BIG DEAL for bank customers – if you
can write off the cost of a new plant, building or major piece of machinery immediately,
you are more likely to purchase it, and likely to borrow to do so.
Higher interest rates should grow net interest margins, especially if higher deposit costs are
slower to follow.
49A Key Ingredient
Timing !!!
Many of the Trump campaign promises were
made around activity in the first 100 days, or
even sooner (first day in office);
For the first time since 2006, the GOP
controls the House, Senate and White House
simultaneously;
Expectations for pace of change were huge.
The two immigration orders both appeared rushed, and the haste to get those out backfired;
Repeal and replacement of the Affordable Care Act, which itself took considerable structuring,
lobbying and sale to get accomplished (despite no Republican support), also appeared rushed, and
the replacement ended up getting pulled when it was apparent the vote wasn’t there. Subsequently
passed by the House, but still a long way to go;
While not unusual in politics, the level of effort required for such sweeping reform was simplified
and taken for granted in campaigning and in the run up to the Inauguration;
Appearing to have learned somewhat of a lesson, timing for the tax plan and Dodd-Frank reform
have begun to slip back to later this year, and even into 2018, and the inter-connectivity of these
initiatives is not lost on lawmakers (need for ACA reform to in part fund the tax plan).
50Banks Have Historically Underperformed
20,000 450
400
18,000
350
16,000
300
14,000 250
12,000 200
150
10,000
100
8,000
50
6,000 0
DJIA S&P Bank
From the date the Dow first crossed 10,000 in 1999 through the date the Dow crossed
20,000 (early 2017), the S&P Bank Index is actually DOWN 9%
51Putting Recent Performance in Historical Perspective
Price / Tangible Book Value of the Nasdaq Bank Index
450
400
350
300
250
200
150
100
While bank stocks shot up following the election, on a price-to-tangible book value basis,
valuations only returned to pre-crisis levels of 2008, and are still well below historical levels
52First Quarter 2017 Earnings Best in Five Years Source: Wall Street Journal 53
Formula for Growth and a Robust Economy

                       Lower corporate tax rates

                Immediate capital expenditure deduction

          Reduced regulatory costs and lower regulatory burden

         Federal Government defense and infrastructure spending

                   Trade and immigration protection

                      Substantial new investment

                More employment & low individual taxes

                   More employee disposable income

             More consumer purchases of goods and services

                       3.5% – 4.0% GDP
                                                                  54
Potential Tax Law Changes
As much about the reduction as funding the reduction
Corporate income tax (including capital gains and direct tax rates) reduced to 15%;
Lower tax rates would favorably impact public company M&A and valuations.
Write-off for tax purposes of capital expenditures in first year (no amortization);
Would stimulate expansion, and therefore financing needed to fund expansion.
Repeal of Alternative Minimum Tax (“AMT”) and ACA taxes;
Loss of interest deduction (negative for debt financing of M&A);
Personal income tax rates reduced from 7 brackets to three (maximum rate 35%);
Top capital gains and dividend rate returned to 20%;
Elimination of estate tax with capital gains taxed at death and step up;
Carried interest taxed at ordinary rates;
“Pass-throughs” taxed at 15% and tied to “reasonable compensation”
Elimination of various deductions, including deducting state and local taxes for federal purposes;
Funded in part through one-time tax on repatriated cash from overseas.
55Deregulation in the Banking Industry
A model for Dodd-Frank reform can be found in the Financial CHOICE Act, introduced by Rep. Jeb
Hensarling in 2016 (recently advanced out of House Financial Services Committee on May 4).
Components of this 600 page pending legislation include:
Requiring regulators to tailor regulations to fit an institution’s business model and risk profile,
thereby reducing compliance costs;
Reducing reporting burdens for highly rated and well managed banks, specifically allowing
banks with a 10% leverage ratio to opt out of certain Basel III and Dodd Frank provisions;
Qualifying Capital Election for larger banks also removes ability of stress testing to limit
capital distributions.
Raising the threshold for small bank holding company status from $1 billion to $5 billion;
Exempting banks less than $1 billion in assets from the reporting and attestation requirements
of the Sarbanes-Oxley Act;
Increasing the threshold of supervisory authority for the Consumer Financial Protection Bureau
(“CFPB”) from $10 billion to $50 billion, and changing the organization to a five-person,
bipartisan commission renamed the Consumer Financial Opportunity Commission;
Loosen certain qualifying criteria from QM status, HOEPA and HMDA reporting requirements;
Repeal of the Volcker Rule and Durbin Amendment.
Focus on big bank issues (orderly liquidation, SIFI designation and FSOC authority, etc.)
56Summary Impact on Financials
Federal tax rates
Will small bank reform piggy back big bank initiatives?
Regulatory costs Will rising short-term rates be accompanied by a steeper
yield curve? Rising rates not as important as yield curve!
Un-deployed capital and liquidity
Will economic stimulus spur loan demand to offset the
impact on asset prices and mortgage volume of rising
Loan growth interest rates?
Rates (improved margins) Can tax policy improve the bottom line of banks but also
give bank customers more profitability and confidence on
NIM, ROA and ROE which to leverage?
Will the $10 billion asset threshold that has been the focus
Market valuation of larger community banks be impacted?
Takeover valuation With higher stock valuations, will buyers be more
interested in acquisitions, or will both buyers and sellers
Capital markets access
find organic growth in a new business-friendly market
more attractive?
Asset quality Roughly ten years from the last downturn, will banks use
the current run-up to monetize their value creation and not
have to “ride it out” through another cycle?
57The Bearish View of the Future
58The Bearish View of the Future
An equally large and vocal contingent feels as if the negative undercurrents in the market before the
election are still there and market cycles feel like a recession is imminent;
The stimulative measures proposed by the Trump Administration, in the view of the bears,
won’t happen fast enough to offset these issues.
Every 8-10 years the market has some form of recession or correction, and we are roughly that
amount of time into the recovery from the last recession, with the market at record highs;
The total return for the S&P 500 has been up for eight straight years – the record is nine years.
Early in the Trump Administration, while the Federal Reserve has raised short-term interest rates, the
long end has not adjusted accordingly, and the yield curve has actually flattened;
While the “bulls” want to cut back Dodd Frank and de-regulate the industry, there is an increasing
call to breakup the big banks in somewhat of a Glass-Steagall fashion;
The national debt is multiples higher than it was the last time interest rates began to increase, putting
a strain on debt service for the government;
As more and more “baby boomers” approach retirement, demographic challenges are significant –
the health care cost, reduction in the workforce, and significant burden of insolvent entitlement
programs will weigh on the country for years.
59The Bearish View of the Future
Commercial credit concerns include the following:
Commercial real estate concentrations as a percentage of capital were a focus of regulators
before the election, and concern over this issue even prompted a number of banks to sell;
Commercial real estate loans originated pre-crisis are coming due and have to be refinanced;
Certain sectors, initially energy, followed by retail, have come under increased focus.
Residential and consumer markets are also leveraged, and vulnerable, particularly in a rising rate
environment:
Rising interest rates will result in a reduction in asset valuations as well as borrowing capacity
for home owners, putting a strain on residential lending;
Personal debt levels continue to climb, and borrowers are once again taking “cash out”
mortgages at increasing frequency, monetizing the inflated values of their homes;
Sectors such as auto lending are showing signs of weakness and increased losses.
60Continued Swelling of Public Debt
Gross public debt ($ billions)
25,000
20,000
15,000
10,000
5,000
0
61Demographic Challenges
Projected Population Growth for Seniors
Health care spending in the United
States is projected to be 20% of
GDP by 2025,
according to a recent study by
Centers for Medicare & Medicaid
Services
Health Care Spending Per Capita by Age
62Demographic Challenges
Number of Working Aged People (16-64) for Every Retirement Aged (65+) Person
Fewer people paying in, more people receiving benefits
In 2000, there were 5.2 working aged citizens for each retired citizen. This will
change to 3.0 working aged citizens for each retired citizen by 2030.
63Unintended Consequences
Aging population
Low productivity growth
Reduced consumer spending
Loose economic policy (lower rates) intended to
stimulate growth and spending had the unintended
consequence of increasing consumer debt levels
64Consumer Debt Exploding in Zero Rate Environment
65Signs of Consumer Weakness
Currently an eye-popping $1.4 trillion in outstanding student loan debt;
44 million borrowers at an average loan outstanding of $30,650;
18%, almost 8 million borrowers, considered in technical default
According to the New York Federal Reserve, almost 1/3 of 30 year olds who left school between
2006 and 2011 have missed at least one student loan payment;
1/3 of the 44 million borrowers mentioned above have missed 9 straight payments
“Parent Plus” student loan program from the Department of Education allows for unlimited
borrowing (relative to capacity to pay) and requires no income verification or credit score;
40% of loans in this program going to borrowers with subprime credit scores;
8 million people in this program are currently delinquent on over $137 billion.
Capital One, one of the country’s major consumer (and subprime) lenders, reported increased
delinquencies in the first quarter and increased reserves 30% over 1Q16 to $2 billion;
Synchrony Financial, a private label credit card issuer, recorded a 21% increase in provision expense
from the prior quarter, and like Capital One, is experiencing charge-off rates north of 5%.
66Continued Concern with Student Loan Financing
0 0
Percent of new mortgages considered subprime
Percent of new student loans considered subprime
45
40
35
30
25
20
15
10
5
0
2005 2006 2007 2008 2009 2010 2011 2012 2013 2014 2015 2016
0 0
Source: Equifax Inc., Wall Street Journal 67Increase in First Lien Cash-Out Refinances Source: Black Knight 68
Rising Rates . . . But Flattening Yield Curve
U.S. Treasury rates

3.00
         Rising short rates help adjustable rate loans,
         but also increase borrowing costs
2.50
         Many commercial loans and mortgages are priced
         off longer term rates, which are not increasing as fast

2.00

1.50

1.00

0.50

0.00
       1 mo      3 mo      6 mo       1 yr       2 yr          3 yr          5 yr   7 yr   10 yr   20 yr   30 yr

                                                  April 2016          April 2017

                                                                                                                   69
Struggling Economic Growth
10-Year Averages of Annual Growth Rates
70Federal Tax Receipts Do Not Paint Growth Picture Source: Board of Governors of the Federal Reserve System 71
Growth Without Investment Will Be Difficult

  Source: Board of Governors of the Federal Reserve System   72
Impact of Rising Rates on Commercial Real Estate

SOURCE: YARDI Matrix                                73
Are We at Top of Commercial Credit Cycle?

    Commercial credit risk – 12 month change in quantity of credit risk

Source: OCC Survey of Credit Underwriting Practices 2016
                                                                          74
Are We at Top of Commercial Credit Cycle?
Trends in underwriting practices for commercial credit products
Source: OCC Survey of Credit Underwriting Practices 2016
75Converging Factors
Baby boomers are headed into retirement in massive numbers – more people into entitlement
programs while tax revenues go down;
While the Trump Administration seeks to bring jobs back to the US, automation has eliminated
many jobs, and the need for skilled labor that we currently don’t have creates a shortage:
No place better seen than the protest over the immigration orders;
Clearly shrinking number of jobs over time in Pennsylvania.
Rising interest rates will put pressure on asset values, and squeeze the national budget, as debt levels
are astronomically higher than they were the last time interest rates were increasing;
The 4% GDP that the Trump Administration keeps referencing will take a LONG TIME, if at all, to
come to fruition, so the growth needed to offset these negative currents may be too little, too late;
Community banks can expect very little in the way of regulatory reform, with the greatest hope
being attaching small bank initiatives to large bank legislation, which is expected to target the CFPB,
OLA (Orderly Liquidation Authority) and other big bank issues;
Partisanship in Washington (even within the GOP) could keep productive legislation from
happening, as was seen with immigration and ACA;
Timing on stimulative measures is uncertain at best, and the time between enacting legislation and
having an impact trickle down to local economies is significant.
76Summary Observations
77Summary Observations
The “Trump Bump” was as much a function of substance (i.e. what could get done) as it was of
timing (things getting done SOON) – the reduction in the initial Trump Bump is much more a
function of timing slipping than it is of agenda items becoming less likely to get accomplished;
We are at the end of the current economic cycle and approaching another recessionary environment,
the question is whether the stimulative policies of the Trump Administration can have impact soon
enough to offset the negative forces that impact asset values, credit and performance;
The only thing certain about the next few years is uncertainty and volatility:
The focus has moved from policy-driven uncertainty (“America First”) to international
relations, with Russia, Syria, and North Korea at the forefront, and the role of China critical;
Although the French election was resolved in an EU-friendly way, and the fate of the European
Union is also taking center stage.
President Trump has reversed course on a number of key issues (NATO, NAFTA, etc.);
The interconnectivity of these issues and topics is substantial – budget savings from the ACA repeal
and replace that did not happen was needed to pay for tax reform, which is thus slowing down a key
issue for the market;
Every stimulative measure has vocal and aggressive opposition, either inside or outside Washington.
78Summary Observations
For banks, the impact of the Trump Administration is LESS about what happens to your bank, and
MORE about what happens to your customers;
Examining loan concentrations in your portfolio can help determine customers (or sectors) that are
impacted by pending legislation (health care, retail, agriculture, financial, family owned business);
All of the following will play a role in the future of your customers and their businesses;
Health care reform;
Tax reform;
Regulatory reform
Potential estate tax repeal;
Tariffs and trade – border adjustment tax or something related;
Immigration and potential lack of suitable hiring candidates.
There is no certainty that any of the things we discussed today will happen, but anticipating
outcomes before they occur will put you ahead of your competition and allow you to anticipate both
favorable and unfavorable change.
79Buyers: Higher Multiple Doesn’t Mean Higher Purchase Price
Bank buyers nationwide $1 billion - $15 billion with multiple acquisitions since 2005
Buyers who paid the LEAST in P/TBV multiple versus their trading multiple at the time
Highest performing banks pay multiples significantly lower than where they trade
Avg P / TBV
10-Yr Total
Multiple Buyer Return Vs
# of Paid in Trading Disc. to SNL Bank Banks acquiring
Deals Deal Multiple Trading Index other institutions at
Buyer 1 6 107 295 (188) 583.9 the most favorable
Buyer 2 2 54 134 (80) 13.5 multiples versus
Buyer 3 10 143 216 (73) 205.9
Buyer 4 3 117 187 (70) 194.0 their own trading
Buyer 5 2 88 154 (66) 225.4 multiples
Buyer 6 3 231 285 (55) 158.6 outperformed the
Buyer 7 6 124 174 (50) 256.6
SNL Bank Index on
Buyer 8 2 119 166 (47) 427.1
Buyer 9 6 148 194 (47) 561.7 a total return basis
Buyer 10 2 113 152 (39) 184.2 by anywhere from
Buyer 11 2 188 224 (36) 93.5 13.5% to 583.9%
Buyer 12 4 179 215 (36) 220.7
since 2005
Buyer 13 2 227 260 (33) 242.3
Buyer 14 7 140 171 (31) 216.5
Buyer 15 2 118 135 (17) 206.9
Source: SNL Financial. Includes bank and thrifts that announced multiple acquisitions from 1/1/2005-12/31/2016 where the buyer’s total assets were between $1 billion and $15 billion and purchase price was disclosed. 80Sellers: Currency is a Two-Edged Sword
Highest P/TBV multiples paid 2003-2008 for 100% stock transactions
Effective prices in 2010 and 2013 based on forward buyer price, and impact versus broader market
High multiples largely come from buyers with high valuations
Announcement January 1, 2010 January 1, 2013
Change Vs Change Vs
NASDAQ NASDAQ
Deal Date Deal Val. P/TBV Deal Val. P/TBV Bank Index Deal Val. P/TBV Bank Index
1 2003 195 503% 83 155% -22% 91 171% -26%
2 2006 172 378% 45 102% -25% 78 177% -13%
3 2004 138 365% 24 65% -39% 37 101% -36%
4 2005 171 361% 90 211% 0% 108 252% 3%
5 2006 66 353% 37 161% 6% 21 90% -26%
6 2006 356 353% 168 174% -6% 148 153% -19%
7 2003 92 352% 32 135% -38% 35 149% -44%
8 2006 199 342% 33 57% -34% 56 96% -30%
9 2003 111 342% 55 170% -8% 66 204% -6%
10 2006 395 328% 226 200% 8% 259 230% 10%
11 2003 87 327% 32 148% -25% 44 203% -19%
12 2005 83 324% 46 181% 1% 55 216% 5%
13 2005 621 322% 366 193% 7% 420 221% 8%
14 2003 3,375 319% 1,819 174% -19% 2,087 199% -21%
15 2004 127 318% 50 137% -19% 55 151% -23%
16 2004 83 316% 70 292% 28% 66 276% 16%
17 2005 175 314% 104 190% 5% 138 251% 17%
18 2004 588 298% 81 42% -42% 142 74% -39%
19 2006 10,060 296% 1,440 43% -38% 1,941 58% -40%
20 2004 344 289% 208 230% 5% 183 202% -10%
Source: SNL Financial. Excludes Wells Fargo and Bank of America. Dollars in millions 81Firm Background and Speaker Biography
82Platform of Professional Services Firms
... Working together to assist
our clients in addressing their
challenges and opportunities,
including those arising from
emerging changes in federal
policy, law, rule and regulation
Full service law firm founded in 1928 FINRA-licensed investment bank, the largest
headquartered in Pennsylvania, and one of the largest
in the Northeast and Mid-Atlantic states outside of
New York City
Financial advisors to state and local
government Government Affairs and Consulting
State and local government revenue and D&O and E&O insurance risk
operations consulting International development consulting management consulting
83Platform Coverage
Footprint & Scale
15 Offices
7 States
200+ Multidisciplinary Professionals
Investment bankers
Lawyers
Accountants
Actuaries
Economists
Former senior executive officers
Former corporate finance executives
Tax professionals
Private Equity Placement Agents
Insurance and risk professionals
Government Affairs professionals
Our 200+ multidisciplinary professionals in 7 states
enable a national presence
84Industry Verticals Within Griffin
Financial Institutions:
Commercial, Industrial Financial Restructuring Group
Capital Markets Group Depository Institutions &
& Services Group (“CIS”) (“FRG”)
Specialty Lending Group
Public offerings and institutional Middle market distribution, Banks and thrifts Middle market distribution,
private placements manufacturing, retail and services Asset managers manufacturing, retail and service
Market making companies Mortgage banks companies
Stock buybacks Primarily privately-owned businesses Consumer credit companies Primarily privately owned
Deal and non-deal road shows and smaller public companies businesses
Commercial finance companies
Capital planning and strategic • Family held • Debtors-in-possession
Asset Liability management
analysis • Partnerships • Overleveraged balance sheet
Securitization
• CEO-owned • EBITDA negative
Both publicly and privately-owned
• Private equity owned • Legal/operation challenges
• Out-of-favor industries
Financial Institutions:
Healthcare Group Private Equity Real Estate Finance
Insurance Group
Middle market healthcare Stock insurance companies Private equity sponsors RE Asset Management
companies Mutual insurance companies Hedge fund sponsors Strategic Planning
• Healthcare technology Reinsurers Asset managers Sale and leaseback structuring
• Healthcare equipment and supplies
Captives and risk retention groups Institutional LPs Debt and equity capital raising
• Medical laboratory services
Service providers and third-party Pension funds Joint venture partner search and
• CROs and CDMOs
administrators Family Offices structuring
• Pharmaceuticals
Agencies, MGAs & MGUs, and Direct investment Portfolio restructuring advisory
• Biotechnology and medical devices
brokers Co-investment Transactional management
• Life science tools and services
Both publicly and privately-owned Risk financial models
For-profit and non-profit healthcare
institutions Financial and operational review,
• Hospitals and healthcare centers benchmarking and diagnostics
• Physician practices
• HMOs and healthcare insurers
85Why Griffin is Different
Deal Volume and Track Record Strong Research Capabilities
Over 200 transactions closed by Griffin since founding in 2001 Full-time research professionals
Over 1,000 transactions closed by Griffin Principals during careers Intensive research, analytical, and modeling capabilities
Broad sector experience Access to numerous databases – Bloomberg, Capital IQ, Preqin, SNL, etc.
Financial Accounting and Tax Management Perspective
Former Big Four professionals with in-depth understanding of M&A accounting Many of our investment bankers are former executive level managers with
and tax issues entrepreneurial skill sets
Hands on experience applying FASB and mark-to-market rules Enables us to understand your problems and opportunities and strive for creative
Extensive due diligence and forensic accounting expertise solutions from your perspective
Depth and Breadth Middle Market Focus
Affiliation with a large professional service organization Specializing in closely held private and small-cap public companies
Diverse capital markets and M&A experience Broad experience with industrial and services companies
Expertise complements and enhances our ability to provide quality and certainty Particular expertise regarding operating subsidiaries, family-owned and owner-
of execution operated businesses, and related issues
Fluency in numerous foreign languages, including Portuguese and Mandarin
Chinese
86Speaker Biography
Richard L. Quad
Senior Managing Director, Co-Head of Financial Institutions Group
Griffin Financial Group, LLC
Phone: (646) 254-6387
RLQ@griffinfingroup.com
Mr. Quad is a Senior Managing Director and Co-Head of the Financial Institutions Group at Griffin Financial, where he is a trusted advisor to management
teams and boards of directors of banks largely $10 billion in assets and below in the Northeast and other select geographies. Mr. Quad joined Griffin in
August 2012, prior to which he was most recently Managing Director and Head of U.S. Financial Institutions M&A for RBC Capital Markets, where he had
been since 2001. Mr. Quad joined RBC following its acquisition of Tucker Anthony Sutro, where he was a Vice President in its Financial Institutions Group.
Mr. Quad has completed buy-side and sell-side acquisitions, common stock, preferred and trust preferred offerings, and general advisory engagements for
clients throughout the northeast United States. Some of the assignments that Mr. Quad has completed include the sale of Lake Sunapee Bank Group to Bar
Harbor Bankshares, the purchase of Chicopee Bancorp by Westfield Financial Inc., purchases of Lake National Bank and FC Bank by CNB Financial
Corporation, the $50 million issuance of investment grade subordinated debt by CNB Financial Corporation; the sale of Connecticut River Bancorp to
Mascoma Mutual Financial Services Corporation, the sale of RBC Bank USA to PNC Financial Corporation, the FDIC-assisted acquisitions of Wakulla
Bank and Gulf State Community Bank by Home BancShares, Inc., the merger of Westborough Financial Services, Inc. into Assabet Valley Bancorp, the sale
of Capital Crossing Bank to Lehman Brothers; the sale of Community Capital Bank to Carver Bancorp, Inc.; the sale of Mystic Financial, Inc. to Brookline
Bancorp; the sale of specialty lender AmeriFee Corporation to Capital One Financial Corporation; the acquisition by Richmond County Financial
Corporation of seven branches from FleetBoston Financial Corporation; and the acquisitions of North American Bank Corporation and thirteen branches of
Shawmut Bank for Banknorth Group, Inc. while running Bankorth’s internal M&A function.
Prior to joining Tucker Anthony Sutro, Mr. Quad was a Vice President in the Financial Institutions Group at Advest, Inc., where he also worked with
financial institutions clients. Preceding Advest, Mr. Quad was Vice President and Director of Mergers and Acquisitions for Banknorth Group, Inc., at the
time a $2 billion bank holding company headquartered in Burlington, Vermont, where he founded the company’s internal M&A function and coordinated the
bank’s first two acquisitions and an internal restructuring of the company’s trust subsidiaries. At Banknorth, Mr. Quad also gained valuable experience in
cost accounting and budgeting, asset/liability management, consolidation accounting and SEC and regulatory reporting.
Mr. Quad holds a B.S. in Business Administration from The University of Vermont, magna cum laude, and an M.B.A. from Cornell University, with
distinction. Mr. Quad is a Series 7 and Series 63 registered representative.
87Disclosure Statement
This presentation is not considered complete without the accompanying oral presentation made by
Griffin Financial Group, LLC (“Griffin”).
Any projections or recommendations contained herein involve many assumptions regarding trends,
company-specific operating characteristics, financial market perceptions and the general state of the
economy as well as internal factors within management control, such as capital investment. As such,
any projections contained herein represent only one of an infinite number of outcomes and should not
be construed as the only possible outcome.
The information contained in this presentation and attached exhibits have been obtained from sources
that are believed to be reliable. Griffin makes no representations or warranties as to the accuracy or
completeness of the information herein.
All terms and conditions contained herein are based upon current market conditions and are estimates
based upon prevailing market rates. Any or all estimates may or may not change as market conditions
dictate. As such, any or all terms and conditions presented herein are preliminary in nature and should
not be construed, either in whole or in part, as a commitment to perform or provide any specific
services. Any and all services that may be provided by Griffin or any other entity referred to in this
discussion outline will be contingent upon the signing of a proposal or contract.
Griffin does not provide legal, tax or accounting advice. Any statement contained in this communication
(including any attachments) concerning U.S. tax matters was not intended or written to be used, and
cannot be used, for the purpose of avoiding penalties under the Internal Revenue Code, and was written
to support the promotion or marketing of the transaction(s) or matter(s) addressed. Clients of Griffin
should obtain their own independent tax and legal advice based on their particular circumstances.
88You can also read