Assessment of Development Feasibility for the Wairakei Urban Growth Area
←
→
Page content transcription
If your browser does not render page correctly, please read the page content below
Assessment of
  Development
Feasibility for the
 Wairakei Urban
  Growth Area

               Martin Udale, Essentia Consulting Group
 Christine Jones, Andrew Mead & Frazer Smith, Tauranga City Council

                          November 2010
Table of Contents
1. Executive Summary ........................................................................................................4
2. Report structure...............................................................................................................5
3. Purpose.............................................................................................................................6
4. Background ......................................................................................................................7
4.1 Location................................................................................................................7
4.2 History ..................................................................................................................7
4.3 Current land uses and land owners .................................................................7
4.4 Growth projections .............................................................................................8
4.5 Infrastructure servicing costs ...........................................................................9
5. Context ............................................................................................................................10
5.1 Population growth in Tauranga City...............................................................10
5.2 Housing affordability ........................................................................................11
5.3 Development yield ............................................................................................13
5.4 ‘Growth pays for growth’ philosophy / development contributions..........13
5.5 Financial challenges of growth to Council....................................................15
5.6 Economic environment / property market.....................................................16
6. Methodology / Data Inputs ...........................................................................................17
6.1 Project team.......................................................................................................17
6.2 Land development model ................................................................................17
6.3 Revenue inputs .................................................................................................17
6.4 Cost inputs.........................................................................................................18
6.5 Inflation...............................................................................................................20
6.6 Financial analysis .............................................................................................21
6.7 Timing of revenues and costs.........................................................................21
6.8 Goods and services tax ...................................................................................22
6.9 Developer / property specific model scenarios ............................................22
6.10 ‘Bottom up’ and ‘top down’ approaches........................................................22
6.11 Residential construction..................................................................................22
6.12 Model accuracy .................................................................................................23
7. Residential development feasibility ............................................................................24
7.1 Base model ........................................................................................................24
7.2 Sensitivity analysis ...........................................................................................25
7.3 House prices and rents ....................................................................................27
7.4 Individual developer circumstances ..............................................................31
7.5 Land costs..........................................................................................................32
7.6 Subdivision impact fees...................................................................................32
7.7 Housing affordability in Wairakei....................................................................33
7.8 Findings for Wairakei residential development prospects .........................35
8. Industrial development feasibility ...............................................................................378.1 Base model ........................................................................................................37
8.2 Sensitivity analysis ...........................................................................................38
8.3 Findings for Wairakei industrial development prospects ...........................39
9. Land owner risks ...........................................................................................................40
9.1 Iwi / hapu land ownership ................................................................................40
10. Conclusions ...................................................................................................................41
10.1 Wairakei..............................................................................................................41
10.2 Overall city .........................................................................................................41
11. Recommendations.........................................................................................................43
11.1 Wairakei urban growth area.............................................................................43
11.2 Wider strategic issues......................................................................................44
3Assessment of Development Feasibility for the
Wairakei Urban Growth Area
1. Executive Summary
Wairakei is currently a rural area located in Papamoa East, Tauranga. It has been identified
for substantial residential, industrial and commercial development in the immediate future.
However, concerns have been raised that development in Wairakei may not be feasible from a
financial perspective.
This report provides an in depth assessment of development feasibility in Wairakei with
particular emphasis on the impact of development contributions and land prices on
development feasibility.
To assess development feasibility a hypothetical development model has been used. This
excel based model includes all of the costs and revenues associated with land development
and the timing thereof. The model allows the financial performance of a development proposal
to be calculated and assessed as to whether it would be sufficient to allow a development
project to proceed. This is the standard approach used by the development community.
The report concludes that there are significant development feasibility issues in Wairakei for
both residential development and industrial development. These issues are also likely to exist
in other new areas that Council might wish to open up for development. The report identifies a
number of wider implications for Council and the future growth of Tauranga City.
The report also concludes that very little affordable owner-occupied or rental housing will be
developed for low to middle income households because the cost structure of land
development and house construction does not permit this to occur.
The report identifies that approximately 100 hectares of land in Wairakei (25% of the total) is
likely to be returned to Maori ownership through the Treaty settlement process. This creates
further risks, especially for Council, should Maori not have sufficient financial resources or
inclination to develop this land in the foreseeable future.
The development feasibility issues that have been identified in this Report are not necessarily
insurmountable. A number of recommendations have been made to address them at both a
Wairakei level and a more general level. Many of these recommendations imply substantial
change or the need to make difficult decisions.
Council in itself is unable to resolve all these issues that are faced. To do this would require a
concerted effort from all involved: landowners, developers, builders, local government, central
government and consumers, especially in regards to the issue of housing affordability for both
owner-occupiers and renters in new growth areas.2. Report structure
This Report is structured into a number of sections as follows:
Purpose
Background – Introduction to the Wairakei urban growth area
Context – Wider issues associated with urban development in Tauranga
Methodology and data inputs
Assessment of development feasibility for residential development
Assessment of development feasibility for industrial development
Landowner risks
Conclusions
Recommendations
Appendices.
53. Purpose
The primary purpose of this project is to assess development feasibility in the Wairakei
urban growth area given the prominent role Wairakei is planned to have in
accommodating the city’s future population growth as the first stage of the city’s
expansion into Papamoa East. This report will give solid evidence for Council to
respond to:
developer concerns that development contributions and other Council costs are
adversely affecting the feasibility of greenfield subdivision development
an alternative view that developers have paid excessive prices for land which has
created development feasibility problems.
This report will also help to identify wider strategic issues and financial risks associated
with growth that will need to be considered and addressed by Council in the next few
years.
64. Background
This section of the Report provides background information on the Wairakei urban
growth area.
4.1 Location
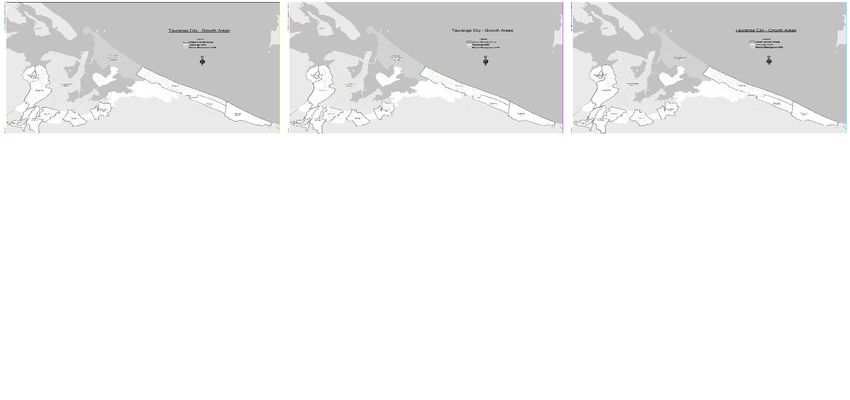
4.1.1 The Wairakei urban growth area is located in Papamoa East approximately
15km (‘as the crow flies’) from the Tauranga CBD. It is set back from the
ocean beach by approximately 500m. It is bounded by urban development to
the north and west, the Tauranga Eastern Link motorway corridor to the south
and the future urban area of Te Tumu to the east which is currently farm land
(see maps in Attachment A).
4.2 History
4.2.1 Wairakei was formally identified by Council as a future urban area in the late
1980’s. The role of Wairakei as a future urban growth area was reinforced
through the SmartGrowth Strategy in the early 2000’s and subsequently
through Plan Change 1 to the Regional Policy Statement. This recognised that
Council had initiated community consultation and planning research on opening
up Wairakei as a growth area through rezoning of this land in the future.
4.2.2 The Council work was supplemented by a 10 day design charrette process
funded by Bluehaven Holdings. The combination of the Council work and the
charrette led to the preparation and notification of Plan Change 44 to the
District Plan which has the purpose of rezoning Wairakei for urban
development. The Plan Change has been through a full submission and
hearing process. Over the last two and a half years Council has been working
with appellants to finalise the planning provisions, infrastructure servicing and
traffic issues. These appeals have now been resolved and the Plan Change is
planned to become operative in January 2011.
4.3 Current land uses and land owners
4.3.1 The entire Wairakei land area (approximately 370 hectares) is currently used
for farming purposes.
4.3.2 Most of the land holdings are relatively large although there are some smaller
more fragmented land holdings at the western end of Wairakei. The most
significant land owners are The Office of Treaty Settlements (OTS), Zariba
Holdings, DM & RL Taylor, Bluehaven, Puketata (Tirau) and the New Zealand
Transport Agency (NZTA).
4.3.3 Zariba Holdings owns approximately 20 hectares of land at the western end of
Wairakei which is to be rezoned for industrial development. Zariba Holdings
intends to hold this land for development in the medium term.
4.3.4 OTS owns a large block in the north-western corner of Wairakei. This block is
likely to form part of a Treaty settlement to a local iwi or hapu in the near future.
OTS is also likely to acquire a significant amount of the surplus land NZTA has
purchased as part of the Tauranga Eastern Link motorway project. It is likely
that this land will also be offered back to local iwi or hapu through the Treaty
settlement process.
74.3.5 To the east of the OTS block is the Taylor farm. Property development
company Hawridge has interests in this land. To the east of the Taylor block
lies the Bluehaven and Puketata (Tirau) land holdings. Bluehaven is holding its
land for future development. It has interests in the Puketata (Tirau) land as
well.
4.4 Growth projections
4.4.1 Up until recently the fully developed Wairakei area was anticipated to house
over 13,000 people and to have significant industrial and commercial
development. This commercial development was to include a significant new
town centre.
4.4.2 Much of the residential development was to be in the form of attached
dwellings such as terraced houses and medium to high rise apartments. The
initial structure plan for Wairakei showed approximately 6,700 dwellings. About
4,300 of these were in medium to high rise apartments. 1,800 were a mixture
of detached dwellings on small lots (probably less than 400m2), duplexes, town
houses and terraced housing. The remaining 600 dwellings were a more
conventional detached housing product with lots at an average of 500m2.
4.4.3 The overall yield achieved by this mix of product was over 25 dwellings per
hectare. To put this in context most greenfield residential subdivision in
Tauranga during the 1990’s and 2000’s was in the range of 10 to 12 dwellings /
hectare. In recent times some subdivisions have achieved up to 15 dwellings /
hectare. Upon review of these outcomes Council was concerned about the
likelihood of these yields being achieved. Neil Gray was commissioned by
Council to investigate these concerns.
4.4.4 The Neil Gray report titled SmartGrowth Residential Intensification in Tauranga
City confirmed Council’s concerns about the proposed structure plan,
particularly with market acceptance and viability of the medium to high density
residential offerings in this location. This led to a review of the structure plan.
This review resulted in the total dwelling estimates in Wairakei being reduced to
3,160 and the total population to about 8,000 people (excluding the town
centre). This is equivalent to 15 dwellings per hectare.
4.4.5 There is significant uncertainty about the amount of residential or mixed use
development that will occur in the town centre which covers 27 hectares. Much
will depend of the development economics of apartment buildings in this
location. Development of the town centre in Wairakei is not likely to commence
for at least 15 to 20 years.
4.4.6 There will be approximately 100 hectares of industrial zoned land and 40
hectares of commercial / mixed use zoned land (town centre and
neighbourhood centres) in Wairakei.
84.5 Infrastructure servicing costs
4.5.1 A significant amount of infrastructure needs to be built to provide for urban
development in Wairakei, much of which will be funded by Council.
Approximately $150m of capital expenditure directly related to urban
development in Wairakei has been included in Council’s Long Term Council
Community Plan. In addition to this, tens (and possibly hundreds) of millions of
dollars of capital expenditure that services all growth across the city such as
water and wastewater treatment plants, trunk watermains and sports fields
would also be partly attributable to Wairakei due to current infrastructure not
having sufficient capacity to service the development of Wairakei. The Table
below identifies some of the most significant Council funded infrastructure
projects that are required either wholly or partly as the result of the planned
urban development of Wairakei.
Table 1: Significant infrastructure projects required to service Wairakei
Project Cost estimate in 2010/11 dollars
New water treatment plant + water mains $84.8m
Motorway interchange $31.5m
Wastewater treatment plant upgrade $29.8m
New arterial road (Te Okuroa Drive) $23.1m
Road upgrade (Tara Road) $13.3m
Wastewater pump station $11.0m
Sports fields and facilities $8.8m
Trunk water main $7.1m
Wastewater pump station $9.1m
Stormwater pond $3.5m
Wastewater pump station $3.0m
4.5.2 In addition to Council funded infrastructure, significant infrastructure investment
related to Wairakei will be undertaken by the New Zealand Transport Agency
(NZTA), network utility operators (electricity, gas, and telecommunications) and
the developers themselves. This includes NZTA’s $455m eastern motorway.
95. Context
5.1 Population growth in Tauranga City
5.1.1 Tauranga City has experienced a rapid and sustained increase in its population
for a number of decades. It had the highest population growth rate of any
council area over the past decade. Forecasts indicate strong population growth
to continue well into the future as outlined in the Table below.
Table 2: Population growth in Tauranga City
Year Population Cumulative Five year
increase increase
1991 66,736 - -
1996 77,778 11,042 11,042
2001 90,825 24,089 13,047
2006 103,566 36,830 12,741
2011 116,236* 49,500 12,670
2016 129,336* 62,600 13,100
2021 142,226* 75,490 12,890
2026 155,066* 88,330 12,840
2031 166,966* 100,230 11,900
2036 178,796* 112,060 11,830
2041 189,616* 122,880 10,820
2046 199,566* 132,830 9,950
2051 209,286* 142,550 9,720
Source: Statistics NZ (1991 to 2006), SmartGrowth population projections (2011 to 2051)
Note: * Denotes forecast
5.1.2 In order to accommodate the population growth projections from 2006 to 2051
it is estimated that approximately 48,000 new dwellings will have to be built.
5.1.3 The majority of the population growth that has occurred in the past two
decades in Tauranga has been accommodated through greenfield
development in the suburbs of Welcome Bay, Ohauiti, Pyes Pa, Bethlehem and
Papamoa. These greenfield areas are now largely full and have little capacity
for continued development. A smaller amount of growth has been
accommodated through infill development and the redevelopment
(intensification) of the older parts of the city1.
1
More information on the location of growth in Tauranga City is available through Council’s
Development Trends Reports.
105.1.4 To manage population growth out to 2051 the SmartGrowth growth
management strategy was development in the early 2000’s. The strategy
covers the wider Western Bay of Plenty region and was developed
collaboratively by Tauranga City Council, Western Bay of Plenty District
Council, Bay of Plenty Regional Council2, the New Zealand Transport Agency3
and Tangata Whenua.
5.1.5 A significant component of the SmartGrowth Strategy is the settlement pattern.
The settlement pattern outlines the location where population growth is
anticipated to occur both spatially and over time. The settlement pattern
anticipates that 64% of population growth out to 2051 will be located in
greenfield areas, 8% through infill development and 28% through
intensification. This equates to around 70,000 more people being
accommodated in greenfield areas in 28,000 new dwellings.
5.1.6 Because Tauranga City’s existing zoned greenfield areas have largely been
developed, there is a need to open up further greenfield land to accommodate
population growth and associated retail, commercial and industrial
development. Greenfield land in Pyes Pa West (residential), West Bethlehem
(residential) and Tauriko (commercial / industrial) was opened up in the mid
2000’s for this purpose. Further greenfield land in Wairakei has been identified
in the SmartGrowth Strategy for urban development in the immediate future.
Other greenfield areas have been earmarked for urban development post
2021.
5.2 Housing affordability
General comment
5.2.1 Housing affordability has become a major nationwide issue in recent years as
the result of the property boom of the mid 2000’s. In general terms, houses
have become much more expensive in dollar terms and relative to household
incomes. This has resulted in fewer households owning homes and more
households relying on the rental market.
5.2.2 A report titled Housing Stock and Housing Demand was prepared by Council
staff in November 2009. That report outlines the housing affordability issue
from a Tauranga perspective.
5.2.3 The report identified that given current household incomes in Tauranga by far
the largest market segment for property is in the less than $400,000 category.
This has been confirmed by the developers and the building companies
Council has worked with in this project who have consistently said that
achieving price points for house and land packages significantly below
$400,000 is required to achieve substantial sales volumes in Tauranga.
5.2.4 Despite 63% of existing properties in Tauranga City having a capital value of
less than $400,000 the number of new homes in this price range is decreasing
rapidly. Only 34% of properties built in the last five years have a capital value
less than $400,000.
5.2.5 Tauranga ranks as the most unaffordable urban area in New Zealand based on
the ratio of median house prices to median household incomes. This ratio is
2
Formally Environment Bay of Plenty.
3
Formally Transit New Zealand.
116.8 in Tauranga4. A ratio in excess of 5.1 is considered severely unaffordable
by the authors of the Annual Demographia Housing Affordability Survey.
5.2.6 A major component of the housing affordability issue that has emerged in
Tauranga has been the increase in section prices in new subdivisions. Prices
have increased from a median of about $90,000 in 2003 to a current median of
approximately $170,000. In a number of the subdivisions in Tauranga where
sections are currently for sale, the average asking price for a section is around
$200,000 or even higher. It should be noted that as section prices have risen,
section sizes have on average decreased.
5.2.7 A significant challenge in making future greenfield development viable will be to
achieve a balance between keeping section prices low enough to maintain
some degree of affordability (and thus demand) whilst at the same time being
high enough to provide a commercially bankable return on investment for the
development community.
The wider impact of section prices on the property market
5.2.8 While it is evident that section prices play a critical role in the affordability of
new housing stock it is also likely that section prices have a significant bearing
on the affordability of the existing housing stock.
5.2.9 The capital value (total value) of the existing housing stock is made up of two
components:
1. The value of improvements i.e. houses and other buildings
2. The value of the underlying land.
The value of the land is effectively what a property would be worth if it was a
vacant section. If the market price for sections across Tauranga increases
(driven by prices in greenfield subdivisions) then this is likely to be reflected in a
rise in the land value component of the existing housing stock because land in
general is worth more.
5.2.10 In Tauranga during the 2000’s section prices soared and so did the land value
component of the existing housing stock.
Between 1997 and 2009, 75% of the increase in the capital value of the
30,000 dwellings that existed in Tauranga at 1997 related to the land
value5.
Over this period the total land value associated with these properties
increased by an average of 181% compared to an increase of only 41% for
improvements.
In 1997 land value made up approximately 40% of capital value of these
properties
In 2009 it made up approximately 60% of capital value of these properties.
5.2.11 This indicates a strong correlation between section prices and the underlying
value of the land component of the existing housing stock. In all likelihood
these two variables are not just correlated. Changes to section prices are likely
to cause changes to the value of the land component of the existing housing
stock. In other words, the increase in house prices in Tauranga over the
2000’s has probably been driven in the most part by the increasing market
4
Source: 6th Annual Demographia Housing Affordability Survey (http://www.demographia.com/dhi.pdf).
5
Based on valuations for Council rating purposes.
12price of new sections being embedded in the land component of existing
houses.
5.2.12 If this were true the relative affordability of Tauranga’s entire housing stock, not
just new housing stock, depends, to a significant degree, on section prices in
new subdivisions.
Reducing the cost of housing
5.2.13 Because most of the costs associated with delivering new sections and new
houses are fixed there are relatively few ways of delivering cheaper and more
affordable houses. The limited options available include:
Land development
More favourable land purchase terms
Delivering more sections by reducing the average section size
Lower Council fees (especially subdivision impact fees).
House construction
Building smaller houses
Using lower cost building materials / specifications
Lower Council fees (especially building impact fees).
5.3 Development yield
5.3.1 Development yield is usually measured in terms of dwellings per hectare. As
section size reduces the housing product and typology changes. Yields in
excess of about 20 dwellings per hectare generally require a significant amount
of attached product to be built such as duplexes, terraced houses and
apartments. Even at lower yields such as 15 dwellings per hectare if a
developer wishes to offer a wide range of product such as larger 600 and
700m2 lots then some attached product would also be required to achieve the
15 per hectare average.
5.3.2 As outlined earlier, the proposed development yield in Wairakei has been
reduced significantly from that originally planned. The yield is now anticipated
to be 15 dwellings per hectare which is likely to be achieved primarily through
detached houses on small to mid sized sections. The main reasons the
proposed yield was reduced include:
Relatively small market demand for living in attached residential product in
the Tauranga market at the present time, especially in this location on the
fringes of the city and set back significantly from the ocean beach
The likelihood that this market demand will not change significantly in the
short to medium term
The high cost of delivering mid to high rise apartments due to steel and
concrete construction methods, underground car parking and the like.
5.4 ‘Growth pays for growth’ philosophy / development contributions
5.4.1 A significant factor that affects the cost of land and property development in
Tauranga is Council’s ‘growth pays for growth’ philosophy. This involves the
use of upfront fees levied on property development to recover the cost that
Council incurs in providing infrastructure to service growth.
135.4.2 These upfront levies increase the cost of new housing and to some extent are
likely to create a hurdle that prevents some households from building or
purchasing new houses to live in or as rental investments. This is a significant
downside of this approach to funding growth-related infrastructure.
5.4.3 These levies are required by Council through the use of development
contribution powers under the Local Government Act 2002 and to a much
lesser extent financial contribution powers under the Resource Management
Act 1991. These costs are broken into what are termed building impact fees
and subdivision impact fees.
5.4.4 It should be noted that TCC is the only council to charge development
contributions in two stages (partly on subdivision consents and partly on
building consents). Other Council’s charge development contributions at the
earliest opportunity which is usually a subdivision consent.
5.4.5 Building impact fees (BIFs) are charged at the time a building consent for an
additional residential dwelling or a building consent for additional commercial /
industrial floor area is issued. They are used to fund infrastructure that services
all development in Tauranga regardless of its location e.g. increased water and
wastewater treatment capacity. BIFs are the same across the whole city and
for the 2010/11 financial year they are about $13,000 plus gst per residential
dwelling and $23 per m2 of floor area for commercial / industrial development.
5.4.6 Subdivision impact fees (SIFs) are charged at the time a subdivision is
completed or in the case of multi-unit development at the time a building
consent is issued. SIFs are used to fund infrastructure that services particular
areas of the city. This is normally the local infrastructure located in or near an
urban growth area. Council only uses SIFs to fund local infrastructure where it
is designed to service more than just an immediate subdivision. Local
infrastructure that does not meet this criteria is vested free of cost by the
developer to Council.
5.4.7 The amount of SIFs payable differs across each urban growth area. SIFs are
lowest in the infill areas where only modest investment in infrastructure is
required to support further development. SIFs are higher in the older greenfield
urban growth areas of Bethlehem, Pyes Pa, Ohauiti, Welcome Bay and
Papamoa than in the infill areas ($12,000 -16,000 per lot). The level of SIFs is
the highest in the new urban growth areas of Pyes Pa West, Tauriko, West
Bethlehem and Wairakei. This is because land and construction costs have
increased significantly in recent years, and because the SIF calculations now
take account of both inflation and the cost of capital (interest costs on debt
serviced by contribution income) which was previously not the case.
5.4.8 One approach adopted by Council to mitigate the high SIFs in new growth
areas is to charge these fees on a per hectare basis instead of the traditional
per lot basis. This makes them a fixed fee which may incentivise higher density
development because the fixed contribution costs can be spread across a
larger number of lots / dwellings.
5.4.9 The other approach Council has adopted is to maximise the amount of capital
expenditure which is directly provided and financed by developers. However
there are significant constraints to doing this including fragmented land
ownership and the inability of developers to raise finance to build lead
infrastructure which has long payback periods and a significant risk profile.
145.4.10 Reduced development contributions could significantly improve the profitability
of development. However if infrastructure costs cannot be reduced the
implication of lower development contributions means higher rates. This is due
to the limited funding sources available to local authorities in New Zealand
compared with their peers in others parts of the world, particularly those in the
US.
5.4.11 It should be noted that development contributions cover only capital
expenditure related to growth and therefore they do not include the likes of
operating costs, depreciation, excess capacity, a return on investment,
administrative costs associated with the development contributions policy and
capital expenditure that is not growth related (e.g. renewal and backlog).
Territorial Authorities are constrained by the LGA 2002 to development
contribution charges only being collected for the total cost of growth-related
capital expenditure.
5.4.12 Development contributions are charged at the time a subdivision is completed
or a building consent is issued. This is often well before sections are sold or
houses are built which can create cashflow issues for developers. Council
could look at altering the time of payment although the legislation as it currently
stands creates some difficulties in this regard. These issues relate to the lack
of security that exists in the event of payment default.
5.5 Financial challenges of growth to Council
5.5.1 As is evident from the discussion above, one of the financial challenges of
growth for Council is to keep development contributions at a level that is
affordable to developers.
5.5.2 Other challenges of growth relate to its impact on the sustainability of Council’s
debt position and the affordability of rates. Council’s ability to borrow to fund
investment in infrastructure to service growth (amongst other things) is
constrained by its revenue. The 2009-19 Long Term Council Community Plan
shows Council’s debt envelope being pushed to its limits, mainly as the result in
investment in growth-related infrastructure. Much of this debt is expected to be
repaid via development contributions. This development contribution revenue
is expected to be collected over a long period (out to 2050 in some cases) and
therefore the associated debt will not be fully repaid for a long time. This puts
Council (and thus its ratepayers) at significant financial risk should the rate of
growth slow down significantly as this would:
Reduce development contribution income
Reduce growth to the rating base
Put further pressure on Council’s debt position
Restrict Council’s ability to invest in facilities for the existing community
Cause development contribution charges to rise as interest costs increase.
5.5.3 While Council is careful to build infrastructure on a just in time basis, most
infrastructure has to be built in large capacity steps to take advantage of
economies of scale rather than incrementally which means that there is often a
significant lag between infrastructure capacity being built for growth and the
growth arriving. This has a significant impact on the ratepayer because
operating costs begin as soon as an asset is completed. All operating costs
are rate funded. This is part of the reason why rates in Tauranga have
increased significantly in the last few years and are likely to continue to do so in
the short to medium term.
155.5.4 Tauranga City Council staff, along with staff from a number of other similar
‘growth’ Councils, has had initial discussions with central government about the
financial challenges of growth. Little has come of this to date.
5.6 Economic environment / property market
5.6.1 While the boom years of the mid 2000’s were kind to property developers, the
current economic environment is very challenging. Property prices have come
back forcing some developers to reduce asking prices, sales are slow
(especially for sections in general and for houses at the high end of the
market), bank lending has become more difficult to access and mezzanine
finance is unavailable due to the demise of most finance companies.
5.6.2 This has directly affected Council’s financial position. Council’s development
contribution revenue has progressively decreased from a peak of $23.2m in the
2006/7 financial year to $19.0m in 2007/8, $11.7m in 2008/9 and $11.5m in
2009/10 due to the sharp reduction in development activity.
5.6.3 While the property market situation will no doubt improve in due course,
affordability issues are likely to remain for sometime for would be property
buyers. This may be a more significant issue in Tauranga than in other places
where household incomes are significantly higher. The reason for this is that
the cost structure of land development and building / construction is
substantially the same in Tauranga as it is anywhere else in New Zealand. As
such, the price developers are able to deliver a product to the market at in
Tauranga is more or less the same as it is in Auckland (or anywhere else in
New Zealand) but this price is much less affordable in Tauranga than it is in
places like Auckland or Wellington.
5.6.4 This is supported by the Annual Demographia Housing Affordability Surveys
which show Tauranga as being the most unaffordable urban area in New
Zealand taking into account both house prices and incomes (and the 20th most
unaffordable city in all of NZ, Australia, the US, Canada, the UK and Ireland).
166. Methodology / Data Inputs
6.1 Project team
6.1.1 The core project team was made up of:
Martin Udale (property development expert from the private sector)
Representatives from three property development companies in Wairakei
(Bluehaven, Hawridge and Zariba)
Council staff.
6.1.2 Some data inputs were sourced for independent experts outside the project
team. These independent experts were:
Two valuation firms (Colliers International and Middleton Valuation)
The following local building firms: Classic Builders, Generation Homes, GJ
Gardner, Signature Homes, Universal Homes and Venture Developments
S&L Consultants.
6.1.3 A key element to making the project successful was the “buy-in” from the three
developers and the local building firms. This has allowed the project team
access to accurate cost information, some of it confidential and commercially
sensitive, as an input into the development feasibility model.
6.2 Land development model
6.2.1 To assess the feasibility of development in Wairakei a hypothetical
development model was built. This is an excel spreadsheet based model that
includes all of the costs and revenues associated with land development and
the timing thereof. The model allows the financial performance of a
development proposal to be calculated.
6.2.2 The model was built using the in-house financial modelling expertise within
Tauranga City Council based on specifications provided by Martin Udale. The
model itself is similar to that used for most major property developments. It has
been reviewed and approved by the three development companies and it has
also been independently audited by Epsilon & Associates Ltd.
6.3 Revenue inputs
6.3.1 Revenue comes from the sale of developed land. Sale prices for developed
land (i.e. residential or industrial sections) were obtained from a registered
valuer (Nigel Dean of Colliers International). A range of sale prices were
provided based on different section sizes ranging, in the case of residential
development, from 200m2 to 700m2. An average sale price was then
determined in consultation with the developers based on the required yield and
the likely mix of section sizes necessary to achieve this yield.
176.4 Cost inputs
6.4.1 Cost inputs into the land development equation can be broken down into the
following categories:
Land purchase costs
Development setup costs
Construction costs
Council costs
Indirect costs
Direct sales costs
Project finance costs.
Land cost
6.4.2 Land cost and purchasing arrangements can be a key determinant of the
viability of a development. The financial model is designed to calculate what a
developer could afford to pay for land. This amount can then be compared to
what developers have actually paid (or agreed to pay) for land or the likelihood
of that dollar amount being acceptable to the landowner. Alternately, a specific
dollar amount for land purchase can be entered into the model along with other
costs to determine the average amount that sections would have to be sold for
if the development were to be viable. This section price can then be compared
against the likely market demand for sections at that price.
6.4.3 The timing of land purchase can also be important. The closer land purchase
can be aligned with land development and section sales timeframes the more
can be paid for land as interest costs and risk are reduced. As such,
purchasing land in small increments as required is preferable to purchasing it
all upfront.
6.4.4 It needs to be recognised that for land to change from its current rural use to an
urban use, a premium must be paid for the land. In other words the amount
paid needs to exceed the present value of a property given its current land use
and taking into account other uses already permitted on the land.
6.4.5 The underlying value of land in Wairakei for rural use with no prospect of urban
development has been estimated by Middleton Valuation at $45,000 to $55,000
per hectare depending on soil conditions. Peat soils are at the lower end of this
range and sandy soils at the higher end.
6.4.6 While a detailed discussion of the market for developable land is outside the
scope of this report, it should be recognised that there are a number of reasons
why the premium paid for land above its underlying value is likely to be
significant. These include:
Vendors only have one chance to sell their land and are therefore likely to
hold out for a high price rather than sell quickly for a small profit
Land blocks have often been used as family owned farms for many years
and have little or no debt. This means that landowners are under no
urgency to sell and are happy to wait for the market to meet their price
expectations
Finite supply of developable land blocks
Expectations set by the unsustainably high prices paid for developable land
through the ‘boom’ years of the mid 2000’s
Expectations set by the rezoning or impending rezoning of land for urban
development
18 Competition from overseas investors.
Development setup costs
6.4.7 Development setup costs are associated with planning approval processes
associated with the rezoning of land. Much of these costs have already been
incurred in the case of Wairakei.
Construction costs
6.4.8 Construction costs can be divided into estate costs (bulk infrastructure) and per
lot costs. Estate costs relate to the cost of building infrastructure assets that
cannot be staged as development proceeds e.g. lead infrastructure. There is
relatively little in the way of estate costs for Wairakei except for stormwater
ponds as most lead infrastructure is built by Council and funded by way of
development contributions. Estate cost estimates have been sourced from
S&L Consultants and from Council’s own experience with similar projects.
6.4.9 Per lot construction costs relate to the direct costs of delivering finished lots.
They are made up of earthworks, roads, services (water, wastewater,
electricity, gas and telecommunications), landscaping, design and supervision.
Per lot construction costs have been sourced from S&L Consultants. They are
based on a revision of actual costs associated with the construction of the
Excelsa Village development in nearby Papamoa.
Council costs
6.4.10 Council costs relate to resource consents (both land use and subdivision), 223
and 224 certificates, development contributions (subdivision impact fees) and
rates. The costs are based on Council’s operative fees at the time the report
was written. Because Council is reviewing some cost estimates for projects in
Wairakei the draft 2011/12 development contributions for Wairakei may prove
to be different to the amounts used in this Report although not to the extent that
it would alter the conclusions that have been reached.
Indirect costs
6.4.11 Indirect costs include utilities, insurance, site office, security, office expenses,
project management, administration, legal, consultants, bank charges,
valuations, accounting and marketing. The amount of these costs is based on
Martin Udale’s experience with other large development projects (such as
Addison in Takanini, Auckland) and the developers’ experience.
Direct sales costs
6.4.12 Direct sales costs are made up of real estate agent commissions and legal
costs associated with sale and purchase agreements and the transfer of legal
title. The amount of these costs is again based on Martin Udale’s experience
with other projects and the developers’ experience.
19Project finance
6.4.13 Project finance relates primarily to the interest incurred on debt used to finance
the project. Holding costs have been calculated on the net debt position of the
project over time. The interest rate used to calculate holding costs is 10%.
This figure has been agreed as a reasonable long term average by the Project
Team in consultation with Council’s Treasury Manager and property lending
experts within the banking sector6.
6.4.14 The financing assumptions used in the financial model are relatively simple.
They are that:
Land purchase cost will be funded 50% by debt and 50% by equity
Other costs will be funded 70% by debt and 30% by equity
A minimum working capital amount funded by equity of $1m at all times
A bank interest rate of 10% which is assumed to also include all bank fees
e.g. the cost of settling up and rolling over banking facilities.
6.4.15 Other financial measures commonly used in relation to property development
financing such as loan to value ratios (LVRs) and interest cover ratios have
been ignored for the purposes of this project due to the complexity that they
add.
Confidential information
6.4.16 Some of the cost inputs used in the financial model are commercially sensitive
and have been supplied by the developers on a confidential basis.
6.5 Inflation
6.5.1 The financial model has been designed to allow the impact of different inflation
assumptions to be considered. The model allows for separate inflation
assumptions for costs and for revenue. It also allows the time period over
which these inflation assumptions apply to be selected.
6.5.2 The base financial model assumes no inflation for a number of reasons:
Difficulty of making accurate assumptions about what inflation is likely to be,
especially in regards to section prices (revenue)
That if both costs and revenues are inflated by the same amount they
largely cancel each other out
To mitigate risk, the financial viability of a development should not rely on
significant increases to section prices over its lifespan i.e. the development
should ‘stand on its own feet’ given current information about costs and
revenues.
6.5.3 Despite this, a number of scenarios have been run with different cost and
revenue inflation assumptions to understand the sensitivity of the model to
these assumptions. Assuming the development is profitable, it should be noted
that if the same inflation rate was applied to both costs and revenue it would
increase the profitability of a development. However, the view of the project
team is that affordability constraints will limit section sales price increases to
low levels in short to medium term.
6
ANZ National Bank.
206.6 Financial analysis
6.6.1 Three financial measures are used to analyse whether development is feasible.
They are the gross margin, the project internal rate of return and the equity
internal rate of return. These are commonly used in the evaluation of
development projects by developers and financiers.
6.6.2 The gross margin is a key measure of the financial viability of the project. It is
calculated by dividing net profit before tax by total costs. A gross margin of
about 20% or greater would be acceptable for the project to proceed.
6.6.3 Internal rate of return (IRR) is another measure of a project’s profitability. In
more specific terms, the IRR of a project is the interest rate at which the net
present value of costs (negative cash flows) of a project is equal to the net
present value of the benefits (positive cash flows) of a project. Two IRR
calculations are used to assess development feasibility.
1. The Project IRR (excluding funding costs): This measures the return on
investment for all cashflows (revenues and expenses) in the project
excluding funding costs. A Project IRR excluding bank interest in the range
of about 18-20% is broadly acceptable for development to proceed.
2. The Equity IRR: This measures the return on equity by calculating the
interest rate required to make the net present value of equity injections and
withdrawals equal to zero. An equity IRR in the range of 20-25% has been
agreed as broadly acceptable for the purpose of development proceeding.
6.6.4 While developers own expectations of an appropriate gross margin and internal
rate of return are important, the main driver of the agreed gross margin and
internal rates of return is what the banking industry would expect to see if it
were to provide project finance. It is critical that these measures are
acceptable to the banking sector as without project finance, development
cannot be undertaken. In light of this the assumptions adopted above were
reviewed and approved as being reasonably reflective of banking industry
practice by ANZ National Bank.
6.7 Timing of revenues and costs
6.7.1 The timing of revenue and costs is driven by an agreed development scenario.
This scenario assumes that 150 lots per annum will be developed in the first
five years of the project, 220 lots per annum in the five years after this and 350
lots per annum from then on. This scenario is based on analysis of likely
development uptake contained in the Tauranga City Council report titled
Wairakei Development Timeframe and Local Services Cost Recovery and has
been vetted and confirmed as reasonable by the developers involved. It is
assumed that section sales will increase overtime as developments build
momentum and as the remaining development opportunities in the adjoining
Papamoa area are exhausted. Section sales are assumed to be evenly split
between the two main Wairakei developers while both still have land to
develop.
6.7.2 In terms of industrial land uptake, it is assumed that about 3.5 hectares per
annum will be developed in Wairakei initially with this increasing over time to
about 6.5 hectares per annum. This is based on an assessment of total
demand for industrial land in Tauranga City and an allocation of this demand by
21geographic areas based around main transport corridors. Industrial land take
up (i.e. demand) has been monitored by Council over many years which
provides a reasonable basis for the assumptions above.
6.7.3 Given the timing of the delivery of finished lots discussed above, costs and
revenues have been timed to occur in a realistic fashion. The majority of costs
are incurred prior to sales revenue being received.
6.7.4 The timing of costs and revenues is important as it determines the overall debt
position of the development and thus the amount of interest costs incurred. To
minimise interest costs it is assumed that, within reason, costs will be incurred
on a just in time basis.
6.8 Goods and services tax
6.8.1 All costs and revenues in the financial model are gst exclusive. However when
considering retail section prices and house prices, gst is added because
consumers are required to pay gst. The gst rate is assumed to be 15%.
6.9 Developer / property specific model scenarios
6.9.1 Two base financial models have been built – one for residential development
and one for industrial development. The residential development model has
two different base scenarios – one for each of the two developers. This is done
to allow the differences in the cost inputs for the two developers to be reflected
accurately. The only significant differences between the two residential model
scenarios are the land purchasing arrangements (price and timing) and the
length of the two developments (one goes for longer than the other because
one land block is larger than the other).
6.9.2 No assessment of the feasibility of developing the town centre and commercial
zones has been made due to the 20 year plus timeframe for this development
to begin.
6.10 ‘Bottom up’ and ‘top down’ approaches
6.10.1 The financial viability model can work in two ways. The first is what is termed
the ‘bottom up’ approach. This involves adding in all costs including land costs
and an appropriate profit margin to determine the average price that sections
need to sell for in order for the project to be financially viable.
6.10.2 The ‘top down’ approach on the other hand starts with the net realisation (total
revenue from sections sales based on the likely average section price). From
this, development costs and an appropriate profit are removed. What is left is
the amount of money a developer can afford to pay for the land to make
development viable. This is termed the residual land value.
6.11 Residential construction
6.11.1 The residential financial model has been extended beyond land development to
include house construction. This has been done to determine the full cost of
new houses in Wairakei and to allow an assessment of this against the likely
demand for product in this price range.
6.11.2 Construction costs have been sourced from the building industry in Tauranga.
The building industry in Tauranga is highly competitive. It was felt that sourcing
construction costs directly from the local building industry would be more
22accurate and efficient than building a separate financial model for construction
similar to the financial model used for land development. This approach also
had the advantage of allowing Council staff to build better and more
constructive working relationships with this industry.
6.11.3 A variety of housing types from small modest homes to reasonably large
homes has been used to provide an indication of the possible range of final
house prices in Wairakei. It should be noted that these costs are based on
contract build prices and not spec homes. Because of the additional risk and
costs associated with spec homes (e.g. real estate agent commission) the cost
of spec homes would be somewhat higher. It is conceivable that 50% of the
homes built in Wairakei might be spec homes.
6.11.4 Construction costs include appliances (excluding a fridge), floor coverings,
curtains / blinds, driveways, paths, lawns, landscaping, fences, building plans
and Council costs including building consent and development contributions
(building impact fees).
6.11.5 In terms of construction materials they were almost exclusively based on single
level brick and tile construction. The base model assumptions for residential
construction use the average building costs from the builders surveyed plus an
additional 10% margin. The addition 10% reflects a number of factors:
Design rules or restrictive covenants are likely to increase costs e.g. they
may restrict or prohibit the use of brick and tile construction in favour or
more expensive options such as weatherboard or plaster cladding.
Some of the product offered, especially on smaller sites, is likely to be two
stories. This increases construction costs.
Some homes will be built by building firms whose focus is more towards the
higher end of the market compared to the building firms surveyed who tend
to focus more at the value end of the market.
The need to offer a quality, well designed product due to the relatively high
density of the product offering compared with traditional residential densities
in Tauranga.
The likelihood that some customers will customise the builders’ standard
plans which generates additional cost.
Recent increase to building costs e.g. concrete.
The impending increase in gst from 12.5% to 15% as it was at the time the
building cost data was collected.
6.12 Model accuracy
6.12.1 While every reasonable effort has been made to ensure data inputs are
accurate it should be recognised that this type of exercise is not a science and
the model cannot be expected to be 100% accurate for numerous reasons
such as the lack of any detailed designs for development in Wairakei and
general uncertainty about the future. To address this, a significant amount of
sensitivity analysis has been undertaken to determine the impact on
development feasibility of adopting alternate assumptions within the model.
237. Residential development feasibility
7.1 Base model
7.1.1 The cost and revenue assumptions used in the base model are set out in the
Table below. They are based on two different scenarios. Scenario 1 is that
land is purchased on a yearly basis as required at a rate of $350,000 per
hectare and Scenario 2 is based on land being purchased by way of an upfront
lump sum at the beginning of the development at a rate of $140,000 per
hectare. More detail about the base model assumptions can be found in
Attachment B.
Table 3: Base financial model assumptions for residential development in Wairakei
Scenario 1 Scenario 2
$ per lot % of total $ per lot % of total
(excl. gst) costs (excl. gst) costs
Revenue
Average section sale price $135,900 124.5% $135,900 142.6%
Cost
Land purchase $25,300 23.2% $10,100 10.6%
Lead infrastructure $11,800 10.8% $11,800 12.4%
Lot development costs $32,200 29.5% $32,200 33.8%
Development contributions7 $22,800 20.9% $22,800 23.9%
Rates $1,000 0.9% $1,000 1.1%
Other Council fees $2,600 2.4% $2,600 2.7%
Direct sales costs $5,100 4.7% $5,100 5.4%
Development & project mngt $4,100 3.7% $4,100 4.3%
Other costs $3,200 2.9% $3,200 3.3%
Bank interest $1,000 0.9% $2,300 2.4%
Total costs $109,100 100% $95,200 100%
7
See Attachment B for a full breakdown of the development contribution charges (i.e. subdivision
impact fees).
24You can also read