An Analysis of the Operational Costs of Trucking: 2017 Update - October 2017 - American ...
←
→
Page content transcription
If your browser does not render page correctly, please read the page content below

An Analysis of the Operational
Costs of Trucking: 2017 Update
                      October 2017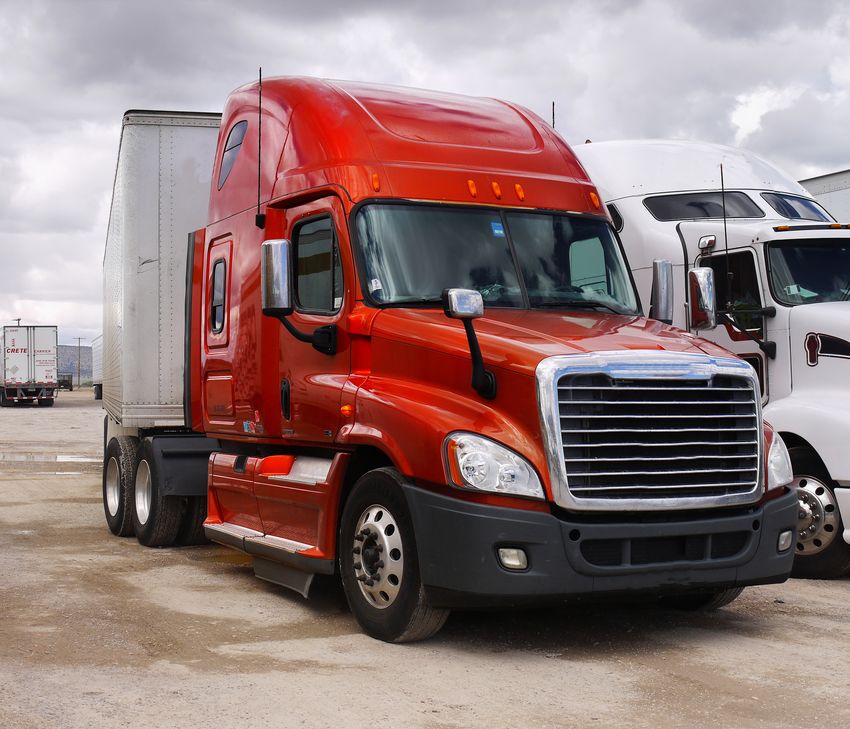
An Analysis of the Operational Costs of Trucking:
                   2017 Update

                         October 2017

                        Alan Hooper
                     Research Associate
           American Transportation Research Institute
                         Atlanta, GA

                         Dan Murray
                   Vice President, Research
           American Transportation Research Institute
                       Minneapolis, MN

                  950 N. Glebe Road, Suite 210
                    Arlington, Virginia 22203
                       www.atri-online.org
ATRI BOARD OF DIRECTORS

Judy McReynolds                 Robert E. Low
Chairman of the                 President and CEO
ATRI Board                      Prime Inc.
Chairman, President and CEO     Springfield, MO
ArcBest Corporation
Fort Smith, AR                  Rich McArdle
                                President
David S. Congdon                UPS Freight
Vice Chairman and CEO           Richmond, VA
Old Dominion Freight Line
Thomasville, NC                 Gregory L. Owen
                                Head Coach and CEO
Michael L. Ducker               Ability/ Tri-Modal
President and CEO               Transportation Services
FedEx Freight                   Carson, CA
Memphis, TN
                                Annette Sandberg
Rich Freeland                   President and CEO
President and COO               Transsafe Consulting, LLC
Cummins Inc.                    Davenport, WA
Columbus, IN
                                Rebecca M. Brewster
Hugh H. Fugleberg               President and COO
President and COO               American Transportation
Great West Casualty Company     Research Institute
South Sioux City, NE            Atlanta, GA

Dave Huneryager                 Chris Spear
President and CEO               President and CEO
Tennessee Trucking              American Trucking
Association                     Associations
Nashville, TN                   Arlington, VA

Derek Leathers
President and CEO
Werner Enterprises
Omaha, NE
ATRI RESEARCH ADVISORY COMMITTEE
Scott Mugno, RAC Chairman            Sanford Hodes                         Karen Rasmussen
Vice President, Safety,              Ryder System, Inc.                    President and CEO
Sustainability and Vehicle           Senior Vice President and Deputy      HELP Inc.
Maintenance                          General Counsel
FedEx Ground                                                               Wellington F. Roemer, III
                                     Ken Howden                            President and CEO
Jon Blackham                         Director, 21st Century Truck          Wellington F. Roemer Insurance,
Policy and Government Affairs        Partnership                           Inc.
Canadian Trucking Alliance           U.S. Department of Energy
                                                                           Lee Sarratt
Amy Boerger                          Kelly Killingsworth                   Director of Safety
Vice President, Sales                VP of Inbound Transportation          J.B. Hunt
Cummins, Inc.                        Wal-mart Stores, Inc.
                                                                           Mark Savage
Bill Brown                           Victoria King                         Deputy Chief
Manager of Fleet Telematics          VP Public Affairs                     Colorado State Patrol
Southeastern Freight Lines           UPS
                                                                           Andrea Sequin
Michael Conyngham                    Dustin Koehl                          Director, Regulatory Services
Director of Research                 Vice President, Sales and             Schneider National, Inc.
International Brotherhood of         Marketing
Teamsters                            Total Transportation of Mississippi   Carl Stebbins
                                                                           Corporate Director of
Bob Costello                         Caroline Mays                         Admissions and Marketing
Senior Vice President and Chief      Director, Freight and International   New England Tractor Trailer
Economist                            Trade Section                         Training School
American Trucking Associations       Texas DOT
                                                                           Harold Sumerford, Jr.
Tom Cuthbertson                      Brian McLaughlin                      Chief Executive Officer
Vice President, Regulatory           President                             J&M Tank Lines
Compliance                           Trimble Transportation Mobility
Omnitracs, LLC                       Minnetonka, MN                        James E. Ward
                                                                           President and CEO
Dennis Dellinger                     Lisa Mullings                         D.M. Bowman
President                            President and CEO
Cargo Transporters                   National Association of Truck Stop    Tom Weakley
                                     Operators                             Director of Operations
Chip Duden                                                                 Owner-Operator Independent
Vice President, Strategic Business   Tom Murtha                            Drivers Association Foundation
Analytics                            Senior Planner
Werner Enterprises                   Chicago Metropolitan Agency for
                                     Planning
Paul J. Enos
Chief Executive Officer              Brenda Neville
Nevada Trucking Association          President
                                     Iowa Motor Truck Association
Scott George
Chief Executive Officer              Dean Newell
TCW, Inc.                            Vice President, Safety
                                     Maverick, Inc.
Mike Golias
Director for Research,               Steve Raetz
Intermodal Freight Transportation    Director of Research and Market
Institute                            Intelligence
University of Memphis                C.H. Robinson Worldwide, Inc.

Victor Hart
Director of Safety
DOT Transportation, Inc.
TABLE OF CONTENTS

FIGURES AND TABLES ................................................................................................. 2
LIST OF ACRONYMS ..................................................................................................... 3
INTRODUCTION ............................................................................................................. 4
RESEARCH OBJECTIVE ............................................................................................... 5
METHODOLOGY ............................................................................................................ 6
   Representativeness ..................................................................................................... 9
RESPONDENT DEMOGRAPHICS ............................................................................... 10
   Size of Operation ....................................................................................................... 10
   Type of Operation ...................................................................................................... 11
   Equipment .................................................................................................................. 12
MOTOR CARRIER COSTS .......................................................................................... 17
   Fuel ............................................................................................................................ 17
   Equipment .................................................................................................................. 20
   Driver Pay .................................................................................................................. 20
FINDINGS ..................................................................................................................... 21
   Average Marginal Costs ............................................................................................. 21
   Line Item Costs .......................................................................................................... 26
      Fuel Costs .............................................................................................................. 26
      Equipment Lease or Purchase Payments............................................................... 28
      Repair and Maintenance ......................................................................................... 29
      Truck Insurance Premiums ..................................................................................... 31
      Permits and Special Licenses ................................................................................. 32
      Tires ........................................................................................................................ 33
      Tolls ........................................................................................................................ 33
      Driver Wages and Benefits ..................................................................................... 33
   Costs by Region......................................................................................................... 35
   Straight Trucks ........................................................................................................... 35
CONCLUSION .............................................................................................................. 37
APPENDIX A ................................................................................................................. 38

                                                                        An Analysis of the Operational Costs of Trucking:
  1                                                                                                         2017 Update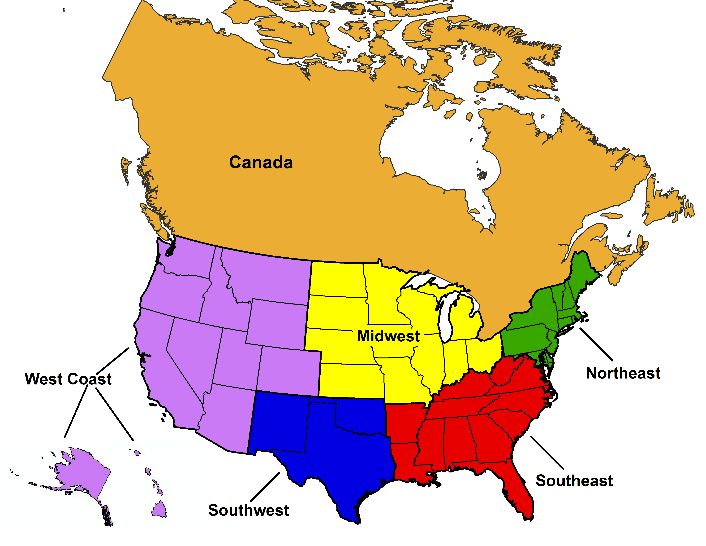
FIGURES AND TABLES

Figure 1: New and Expanded Survey Questions............................................................. 7
Table 1: For-Hire Industry Sector Breakout ..................................................................... 9
Figure 2: Respondent Fleet Size ................................................................................... 10
Table 2: Respondent Revenue Statistics ...................................................................... 11
Table 3: Survey Respondent Trip Types ....................................................................... 11
Table 4: Survey Respondent Truck VMT and National Truck Registrations by Region 12
Table 5: Survey Respondent Truck/Trailer Type, Average Truck Age, and Average
Miles Driven per Year per Truck .................................................................................... 13
Table 6: Survey Respondent Equipment Trade Cycle................................................... 13
Table 7: Survey Respondent Reported Fuel Economy Compared to Typical Operating
Weight and Average Operating Speed .......................................................................... 15
Figure 3: Average U.S. On-Highway Diesel Prices, 2008 – 2015 ................................. 18
Figure 4: Average U.S. On-Highway Diesel Prices, 2016 ............................................. 19
Table 8: Average Marginal Costs per Mile, 2008-2016 ................................................. 23
Table 9: Average Marginal Costs per Hour, 2008-2016 ................................................ 23
Table 10: Annual Change of Average Marginal Costs .................................................. 24
Table 11: Share of Total Average Marginal Cost, 2008-2016 ....................................... 25
Table 12: Average Total Marginal Costs by Sector, 2008-2016 .................................... 26
Figure 5: Respondent Fuel Cost per Mile by Fleet Size ................................................ 28
Table 13: Change in Annual VMT per Truck ................................................................. 29
Table 14: Repair and Maintenance Costs by Sector ..................................................... 30
Figure 6: Respondent Repair and Maintenance Cost per Mile by Fleet Size ................ 31
Figure 7: Respondent Truck Insurance Premium Costs per Mile by Fleet Size ............ 32
Table 15: Single Driver Bonus Pay by Type .................................................................. 34
Table 16: Average Marginal Cost per Mile by Region, 2016 ......................................... 35
Table 17: Straight Truck Average Marginal Costs per Mile, 2016 ................................. 36

An Analysis of the Operational Costs of Trucking:
2017 Update                                                                                                        2
LIST OF ACRONYMS

ATA     American Trucking Associations
ATRI    American Transportation Research Institute
BLS     Bureau of Labor Statistics
CFO     Chief Financial Officer
CNG     Compressed Natural Gas
CPH     Cost per Hour
CPM     Cost per Mile
CSA     Compliance, Safety, Accountability
EIA     Energy Information Administration
ELD     Electronic Logging Device
FHWA    Federal Highway Administration
FMCSA   Federal Motor Carrier Safety Administration
FPM     Freight Performance Measures
HOS     Hours-of-Service
LCV     Longer Combination Vehicles
LNG     Liquefied Natural Gas
LTL     Less-than-Truckload
MC      Marginal Cost
MPH     Miles per Hour
NDA     Non-Disclosure Agreement
P&D     Pick-up and Delivery
RAC     Research Advisory Committee
R&M     Repair and Maintenance
TL      Truckload
VMT     Vehicle Miles Traveled

                                         An Analysis of the Operational Costs of Trucking:
 3                                                                           2017 Update
INTRODUCTION Since 2008, the American Transportation Research Institute (ATRI) has published An Analysis of the Operational Costs of Trucking, an annual report aimed at providing more accurate marginal cost data on motor carrier operations. In the 2008 inaugural study, ATRI identified historical research that reported cost calculation findings ranging from $22 per hour to over $370 per hour1 – figures which were considered unreasonably high or low by many in the trucking industry. Additionally, some of these studies calculated costs using highly subjective “value-of-time” calculations that may extend far beyond direct costs – resulting in dramatic variability for industry costs depending on the metrics used. Consequently, ATRI undertook research to document and quantify motor carriers’ key operational costs, stratified by fleet size, sector, and region of the country. The goal of this research was to accurately identify and promulgate current operational costs based on real-world data provided directly by motor carriers. The resulting analyses could then be used by both motor carriers as a high-level benchmarking tool, and by public sector agencies for various transportation impact assessments. This research was initially identified as a top research priority by ATRI’s Research Advisory Committee (RAC). 2 The RAC sought more accurate cost data to better inform policymakers on the impact that new and potentially inefficient transportation funding strategies could have on freight movement. The trucking industry, which is heavily reliant on the 4 million miles of public roadway in the United States, 3 has a vested interest in efficient, effective, and equitable funding and maintenance of the nation’s transportation system. Since its original publication in 2008, ATRI has received over 13,500 requests for the Analysis of the Operational Cost of Trucking reports. Based on the continual high demand for this research, ATRI has updated the “ops cost” data on an annual basis, making minor adjustments and improvements to the data collection methodology as needed. Over the years, these improvements have led to a more streamlined process for obtaining sensitive and proprietary fleet cost data on an annual basis. This report includes the most recent 2016 cost data. 1Trego, Todd. An Analysis of the Operational Costs of Trucking. American Transportation Research Institute. Arlington, VA. 2008 2 The American Transportation Research Institute (ATRI) Research Advisory Committee (RAC) is comprised of industry stakeholders representing motor carriers, trucking industry suppliers, labor and driver groups, law enforcement, federal government, and academics. The RAC is charged with annually recommending a research agenda for the Institute. 3 Table HM-20 Public Road Length – Miles by Functional Class. Highway Statistics Series 2015. Federal Highway Administration, United States Department of Transportation. Available online: https://www.fhwa.dot.gov/policyinformation/statistics/2015/pdf/hm20.pdf An Analysis of the Operational Costs of Trucking: 2017 Update 4
RESEARCH OBJECTIVE

This research is predicated on the need for accurate and timely operational cost data in
the trucking industry. Although previous studies conducted by consultants and
academic entities have attempted to quantify these costs, the use of modeled data or
highly subjective value-of-time metrics produced immensely inconsistent results that
were considered inaccurate or political by industry stakeholders. These disparate
results can be detrimental to both the trucking industry and public sector transportation
planners seeking objective, standardized data. For instance, lower operational cost
estimates have been used to downplay the value or significance of certain
transportation investments, while unreasonably high figures have been used to
minimize the financial impact that innovative financing initiatives have on trucking
companies and drivers.

Continued improvements in ATRI’s operational cost methodology from 2008 through
2016 4 have resulted in more precise cost metrics. The result of this research is a
standardized survey methodology that captures and analyzes sensitive motor carrier
operational costs. The data presented in this report reflects 2016 cost data collected
from a wide range of motor carriers. With the addition of this 2016 data, ATRI has now
collected nine years (2008 – 2016) of detailed operational cost data, providing an
invaluable presentation of changing industry costs over time.

4Torrey, W. Ford and Dan Murray. An Analysis of the Operational Costs of Trucking: A 2016 Update. American
Transportation Research Institute. Arlington, VA. 2016.
                                                          An Analysis of the Operational Costs of Trucking:
    5                                                                                         2017 Update
METHODOLOGY This 2017 analysis utilized a similar data collection methodology to previous years. Several changes were made to the survey to allow for more detailed analyses of truck industry segments and other operational factors in subsequent years as ATRI’s respondent base continues to grow. The first expansion in the 2017 survey was to allow respondents to provide a more detailed classification of their business operations. The list was expanded to include operations that had previously been categorized as “Specialized;” namely Flatbed, Tanker, Express / Parcel Service, and Automotive Transportation operations (Figure 1). To account for this change, a second question was altered to collect information on the asset count and age from a more robust selection of trailer types to reflect the new business operation categories for which information was requested. Another question was modified to allow for the collection of more granular incentive and bonus pay for both single and team truck-tractor drivers. Financial incentive and bonus pay per driver were requested for a set of standard industry incentives – safety bonus, on-time delivery bonus, new / starting driver bonus, and retention bonus – and aligned with the same driver classifications for which driver wage and benefit data were collected. These alterations will allow for a more comprehensive analysis of driver compensation than had been possible in previous years. The most significant addition to the 2017 survey was an expansion of the information collected specifically on straight trucks, with a new section of the survey dedicated to the costs associated with operating these trucks (Appendix A). Respondents are now asked to provide a similar set of operational and cost data for straight trucks as had been solicited for truck-tractors in previous iterations of the survey. The goal of this major expansion is to build a cost history and analysis for straight trucks in parallel with ATRI’s current analysis of truck-tractor data. This expanded research scope will allow researchers and practitioners to assess operational costs of straight trucks as their use proliferates with surging last-mile deliveries fueled by e-commerce. An Analysis of the Operational Costs of Trucking: 2017 Update 6
Figure 1: New and Expanded Survey Questions
Expanded Question:
What is your primary for-hire business operation type? (Select one)
Truckload
Less-Than-Truckload
Flatbed
Tanker
Express / Parcel Service
Intermodal Drayage
Automotive Transportation
Dedicated Services
Household Goods Mover
Other (please specify):
Expanded Question:
What was your company’s fleet size, average age and average number of miles traveled (including
owner operators) in 2016 for each equipment type?
Number of Average Age
Trailer Type
Assets (in years)
28’ Trailer
45’ Trailer
48’ Trailer
53’ Trailer
Tank
Flatbed
Auto Transporter
Refrigerated Trailer
Other (please specify):
Other (please specify):
Other (please specify):
Expanded Question:
Do you provide any additional financial incentives and/or bonus pay for SINGLE TRUCK-TRACTOR
drivers that are not part of their regular wages?
Yes No Don’t Know
If yes, what was the average incentive and/or bonus pay paid per driver in 2016? (Please report as an
annual average paid per driver.)
Company Driver / Leased Driver /
Type of Bonus Owner Operator
Company Truck Company Truck
Safety Bonus
On-Time Delivery Bonus
New / Starting Driver
Retention Bonus
An Analysis of the Operational Costs of Trucking:
7 2017 UpdateIn addition to a host of demographic queries, the data collection form solicited common industry operational and financial metrics, and was beta-tested with motor carriers. Specifically, the research team solicited technical guidance and review from industry financial officers or those with working knowledge of motor carrier cost structures. Due to the highly competitive nature of the trucking industry and the extreme sensitivity associated with corporate financials and expenditures, the operational cost information was collected confidentially from motor carriers at the per-mile or per-hour level, and the data is presented in aggregate form only. ATRI also provided survey respondents with non-disclosure agreements (NDA) as requested. Data collection efforts commenced in June 2017, with data request forms being sent electronically to a representative group of for-hire carriers which included truckload (TL), less-than-truckload (LTL), and specialized fleets. ATRI also solicited carrier participation through targeted industry mailings and emails, news alerts, and coverage in major industry news outlets. The 50 State Trucking Associations also solicited carrier participation from their respective memberships. Participants were provided several options for submitting data to ATRI: utilizing the online response form, or transmitting the data to ATRI via email or fax. All responses were carefully reviewed by the research team for clarity, and the research team contacted respondents to clarify any ambiguous responses as needed. Responses were collected through the end of September 2017. The survey’s composition was primarily focused on components and sub-components of carrier marginal costs per mile (CPM), which allows for comparative analyses across the different industry business models. In order to convert line-item CPM figures into a total marginal cost per hour (CPH) figure, a GIS-generated, industry-vetted average operational speed of 39.98 miles per hour (MPH) was used in these calculations. It should be noted that this speed relates to moving trucks only, and includes all roadway speeds rather than solely highway speeds. 5 To ensure representativeness, ATRI then weighted survey responses to reflect industry- standard shares of the major for-hire trucking sectors. Compared to national averages, Specialized carriers were over-represented in the survey sample while LTL and TL carriers were slightly under-represented (Table 1). As noted, responses were weighted to national industry averages to yield more representative results. 5 ATRI derived this speed using several datasets from the ATRI/Federal Highway Administration (FHWA) Freight Performance Measures (FPM) program. ATRI analyzed one full week of national FPM data in each of the four seasons in 2010 (February, May, August, October). This dataset consisted of over 110 million truck speed data points. The average speed figure was also validated by multiple motor carriers from various sectors of the industry. The 39.98 mph figure more accurately represents an average operational speed since it includes speeds in all types of operational conditions. An Analysis of the Operational Costs of Trucking: 2017 Update 8
Table 1: For-Hire Industry Sector Breakout
                                                ATRI Survey                  U.S. Trucking
                 Industry Sector
                                                Respondents                    Industry 6
            Truckload                                 47.6%                        52%
            Less-than-Truckload                       13.1%                        24%
            Specialized                               39.3%                        24%

Where applicable, cost data were cross-tabulated by factors such as fleet size,
operating sector, and operating region. Again, the data collected are presented in
aggregate form in order to protect proprietary carrier information.

Representativeness

The “ops cost” surveys were generally completed by high-level managers and
executives who have extensive knowledge of the financial workings of the
organizations; namely presidents, chief financial officers (CFOs), general managers,
business intelligence analysts, and fleet owners. The fleets represent long-haul to local
pick-up and delivery, carrying a vast assortment of commodities and operating across
the U.S. Additionally, the fleets cover the continuum of fleet size and revenue levels.
As such, ATRI considers the data to be an adequately representative sample of the
industry population from which to draw current operational cost data.

6 2002 Vehicle Inventory and Use Survey. United States Department of Commerce, Economics and Statistics

Administration, United States Census Bureau. Available online: https://www.census.gov/svsd/www/vius/2002.html
                                                           An Analysis of the Operational Costs of Trucking:
  9                                                                                            2017 Update
RESPONDENT DEMOGRAPHICS
Size of Operation
With respondents accounting for a total of 85,305 truck-tractors, 4,359 straight-trucks
trucks, and 411,956 total trailers, the 2017 Operational Costs of Trucking Survey has
yielded another strong sample of motor carriers. The carriers surveyed this year
accumulated almost 9 billion miles in 2016 across a variety of industry segments and
fleet sizes, an increase of 36 percent from the roughly 6.6 billion miles reported in 2015.
19.5 percent of these miles were non-revenue or “dead-head” miles, down slightly from
the 20.4 percent reported by respondents in 2015. The average fleet in the sample
operated 838 power units, though responses were again skewed toward smaller firms
as indicated by a median fleet size of 97 power units. Indeed, a majority of respondents
represented smaller fleets, with 63.6 percent operating fleets with 250 or fewer power
units (Figure 2). On the other end of the continuum, 20.6 percent of respondents
operated fleets with 251 and 1,000 power units, while the remaining 15.9 percent
reported fleets in excess of 1,000 power units (Figure 2).
Figure 2: Respondent Fleet Size
Greater than
1,000 Power Less than 5 Power
Units, 16% Units, 16%
5 - 25 Power
Units, 9%
251 - 1000
Power Units,
21%
26 - 100 Power
Units, 26%
101 - 250
Power Units,
12%
Further corroborating the representation of smaller fleets in the broad continuum of
respondents’ operations is the similar trend that emerges when analyzing reported
revenues (Table 2). The large gap between the average annual trucking-related
revenue reported for 2016 ($307,381,241) and the median ($17,797,000) reflect the
relatively greater proportion of smaller fleets in the sample. Very large operations in the
respondent pool can ultimately skew averages for metrics like fleet size and revenue
upward, so statistical measures such as the median can more accurately reflect the
broader survey sample.
An Analysis of the Operational Costs of Trucking:
2017 Update 10Table 2: Respondent Revenue Statistics
Percentile Revenue
75th Percentile $74,272,447
50th Percentile (Median) $17,797,000
25th Percentile $5,348,017
Average (Mean) $307,381,241
Type of Operation
The respondents in this year’s sample were predominantly focused on local and
regional pick-ups and deliveries where the average haul lengths were less than 500
miles per trip. An average of 61 percent of respondent trips were of the local and
regional variety, while 23 percent of the respondents’ trips were inter-regional. The
remaining 16 percent of the respondents’ trips were longer, national trips in excess of
1,000 miles traveled (Table 3).
Table 3: Survey Respondent Trip Types
Survey Respondent
Trip Type
Share of Trips
Local pick-ups and deliveries (less than 100 miles) 21%
Regional pick-ups and deliveries (100-500 miles) 40%
Inter-regional pick-ups and deliveries (500-1,000 miles) 23%
National (over 1,000 miles) 16%
Comparing respondents’ 2016 share of U.S. vehicle miles traveled (VMT) by region to
commercial truck registrations by region provides another indication of the
representativeness of the ATRI survey sample. As can be seen in Table 4, the share of
respondents’ operations in each U.S. region roughly aligns with the share of truck
registrations by region. The Midwest and Southwest were again slightly under-
represented in this year’s sample, while the Northeast and Southeast were slightly over-
represented. This finding may highlight the common occurrence of motor carriers
having different headquarter locations from where they “base state” the fleet, for cost-
saving purposes.
An Analysis of the Operational Costs of Trucking:
11 2017 UpdateTable 4: Survey Respondent Truck VMT and National Truck Registrations
by Region
Survey Respondent Share of U.S. Truck
Region
Share of Miles Traveled 7 Registrations 8
Midwest 34% 39%
Northeast 13% 8%
Southeast 23% 20%
Southwest 11% 13%
West 18% 20%
When asked to identify the primary commodities hauled in respondents’ operations,
responses were concentrated in general freight, retail store/general merchandise,
agricultural products, automotive parts and vehicles, and construction/building
materials.
Equipment
The trucking industry hauls a majority of freight in the United States, accounting for 66
percent of the nation’s freight tonnage and 73 percent of freight value. 9 Similar to the
previous year’s analysis, a sizable majority of responding fleets operated truck-tractors
as their primary type of power unit in 2016. A typical truck-tractor in the ATRI sample
was reported to have driven 103,945 miles per year, compared to just 25,511 miles for
straight trucks. As expected, 28- and 53-foot trailers remained the most prevalent
among respondents’ fleets, though Refrigerated Trailers, a new addition to this year’s
survey, accounted for 17,250 trailers that would have been included in the “Other
Trailers” category in previous years (Table 5).
7 Column total will not sum to 100 percent since roughly 2 percent of VMT were reported in Canada.
8 Table MV-9: Truck and Truck-Tractor Registration. 2015 Highway Statistics Series. Office of Highway Policy
Information, Federal Highway Administration, United States Department of Transportation. February 2017. Available
online: http://www.fhwa.dot.gov/policyinformation/statistics/2015/mv9.cfm
9 “2016 Freight Quick Facts Report.” Federal Highway Administration, United States Department of Transportation.
Washington DC. 1 February, 2017. Available online:
https://ops.fhwa.dot.gov/publications/fhwahop16083/ch1.htm#t1
An Analysis of the Operational Costs of Trucking:
2017 Update 12Table 5: Survey Respondent Truck/Trailer Type, Average Truck Age, and Average
Miles Driven per Year per Truck
Equipment Number of Average Average Miles Driven
Type 10 Trucks/ Trailers Age (Years) per Year per Truck
Straight Trucks 4,359 9.4 25,511
Truck-Tractors 85,305 5.5 103,945
Total Trucks 89,664
28' Trailers 97,574 6.9
45' Trailers 1,509 7.7
48' Trailers 22,157 9.1
53' Trailers 92,052 6.4
Tank 4,582 11.0
Flatbed 9,632 6.1
Auto Trailers 2,234 6.1
Refrigerated
17,250 2.9
Trailers
Other Trailers 11 164,966 6.4
Total Trailers 411,956
Analyzing reported trade cycles can provide further insight into the equipment
characteristics of survey respondents. Respondents reported holding equipment for
more miles, but slightly fewer years compared to the previous year’s analysis. This
indicates that trucks are being used more intensively each year and are likely wearing
out in less time than before. In particular, straight trucks were reported to be held for an
average of 10.0 years, on par with last year’s figure, but were expected to clock 350,000
miles before replacement compared to the 225,000 miles reported last year (Table 6).
At the same time, truck-tractors were held 6.3 years, on average, before replacement,
down from 7.0 years, while trailers were held for 12.7 years compared to 12.4 years.
However, respondents reported an average of 754,000 miles before replacing truck-
tractors, up from 724,374 during the previous year.
Table 6: Survey Respondent Equipment Trade Cycle
Average Number of Average Miles Driven
Equipment Type
Years Until Replacement Until Replacement
Straight Trucks 10.0 350,000
Truck-Tractors 6.3 754,000
Trailers 12.7
10 ATRI stopped collecting data on “Other” trucks in 2017 due to concerns over their potential influence on operational
cost figures.
11 Other trailer types include containers, chassis, double-drop, and heated trailers.
An Analysis of the Operational Costs of Trucking:
13 2017 UpdateThese trends almost certainly reflect the soft freight market of 2016, which created a need to “squeeze” more revenue time out of each truck. The alternative impact, however, is the per-truck increase in age and miles can dramatically increase repair and maintenance costs; and in fact, this line-item cost went up seven percent from 2015 to 2016. Increased motor carrier reliance on existing truck fleets can also be seen in the slow pace of new sales observed in 2016. 12 Although the pace of new truck sales continued to slow during the first half of 2017, both the economy and truck sales have improved in the latter half of 2017. 13 That said, it is likely that motor carriers will continue to maximize revenue miles from their trucks regardless of age – simply because the trucking industry cannot find new drivers to operate the desired capacity expansion. The proportion of respondents reporting the use of at least some alternative fuel vehicles held roughly the same level in 2016 as in 2015 – with 11.2 percent of respondents reporting vehicles using a fuel other than diesel or bio-diesel blends. However, these vehicles accounted for a paltry 0.4 percent of total trucks in the sample and relied almost entirely on compressed natural gas (CNG) and liquefied natural gas (LNG). However, adoption of CNG- and LNG-fueled vehicles still has a ways to go to meet the Energy Information Administration’s (EIA’s) projection that medium- and heavy-duty vehicles will become the largest consumers of LNG by 2040, 14 in part because “the fuel cost savings of LNG offset the significant incremental capital costs of LNG vehicles.” 15 Nonetheless, the alt-fuel transition will ultimately be influenced by diesel fuel prices and the fuel efficiency of new diesel truck models. Increasing diesel prices would make the adoption of alt-fuel trucks a more financially attractive proposition. Increases in the fuel efficiency of diesel trucks, however, can counter increases in diesel prices as more fuel- efficient trucks would allow carriers to stretch their costs over more mileage. Although diesel prices are climbing in latter 2017 from 2016 levels, diesel prices have yet to reach a level for alternative fuels to become a viable option for motor carriers. At the same time, newer model trucks continue to improve their fuel efficiency to comply with tightening consumption standards nationwide. 16 Taken together, the outlook for adoption of alternative fuel vehicles in the trucking industry remains subdued. 12 Gilroy, Roger. “November Class 8 Sales Fall 27.5%.” Transport Topics. 19 December, 2016. Available online: http://www.ttnews.com/articles/november-class-8-sales-fall-275 13 Gilroy, Roger. “Class 8 Sales Top 17,000, Second-Highest Month in 2017.” Transport Topics. 15 September, 2017. Available online: http://www.ttnews.com/articles/class-8-sales-top-17000-second-highest-month-2017 14 Annual Energy Outlook 2015 with Projections to 2040. U.S. Energy Information Administration, Office of Integrated and International Energy Analysis, U.S. Department of Energy. Washington D.C. (April 2015) Available online: http://www.eia.gov/forecasts/aeo/pdf/0383(2015).pdf 15 Annual Energy Outlook 2016 with Projections to 2040. U.S. Energy Information Administration, Office of Integrated and International Energy Analysis, U.S. Department of Energy. Washington D.C. (August 2016) Available online: https://www.eia.gov/outlooks/aeo/pdf/0383(2016).pdf 16 Ibid. An Analysis of the Operational Costs of Trucking: 2017 Update 14
Despite the effect of technological improvements on fuel efficiency, one of the most
significant factors that can influence a fleet’s fuel efficiency are travel speeds and
driving behavior. With this in mind, a large majority of respondents (84.1%) reported
use of speed limiters, with 85.6 percent of these fleets utilizing limiters on their entire
fleet. As has been the case for the last several years, 65 miles per hour remained the
most common maximum speed setting, though this figure sometimes varies within fleets
based on operations and driver performance.

Though new truck models are becoming more fuel efficient, indications of an increase in
fuel economy have lagged. For example, the overall fuel economy of the respondent
sample held steady at an average of 6.3 MPG, compared to the median heavy-duty
fleet fuel economy of 6.5 MPG reported in research conducted jointly by the University
of Michigan’s Transportation Research Institute and ATRI in 2016. 17 As motor carriers
replace their existing fleets with newer models in the years ahead, the fuel economy of
fleets surveyed can be expected to increase.

To gain a deeper understanding of fuel economy in the ATRI sample, these MPG
figures were broken down by operating weight. As detailed in Table 7, fleets that
reported loaded operating weights between 40,001 and 60,000 pounds reported the
highest fuel economy (6.8 MPG), closely followed by fleets operating between 20,001
and 40,000 pounds (6.7 MPG). Unsurprisingly, LCV fleets typically operating at weights
in excess of 80,000 pounds reported the worst fuel economy, with an average of 5.4
MPG. Further, these differences in fuel economy may be due to a fleet’s ability to
maintain a more efficient speed for fuel economy purposes at certain operating weights.
Based on the increase in urban freight deliveries, as well as increasing traffic
congestion, motor carriers may lose the fuel efficiencies that would have come from
newer vehicles.

          Table 7: Survey Respondent Reported Fuel Economy Compared to Typical
                       Operating Weight and Average Operating Speed
                                                      Average Operating
                       Typical Operating Weight MPG
                                                         Speed (MPH)
                      Less than 20,000 lbs       6.3          46
                      20,001 - 40,000 lbs        6.7          53
                      40,001 - 60,000 lbs        6.8          51
                      60,001 - 80,000 lbs        6.0          55
                      Greater than 80,000 lbs    5.4          51

17Schoettle, Brandon, Sivak, Michael, and Michael Tunnel. “A Survey of Fuel Economy and Fuel Usage by Heavy-
Duty Truck Fleets.” Sustainable Worldwide Transportation and American Transportation Research Institute. Ann
Arbor, MI. October 2016
                                                          An Analysis of the Operational Costs of Trucking:
     15                                                                                       2017 Update
With the impending implementation of the Federal Motor Carrier Safety Administration (FMCSA) mandate on the use of Electronic Logging Devices (ELDs), it was not surprising to see the significant uptick in ELD adoption in 2016. The percentage of respondents in the ATRI sample responding in the affirmative to ELD use jumped over 11 percentage points to 74.8 percent between 2015 and 2016. Moreover, with legal challenges ostensibly resolved, 18 it is reasonable to expect full ELD adoption in the trucking industry as motor carriers come into compliance between December 2017 and December 2019. 19 18 Jaillet, James. “With Supreme Court blow to ELD legal challenge, mandate has no roadblocks remaining.” Commercial Carriers Journal. 14 June, 2017. Available Online: http://www.ccjdigital.com/with-supreme-court-blow- to-eld-legal-challenge-mandate-has-no-roadblocks-remaining/ 19 Implementation Timeline. Federal Motor Carrier Safety Administration. Washington DC. 31 August, 2017. Available online: https://www.fmcsa.dot.gov/hours-service/elds/implementation-timeline An Analysis of the Operational Costs of Trucking: 2017 Update 16
MOTOR CARRIER COSTS

Motor carrier operational costs can be impacted by a number of underlying influences
and externalities. As a result, some line-item costs are more easily measured than
others. These may include fuel and tire costs. Alternatively, costs such as labor can be
impacted by driver experience, performance and differing compensation models.
Finally, in several instances ATRI worked closely with carriers to refine certain costs
that straddle both fixed and marginal metrics. For example, insurance is often
considered a fixed-cost, but is typically based on truck VMT as a measure of risk or
exposure.

ATRI chose to document and analyze those cost centers most closely associated with
driver and vehicle operations, effectively representing a motor carrier’s marginal costs
(MC).

Fuel

Fuel prices have fluctuated dramatically over the years since the inception of this study.
U.S. diesel prices peaked at almost $4.80 per gallon in the summer of 2008 before a
precipitous fall to roughly $2.00 per gallon by March of the following year. 20 As the
economy recovered from the Great Recession, diesel prices started to pick up again,
growing through 2010 before stabilizing in the $3.75-$4.15 range between 2011 and
mid-2014. At that time, the emergence of U.S. shale oil induced a global supply glut
that resulted in plummeting diesel prices for the next two years until reaching a bottom
price of $1.98 in February 2016 (Figure 3). 21 At the time of this publishing diesel fuel
was $2.79 per gallon – up slightly due to the impacts of Hurricane Harvey in Texas.

20 Gasoline and Diesel Fuel Update. U.S. Energy Information Administration. Available Online:

http://www.eia.gov/petroleum/gasdiesel
21 Ibid.

                                                             An Analysis of the Operational Costs of Trucking:
  17                                                                                             2017 Update
Figure 3: Average U.S. On-Highway Diesel Prices, 2008 – 2016
$6.00
$5.00
$4.00
$3.00
$2.00
$1.00
$0.00
After hitting the trough at $1.98 per gallon in February 2016, fuel prices rose steadily throughout the year, reaching a peak
of $2.54 per gallon in the last week of December 2016 (Figure 4). 22 Nonetheless, diesel prices remained well below their
22 Ibid.
An Analysis of the Operational Costs of Trucking:
2017 Update 1810-year average of $3.31 per gallon for the duration of 2016. 23
Figure 4: Average U.S. On-Highway Diesel Prices, 2016
$2.60
$2.50
$2.40
$2.30
$2.20
$2.10
$2.00
$1.90
23 Ibid.
An Analysis of the Operational Costs of Trucking:
19 2017 UpdateFuel costs have consistently been the biggest MC line-item expense across most of the years ATRI has conducted this research, and generally account for approximately 30 to 40 percent of a motor carrier’s CPM. 24 However, due to the continual steady decline of fuel prices in 2015 and early 2016, fuel’s share of a carrier’s MC was lower than historically experienced and was in fact surpassed by driver wages for the second consecutive year. Additionally, diesel prices are projected by the EIA to increase throughout 2017, 25 driven in part by major weather-related disasters such as Hurricane Harvey. 26 Accordingly, the fuel costs reported by motor carriers can be expected to increase slightly in 2017. Equipment The age, type, and turnover of a motor carrier’s equipment can affect a number of other operating costs, including lease and purchase payments, repair and maintenance, insurance premiums, permits and special licensure, and tire costs. This year’s survey respondents accounted for roughly 89,700 trucks, 412,000 trailers, and almost 9 billion vehicle miles traveled in 2016. As previously detailed, respondents reported using both truck-tractors and straight trucks more intensively before replacement than was documented in 2015; coupled with increased costs for maintenance of newer truck models (both labor and components), it is expected that repair and maintenance costs will continue to increase. Driver Pay A number of industry shifts have continued to exert upward pressure on driver pay. In fact, in 2016 both driver wages and benefits grew for the fourth consecutive year, and are now ranked as the biggest cost center for motor carriers in ATRI’s sample for the second consecutive year. Chief among these shifts has been the much-discussed shortage of qualified drivers, a shortage that continued to plague the industry in 2016. For reference, the American Trucking Associations (ATA) estimates a shortage of nearly 50,000 drivers, with projections that the shortage could increase to 175,000 by 2025. 27 While driver supply has been tight, demand for drivers has skyrocketed as a function of strong economic growth. 28 This has served to place additional pressure on an already constrained market. Corroborating these findings are the growing number of carriers that have reported difficulty in recruiting drivers, particularly in the truckload sector. 29 Coupled with ongoing baby boomer retirements and slowly growing oilfield service employment 24 Torrey, W. Ford and Dan Murray. An Analysis of the Operational Costs of Trucking: A 2015 Update. American Transportation Research Institute. Arlington, VA. (2015) 25 Short-Term Energy Outlook. U.S Energy Information Administration. Available Online: http://www.eia.gov/forecasts/steo/ 26 “Average US gas price jumps after Harvey shuts refineries.” Associated Press. 11 September, 2017. Available online: https://www.cnbc.com/2017/09/11/average-us-gas-price-jumps-after-harvey-shuts-refineries.html 27 Costello, Bob. “ATA’s Trucking Economic Review”. Volume 17, Issue 4. 23 December, 2015. 28 Costello, Bob. “ATA’s Trucking Economic Review.” Volume 19, Issue 1. 13 January, 2017. 29 Gilroy, Roger. “The Driver Shortage Is More Acute, Some Truckers Say.” Transport Topics. 18 July, 2017. Available online: http://www.ttnews.com/articles/driver-shortage-more-acute-some-truckers-say An Analysis of the Operational Costs of Trucking: 2017 Update 20
that pull from the same pool of labor as the trucking industry, it is clear that a number of
key factors underpinning the driver shortage remained firmly in place during 2016.

Beyond a shortage of qualified drivers, another challenge facing the industry is the
changing demographics of the industry’s workforce. An ATRI study in 2014 identified
alarming demographic trends in trucking – with 55.5 percent of its workforce 45 and
older, and less than five percent of its workforce in the 20 to 24 year old age bracket. 30
Additionally, the driver population is likely being impacted by growing domestic oil
production, 31 which provide alternative higher paying, albeit cyclical, job opportunities.

The confluence of these forces in the industry will continue to drive up wages and
benefits in the trucking industry. This trend has persisted into 2017, as a number of
carriers have been forced to boost driver pay to keep their experienced workforce and
recruit additional drivers. 32 It is highly likely that driver pay will remain on its upward
trajectory barring a sudden downshift in the pace of economic activity.

FINDINGS

Average Marginal Costs

In order to remain consistent with the previous operational cost analyses, marginal
costs were once again divided into two general categories, vehicle- and driver-based,
which included the following line items:

      •   Vehicle-based
            o Fuel
            o Truck/Trailer Lease or Purchase Payments
            o Repair and Maintenance
            o Truck Insurance Premiums
            o Permits and Special Licenses
            o Tolls

      •   Driver-based
             o Wages
             o Benefits

Table 8 displays the average cost per mile for all sectors, based on the survey data.
The analysis found that the average CPM was $1.592 for 2016, up one percent from the
costs of $1.575 found in 2015. The continued decline in fuel prices was countered by
moderate increases in driver wages and benefits, as well as growing equipment lease
and purchase payments, resulting in total costs roughly holding steady over the year.
Utilizing a mean vehicle speed of 39.98 MPH, the average cost per hour for motor
30 Short, Jeffery. Analysis of Truck Driver Age Demographics Across Two Decades. American Transportation
Research Institute. Arlington, VA. (2014)
31 Gilroy, Roger. “The Driver Shortage Is More Acute, Some Truckers Say.” Transport Topics. 18 July, 2017.

Available online: http://www.ttnews.com/articles/driver-shortage-more-acute-some-truckers-say
32
   Bearth, Daniel P. “More Fleets Boost Driver Pay as Freight-Hauling Capacity Tightens.” Transport Topics. 3
October, 2017. Available online: http://www.ttnews.com/articles/more-fleets-boost-driver-pay-freight-hauling-
capacity-tightens
                                                             An Analysis of the Operational Costs of Trucking:
     21                                                                                          2017 Update
carriers amounted to $63.66 in 2016 (Table 9). These figures remained below the nine- year average of the time period that the survey has been conducted. An Analysis of the Operational Costs of Trucking: 2017 Update 22
Table 8: Average Marginal Costs per Mile, 2008-2016
         Motor Carrier Costs                2008     2009    2010     2011     2012        2013      2014        2015       2016
Vehicle-based
 Fuel Costs                                $0.633   $0.405   $0.486   $0.590   $0.641    $0.645     $0.583      $0.403     $0.336
   Truck/Trailer Lease or Purchase
                                           $0.213   $0.257   $0.184   $0.189   $0.174    $0.163     $0.215      $0.230     $0.255
   Payments
 Repair & Maintenance                      $0.103   $0.123   $0.124   $0.152   $0.138    $0.148     $0.158      $0.156     $0.166
 Truck Insurance Premiums                  $0.055   $0.054   $0.059   $0.067   $0.063    $0.064     $0.071      $0.074     $0.075
 Permits and Licenses                      $0.016   $0.029   $0.040   $0.038   $0.022    $0.026     $0.019      $0.019     $0.022
 Tires                                     $0.030   $0.029   $0.035   $0.042   $0.044    $0.041     $0.044      $0.043     $0.035
 Tolls                                     $0.024   $0.024   $0.012   $0.017   $0.019    $0.019     $0.023      $0.020     $0.024
Driver-based
 Driver Wages                              $0.435   $0.403   $0.446   $0.460   $0.417    $0.440     $0.462      $0.499     $0.523
 Driver Benefits                           $0.144   $0.128   $0.162   $0.151   $0.116    $0.129     $0.129      $0.131     $0.155
TOTAL                                      $1.653   $1.451   $1.548   $1.706   $1.633    $1.676     $1.703      $1.575     $1.592

                                     Table 9: Average Marginal Costs per Hour, 2008-2016
         Motor Carrier Costs                2008     2009    2010     2011     2012        2013      2014        2015       2016
Vehicle-based
 Fuel Costs                                $25.30   $16.17   $19.41   $23.58   $25.63    $25.78      $23.29     $16.13      $13.45
   Truck/Trailer Lease or Purchase
                                            $8.52   $10.28    $7.37    $7.55    $6.94      $6.52      $8.59       $9.20     $10.20
   Payments
 Repair & Maintenance                       $4.11    $4.90    $4.97    $6.07    $5.52      $5.92      $6.31       $6.23      $6.65
 Truck Insurance Premiums                   $2.22    $2.15    $2.35    $2.67    $2.51      $2.57      $2.89       $2.98      $3.00
 Permits and Licenses                       $0.62    $1.15    $1.60    $1.53    $0.88      $1.04      $0.76       $0.78      $0.88
 Tires                                      $1.20    $1.14    $1.42    $1.67    $1.76      $1.65      $1.76       $1.72      $1.41
 Tolls                                      $0.95    $0.98    $0.49    $0.69    $0.74      $0.77      $0.90       $0.79      $0.97
Driver-based
 Driver Wages                              $17.38   $16.12   $17.83   $18.39   $16.67    $17.60      $18.46     $19.95      $20.91
 Driver Benefits                            $5.77    $5.11    $6.47    $6.05    $4.64     $5.16       $5.15      $5.22       $6.18
TOTAL                                      $66.07   $58.00   $61.90   $68.21   $65.29    $67.00      $68.09     $62.98      $63.66

                                                                                An Analysis of the Operational Costs of Trucking:
    23                                                                                                             2017 Update
Total average marginal costs in the trucking industry grew slightly (1%) in 2016 as the
continued decline in diesel fuel prices was countered by large increases in driver wages
and benefits. Equipment lease and purchase payments, repair and maintenance,
permits and license costs, and tolls also increased from 2015 (Table 10).
Table 10: Annual Change of Average Marginal Costs
2015-2016
Motor Carrier Costs
Change
Vehicle-based
Fuel Costs -17%
Truck/Trailer Lease or Purchase Payments 11%
Repair & Maintenance 7%
Truck Insurance Premiums 1%
Permits and Licenses 13%
Tires -18%
Tolls 23%
Driver-based
Driver Wages 5%
Driver Benefits 18%
TOTAL 1%
The interesting shifts observed in some of the line-item cost ratios in 2015 continued in
2016. Fuel costs continued to drop in 2016 as a share of total average marginal cost,
falling to just 21 percent – the lowest ratio in the survey’s history. As noted, driver
wages remained the largest share of total costs for the second consecutive year,
followed by equipment lease or purchase payments at 16 percent of total costs (Table
11). In a similar rank to 2015, repair and maintenance, insurance premiums, permits
and license, tires, toll costs, and driver benefits each represented 10 percent or less of
average total marginal costs.
An Analysis of the Operational Costs of Trucking:
2017 Update 24Table 11: Share of Total Average Marginal Cost, 2008-2016
Motor Carrier Costs 2008 2009 2010 2011 2012 2013 2014 2015 2016
Vehicle-based
Fuel Costs 38% 28% 31% 35% 39% 38% 34% 26% 21%
Truck/Trailer Lease or
13% 18% 12% 11% 11% 10% 13% 15% 16%
Purchase Payments
Repair & Maintenance 6% 8% 8% 9% 8% 9% 9% 10% 10%
Truck Insurance Premiums 3% 4% 4% 4% 4% 4% 4% 5% 5%
Permits and Licenses 1% 2% 3% 2% 1% 2% 1% 1% 1%
Tires 2% 2% 2% 2% 3% 2% 3% 3% 2%
Tolls 1% 2% 1% 1% 1% 1% 1% 1% 2%
Driver-based
Driver Wages 26% 28% 29% 27% 26% 26% 27% 32% 33%
Driver Benefits 9% 9% 10% 9% 7% 8% 8% 8% 10%
TOTAL 100% 100% 100% 100% 100% 100% 100% 100% 100%
An Analysis of the Operational Costs of Trucking:
25 2017 UpdateAs previously noted, the analysis stratified motor carrier responses by operating sector
where applicable. Given the different operating conditions and business models for
each sector, total average marginal costs again varied considerably across these
sectors in 2016. Specialized carriers reported the highest CPM for the third year in a
row – driven again by relatively higher rates of driver pay than other industry sectors
(Table 12). TL carriers continued to face considerably lower costs than other industry
sectors in 2016, due in large part to the continued decline of fuel costs. LTL carriers
reported the largest increase in CPM over the year after reporting a decrease of a
similar magnitude in 2015. Strong increases in driver pay and equipment lease and
purchase payments contributed the most to this year-over-year increase for LTL.
Table 12: Average Total Marginal Costs by Sector, 2008-2016
Sector 2008 2009 2010 2011 2012 2013 2014 2015 2016
LTL $1.81 $1.43 $1.76 $1.93 $1.79 $1.84 $1.83 $1.60 $1.74
Specialized $1.87 $1.67 $1.61 $1.79 $1.73 $1.67 $1.85 $1.72 $1.83
TL $1.48 $1.36 $1.43 $1.57 $1.51 $1.60 $1.58 $1.50 $1.42
Line-Item Costs
Fuel Costs
In order to standardize the collection of fuel costs, respondents were asked to provide
fuel cost data that excluded any revenue from fuel surcharges. Since fuel surcharges
are negotiated as a fuel “subsidy” between two parties, excluding fuel surcharge reveals
the actual dollar amount spent directly on fuel.
Fuel prices have fluctuated dramatically over the years since the inception of this study.
U.S. diesel prices peaked at almost $4.80 per gallon in the summer of 2008 before a
precipitous fall to roughly $2.00 per gallon by March of the following year. 33 As the
economy recovered from the Great Recession, diesel prices started to pick up again,
growing in 2010 before stabilizing in the $3.75-$4.15 range between 2011 and mid-
2014. At that time, the emergence of U.S. shale oil induced a global supply glut that
resulted in plummeting diesel prices for the next two years until reaching a bottom of
$1.98 in February 2016. After February 2016, fuel prices rose steadily throughout the
year, reaching a peak of $2.54 per gallon in the last week of December 2016 (Figure
4). 34 Nonetheless, diesel prices remain well below their 10-year average of $3.31 per
gallon.
The data reported by respondents in ATRI’s survey sample over the years is consistent
with trends observed in the EIA data. Survey data indicated that fuel costs fell
significantly from 63.3 cents per mile in 2008 to 40.5 cents per mile in 2009, before
rising from 2010 to 2013. Calculated on an annualized basis, the average fuel CPM
33 Gasoline and Diesel Fuel Update. U.S. Energy Information Administration. Available Online:
http://www.eia.gov/petroleum/gasdiesel
34 Ibid.
An Analysis of the Operational Costs of Trucking:
2017 Update 26was 48.6 cents in 2010, 59.0 cents in 2011, 64.1 cents in 2012, 64.5 cents in 2013, 58.4
cents in 2014, and 40.3 cents in 2015.
The fuel CPM reported in 2016 of 33.6 cents is the lowest reported figure since the
inception of this study. Furthermore, fuel costs now account for just 21 percent of total
annual carrier costs – the lowest of the years studied, and the second consecutive year
that it was surpassed by driver wages in terms of cost-share. Analyzed by sector,
Specialized carriers had the highest fuel CPM of 36.5 cents, followed by LTL carriers at
34.8 cents, and TL carriers at 31.8 cents.
These for-hire fuel costs trend very closely with the National Private Truck Council’s
(NPTC’s) 2017 Benchmarking Report of private fleet data. In the 2017 report, private
fleets reported that per-mile fuel costs decreased 14 percent from 43 cents to 37 cents
over the year. 35
While fuel costs are known to vary based on equipment age, operating sector, and
vehicle weights, fleet size is another important factor that can affect fuel costs. Larger
fleets can leverage their size in terms of diesel buying power, engage in more
sophisticated price hedging strategies, and use technology to distribute their fleet’s trips
in a more fuel-efficient manner. Accordingly, fuel costs per mile are expected to
decrease with fleet size, a fact that has been corroborated by ATRI’s survey sample for
a number of years. This holds true again in 2016, as fleets operating between 5 and 25
units faced the highest fuel CPM, while these costs decreased for each subsequent
fleet size category (Figure 5).
35Benchmarking Survey Report 2017, p.42. National Private Truck Council. Arlington, VA. August 2017. Available
only to NPTC members.
An Analysis of the Operational Costs of Trucking:
27 2017 UpdateYou can also read