DELIVERY PROGRAM 2020-2022
←
→
Page content transcription
If your browser does not render page correctly, please read the page content below

DELIVERY PROGRAM
                              2020-2022
                              INCORPORATING
                              OPERATIONAL PLAN
                              2020/2021

Delivery Program 2020-2022 incorporating Operational Plan 2020/2021   Page 1 of 58
QUALITY CONTROL
  KEY DIRECTION              4.    Our Leadership

  OBJECTIVE                  4.1   Openness and transparency in decision making

  STRATEGY                   4.1.1 Support the organisation to operate its legal framework

  FUNCTION                   Leadership and Governance

  FILE REFERENCE             16/165                         EDRMS NUMBER       20/14998

  RESPONSIBLE OFFICER        General Manager

  REVIEW DATE                June 2021

  DATE                       ACTION                                                          MINUTE No.

                             Document reviewed and redeveloped for new four-year
  December 2016                                                                              N/A
                             term

  26 April 2017              Public Exhibition                                               45518

  28 June 2017               Adopted                                                         45560

  February 2019              Document reviewed and redeveloped for final two years           N/A

  14 May 2019                Public Exhibition                                               46065

  26 June 2019               Adopted                                                         46096

  February 2020              Document reviewed and redeveloped for final year                N/A

  27 May 2020                Public Exhibition                                               46258

  30 June 2020               Adopted                                                         46295

  NOTES

                             Broken Hill 2033 Community Strategic Plan
                             Long Term Financial Plan
  ASSOCIATED
                             Workforce Management Plan 2017
  DOCUMENTS
                             Asset Management Plan (under development)
                             Current year Schedule of Fees and Charges

Delivery Program 2020-2022 incorporating Operational Plan 2020/2021                       Page 2 of 58
Acknowledgement of Country
“We acknowledge the traditional owners of the land on which we live and work; and pay our
respects to their elders - past, present and emerging.”

  Delivery Program 2020-2022 incorporating Operational Plan 2020/2021   Page 3 of 58
“When you think of regional Australia, when you think of mining, when you think of
                  the ethos of Australia, you think of Broken Hill”
                                                                                     Minister of Environment Greg Hunt

Delivery Program 2020-2022 incorporating Operational Plan 2020/2021   Page 4 of 58
ABOUT BROKEN HILL
The City of Broken Hill is the largest regional      The City is renowned for its perfect light –
centre in the western half of New South              by day the sun and by night the stars, the
Wales. It lies in the centre of the sparsely         desert moon and the city lights – which
settled New South Wales Outback, close               attracts artists, photographers and
to the South Australian border and                   filmmakers.
midway between the Queensland and
Victorian borders. The nearest population            In January 2015, Broken Hill was
base is Mildura in Victoria, approximately           recognised as Australia’s First National
300 kilometres to the south on the Murray            Heritage Listed City. International findings
River. The nearest capital city is Adelaide,         show that heritage listing ‘sells’ and can
approximately 500 kilometres to the                  stimulate growth through the visitor
southwest.                                           economy and the attraction of investment
                                                     and entrepreneurial opportunity. As part of
Connected by air, rail and road and with             a very elite club, there is potential to
all the facilities that one would expect of a        heighten the brand of Broken Hill to world
regional city, the Far West NSW region               status.
relies heavily on Broken Hill for essential
services and connectivity.

Although located within NSW, Broken Hill
has strong cultural and historic
connections with South Australia and
operates on Central Australian Time, half
hour behind Eastern Standard Time.

Broken Hill’s isolation is as much a strength
as it is a challenge. This is Australia’s
longest lived mining city, where some of
the world’s major mining companies were
founded on the richest mineral deposits
and where safe working practices and
workers legislation were first developed for
miners in Australia. The City’s skyline is
dominated by prominent mining structures
along the Line of Lode, including a
memorial to miners.

Broken Hill sits beneath a vast sky (now
being mined for renewable energy), atop
a landscape famed for its natural, cultural
and industrial heritage. Each day lives are
lived out in dwellings built atop a
mineralogical rainforest containing 300
confirmed mineral species and
representing 2300 million years of
geological history. Many of the City’s
streets take their names from the wealth of
metals, minerals and compounds found in
the City’s Ore Deposit (its Line of Lode).

Delivery Program 2020-2022 incorporating Operational Plan 2020/2021                    Page 5 of 58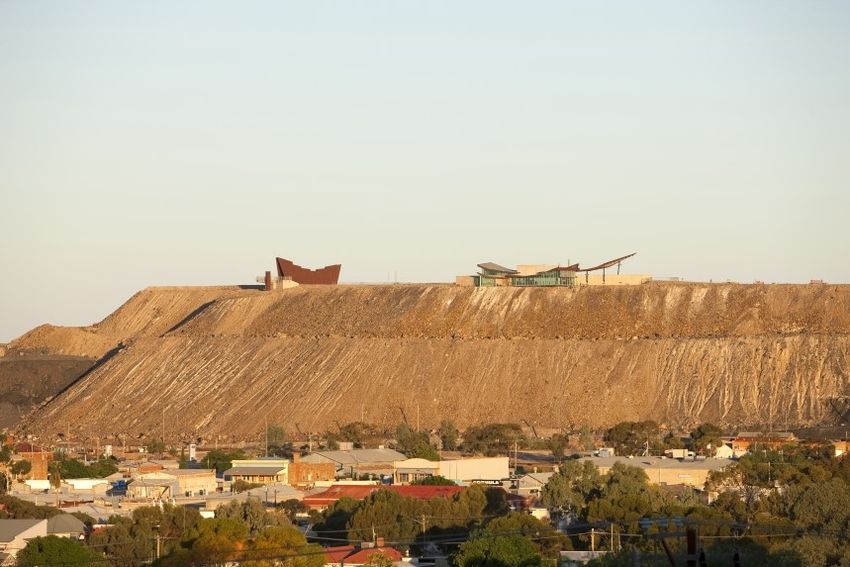
TABLE OF CONTENTS
    ABOUT BROKEN HILL ....................................................................................................................... 5

    EXECUTIVE SUMMARY ..................................................................................................................... 7

    YOUR COUNCILLORS...................................................................................................................... 8

    COMMUNICATING OUR STRATEGY MAP ..................................................................................... 9

    IMPACTS OF COVID-19 ................................................................................................................ 11

    LONG TERM FINANCIAL ESTIMATES/PERFORMANCE ................................................................ 12

    ANNUAL ESTIMATES ....................................................................................................................... 16

    THE FRAMEWORK .......................................................................................................................... 19

    KEY DIRECTION 1 - OUR COMMUNITY......................................................................................... 22

    KEY DIRECTION 2 - OUR ECONOMY............................................................................................ 30

    KEY DIRECTION 3 - OUR ENVIRONMENT ..................................................................................... 37

    KEY DIRECTION 4 - OUR LEADERSHIP .......................................................................................... 43

    REVENUE POLICY .......................................................................................................................... 48

    DEBT MANAGEMENT ..................................................................................................................... 56

    SCHEDULE OF FEES AND CHARGES 2020/2021 .......................................................................... 57

Delivery Program 2020-2022 incorporating Operational Plan 2020/2021                                                                  Page 6 of 58
INTRODUCTION

EXECUTIVE SUMMARY
This document is Broken Hill City Council’s Combined
Delivery Program 2020-2022 and Operation Plan 2020/2021.
MESSAGE FROM YOUR MAYOR
Before describing this Delivery Program, I
feel it is important to first explain the role of
the Community Strategic Plan (CSP) in
Council's service delivery.

The CSP is a plan developed by Council in
partnership with the community that sets
out residents' priorities and aspirations for
the future of Broken Hill.

The current CSP was produced by Council
in consultation with the community in 2010
and was reviewed in 2013, 2014 and 2017
to ensure it remains current and relevant.

Community engagement has been at the
heart of each review and thousands of
                                                     Council remains committed to improving
locals have provided input to ensure the
                                                     its performance and is currently
wishes and expectations of the community
                                                     undertaking a four-year Service Review
are reflected in the plan.
                                                     process to examine all aspects of its
                                                     operations and make improvements
The next step is working to realise the
                                                     where possible.
community's aspirations and this
combined 2020-2022 Delivery Program
                                                     We hope this combined Delivery Program
and 2020/2021 Operational Plan, outlines
                                                     and Operational Plan provides a useful
the activities that Council will undertake
                                                     guide to Council's future activities and
over the next two years to help the
                                                     encourages all residents to provide input
community reach the goals identified in
                                                     to the Service Review process as it is rolled
the CSP.
                                                     out.
It enables residents to see exactly how
Council spends its funds and the kinds of            Mayor Darriea Turley AM
services and activities that they can
expect to be provided in their community
in the coming years.

It provides a clear framework around
Council's performance and enables us to
be open and accountable to the public.

Delivery Program 2020-2022 incorporating Operational Plan 2020/2021                  Page 7 of 58
OUR COUNCIL ORGANISATION

YOUR COUNCILLORS
The Mayor and Councillors of Broken Hill have many responsibilities to the Council and the
community. All Councillors, in accordance with the Local Government Act 1993, must
“represent the collective interests of residents, ratepayers and the local community”;
“facilitate communication between the local community and the governing body”; and “is
accountable to the local community for the performance of the council”.

                   Mayor                                                  Deputy Mayor
             Darriea Turley AM                                           Christine Adams

  Councillor                 Councillor                   Councillor                  Councillor
  Bob Algate                Marion Browne                Maureen Clark              David Gallagher

   Councillor                  Councillor                   Councillor                 Councillor
 Tom Kennedy                  Branko Licul                  Jim Nolan                  Ron Page

Delivery Program 2020-2022 incorporating Operational Plan 2020/2021                  Page 8 of 58
COMMUNICATING OUR STRATEGY MAP
The Map summarises outcomes the organisation seeks to achieve under the Delivery Program
2020-2022. The Map is easy to read and assists our workforce to understand their role in
service delivery to the community and improvement of performance.

Delivery Program 2020-2022 incorporating Operational Plan 2020/2021         Page 9 of 58
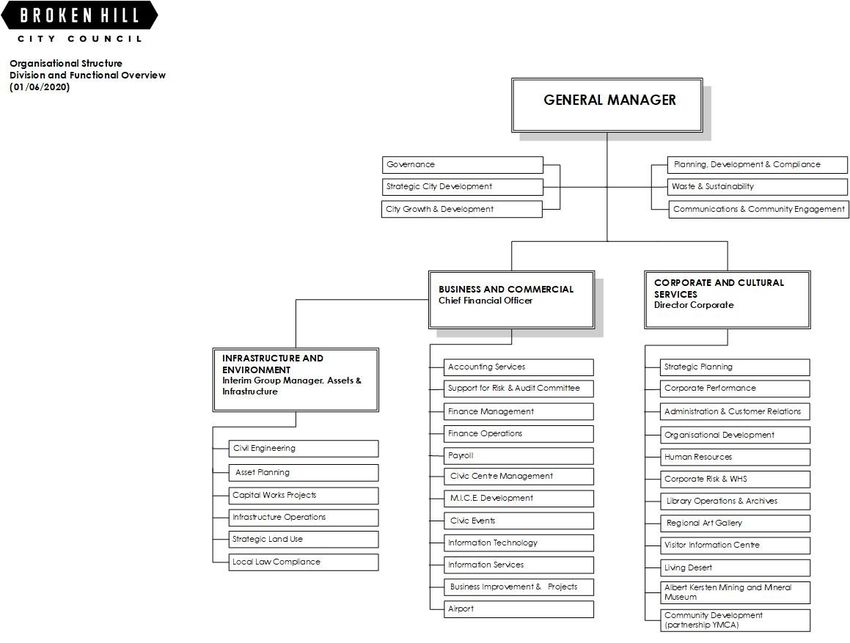
BROKEN HILL CITY COUNCIL ORGANISATIONAL STRUCTURE

Delivery Program 2020-2022 incorporating Operational Plan 2020/2021   Page 10 of 58
IMPACTS OF COVID-19
The COVID-19 (novel coronavirus)                     The breadth and depth of the impact is
pandemic is an unprecedented public                  difficult to assess in this current
health crisis, which has fast tracked an             environment. However, initial projected
associated economic crisis as a result.              forecasts estimate potential net revenue
Unemployment is forecast to rise                     reductions of between $1.7 million and $2
significantly, with job losses impacting             million for the fourth quarter of 2019/2020
many sectors across our community such               and up to a further $2.3 million for the
as accommodation and food services,                  2020/2021 financial year. This equates to a
retail trade, arts and recreation services,          projected 7.5% reduction in revenue for
education services, construction and                 the Council for the upcoming 2020/2021
professional services. With a long-term              financial year.
projected decline in population, further
job losses may hasten any decline without            In addition to this revenue loss, there will
focussed stimulus.                                   also be additional cashflow pressures on
                                                     the Council, following decisions to defer
To date the broader financial implications           payment plans for its residents and
of the pandemic have been severe. The                businesses that require rate relief for the
City of Broken Hill is not immune to these           immediate future. To reflect this inherent
impacts and anticipates a significant                operational uncertainty, additional
projected financial impact from this crisis.         scenarios have been financially modelled
Major projected impacts include                      and reflected in the Long Term Financial
additional operational costs as the                  Plan.
Council increases cleaning and
maintenance regimes and major                        The proposed scenario (Future Proof
(projected) losses in revenue as the local           scenario) of the Long Term Financial Plan
community and wider economy are                      reflects Federal and State Government
impacted. A reduction in airport                     advice regarding the expected duration
passenger numbers along with the                     of COVOD-19 response measures; namely
temporary closures of the City’s                     the six-month period to
community facilities, such as the Broken Hill        September/October 2020, with restrictions
Regional Art Gallery, Aquatic Centre and             beginning to ease throughout this time.
other community centres, may well result
in a reduction in visitor numbers over the           Despite the impacts of the COVID-19
longer term if tourism or the general                pandemic, the Council’s strong financial
economy does not bounce back as                      management in recent years, has made
expected.                                            the organisation reasonably resilient to
                                                     disruption, whilst focussing on the renewal
A range of initiatives designed to alleviate         of infrastructure at a rate acceptable to
financial pressure on small businesses               improve the liveability and attractiveness
across the City, were presented to Council           of the City.
in March 2020. They included a revised
procurement policy to favour local
businesses, a freeze on overdue interest
and a freeze on debt recovery until 30
June 2020.

Delivery Program 2020-2022 incorporating Operational Plan 2020/2021                 Page 11 of 58
FINANCIAL – BALANCED SCENARIOS
LONG TERM FINANCIAL ESTIMATES/PERFORMANCE
The financial estimates provided have been derived from the Long-Term Financial Plan.
Delivery Program - Future Proof Scenario
INCOME STATEMENT
2019 2020 2021 2022
$ '000
Proposed
Actual Q3 Review Forecast
Budget
Income from Continuing Operations
Revenue: 1.02 1.02 1.02
Rates & annual charges 18,041 18,354 18,639 19,124
User charges & fees 11,125 2,892 3,011 4,104
Interest & investment revenue 1,548 192 286 582
Other revenues 685 439 305 435
Grants & contributions for operating purposes 6,272 6,613 6,740 6,875
Grants & contributions for capital purposes 2,813 3,550 30,011 13,000
Other Income:
Net gains from disposal of assets - - - -
Net share of interests in joint ventures 1,461 - - -
TOTAL INCOME FROM CONTINUING OPERATIONS 41,945 32,040 58,991 44,119
Expenses from Continuing Operations 1.000 1.000 1.000
Employee benefits & costs 14,235 13,841 12,707 13,057
Borrowing costs 788 582 727 685
Materials & contracts 11,575 9,778 5,370 5,971
Depreciation & amortisation 6,941 7,148 7,064 7,225
Impairment - - -
Other expenses 4,708 4,053 4,762 4,408
Net losses from disposal of assets 581 - - -
TOTAL EXPENSES FROM CONTINUING OPERATIONS 38,828 35,403 30,631 31,345
OPERATING RESULT FOR THE YEAR 3,117 (3,362) 28,361 12,774
NET OPERATING RESULT FOR THE YEAR BEFORE GRANTS &
CONTRIBUTIONS FOR CAPITAL PURPOSES 304 (6,912) (1,650) (226)
NET OPERATING RESULT FOR THE YEAR EXCLUDING EXTRAORDINARY ITEMS
BEFORE GRANTS & CONTRIBUTIONS FOR CAPITAL PURPOSES 304 (6,912) (1,650) (226)
Delivery Program 2020-2022 incorporating Operational Plan 2020/2021 Page 12 of 58FINANCIAL ESTIMATES
Delivery Program - Future Proof Scenario
STATEMENT OF FINANCIAL POSITION
$ '000 2019 2020 2021 2022
Proposed
Actual Q3 Review Forecast
Budget
Assets
Current Assets:
Cash & cash equivalents 15,473 5,322 4,046 4,662
Investments 9,000 9,000 14,000 14,000
Receivables 5,311 5,840 6,549 7,258
Inventories 122 125 128 131
Other 551 565 579 593
Non-current assets classified as 'held for sale' - - - -
TOTAL CURRENT ASSETS 30,457 21,360 25,302 26,645
Non-Current Assets:
Investments - - - -
Receivables 47 47 47 25
Inventories - - - -
Infrastructure, property, plant & equipment 218,410 224,666 257,898 268,621
Investments accounted for using the equity method 1,461 1,461 1,461 1,461
Investment property - - - -
Intangible assets - - - -
TOTAL NON-CURRENT ASSETS 219,918 226,174 259,406 270,107
TOTAL ASSETS 250,375 247,534 284,708 296,752
Liabilities
Current Liabilities:
Payables 3,664 5,393 5,931 5,678
Income Received in Advance 129 129 129 129
Borrowings 570 552 1,428 1,469
Provisions 4,060 4,247 3,813 3,801
TOTAL CURRENT LIABILITIES 8,423 10,320 11,300 11,078
Non-Current Liabilities:
Payables - - - -
Borrowings 12,522 11,970 19,623 18,154
Provisions 8,729 10,898 11,984 14,362
TOTAL NON-CURRENT LIABILITIES 21,251 22,868 31,607 32,516
TOTAL LIABILITIES 29,674 33,188 42,907 43,593
NET ASSETS 220,701 214,347 241,802 253,159
Equity
Retained earnings 111,884 105,530 132,985 144,342
Revaluation reserves 108,817 108,817 108,817 108,817
Council equity interest 220,701 214,347 241,802 253,159
Non-controlling interest - - - -
TOTAL EQUITY 220,701 214,347 241,802 253,159
Delivery Program 2020-2022 incorporating Operational Plan 2020/2021 Page 13 of 58FINANCIAL ESTIMATES
Delivery Program - Future Proof Scenario
STATEMENT OF CASH FLOWS
$ '000 2019 2020 2021 2022
Proposed
Actual Q3 Review Forecast
Budget
Cash Flows from Operating Activities
Receipts:
Rates & annual charges 17,858 17,803 18,080 18,550
User charges & fees 14,122 2,805 2,920 3,981
Investment & interest revenue received 1,478 897 326 582
Grants & contributions 7,695 10,163 36,751 19,875
Bonds, deposits & retention amounts received - - - -
Other 1,309 426 295 422
Payments:
Employee benefits & costs (14,490) (13,426) (12,326) (12,665)
Materials & contracts (13,962) (9,485) (5,209) (5,792)
Borrowing costs (602) (582) (727) (685)
Bonds, deposits & retention amounts refunded (28) - - -
Other (4,883) (3,931) (4,619) (4,276)
NET CASH PROVIDED (OR USED IN) OPERATING ACTIVITIES 8,497 4,670 35,491 19,992
Cash Flows from Investing Activities
Receipts:
Sale of investment securities - - -
Sale of infrastructure, property, plant & equipment 147 -
Deferred debtors receipts 36 - - -
Other investing activity receipts - - - -
Payments:
Purchase of investment securities (8,000) - (5,000) -
Purchase of infrastructure, property, plant & equipment (12,105) (13,404) (40,296) (17,947)
Deferred debtors & advances made - - - -
NET CASH PROVIDED (OR USED IN) INVESTING ACTIVITIES (19,922) (14,251) (45,296) (17,947)
Cash Flows from Financing Activities
Receipts:
Proceeds from borrowings & advances - - 10,000 -
Payments:
Repayment of borrowings & advances (611) (570) (1,471) (1,428)
NET CASH PROVIDED (OR USED IN) FINANCING ACTIVITIES (611) (570) 8,529 (1,428)
NET INCREASE/(DECREASE) IN CASH & CASH EQUIVALENTS (12,036) (10,151) (1,276) 617
plus: CASH & CASH EQUIVALENTS - beginning of year 27,509 15,473 5,322 4,046
CASH & CASH EQUIVALENTS - end of year 15,473 5,322 4,046 4,662
Additional Information
plus: Investments on hand - end of year 9,000 9,000 14,000 14,000
TOTAL CASH, CASH EQUIVALENTS & INVESTMENTS - end of year 24,473 14,322 18,046 18,662
Delivery Program 2020-2022 incorporating Operational Plan 2020/2021 Page 14 of 58FINANCIAL ESTIMATES
Delivery Program - Future Proof Scenario
FINANCIAL RATIOS
2019 2020 2021 2022
Actual Q3 Review
Proposed
Forecast
Operating Ratio
Budget
Operating Ratio 2018 2019 2020 2021 2019 2020 2021 2022
This ratio measures Council's ability to contain operating expenditure within 0%
operating revenue. -6.32% -24.26% -5.70% -0.73%
-2%
Benchmark - Greater than 0%
-4%
(operating revenue excl. capital grants and contributions - operating
expenses) / operating revenue excluding capital grants and contributions -6%
-8%
Cash Expense Cover Ratio Cash Expense Cover
This ratio indicates the number of months Council can continue paying for its
14
Ratio
immediate expenses without additional cash inflow. 12.26 6.21 6.85 7.00 12
Benchmark - Greater than 3.0 months 10
8
(current year's cash and cash equivalents / (total expenses - depreciation - 6
interest costs) * 12 4
2
0
2019 2020 2021 2022
Current Ratio
Current Ratio
This ratio represents Council's ability to meet debt payments as they fall due. 4
It should be noted that Council's externally restricted assets will not be
3
available as operating funds and as such can significantly impact Council's
ability to meet its liabilities. 3.79 2.07 2.24 2.41 2
Benchmark - Greater than 1.5 1
current assets / current liabilities 0
2019 2020 2021 2022
Unrestricted Current Ratio Unrestricted Current
To assess the adequacy of working capital and its ability to satisfy obligations 5
Ratio
in the short term for the unrestricted activities of Council. 3.02 1.59 2.17 2.27 4
Benchmark - Greater than 1.5 3
current assets less all external activities/ current liabilities, less specific purpose 2
liabilities 1
0
2019 2020 2021 2022
Own Source Operating Revenue
Own Source
This ratio measures the level of Council's fiscal flexibility. It is the degree of Operating Revenue
reliance on external funding sources such as operating grants and 80%
contributions. Council's financial flexibility improves the higher the level of its 60%
own source revenue. 69.19% 68.28% 37.70% 54.95% 40%
Benchmark - Greater than 60% 20%
rates, utilities and charges / total operating revenue (inclusive of capital
0%
grants and contributions) 2019 2020 2021 2022
Debt Service Cover
Debt Service Cover Ratio Ratio
This ratio measures the availability of cash to service debt including interest, 6
principal, and lease payments. 5.11 0.71 2.79 3.64 5
4
Benchmark - Greater than 2.0
3
operating result before interest and depreciation (EBITDA) / principal
2
repayments +borrowing interest costs
1
0
2019 2020 2021 2022
Interest Cover Ratio
This ratio indicates the extent to which Council can service its interest bearing
15
Interest Cover Ratio
debt and take on additional borrowings. It measures the burden of the
12
current interest expense upon Council's operating cash. 10.80 1.41 8.44 11.22 9
Benchmark - Greater than 4.0 6
operating result before interest and depreciation (EBITDA) / interest expense 3
0
2019 2020 2021 2022
Capital Expenditure Ratio Capital Expenditure
This ratio indicates the extent to which Council is forecasting to expand its Ratio
asset base with capital expenditure spent on both new assets and 1.60
replacement and renewal of existing assets. 1.74 1.88 5.70 2.48
1.20
Benchmark - Greater than 1.1
0.80
annual capital expenditure / annual depreciation
0.40
0.00
2019 2020 2021 2022
Delivery Program 2020-2022 incorporating Operational Plan 2020/2021 Page 15 of 58FINANCIAL ESTIMATES ANNUAL ESTIMATES The financial estimates provided in the Operational Plan in the following sections reflect the range of services provided by Council at the time of drafting this Plan. As indicated in Council’s Long Term Financial Plan, Council must continue to develop strategies and make decisions to ensure the reduction of financial deficits and the future sustainability of Council. Such decisions may not provide overnight relief from the weakened (COVID-19 induced) financial position and as such, it is important to take a longer-term strategic view of the benefits of such decisions. The annual budget considers, as best it can during these uncertain times, the effects of COVID-19; this is estimated to be a reduction in revenue for the city in the vicinity of $2.3M for the 2020/2021 financial year. This equates to a reduction in revenue of 7.5%. To allow for Council’s Long Term Financial Plan objectives to be met, a corresponding reduction in expenditure of $2.3M, in addition to the already forecast reduction in the operating deficit of $695,000, needs to be met. For Council to consider reducing the operating deficit by $3M in one financial year, it would not be practical or feasible without drastically cutting community services. Council has instead reviewed its Long Term Financial Plan and proposed a revised model to allow for an increase in the operating deficit for the 2020/2021 financial year, maintain its capital works program and agreed asset renewal ratio of 110% and reduce the impact to service delivery, whilst still seeking a return to surplus in 2023. Whilst Council may still return to surplus in 2023, it requires adjustments to previous assumptions and how Council operates. These changes are described in the following paragraphs. Change in Front Line Service Operating Hours COVID-19 has impacted the way councils conduct business and how residents and customers interact with Council. To ensure compliance with Work Health & Safety, the protection of the Community in general and the State Government’s Public Health Order, a majority of Council’s customer facing services have either closed or had their hours reduced. During this time Council has increased its online and telephone presences and will continue to ensure that the same or better levels of customer service are experienced by all customers and residents. As restrictions are eased Council will begin to review and reopen these services however, they may be different to those offered pre-COVID-19. Council will always ensure the fundamental principles of Work Health and Safety and public safety is paramount to any decisions made before easing restrictions, when operating public buildings. In addition to the above, due to compliance with social distancing and population density limits, increased resource requirements, combined with a reduced revenue base from operating these facilities; operating hours may have to be reduced or altered, moving forward. It is anticipated that these hours will be reviewed quarterly in accordance with budgetary reviews and Federal and State Government advice around easing of restrictions. Access to Office of Local Government Low Cost Borrowings Stimulus Package The Office of Local Government announced a $395M Stimulus Package on the 26 April 2020. This included a job retention allowance for effected employees, funding for the increase in the Emergency Services Levy and access to secure low-interest infrastructure loans through TCorp, which in the past have not been available to Broken Hill. Local Government plays a fundamental role in stimulating the local economy through community infrastructure projects and this has been acknowledged by the other levels of government in making these funds available to each council, to not only support councils to meet their asset renewal requirements during the pandemic, but to also aid the recovery of local economies and ensure prospects for job retention and job growth, as the local economy begins to emerge from COVID-19. Delivery Program 2020-2022 incorporating Operational Plan 2020/2021 Page 16 of 58
Within the proposed budget (Future Proof Scenario), it is proposed Council take advantage
of this offer and draw down $10M over a period of ten years, at a fixed interest rate of 1.85%
per annum. The purpose of this loan will be to fast track infrastructure renewal in the short
term (next three years) and leverage grant opportunities that may effectively turn $10M of
projects into $20-$30M of projects, through Council being able to utilise the loan borrowings
to act as its % contribution to any grant application; the details of which are contained within
the proposed capital budget.
The interest repayable on this loan over the ten-year term is $976,000 and falls within
Council’s Loan Borrowing Policy, Long Term Financial Plan, key financial ratios (as detailed in
this document) and will ensure intergenerational equity moving forward.

Fast Tracking Community Infrastructure Projects
As described above, it is proposed that Council build capacity through low cost borrowings
to fast track Community Infrastructure, in an effort to support and revitalise the local
economy. This is a different proposition to that espoused as part of the previous loan, which
sought to supplement infrastructure renewal works around the City over a 10-year period.
As per New South Wales 2019 Population Projections, Broken Hill faces a population decline
over the next 20 years by 25% and whilst new industry, particularly mining in pre-feasibility
studies, may assist in reversing that number; Council should seek to be proactive in the
immediate future, to ensure that job retention and growth of the local economy is its key
focus, so that the impacts of COVID-19 don’t exasperate an already unfavourable situation.
COVID-19 is changing the worlds operating environment significantly and unfortunately there
is no crystal ball as to what things may look like in one month, two months or three months.
Budgeted adjustments will need to be made through the 2020/2021 financial year as things
become clearer. These reviews will be undertaken to measure Council’s financial
performance against the financial projections contained within this plan, as well as
unexpected adjustments due to COVID-19. Any decisions impacting on Council’s financial
position for the year will be incorporated into these reviews.
The Consolidated Estimated Income Statement, Balance Sheet and Cash Flow Statement for
the 2020/2021 financial year are contained within the Revenue Policy on page 48.

 Where is Council’s budget spent?
 Find out more about the budget, expenditure, services and projects on Council’s website
 www.brokenhill.nsw.gov.au

 AIRPORT             ART GALLERY        AQUATIC             CIVIC CENTRE       GEOCENTRE
                                        CENTRE
           $0.27M             $0.55M              $0.93M              $0.26M           $0.18M

                     PARKS AND          ROADS,                                 VISITOR
 LIBRARY                                FOOTPATHS AND       SPORTING FIELDS    INFORMATION
                     OPEN SPACES
                                        TRANSPORT                              CENTRE
           $0.54M             $1.36M           $3.77M                 $0.02M           $0.44M

Delivery Program 2020-2022 incorporating Operational Plan 2020/2021               Page 17 of 58
CAPITAL PROJECTS
OPERATIONAL PLAN - Future Proof Scenario
INCOME STATEMENT
$ '000 2021 2021 2021 2021 2021
Our Our Our Our
TOTAL
Leadership Community Economy Environment
Proposed
Proposed Proposed Proposed Proposed
Budget
Budget Budget Budget Budget
Income from Continuing Operations
Revenue:
Rates & annual charges 18,639 15,715 (7) - 2,931
User charges & fees 3,011 477 567 637 1,329
Interest & investment revenue 286 269 - - 17
Other revenues 233 164 40 23 6
Grants & contributions for operating purposes 6,811 4,858 1,437 479 37
Grants & contributions for capital purposes 30,011 500 26,211 3,300 -
Other Income: - - -
Net gains from disposal of assets - - - - -
Net share of interests in joint ventures - - - - -
TOTAL INCOME FROM CONTINUING OPERATIONS 58,991 21,983 28,249 4,440 4,319
- - - -
Expenses from Continuing Operations - - - -
Employee benefits & costs 12,707 7,320 2,874 939 1,574
Borrowing costs 727 179 549 - -
Materials & contracts 5,370 2,334 1,598 865 573
Depreciation & amortisation 7,064 3,618 3,006 285 155
Impairment - - - - -
Other expenses 4,762 3,857 598 217 90
Net losses from disposal of assets - - - - -
TOTAL EXPENSES FROM CONTINUING OPERATIONS 30,631 17,308 8,624 2,307 2,392
-
OPERATING RESULT FOR THE YEAR 28,360 4,675 19,625 2,132 1,928
-
NET OPERATING RESULT FOR THE YEAR BEFORE
GRANTS & CONTRIBUTIONS FOR CAPITAL PURPOSES (1,650) 4,175 (6,587) (1,168) 1,928
Delivery Program 2020-2022 incorporating Operational Plan 2020/2021 Page 18 of 58INTEGRATED PLANNING & REPORTING
THE FRAMEWORK
The Integrated Planning and Reporting
Framework requires councils to develop a
Community Strategic Plan, which outlines
the Vision, Goals and Strategies for the
community. The plan is not limited to the
responsibilities of any one government or
organisation.
Under the Framework, Council will use the
Community Strategic Plan to determine
which goals and strategies can be
implemented at a local government level.
These goals and strategies are included in
the reviewed 2020-2022 Delivery Program.
Due to COVID-19 (novel coronavirus) and
the postponement of the 2020 Local
Government elections, the existing
Delivery Program will apply for a further 12
months, maintaining the Key Directions
and any activities not completed. A new
3-year program will be developed for
2022-2025, coinciding with the election of
new Council.
To ensure that Council has the required
resources to achieve the goals and
strategies set out in the Delivery Program, Disability Inclusion Action Planning
a Resourcing Strategy is prepared to supports the fundamental right of
address long term financial management, choice for people with disability in our
workforce planning and asset Community.
management. Choice, inclusion and accessibility is
The Operational Plan is a plan which achieved by providing the same
focuses on the short term. It provides a opportunities and ability to choose how
one-year detailed plan of which activities persons with disability live their lives and
and projects from the Delivery Program will enjoy the benefits of living and working in
be implemented. our community.
Each year, our success in achieving the The Disability Inclusion Act 2014 (NSW), was
goals and strategies set out in these plans introduced in December 2014 and
will be reported through Council’s Annual provides the legislative framework to
Report. guide state and local government
disability inclusion and access planning.
Although considered long term, our
Community Strategic Plan will remain The Disability Inclusion Act 2014 (NSW)
current through a four-yearly review in line requires all local government
with Local Government Elections. organisations to produce a Disability
Inclusion Action Plan (DIAP) setting out
The first Community Strategic Plan for measures enabling people with a
Broken Hill was endorsed in 2010 and we disability to access general support and
are proud of the achievements made services and fully participate in the
since this time. The Plan was subsequently community.
reviewed after a significant community
engagement exercise in 2013 and further
reviews in 2014 and 2017.
Delivery Program 2020-2022 incorporating Operational Plan 2020/2021 Page 19 of 58I
OUR KEY DIRECTIONS HOW TO READ THIS PLAN
The Delivery Program and Operational The tables in the document under each of
Plan is arranged by Key Directions taken the four key directions contain reference
from the Broken Hill 2033 Community numbers. The reference numbers are
Strategic Plan. primarily for internal Council purposes,
however, will be used when providing
• Key Direction 1: Our Community
progress reports to the community every
• Key Direction 2: Our Economy six months.
• Key Direction 3: Our Environment The table and diagram below explain how
to read and understand the tables and
• Key Direction 4: Our Leadership
demonstrates how Delivery Program
The four key directions are colour coded strategies and one-year Operational Plan
and articulate the Community Strategic actions align to the Broken Hill 2033
Plan community vision as expressed in Community Strategic Plan objectives.
community engagement forums, in
developing the Community Strategic Plan.
The Delivery Program and Operational COMMUNITY DIRECTION
Plan detail key objectives, strategies and
actions which Council can contribute to 1 Key Direction
achieving the high-level goals outlined in
the Community Strategic Plan. 1.1 CSP Community Objective
1.1.1 Delivery Program Strategy
1.1.1.1 1-year Operational Plan
Action
EXAMPLE
As a community we have This is what we need to do to
said this is what we want achieve the desired outcomes of This is the responsible
the Community Strategic Plan officer for the action
1-year action undertaken by
Council to achieve the
Delivery Program strategies
Delivery Program 2020-2022 incorporating Operational Plan 2020/2021 Page 20 of 58KEY DIRECTION 1 – OUR community 1.1 People in our community are in safe hands
1.2 Our community works together
1.3 Our history, culture and diversity is embraced and celebrated
1.4 Our built environment supports our quality of life
1.5 Our health and wellbeing ensures that we live life to the full
We are a connected community and enjoy our safety
and wellbeing. We keep our heritage
alive and relevant; it is the foundation for the way we
unite to get things done and maintain
our inclusive lifestyle.
“When you think of regional Australia, when you think of mining, when you think of
the ethos of Australia, you think of Broken Hill”
Minister of Environment Greg HuntKEY DIRECTION 1 - OUR COMMUNITY In Broken Hill our people are our greatest asset. We are a resilient community and believe in hard work, getting things done and uniting to make a difference. ‘Sense of Community’ was identified by our residents as being amongst the most important areas of priority for Broken Hill. A sense of community represents a sense of belonging and identification. It requires personal investment and shared influence, participation and commitment. The people of Broken Hill are champions of what’s true, right, sincere, solid, tangible, unaffected, genuine, meaningful and authentic. We are like the Hero – where there’s a will there’s a way. We value being inspiring, open, original, human and fearless. We know our isolation is as much a strength as it is a weakness, but it delivers a dose of reality - if we need to get something done, we just do it. This creates a real sense of who we are, in an age where individuality and technology are vastly affecting the fabric of other communities and how they interact to solve their problems. Broken Hill has an inclusiveness not easily found elsewhere. Our rich mining heritage has brought people from all over the world, yet together they have combined to influence a nation. Their stories are heroic, inventive and bold. There is still a shared commitment among us to make Broken Hill a place that will continue to survive and thrive in the desert. We warmly welcome people from ‘away’ and they take treasured memories with them. The focus of the Key Direction – Our Community is our people and how we can work together to ensure we position ourselves to retain our sense of identity, our health, wellbeing, social inclusion and connectedness. The tables to follow provide objectives to help us meet the overall goal for ‘Our Community’ as outlined in the Community Strategic Plan which contributes to the community’s combined vision for the future. Under each objective we show strategies that Council will undertake to allow us to meet our goals along with measurements to help us ensure we are on the right path. Delivery Program 2020-2022 incorporating Operational Plan 2020/2021 Page 22 of 58
KEY DIRECTION 1 – OUR COMMUNITY
 OBJECTIVE     1.1    People in our Community are in safe hands
 STRATEGY      1.1.1 Implement infrastructure and services for the effective management and control of companion animals
 ACTIONS                                                                                RESPONSIBLE OFFICER      START DATE     END DATE
 1.1.1.1 Provide a comprehensive companion animal management service to the              Manager Planning,       01-Jul-2020   30-Jun-2021
 Broken Hill community in accordance with objectives in the Companion Animal             Development and
 Management Plan                                                                           Compliance
 STRATEGY      1.1.2 Prioritise actions within the Smart City Framework that support safer communities within our Parks and Open Spaces
 ACTIONS                                                                                RESPONSIBLE OFFICER      START DATE     END DATE
 1.1.2.1 Continue the implementation of Smart City Projects in accordance with the     Chief Financial Officer   01-Jul-2020   30-Jun-2021
 Smart City Framework
 STRATEGY      1.1.3 Provide suitable land within the Cemetery reserve and develop for future expansion
 ACTIONS                                                                                RESPONSIBLE OFFICER      START DATE     END DATE
 1.1.3.1 Develop Rosemary and Lavender Garden in Cemetery                             Strategic Assets Manager 01-Jul-2020     30-Jun-2021
 1.1.3.2 Complete investigation to extend Cemetery grounds                            Strategic Assets Manager 01-Jul-2020     30-Jun-2021
 OBJECTIVE     1.2    Our Community works together
 STRATEGY      1.2.1 Advocate for and recognise volunteerism
 ACTIONS                                                                                RESPONSIBLE OFFICER      START DATE     END DATE
 1.2.1.1 Review Volunteer Strategy                                                       Events Coordinator      01-Jul-2020   30-Jun-2021
 STRATEGY      1.2.2 Develop and implement a Customer Contact and Call Centre
 ACTIONS                                                                                RESPONSIBLE OFFICER      START DATE     END DATE
 1.2.2.1 Implement the Customer Services Framework throughout the organisation           Corporate Services      01-Jul-2020   30-Jun-2021
 for improved customer experience and business improvement, including                       Coordinator
 continuous improvement approach to processes
 1.2.2.2 Undertake Customer Relations Satisfaction Survey                                Corporate Services      01-Jul-2020   30-Jun-2021
                                                                                            Coordinator
 1.2.2.3 Develop Customer Service Telephone Evaluation Template                          Corporate Services      01-Jul-2020   30-Jun-2021
                                                                                            Coordinator

Delivery Program 2020-2022 incorporating Operational Plan 2020/2021                                                                Page 23 of 58
STRATEGY 1.2.3 Support the Reconciliation Movement ACTIONS RESPONSIBLE OFFICER START DATE END DATE 1.2.3.1 Seek endorsement of Reconciliation Action Plan from Reconciliation Youth and Community 01-Jul-2020 30-Jun-2021 Australia Projects Officer 1.2.3.2 Investigate Mukutu Cultural Engagement Data Base for potential community Library Coordinator 01-Jul-2020 30-Jun-2021 engagement STRATEGY 1.2.4 Engage with key community sectors via Community Round Table ACTIONS RESPONSIBLE OFFICER START DATE END DATE 1.2.4.1 Establish methodologies to ensure community representatives understand Executive Support Officer 01-Jul-2020 30-Jun-2021 the functions and reporting associated to comply with the S355 Community Strategic Plan Round Table Committee Constitution OBJECTIVE 1.3 Our history, culture and diversity is embraced and celebrated STRATEGY 1.3.1 Advocate for funding and investment for Community Development Projects in City growth and development ACTIONS RESPONSIBLE OFFICER START DATE END DATE 1.3.1.1 Work with third parties to seek funding City Growth Coordinator 01-Jul-2020 30-Jun-2021 STRATEGY 1.3.2 Develop the Broken Hill Cultural Precinct, Library and Archive ACTIONS RESPONSIBLE OFFICER START DATE END DATE 1.3.2.1 Continue to pursue funding sources and opportunities to construct the General Manager 01-Jul-2020 30-Jun-2021 Cultural Precinct 1.3.2.2 Begin construction of new Cultural Precinct, Library and Archive General Manager 01-Jul-2020 30-Jun-2021 STRATEGY 1.3.3 Promote City’s listing as Australia’s First Heritage City ACTIONS RESPONSIBLE OFFICER START DATE END DATE 1.3.3.1 Continue to build Broken Hill Heritage Festival as an annual event Events Coordinator 01-Jul-2020 30-Jun-2021 STRATEGY 1.3.4 To facilitate lifelong learning via access to books, learning resources and other information ACTIONS RESPONSIBLE OFFICER START DATE END DATE 1.3.4.1 Update two policies in relation to Library and Archive services Library Coordinator 01-Jul-2020 30-Jun-2021 Delivery Program 2020-2022 incorporating Operational Plan 2020/2021 Page 24 of 58
STRATEGY      1.3.5 To preserve and share the City's archive, art and mineral asset collections through digitisation
 ACTIONS                                                                                  RESPONSIBLE OFFICER       START DATE     END DATE
 1.3.5.1 Finalisation of Strategic Business Plan and review of Policies for Art Gallery    Gallery and Museum       01-Jul-2020   30-Jun-2021
 and Museum                                                                                      Manager
 1.3.5.2 Digitisation of City’s art assets                                                 Gallery and Museum       01-Jul-2020   30-Jun-2021
                                                                                                 Manager
 1.3.5.3 Seek funding for the Digitisation of City’s archival assets                        Library Coordinator     01-Jul-2020   30-Jun-2021
 1.3.5.4 Digitisation of the City's mineral assets                                         Gallery and Museum       01-Jul-2020   30-Jun-2021
                                                                                                 Manager
 1.3.5.5 Seek funding for method for making art and mineral collections publicly           Gallery and Museum       01-Jul-2020   30-Jun-2021
 accessible online                                                                               Manager
 STRATEGY      1.3.6 Develop interstate and regional partners to maximise tourism opportunities
 ACTIONS                                                                                   RESPONSIBLE OFFICER      START DATE     END DATE
 1.3.6.1 Support the development of the Silver to Sea Trail project                           Visitor Services      01-Jul-2020   30-Jun-2021
                                                                                               Coordinator
 1.3.6.2 Continue to develop working relationships with the South Australian Visitor          Visitor Services      01-Jul-2020   30-Jun-2021
 Information Network                                                                           Coordinator
 STRATEGY      1.3.7 Develop a City-wide Cultural Plan
 ACTIONS                                                                                   RESPONSIBLE OFFICER      START DATE     END DATE
 1.3.7.1 Seek funding and develop a City-wide Cultural Plan                                Gallery and Museum       01-Jul-2020   30-Jun-2021
                                                                                                 Manager
 OBJECTIVE     1.4     Our built environment supports our quality of life
 STRATEGY      1.4.1 Develop City Strategic Plan
 ACTIONS                                                                                   RESPONSIBLE OFFICER      START DATE     END DATE
 1.4.1.1 Investigate options for a multi lot subdivision at the Broken Hill Airport to      Manager Planning,       01-Jul-2020   30-Jun-2021
 promote non aeronautical and aeronautical development                                      Development and
                                                                                              Compliance

Delivery Program 2020-2022 incorporating Operational Plan 2020/2021                                                                   Page 25 of 58
1.4.1.2 Carry out a review of the Broken Hill Development Control Plan in order to Manager Planning, 01-Jul-2020 30-Jun-2021
develop development controls to address local development needs Development and
Compliance
1.4.1.3 Advocate to secure funding for heavy vehicle bypass road City Growth Coordinator 01-Jul-2020 30-Jun-2021
1.4.1.4 Advocate to secure funding for a Truck Wash City Growth Coordinator 01-Jul-2020 30-Jun-2021
STRATEGY 1.4.2 Maintain the serviceability of Council's assets at an appropriate condition level
ACTIONS RESPONSIBLE OFFICER START DATE END DATE
1.4.2.1 Develop Asset Management Plan - Roads and Footpaths Strategic Assets Manager 01-Jul-2020 30-Jun-2021
1.4.2.2 Develop Asset Management Plan - Trees Strategic Assets Manager 01-Jul-2020 30-Jun-2021
1.4.2.3 Develop Asset Management Plan - Parks and Open Spaces Strategic Assets Manager 01-Jul-2020 30-Jun-2021
1.4.2.4 Develop Asset Management Plan - Buildings Strategic Assets Manager 01-Jul-2020 30-Jun-2021
1.4.2.5 Finalise and prioritise implementation actions within Active Transport Plan Strategic Assets Manager 01-Jul-2020 30-Jun-2021
(including Footpaths, Bicycle paths, Signage, Pedestrian Access etc)
1.4.2.6 Develop Fleet Asset Management Plan Strategic Assets Manager 01-Jul-2020 30-Jun-2021
STRATEGY 1.4.3 Develop Council assets to promote outdoor recreation, exercise and mobility for families
ACTIONS RESPONSIBLE OFFICER START DATE END DATE
1.4.3.1 Develop and implement a masterplan for the Norm Fox Oval Precinct Strategic Assets Manager 01-Jul-2020 30-Jun-2021
1.4.3.2 Develop and reactivate Queen Elizabeth Park with the relocation of the Strategic Assets Manager 01-Jul-2020 30-Jun-2021
Picnic Train
OBJECTIVE 1.5 Our health and wellbeing ensures that we live life to the full
STRATEGY 1.5.1 Support our residents to lead healthy, active and independent lives
ACTIONS RESPONSIBLE OFFICER START DATE END DATE
1.5.1.1 Partner with the YMCA to provide Prevention and Wellness sessions via grant Youth and Community 01-Jul-2020 30-Jun-2021
proposals Projects Officer
Delivery Program 2020-2022 incorporating Operational Plan 2020/2021 Page 26 of 58OPERATIONAL PLAN - Future Proof Scenario
INCOME STATEMENT - OUR COMMUNITY
$ '000 2021 2021 2021 2021 2021 2021 2021 2021
Our
Community Community Local Community Community
Open Spaces Public Safety Arts & Culture
Proposed Services Transport Facilities Development
Budget
Income from Continuing Operations
Revenue:
Rates & annual charges (7) - - (2) (4) - - -
User charges & fees 567 210 - 49 227 - 82 -
Interest & investment revenue - - - - - - - -
Other revenues 40 - - - - - 40 -
Grants & contributions for operating purposes 1,437 - 966 - - - 471 -
Grants & contributions for capital purposes 26,211 - 1,666 3,520 21,025 - - -
Other Income:
Net gains from disposal of assets - - - - - - - -
Net share of interests in joint ventures - - - - - - - -
TOTAL INCOME FROM CONTINUING OPERATIONS 28,249 210 2,632 3,566 21,248 - 593 -
Expenses from Continuing Operations
Employee benefits & costs 2,874 - 1,006 559 162 - 1,147 -
Borrowing costs 549 - 545 - - - 4 -
Materials & contracts 1,598 - 125 203 909 - 361 -
Depreciation & amortisation 3,006 2 2,955 18 25 - 5 -
Impairment - - - - - - - -
Other expenses 598 - - 32 - 422 144 -
Net losses from disposal of assets - - - - - - - -
TOTAL EXPENSES FROM CONTINUING OPERATIONS 8,624 2 4,631 812 1,096 422 1,662 -
OPERATING RESULT FOR THE YEAR 19,625 208 (1,999) 2,754 20,152 (422) (1,069) -
NET OPERATING RESULT FOR THE YEAR BEFORE
GRANTS & CONTRIBUTIONS FOR CAPITAL PURPOSES (6,586) 208 (3,665) (766) (873) (422) (1,069) -
Delivery Program 2020-2022 incorporating Operational Plan 2020/2021 Page 27 of 58CAPITAL BUDGET - OUR COMMUNITY
Operating
Capital Capital Grant Reserve Working Net Cost to New, Renewal,
Description Total Cost Grant Contribution (untied roads) Loan Funds Transfers Capital Council Upgrade
LED Street Upgrade (including Council owned lights in medium strip of
Argent) $ 1,700,000 $ 1,700,000 $ 1,700,000 Upgrade
Roof & lighting replacement - Insurance works $ 6,000,000 $ 6,000,000 $ - $ - Renewal
Cultural Precinct & Library + Archive (Stage 1 - Year 1) $ 15,025,000 $ 15,025,000 $ - $ - Upgrade
Christmas tree and street decorations $ 75,000 $ 75,000 $ 75,000 Renewal
O'Neill Park Complex Master Plan Works (Inclusive of Norm Fox, Soccer,
Netball & Tennis) * $ 3,200,000 $ 2,100,000 $ 1,100,000 $ - $ 1,100,000 Upgrade
Alma Oval lighting upgrade $ 500,000 $ 500,000 $ - $ - Upgrade
Soccer Oval lighting upgrade $ 500,000 $ 500,000 $ - $ - Upgrade
Queen Elizabeth Park upgrade $ 1,050,000 $ 100,000 $ 850,000 $ 100,000 $ 950,000 Upgrade
Skate Park upgrade $ 700,000 $ 320,000 $ 380,000 $ 380,000 Upgrade
Plant & Equipment $ 1,000,000 $ 1,000,000 $ 1,000,000 Renewal
Footpaths under Active Transport Plan $ 650,000 $ 650,000 $ - $ - Upgrade
Blende Oxide St Intersection $ 220,000 $ 220,000 $ - $ - Renewal
Local - Resealing 20/21 $ 600,000 $ 600,000 $ 600,000 Renewal
Local - Iodide Street - Morgan to Cummins - Full reconstruction $ 150,000 $ 150,000 $ 150,000 Renewal
Local - Intersection of Comstock and Piper Street - Full $ 145,000 $ 145,000 $ 145,000 Renewal
Kanandah Road Heavy Patching $ 800,000 $ 400,000 $ 300,000 $ - $ - Renewal
Gypsum Cornish Intersection $ 196,000 $ 196,000 $ - $ - Renewal
Gypsum Street Roundabout $ 600,000 $ 465,870 $ 100,000 $ 100,000 Renewal
Gypsum Street South Rd Turn lane widening $ 200,000 $ 200,000 $ - $ - Upgrade
Civic Centre fire upgrade $ 45,000 $ 45,000 $ 134,130 $ 179,130 Upgrade
Civic Centre Train Chiller (Ground Floor - Air Conditioner) $ 400,000 $ 400,000 $ 400,000 Renewal
Total for Our Community $ 33,756,000 $ 19,911,000 $ 6,300,000 $ 765,870 $ 1,995,000 $ - $ 4,784,130 $ 6,779,130
* These figures are based off best available data and estimates. The estimate has been derived from concept master planning, which is nearing completion, however,
may be subject to further revision.
Delivery Program 2020-2022 incorporating Operational Plan 2020/2021 Page 28 of 58KEY DIRECTION 2 – OUR ECONOMY 2.1 Our economy is strong and diversified and attracts people to work, live and invest
2.2 We are a destination of choice and provide a real experience that encourages increased visitation
2.3 A supported and skilled workforce provides strength and opportunity
We are accustomed to tackling our problems and our willingness to
create change and diversify makes us resilient, securing our long term economic
prosperity and paving the way for other communities to follow.KEY DIRECTION 2 - OUR ECONOMY Broken Hill is a leader in remote community resilience; where the community unites to tackle problems and a global perspective is applied to deliver broad prospects for economic participation. Our community understands the importance of economic diversity to guarantee a sustainable future for the City. A sustainable economy was by far the largest priority identified through the 2013 community consultative process and confirmed through the 2017 community consultative process further acknowledging that diversification is the ‘key’ to addressing challenges associated with the contraction of the mining industry. A sustainable economy is inclusive, equitable and diverse. It is an economy where businesses prosper and everyone stands to benefit. The performance of our economy directly impacts on the way we work, live and play and the mining peaks and troughs do provide a challenge. The emphasis our community has given towards a sustainable economy recognises the imperative to innovate, problem solve and create new opportunity in order to remain relevant in a global environment that is marked by rapid social and technological change. It also marks a shift in community appraisal, recognising that, although technology has reduced the need for labour over the years, it has also delivered efficiencies and bridged the isolation gap. Technology paves the way to operate on a national and global scale and delivers far greater opportunities in education, tourism and business. Now the local community is not the only source market for our goods and services and we all see the clear need for high-speed broadband to connect Broken Hill to the world and enable us to fully capitalise on the opportunities that this infrastructure creates. In order to reduce our reliance on the mining industry, the community identified strategies that reflect a commitment and determination to expand our thinking and adapt to remain relevant in the world as it is today. This means building on existing economic platforms, like art, culture and tourism, and building on new opportunities such as technology, renewable energies and education. Not only must we seek prospects for new business investment, we must also encourage and support local entrepreneurialism and innovation as our economy transforms to meet new opportunity. Broken Hill has history of resilience and getting things done. It is a leader in remote community revitalisation and as end-of-mine life becomes a reality on the horizon, we collectively recognise the need to work in collaboration, look ‘outside the box’ and break new ground in order to assure our sustainable future. The tables to follow provide objectives to help us meet the overall goal for ‘Our Economy’ as outlined in the Community Strategic Plan which contributes to the community’s combined vision for the future. Under each objective we show strategies that Council will undertake to allow us to meet our goals along with measurements to help us ensure we are on the right path. Delivery Program 2020-2022 incorporating Operational Plan 2020/2021 Page 30 of 58
KEY DIRECTION 2 – OUR ECONOMY
OBJECTIVE     2.1    Our economy is strong and diversified and attracts people to work, live and invest
STRATEGY      2.1.1 Council's Workforce Management Plan reflects the needs of the organisation
ACTIONS                                                                                 RESPONSIBLE OFFICER       START DATE     END DATE
2.1.1.1 Learning and Development plans are completed for all employees including          Human Resources         01-Jul-2020   30-Jun-2021
succession and career options                                                               Coordinator
2.1.1.2 Commence revision of Workforce Management Plan 2020-2024 in line with             Human Resources         01-Jul-2020   30-Jun-2021
Local Government election process                                                           Coordinator
2.1.1.3 Continue to improve Recruitment Service Delivery and employee                     Human Resources         01-Jul-2020   30-Jun-2021
experiences                                                                                 Coordinator
STRATEGY      2.1.2 Develop the Airport as a commercial precinct
ACTIONS                                                                                 RESPONSIBLE OFFICER       START DATE     END DATE
2.1.2.1 Advocate for Airport upgrades in line with Advocacy Strategy and Airport        Chief Financial Officer   01-Jul-2020   30-Jun-2021
Business Case
STRATEGY      2.1.3 Advocate for affordable housing
ACTIONS                                                                                 RESPONSIBLE OFFICER       START DATE     END DATE
2.1.3.1 Develop an affordable housing strategy and identify available land              Chief Financial Officer   01-Jul-2020   30-Jun-2021
STRATEGY      2.1.4 Advocate Broken Hill and Far West as a centre for renewable energy
ACTIONS                                                                                 RESPONSIBLE OFFICER       START DATE     END DATE
2.1.4.1 Seek to understand capacity to expand electricity grid                            General Manager         01-Jul-2020   30-Jun-2021
2.1.4.2 Develop a Renewable Energy Action Plan (REAP)                                     General Manager         01-Jul-2020   30-Jun-2021
STRATEGY      2.1.5 Increase digital communication network through projects outlined in Smart Communities Framework
ACTIONS                                                                                 RESPONSIBLE OFFICER       START DATE     END DATE
2.1.5.1 Increase city coverage of City Smart Devices (smart bins, lighting, WIFI and    Manager Information       01-Jul-2019   30-Jun-2020
parking)                                                                                    Services
2.1.5.2 Provide open data to community via IoT (Internet of Things) platform            Manager Information       01-Jul-2019   30-Jun-2020
                                                                                            Services

Delivery Program 2020-2022 incorporating Operational Plan 2020/2021                                                                  Page 31 of 58
STRATEGY 2.1.6 Expand available industrial land
ACTIONS RESPONSIBLE OFFICER START DATE END DATE
2.1.6.1 Advocate for early determination for land that has a Local Aboriginal Claim Manager Planning, 01-Jul-2020 30-Jun-2021
which is zoned as industrial land Development and
Compliance
2.1.6.2 Collaborate with State Government to expand the industrial area in Manager Planning, 01-Jul-2020 30-Jun-2021
accordance with objectives in the Local Strategic Planning Statement Development and
Compliance
STRATEGY 2.1.7 Advocate for incentives and initiatives that support business and industry to expand
ACTIONS RESPONSIBLE OFFICER START DATE END DATE
2.1.7.1 Collaborate with business and industry to attract investment City Growth Coordinator 01-Jul-2020 30-Jun-2021
2.1.7.2 Implement Business and Industry Support Strategy City Growth Coordinator 01-Jul-2020 30-Jun-2021
STRATEGY 2.1.8 Work closely with the newly established Far West Joint Organisation for successful regional outcomes
ACTIONS RESPONSIBLE OFFICER START DATE END DATE
2.1.8.1 Support the initiatives that are endorsed by the Far West - South Joint General Manager 01-Jul-2020 30-Jun-2021
Organisation
STRATEGY 2.1.9 Promote a strategic approach to improved transport services
ACTIONS RESPONSIBLE OFFICER START DATE END DATE
2.1.9.1 Advocate for improved air and rail services through active lobbying and General Manager 01-Jul-2020 30-Jun-2021
participation in government inquiries
OBJECTIVE 2.2 We are a destination of choice and provide a real experience that encourages increased visitation
STRATEGY 2.2.1 Heritage Festival continues to grow and become nationally recognised
ACTIONS RESPONSIBLE OFFICER START DATE END DATE
2.2.1.1 Facilitate an annual Heritage Festival Events Coordinator 01-Jul-2020 30-Jun-2021
STRATEGY 2.2.2 Develop the Visitor Experience
ACTIONS RESPONSIBLE OFFICER START DATE END DATE
2.2.2.1 Develop Business Plan for Visitor Information Centre Visitor Services 01-Jul-2020 30-Jun-2021
Coordinator
2.2.2.2 Collaborate with industry to expand destination marketing campaign City Growth Coordinator 01-Jul-2020 30-Jun-2021
Delivery Program 2020-2022 incorporating Operational Plan 2020/2021 Page 32 of 58You can also read