REGIONAL LAND TRANSPORT PLAN 2015 - 2025 JUNE 2018 - Hawke's Bay Regional ...
←
→
Page content transcription
If your browser does not render page correctly, please read the page content below
REGIONAL LAND TRANSPORT PLAN
2015 - 2025

REVIEW

JUNE 2018
2

FOREWORD FROM REGIONAL TRANSPORT COMMITTEE CHAIRMAN
This 2018 review of the Regional Land Transport Plan 2015-         in the Regional Land Transport Strategy 2012. Once these            Ensuring that key routes are capable of carrying high
25 revisits Hawke’s Bay’s strategic objectives for the transport   are complete, we are confident that the Heretaunga Plains           productivity motor vehicles will reduce the number of trucks
system to 2025 and sets out our funding request to the New         transport network will function more safely and efficiently.        on our roads and improve safety.
Zealand Transport Agency for the next three years. The review      However, there is much still to be done, particularly in light of   Resilient links to other regions are very important and we
has been undertaken by the Hawke’s Bay Regional Transport          revised national goals. The draft Government Policy Statement       urge the NZ Transport Agency to commence work on the
Committee, which includes representatives from all councils        on Land Transport challenges all regions in the country to do       replacement route for the Manawatu Gorge as soon as
in Hawke’s Bay and the New Zealand Transport Agency, with          more to address safety, access, the environment and value           possible.
other key transport partners as advisors.                          for money.                                                          We are also very keen to build on the tremendous success of
The vision for transport in Hawke’s Bay is “A safe, resilient      The condition of State Highway 2 from Napier north to Wairoa        our cycling network, which provides safe access to schools
and efficient transport system that supports the development       and beyond is a particular concern in light of predicted logging    and workplaces for our residents and attracts many visitors to
of our economy and contributes to social wellbeing in our          volumes , the need to improve access to services and to open        the Bay each year.
community”.                                                        up economic opportunities, including tourism, in the Wairoa         On behalf of the Regional Transport Committee, I’d like to
A number of major roading projects are already underway in         district.                                                           thank all those who have contributed to the preparation of this
the region, designed to improve road safety on key routes as       Deaths and serious injuries on our roads are once again             document. I look forward to ensuring that Hawke’s Bay’s plan
well as improve access to the Port of Napier for freight. These    increasing, and we must re-double our efforts to reduce this        delivers better transport options for the future.
originate from the extensive transport studies undertaken          sad toll.
between 2009 and 2012 and the strategic direction set out

                                                                                                                                       Councillor Alan Dick
                                                                                                                                       Chairman, Regional Transport Committee

                                                                                                                                                                                                    1

                                                                                                       REGIONAL LAND TRANSPORT PLAN 2015 - 2025 REVIEW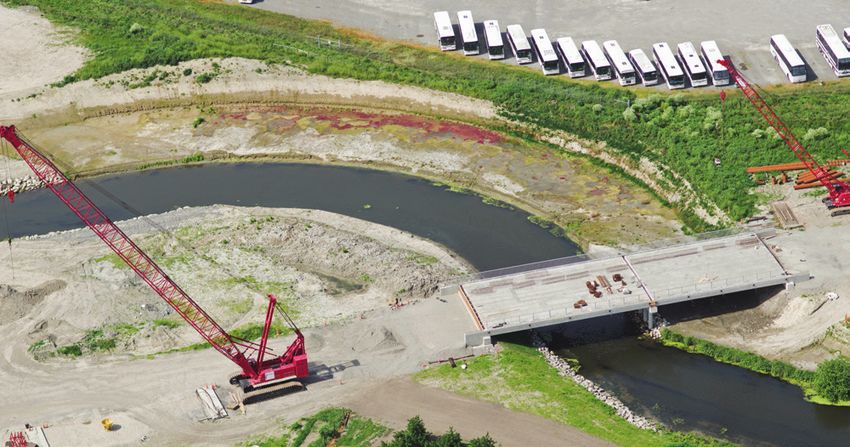
CONTENTS

1.0   Background....................................................5       4.5     Economy........................................................9   5.2   Problem Statement 1: Parts of the transport
                                                                                                                                                             system lack capability, limiting opportunities
2.0   National Context for the RLTP..........................5
                                                                            4.6     Employment.................................................10            for improved economic and social
2.1   Government Policy Statement                                                                                                                            development (60%)......................................14
      on Land Transport 2018..................................6             4.7     Transport Network.........................................10
2.2   Long Term Strategic View................................6                                                                                        5.3   Problem Statement 2: Limited shared view of
                                                                            4.8     Travel Patterns and Vehicle Ownership..........11                        cross-boundary transport issues increases the
2.3   The Provincial Growth Fund............................7
                                                                                                                                                             risk of misaligned investment and/or
                                                                            4.9     Road Safety..................................................11          management of the transport
3.0   Regional Context for the RLTP.........................7
                                                                                                                                                             system (10%)...............................................17
                                                                            4.10 Public Transport............................................12
4.0   About Hawke’s Bay.........................................8
                                                                                                                                                       5.4   Problem Statement 3: Poor user behaviour
                                                                            4.11 Freight..........................................................12         and transport system deficiencies increase the
4.1   Geography......................................................8
                                                                                                                                                             risk of deaths and serious injuries (30%).......19
                                                                            5.0     Challenges and Pressures on the Hawke’s Bay
4.2   Landscape......................................................8
                                                                                    Transport System..........................................13       6.0   Statement of Transport Priorities....................22

4.3   Climate...........................................................8
                                                                            5.1     Introduction..................................................13   7.0   Regional Transport Objectives and Policies....23

4.4   Population......................................................9

2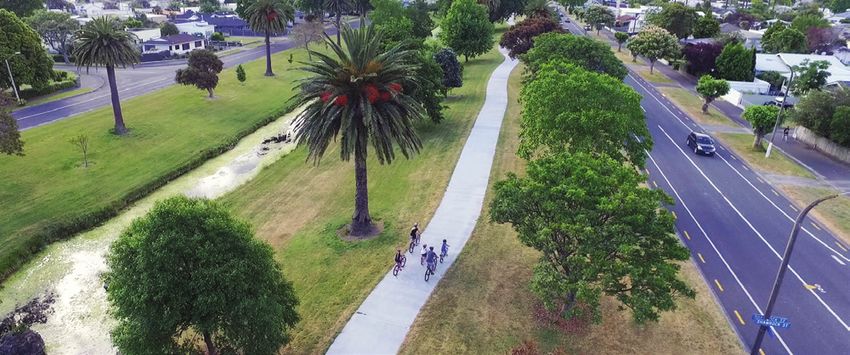
8.0    Regional Programme of Activities..................25                  11.0 Assessment of the relationship of Police                               GLOSSARY.............................................................44
                                                                                  activities to the Regional Land Transport
8.1    Process to Assess and Prioritise Significant                               Plan..............................................................41   APPENDIX A
       Activities.......................................................25                                                                               Assessment of RLTP Compliance with
                                                                             12.0 Activities approved under Section 20 of the                            Sections 14 and 16 of the LTMA..............................45
8.2    Prioritised Activities for 2018-21....................26                   LTMA but not yet complete............................42
                                                                                                                                                         APPENDIX B
                                                                                                                                                         Significance Policy..................................................48
8.3    Full list of Activities for 2018-21....................28             13.0 Activities to be varied, suspended or
                                                                                  abandoned...................................................42
8.4    Ten Year Forecast by Activity Class ($)...........36
                                                                             14.0 Monitoring of the plan...................................43
9.0    Regionally Significant expenditure on land
       transport activities to be funded from sources                        15.0 Summary of consultation carried out in the
       other than the national land transport                                     preparation of this plan.................................43
       fund.............................................................39

10.0 Activities of Inter-Regional Significance..........40

                                                                                                                                                                                                                                   3

                                                                                                                       REGIONAL LAND TRANSPORT PLAN 2015 - 2025 REVIEW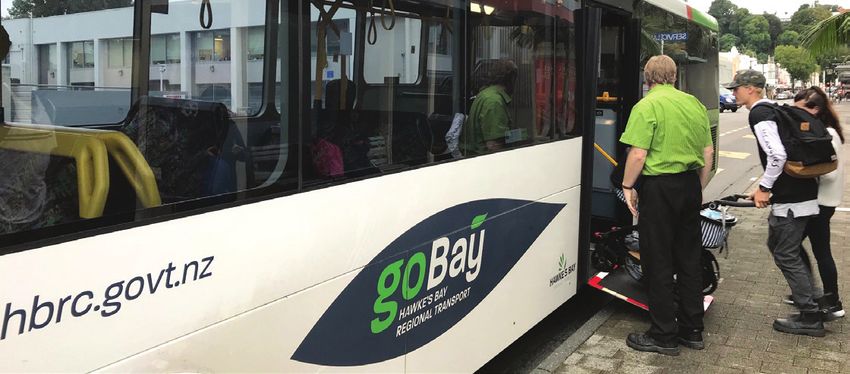
4
1.0 BACKGROUND                                                                                                                          2.0 NATIONAL CONTEXT FOR
                                                                                                                                              THE RLTP

» The Regional Land Transport Plan (RLTP) for 2015-25 was            The RTC has now reviewed the 2015 RLTP to capture what           »   2.1 GOVERNMENT           POLICY    STATEMENT       ON   LAND
  prepared by the Hawke’s Bay Regional Transport Committee           has changed over the last three years; emerging transport            TRANSPORT 2018
  (RTC) and adopted by the Regional Council in 2015.                 issues, changes in the rate of growth, progress with and the         The Regional Land Transport Plan must be consistent with
  Under the Land Transport Management Act 2003, each                 effects of major transport projects.                                 the Government Policy Statement (GPS) on Land Transport,
  regional council must ensure that its RTC prepares a regional      The list of activities in this plan has been jointly developed       which is reviewed three yearly and sets the Government’s
  land transport plan every six financial years and reviews it       by key regional transport stakeholders, including Hawke’s            direction for land transport.
  after three years. The plan must set out the region’s land         Bay Regional Council, Napier City Council, Hastings District         The GPS is the Government’s main lever for setting priorities
  transport objectives policies and measures for at least ten        Council, Wairoa District Council, Central Hawke’s Bay District       and funding levels for land transport investment.
  years in advance.                                                  Council, the New Zealand Transport Agency and other entities
                                                                     with transport interests.                                            The National government released its draft GPS during 2017,
  The plan must contain all activities for which the organisations
                                                                                                                                          but delayed the final version pending the outcome of elections
  in the region are seeking funding from the National Land           The plan consists of proposed transport activities to be
                                                                                                                                          in September.
  Transport Fund (as allocated by the NZ Transport Agency)           undertaken during the 2018-2021 period and provides a
  and allows the region to prioritise its proposed transport         10-year forecast of anticipated expenditure on all transport         The Minister for Transport for the Labour/NZ First coalition
  activities. The Agency can only allocate funds to activities       activities.                                                          government which came into power in October 2017, has
  included in an RLTP.                                                                                                                    further delayed the release of a revised GPS, in order to make
                                                                                                                                          changes to reflect the Government’s strategic priorities, which
                                                                                                                                          are:
                                                                                                                                          • giving public transport greater priority in cities and
                                                                                                                                            expanding the public transport system to support new
                                                                                                                                            housing and interregional commuting;
                                                                                                                                          • increasing the use of rail to enable efficient passenger and
                                                                                                                                            freight use;
                                                                                                                                          • supporting regional development;
                                                                                                                                          • increasing support for active modes – walking and cycling;
                                                                                                                                          • delivering health, safety and environmental improvements;
                                                                                                                                          • reducing the environmental impact of transport;
                                                                                                                                          • mode neutrality in freight transport planning

                                                                                                                                                                                                       5

                                                                                                       REGIONAL LAND TRANSPORT PLAN 2015 - 2025 REVIEW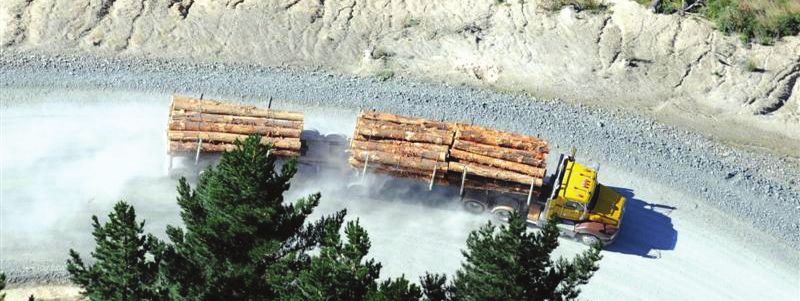
A draft revised GPS was released in April 2018 and has four           The first of these variations is likely to be adjustments to
strategic objectives. These are set out in Figure 1 below:            reflect that footpath maintenance will now be subsidised, in
                                                                      order to help achieve government aims to increase walking
The GPS cannot determine which projects will be funded, or
                                                                      and community access.
how much funding any particular project will receive. Rather,
the GPS sets ranges of funding which government will make
                                                                    » 2.2    LONG TERM STRATEGIC VIEW
available for different types of activity. The New Zealand
Transport Agency then determines which projects receive               In May 2017, the NZ Transport Agency released the first
funding – and to what level – within those overall funding            draft national Long Term Strategic View (LTSV) document.
ranges.                                                               This document aims to captures the pressure points and key
                                                                      economic, environmental, and population factors that will
The RTC has reviewed its strategic direction against the              shape the transport system needed for the future.It sets out
GPS objectives and intends to review its programmes over              how we need to respond to these challenges. The LTSV is
time to better reflect these objectives. The timing of GPS            intended as living document which will be regularly updated
announcements and the advanced development of council                 as new information and trends come to hand.
long term plans has made it difficult to adjust programmes in                                                                          Figure 1: Strategic Direction of the GPS 2018
the short-term; where a ratepayer contribution is required, an        The key opportunities and challenges identified in the LTSV
increased rate of subsidy through the NZ Transport Agency             for Hawke’s Bay are reflected strongly in the discussion
may be one way to help achieve government objectives more             of transport challenges and pressures in this document
quickly.                                                              (Section 5).
                                                                                                                                       The PGF can be used to
However, the Agency’s State Highway Investment Plan (which          » 2.3   THE PROVINCIAL GROWTH FUND                                 • provide a top-up of local share for projects that will receive
set out what the Agency intended to invest in state highways)         The Provincial Growth Fund was announced by the                    funding from the National Land Transport Fund but where
has been revised in light of the draft GPS and released as the        government in February 2018. The PGF aims to enhance               local councils are financially constrained
Transport Agency Investment Proposal (TAIP). The revised              economic development opportunities, creating sustainable
TAIP has a greater emphasis on safety improvements on the                                                                              • bring forward projects which are not yet able to be funded
                                                                      jobs, contributing to community well-being, lifting the
region’s state highways. Changes to transport programmes by                                                                              from the NLTF but which are important for a region’s
                                                                      productivity potential of regions and helping meet New
the region’s councils, or further variations to the state highway                                                                        productivity potential
                                                                      Zealand’s climate change targets. The PGF is important
programme, will be added to this RLTP when necessary.                 for regions such as Hawke’s Bay because it can be used           • fund projects outside the scope for NLTF investment, but
                                                                      to facilitate transport activities that might otherwise not be     which contribute to the objectives sought through the PGF
                                                                      possible in the short-term.                                        and are aligned with the region’s transport strategy.

6
3.0 REGIONAL CONTEXT FOR THE RLTP

One example of PGF investment that has already been                » 3.1		   COUNCIL LONG TERM PLANS                                     » 3.2		   REGIONAL ECONOMIC DEVELOPMENT STRATEGY
announced for Hawke’s Bay is the reinstatement of the rail           While the GPS sets national priorities for transport in the           Matariki, Hawke’s Bay’s economic development strategy, was
line between Napier and Wairoa to provide for transport              region, the RLTP brings together the transport programmes of          adopted in 2016 and sets out a number of work areas which
of logs to Napier Port. Promoting the use of rail for freight        all the councils in the region into one document.                     this RLTP contributes to. Chief among these is Matariki’s
is a key objective of this RLTP, but currently funding for                                                                                 desire to see State Highway 2 between Napier and Opotiki
rail infrastructure sits outside the scope of the NLTF. The          City and district councils have responsibility for the upkeep
                                                                     and improvement of local roads in their districts, while the          improved to decrease journey times, improve access to areas
announcement of PGF funding for reinstatement of the line                                                                                  such as Wairoa , improve safety and cater for significant
will therefore contribute to our regional objectives for rail.       System Design and Delivery arm of the New Zealand Transport
                                                                     Agency manages the state highways in the region. Hawke’s              growth in forestry in the catchment areas of this route. The
With the recent announcement of criteria for the fund, and a         Bay Regional Council has a role in transport planning through         NZ Transport Agency is working through a business case for
better understanding of how the fund might work alongside            the Regional Transport Committee as well as contracting and           the route in partnership with the Hawke’s Bay and Gisbonre
NLTF investment in Hawke’s Bay, our councils and the                 managing the provision of public transport services.                  Regional Transport Committees and other major stakeholders.
NZ Transport Agency are currently considering further                                                                                      Matariki, with its main focus on economic development, also
                                                                     Each of the region’s councils must prepare a Long Term Plan
opportunities for PGF applications.                                                                                                        advocates for ensuring safe and efficient access to Napier
                                                                     (LTP) at the same time as the RLTP is prepared or reviewed.
Wairoa District Council is considering applications to seal          The LTP contains planning and financial information for               Port, another opportunity identified in this plan and for which
State Highway 38, for bridge and pavement strengthening on           the next ten years. The RLTP has an impact on the LTP                 a programme of works is already underway.
heavy traffic routes (Gate to Port activities) and for improving     because the level of government subsidy received will affect          Matariki also promotes the sealing of State Highway 38 in
connectivity to Mahia. Central Hawke’s Bay District Council          the size of each transport programme and the amount                   order to facilitate tourist and community access into Lake
may apply to the fund to construct roads into areas of               of income required from city, district or regional rates.             Waikaremoana and beyond, another key aim of this RLTP.
housing development in rural communities, where paper                The RLTP is consulted on during a similar period as each LTP          A business case for this route has already been commenced
roads already exist.                                                 and it is important that the final document reflects the region’s     in conjunction with the Bay of Plenty Regional Transport
                                                                     LTPs as much as possible. No activity can be funded by NZTA           Committee.
                                                                     unless it is contained in the RLTP.

                                                                                                                                                                                                        7

                                                                                                         REGIONAL LAND TRANSPORT PLAN 2015 - 2025 REVIEW
4.0 ABOUT US

 In order to understand the transport issues and priorities   » 4.2      LANDSCAPE                                                   » 4.3   CLIMATE
 identified in this plan, we need a broad understanding of        In the north of the region, much of the land is unstable,           Hawke’s Bay’s weather is sunny and warm overall, with hot
 the physical, social and environmental factors that have         highly erodible and deeply incised by rivers and streams. In        dry summers. Storm systems from the north and east affect
 influenced and shaped our transport needs and how these          the centre and in the south, more extensive plains have been        the region seasonally and can cause significant rainfall events
 have changed or might change over time.                          formed. In the west all these land are bound by high axial          to occur.
                                                                  ranges and by lower limestone hills in the east south of Napier.
» 4.1   GEOGRAPHY
                                                                  This landscape restricts movement north and south and to
                                                                                                                                      The transport network can be affected by flooding and by
                                                                                                                                      snow on high altitude areas, and climate change is predicted
 The Hawke’s Bay region covers 1.42 million hectares, lies        other regions to one or two main corridors.                         to bring about more intense rainfall events, with consequent
 on the east coast of the North Island and includes Wairoa,
                                                                                                                                      flooding and erosion.
 Hastings and Central Hawke’s Bay District Councils and       »
 Napier City Council. The region adjoins the Bay of Plenty,                                                                           Those parts of the transport network close to the coastline may
 Waikato and Manawatu-Whanganui regions and Gisborne                                                                                  be affected by sea level rises and consequent coastal erosion.
 District.                                                                                                                            It is expected that climate change will also affect key state
                                                                                                                                      highway links in and out of the region. Resilience issues in
                                                                                                                                      other regions could compromise journeys to and from the
                                                                                                                                      Bay. For example, the Manawatu Gorge was an important
                                                                                                                                      connection between the east and west of the North Island.
                                                                                                                                      While alternative routes exist, these are longer and more costly
                                                                                                                                      to traverse and the replacement for the Gorge needs to be
                                                                                                                                      more efficient and resilient.

  8
» 4.4 POPULATION » 4.5 ECONOMY
Approximately 130,000 people live on or adjacent to the Rural land is used for pastoral farming and forestry, horticulture There are 134,841 hectares of plantation forests – up from
Heretaunga Plains. Beyond this area, the population is and viticulture. There is around 20,500 hectares of land on the 128,100 hectares in 2012. Timber products are a major
dispersed, and mainly situated in the small towns of Wairoa, Heretaunga Plains dedicated to horticulture and viticulture, export.
Waipawa and Waipukurau. the largest area in New Zealand. The value of this land to the
There are around 3 million sheep, 520,000 cattle, 85,000
The Napier-Hastings area is the fifth largest urban area in New Hawke’s Bay economy is very significant and the Heretaunga
dairy and 63,000 deer stock units in the region.
Zealand. There has been moderate population growth in the Plains Urban Development Strategy 2017 aims to protect it
from encroaching residential or other development. The main processing centres for rural produce are situated
region. However our population is ageing quickly, exacerbated
in and around Tomoana/Whakatu, Omahu Road and Irongate
by young people moving to larger centres and retirees moving Hawke’s Bay produces 61% of New Zealand’s apple and pear
areas in Hastings, and the Awatoto and Onekawa areas in
to the Bay. A review of demographic and economic indicators crops, 70% of summer fruit, 25% of grapes for wine and 50%
Napier.
in 2016 shows that the population growth in the Heretaunga of the country’s squash crop.
Plains area from 2009 to 2015 of 4.4% , was higher than Tourism is a growing industry within our region, with tourist
The pipfruit sector is seeing significant growth in plantings
predicted. There has also been a 24% increase in the number spend in the region up by 8.2% for the year ending December
in Hawke’s Bay (it is estimated that over 1 million new trees
of people over 65. 2016 with an estimated annual spend of $583 million. By
have been planted in the region in the last two years) and this
October 2017, the 2016 annual spend had already been
will have flow-on effects for the transport network. Hawke’s
exceeded.
Bay accounts for an estimated 60-70% of the national pipfruit
crop.1 The number of consented new residential houses rose 19%
in 2016, over the previous year. The total number of new
buildings (including commercial) consented in the region
during 2016 was up 23.8% on the previous year, with the
value of these buildings up 25.4%.2
1
http://www.businessHawke’sbay.co.nz/docs/economic%20reports/hbecmondecqtr16.pdf
2
http://www.businessHawke’sbay.co.nz/docs/economic%20reports/hbecmondecqtr16.pdf
9
REGIONAL LAND TRANSPORT PLAN 2015 - 2025 REVIEW4.0 ABOUT US (CONTINUED)
Figure 2: Hawke’s Bay State Highway Network
» 4.6 EMPLOYMENT
There is a trend towards increasing employment in the
horticulture, agriculture, forestry and fishing industries. This
was the largest occupational group recorded in the 2013
Census, with 14% of Hawke’s Bay workers occupied in this
area.
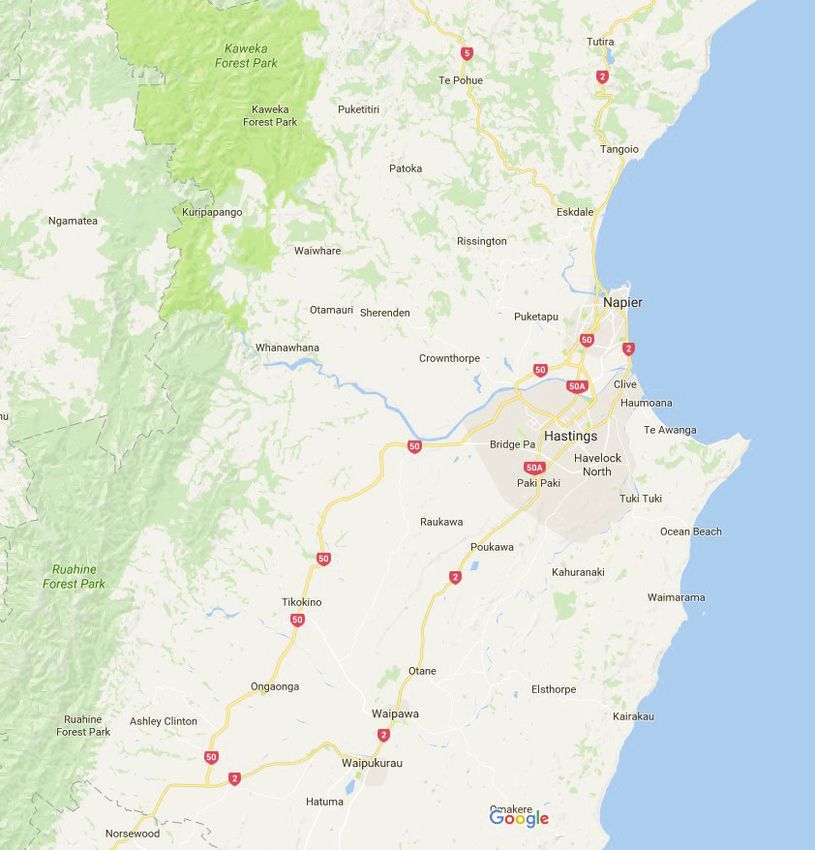
» 4.7 TRANSPORT NETWORK
The region is serviced by State Highways 2, 2B, 5, 38, 50 and
50A. See Figure 2.
Figure 2 sets out the classification of each highway according
to the One Network Road Classification now used across New
Zealand.
A single track rail line runs from the south of the region north
to Gisborne district, but the section between Napier and
Gisborne has been closed since 2012 due to major damage
sustained after a weather event. Plans to reopen the line for
freight transport between Wairoa and Napier have been
given a major boost by the February 2018 announcement of
government funding for reinstatement of the line.
The Port of Napier provides logistics services for the region
and central New Zealand, while Hawke’s Bay Airport at Napier
provides national passenger services and caters for irregular
private jets.
Since 2002, Hawke’s Bay has created over 200 kilometres
of off-road cycle trails and 100 kilometres of on-road cycle
facilities.
10» 4.8 TRAVEL PATTERNS AND VEHICLE OWNERSHIP » 4.9 ROAD SAFETY » 4.10 PUBLIC TRANSPORT
The number of households with access to a private vehicle Hawke’s Bay has more crashes per vehicle kilometre travelled Long distance bus services operate through the region to the
increased by 12% between 2001 and 2013. The number of on local roads and state highways than many other regions. Manawatu and Wairarapa, Taupo and Gisborne.
kilometres travelled on Hawke’s Bay roads remained fairly Crash rates vary across the region and are lower in Central Local bus passenger services operate in and between Napier,
consistent until 2014 but has increased by around 10% since Hawke’s Bay and higher in Hastings and Wairoa districts. Hastings and their dormitory towns; Flaxmere, Taradale,
then. The distance travelled by heavy vehicles in the region There were 18 fatalities on the region’s roads in 2017. The Havelock North and Bay View, with approximately 700,000
has increased significantly. Major efficiency improvements are highest road toll over the last five years was 21 in 2012 and passengers carried annually, for a distance of approximately
under construction and will ensure that the network continues the lowest was 6 in 2014. Fatal and serious injuries from some 7.2 million kilometres. An ageing population and consequent
to cope well with demand for the near future, although there major crash factors (alcohol and drugs, young drivers, fatigue development of more retirement villages could eventually
are some pinch points that will be monitored. and distraction, roads and roadsides, no restraint use) have require improved services and new routes; this trend will need
The number of cyclists has increased steadily as infrastructure in general declined since 2008, although crashes caused to be monitored over time.
improvements have been made, and cycling has become by high-risk drivers and speeding drivers have shown little A taxi based Total Mobility scheme is provided for those
an important generator of tourist visits to the Bay. There are improvement. people unable to use public transport services and carries
around 400,000 annual users of the off-road cycle trails and approximately 100,000 passengers annually. As the population
over 200 daily users of the cycle paths between Hastings and ages, the number of Total Mobility users is likely to increase.
Havelock North.
Figure 3: One Network Road Classification of State Highways in Hawke’s Bay
CLASSIFICATION STATE HIGHWAY
National High Volume Route SH2B, SH50A - Port and City of Napier to Hastings
National Route SH2 – Hastings to Woodville
Regional Route SH2 – Napier to Gisborne, SH5 – Taupo to Napier
Arterial Route SH2 – Napier to Hastings
Primary Collector SH35 - Wairoa to Murupara, SH50
11
REGIONAL LAND TRANSPORT PLAN 2015 - 2025 REVIEW4.0 ABOUT US (CONTINUED)
» 4.11 FREIGHT » 4.12 AIR TRANSPORT
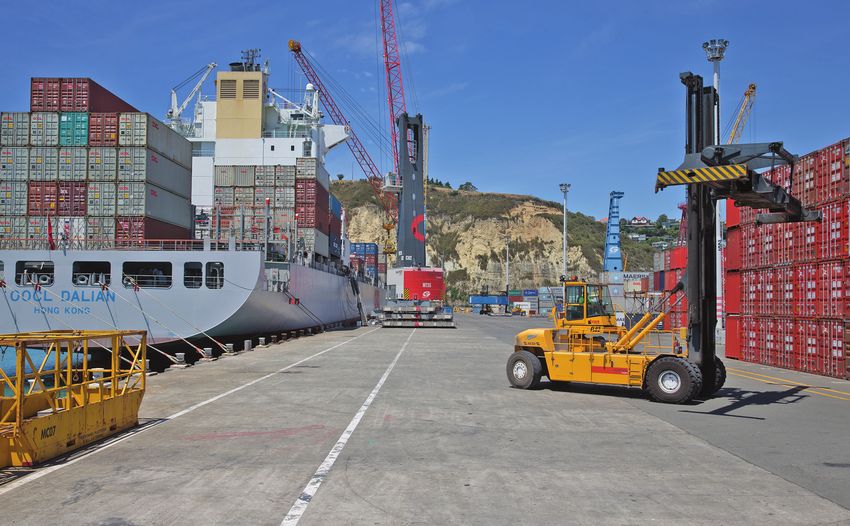
The Port of Napier is the fourth largest port in New Zealand by However, the 2016 Kaikoura earthquake caused significant The Hawke’s Bay Airport hosts regular scheduled domestic
overseas export volumes. It accounts for 10% of New Zealand’s damage to CentrePort in Wellington and Napier Port took flights on two airlines, Air New Zealand and Jetstar.
export tonnages and is therefore a nationally significant asset. on a large portion of its business. Until recently there were Passenger numbers have increased from about 450,000 per
In dollar terms, Napier Port supports more than $3.4 billion of two additional daily freight trains running on the line, now year in 2014 to 652,400 in 2017, in line with increased tourist
Hawke’s Bay’s Gross Regional Product. reduced to one. However, KiwiRail states that the log volumes numbers and the advent of Jetstar flights to the region.
There have been significant increases in the freight flow from Whanganui on this route (as discussed below) continue
Hawke’s Bay Airport is jet capable.
through the Port, with overall tonnages growing by 70% to grow.
between 2006 and 2016, from 2.3 million tonnes to 3.9 million The Napier to Gisborne section of the rail line has been
tonnes. Napier Port predicts that growth in key freight types mothballed since 2012 when the line suffered extensive storm
through the Port will increase truck movements by 187% ( damage. After many ideas were floated to re-open the line, a
being 171,000 truck movements) along the critical Ahuriri commercial agreement has been reached between Napier
access corridor, in the nine years to 2027. Port and KiwiRail for the transport of logs from Wairoa by rail
Road transport carries 95% of the region’s freight, while rail to the port. KiwiRail currently operates a dedicated log service
accounts for almost all the remaining 5%. The rail line south to Whanganui every weekday and this train will be utilised to
from Napier is commercially viable and handles all the region’s provide (initially) four services each weekend. It is estimated
rail freight. Use of this line for freight grew over 40% between that this service will decrease the daily one way logging truck
2007 and 20123, but tonnages remain low as a percentage movements by 50 per day when forest harvesting is in full
of all freight carried. After 2014 freight loads had dropped on swing. A 2018 announcement by the new Labour-NZ First
the line, due to Ravensdown Fertiliser’s discontinued use of government will see government funds provided for the
rail and because Fonterra product is no longer exported out reinstatement of the line.
of Napier Port.
3
National Freight Demand Study 2012, Ministry of Transport.
125.0 OUR FUTURE
Challenges and Pressures on the Hawke’s Bay Transport System
» 5.1 INTRODUCTION • Improvements to the Prebensen Drive/Hyderabad Road » 5.2 PROBLEM STATEMENT 1: PARTS OF THE
The Heretaunga Plains Transport Study 2012 identified a roundabout – slip lanes. TRANSPORT SYSTEM LACK CAPABILITY4, LIMITING
number of network constrictions and safety issues which • Passing lanes on State Highway 2 between Hawke’s Bay OPPORTUNITIES FOR IMPROVED ECONOMIC AND SOCIAL
needed to be addressed to improve access to the Port of Airport and Bay View. DEVELOPMENT (60%)
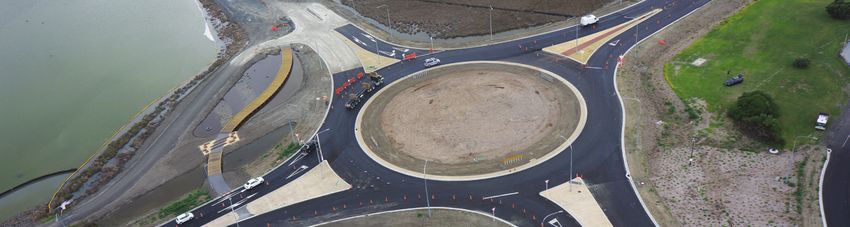
Napier and to address major safety blackspots. Key roading • The Watchman Road intersection upgrade, including This problem statement encompasses a range of issues that
improvements that arose out of this study included: relocation of the entrance to the HB Airport (State Highway the region wishes to address.
• The Whakatu Arterial Link and associated SH2-Napier 2-2B). 5.2.1 SAFETY, TRAVEL TIME AND LEVEL OF SERVICE ON
Road intersection upgrade. Almost all of the above improvements are well underway, either SH2 NORTH OF NAPIER
• The Pakowhai Road- Links Road – HB Expressway committed for funding or already in the construction phase. In Wairoa District Council continues to be concerned about the
intersection upgrade. view of the above, the region is relatively confident that major travel time between Wairoa and Napier, and considers this
A number of other safety and efficiency improvements have issues are in hand; the planned improvements will do much a barrier to further development in the area. Although the
also been identified in the last five years, including upgrading to resolve high priority safety and efficiency problems on distance between Bay View and Wairoa is 106 kilometres,
key state highway and local road links for HPMV capability. the Heretaunga Plains. The focus of the region’s efforts now the route is winding and passing opportunities are infrequent.
needs to expand to emerging issues across the region and The journey takes around 1 hour 40 minutes and can vary
Since then, the Napier Port Access Study has identified to ensuring that this RLTP contributes to national objectives considerably with the number of heavy vehicles on the route.
further issues to be remedied to provide more efficient and of improving road safety, access, addressing environmental
safe access to the Port and to cope with growth in demand. There is a significant crash rate on the route with 21 deaths
issues ( including climate change) while ensuring value for and 56 serious injuries over ten years, and a high risk of run-
A number of these have already been funded as part of the money.
Matariki: Hawke’s Bay Economic Development Strategy, off-road and head-on crashes. There is minimal roadside
including: In view of this recent progress in the region, the RTC has protection.
reviewed the key problem statements from the 2015 Regional Heavy traffic on the route is predicted to increase due to forest
• Safety and efficiency improvements on the Hawke’s Bay Land Transport Plan. These statements summarise the key
Expressway between Pakipaki and Watchman Road – slip harvests. Latest forecasts indicate that one way logging truck
areas of focus for improvement over the next ten years, while movements on SH2 from Wairoa will increase from 171 per
lane extensions at roundabouts, targeted seal widening acknowledging that the vast majority of the region’s work will
and median/side barriers. day in 2017 to 278 by 2023.5
be to maintain and manage the existing network and services
to a high standard and to improve the operation of the network
in order to maximise its capability and safety and manage
growth.
4
Capability of the network refers to how well the network performs on efficiency, safety, accessibility, resilience and minimisation of environmental effects.
5
N. Cornwall, Starboard Group Ltd, 2016
13
REGIONAL LAND TRANSPORT PLAN 2015 - 2025 REVIEW5.0 0UR FUTURE (CONTINUED)
One partial solution could be the proposal for the transport The Rocket Lab launch site at Te Mahia (Mahia Peninsula) » TRAFFIC GROWTH ON STRATEGIC ROUTES
of logs from Wairoa by rail. It is estimated that this service opened in September 2016, and is seen by the Council as a It is likely that changing land use, population growth,
will decrease the daily one way logging truck movements major tourism opportunity. The first test launches have been increasing efficiency on productive land, tourism growth and
by 50 per day when forest harvesting is in full swing. As successful, with commercial launches later in 2018. increased Port traffic is leading to growth in daily traffic on
reinstatement of the line has been funded from the Provincial As part of 2016 regional economic development strategy certain sections of the Hawke’s Bay Expressway and on some
Growth Fund, it is hoped to have this service operational by announcements for the Tairawhiti and Hawke’s Bay regions, local roads. For example, the average annual daily traffic on
the end of 2018. However, while the service will remove a a comprehensive examination of the whole SH2 route from one section of the HB Expressway near Taradale has recently
considerable number of daily logging truck movements, Opotiki to Napier will be undertaken via a Programme increased, as shown below.
there will still be an overall increase and this could increase Business Case. The NZ Transport Agency has confirmed
crashes and travel time variability. Growth in traffic movements on this section of the route has
funding for this investigation and this will be a major focus resulted in increased travel times between Pakowhai Road and
The Safe Roads Alliance6 has also focussed on this high- during 2018-21. Meeanee Road and has increased travel time variability on
risk route, investigating safety improvements from Wairoa » 5.2.2 NETWORK CAPABILITY AND RESILIENCE the southbound journey between Napier Port and Pakowhai.7
to Bay View. Funding for a detailed business case has been However, travel times are fairly consistent throughout the
approved and work will commence soon, including side Despite the improvements described in the introduction to
this section, there are one or two emerging pinch points on day on the northbound journey. The Napier Port Access
barriers, shoulder widening, wide centrelines and rumble Programme Business Case states “Preliminary analysis
strips. the network that will need to be monitored carefully.
indicates that an increase in journey time for southbound
An independent group of interested parties has developed a traffic is caused by congestion near the Pakowhai Road/Links
proposal to remove some of the worst sections of the route Road intersection. The upgrade of the Links Road/Pakowhai
(between Whirinaki and Tūtira) by using the rail corridor as
a new state highway alignment. Initially this proposal was to
replace the rail line with a new road, but they have now adjusted
this to suggest that the road could run alongside the rail line.
This proposal will be tested through the development of the
Opotiki to Bay View Programme Business Case referred to
below.
6
An alliance between several consultancies and NZTA, formed to deliver a
programme of road and roadside safety improvements on state highways
over 6 years.
14Road intersection, while not completed yet, is likely to reduce » INCREASED PERSONAL TRAVEL
delays in this location.” From the early 2000s to 2014, the distance travelled by However, the recent increase in personal travel in the Bay
The Transport Agency nationally looks to improving efficiency light vehicle traffic in the Hawke’s Bay region had been also offers a challenge in view of our goals to reduce the
of the system through the development of intelligent transport fairly static. This trend was noticed nationally and in many environmental impacts of transport. The average emissions
system packages, featuring enhanced customer information, developed countries. However, regional Vehicle Kilometres level of a new car sold in 2017 was 118.5 grams of CO2 per
variable speed limits and improved incident detection. Travelled (VKT) has increased by 10% since 2014. Recent kilometre. The increase in vehicle kilometres travelled in
However, should a further response be required, the region population estimates show that Hawke’s Bay’s population is Hawke’s Bay between 2015-16 and 2016-17 (approximately
will adopt a mode neutral approach in line with national and growing at a greater rate than previously predicted, and this 78.5 million) would have added at least 8.9 million kilograms
regional objectives for reducing the effects of transport on the will be a major contributor to the increased VKT, along with of CO2 to the atmosphere.
climate, local environment and public health. growth in freight movements. However, our population is also
The need to balance improved access for all parts of the region
Faster public transport services between cities and improved ageing at a greater rate than predicted, and eventually could
with addressing the effects of transport on the environment
commuter cycling options are key features of the Regional slow VKT growth as more residents move into retirement and
points to potential solutions such as public transport, walking
Public Transport Plan and Regional Cycling Plan respectively. consequently reduce their daily travel.
and cycling and ride-sharing. The region is keen to explore
These could contribute to managing capacity on the Public transport services will need to be responsive to this these further through the period of this RLTP.
Expressway as well as reducing carbon emissions. demographic change to ensure continued access for all
Another opportunity which could be explored to manage members of the population. This will be especially true for
growth on strategic routes is the increased use of rail for residents in smaller towns, where scheduled bus services are
freight in the region; this is discussed in the next section. often not sustainable and innovative methods such as on-
demand community van services may need to be explored.
Figure 4: Average Daily Traffic on HB Expressway at Taradale Figure 5: Annual Vehicle Kilometres Travelled on State Highways and Local Roads
30,000 1,000,000,000
25,000 800,000,000
20,000 600,000,000
15,000 400,000,000
200,000,000
10,000
5,000
8
9
0
1
2
3
4
5
6
7
/0
/0
1
/1
/1
/1
/1
/1
/1
/1
/0
07
08
10
11
12
13
14
15
16
09
Jan Feb Mar Apr May Jun Jul Aug Sep Oct Nov Dec
20
20
20
20
20
20
20
20
20
20
2013 2014 2015 2016 2017 Local Roads State Highways
7
(Napier Port Access Programme Business Case, NZTA 2015).
15
REGIONAL LAND TRANSPORT PLAN 2015 - 2025 REVIEW» FREIGHT TRANSPORT
The distance travelled by heavy vehicles has grown even increases, this effect is likely to become more apparent due However, in keeping with the concept of mode neutrality, all
more significantly than light vehicles over the same period to geographical constraints. Ahuriri has experienced a recent options must be explored if it becomes necessary to take
because of the growth in freight moving through the region. resurgence in retail, light commercial, tourism and residential further steps to maintain efficient freight access to the Port.
This is likely to continue, with freight into and out of the region activity, so growth in traffic to the Port via State Highway 50 Options such as the concept of an inland port at Whakatu
expected to increase from 20.2 million tonnes in 2012 to has the potential to cause conflict with these activities. Any with rail freight links to Napier are under early investigation.
about 30.7million tonnes by 2045.8 further development in the Ahuriri area needs to be managed In view of increases in heavy trucks on Hawke’s Bay roads,
Napier Port predicts that growth in key freight types through carefully in light of the predicted traffic growth. the region is also very supportive of any viable proposals for
the Port will increase truck movements (in and outbound) by As described earlier, the Napier Port Access Programme increased rail freight to and from the south of the region and
187% ( being 171,000 truck movements), along the critical Business Case identified a number of potential safety and would like to work closely with KiwiRail to understand what
Ahuriri access corridor, in the nine years to 2027. Their efficiency improvements to the key strategic routes to the such opportunities might be.
predictions are based on significant recent growth in apple Port and a number of these are already underway. The NZ The region is also supportive of opportunities to promote
plantings, wood harvests commencing in the Tararua/Central Transport Agency has committed to regular monitoring of the coastal shipping where feasible, to relieve pressure on the
Hawke’s Bay and Wairoa areas, and growth in other freight SH50 route to the Port to ensure that it can respond to any road network.
types. emerging issues appropriately.
The capability of the network to transport High Productivity
Changes in the strategic road network may also influence
Motor Vehicles (HPMVs) and to ensure safe and resilient
traffic patterns into and out of the port, with the Whakatu
Arterial Link (currently under construction) expected to
channel freight away from the State. Highway 2 coastal route Figure 6: Vehicle Kilometres Travelled by Heavy Vehicles on State Highways
onto the Hawke’s Bay Expressway through Ahuriri to the Port. 120,000,000
Traffic calming measures instigated along Marine Parade in
Napier will further discourage heavy traffic from the coastal 100,000,000
route.
Close monitoring of the urban sections of routes to Napier 80,000,000
Port is also required. There is the potential for conflict
between the amenity value of the Napier waterfront and 60,000,000
Ahuriri area, and the need for efficient access to the Port. As
8
9
10
1
2
3
4
5
6
7
/0
/0
/1
/1
/1
/1
/1
/1
/1
/0
07
08
10
11
12
13
14
15
16
the number of tourists visiting Napier and traffic to the Port
09
20
20
20
20
20
20
20
20
20
20
8
National Freight Demand Study , Ministry of Transport ,2014
Hawke’s Bay Region
16access to areas of primary production is also an ongoing increase over time. An increase in the use of energy efficient » 5.2.3 THE CHANGING TRANSPORT NEEDS OF HAWKE’S
issue for the region. The state highways in and out of the transport modes is needed to combat transport emissions. BAY’S POPULATION
region are currently undergoing assessment to carry HPMVs Supporting and promoting the use of rail for freight will lessen We also need to monitor and plan for demographic change
and funding will be allocated to the necessary infrastructure emissions as well as improving road safety and journey times; in the region to ensure that transport access and services
strengthening. However, Hastings District currently has 41 the proposal for reopening of the rail line to Wairoa is an are appropriate to changing needs and that our transport
bridges that are understrength and the increase in demand example of the region’s ongoing commitment to rail. system facilitates social wellbeing. Our population is aging
for HPMV capability will require bridge strengthening on Other initiatives could include business travel plans, such and already has a higher median age than New Zealand as
key access routes. Hastings District is also facing a period as successful travel plan recently instigated by the Hawke’s a whole.
of significantly higher road renewal requirements in the next Bay District Health Board (DHB). Working with Hawke’s Bay
ten to fifteen years, because of a concentrated programme Although 2017 Statistics NZ population estimates are
Regional Council, the DHB has introduced free bus trips to encouraging and show that trends may have reversed, there
of rural road sealing in the 1960s. This creates challenges hospital for all outpatients, and subsidised staff bus trips to
for the district to maintain appropriate levels of service into has been steady population decline in some of the region’s
and from work. This has reduced the number of staff arriving smaller towns over the last ten years. If this longer-term trend
rural areas. to work by car and significantly increased bus use to and from were to continue, it could result in withdrawal of further
» RESILIENCE, ENVIRONMENT AND CLIMATE CHANGE the hospital by patients and staff alike. The number of staff essential services from these areas, reducing the viability
Maintaining a resilient network in the face of more frequent cycling or carpooling to work has also increased significantly of such transport services as do exist, as well as reducing
extreme weather events caused by climate change is also a as a result of other travel plan initiatives. the ratepayer base able to pay for road maintenance,
challenge for the region. Lack of resilience in the network As described earlier, the region aims to improve bus services improvements and services.
can isolate communities and areas of primary production, between cities and continue expanding the already extensive A review of demographic and economic indicators in 2016
negatively affecting the region’s social and economic cycling network in Hawke’s Bay, including the iWay cycle shows that population growth in the Heretaunga Plains area
outcomes. The resilience of the strategic network between networks within both Napier and Hastings, and comprehensive 2009 to 2015 of 4.4%, was higher than projected in 2009,
Napier and Hastings (including SH2, SH50, SH50A) can be an cycling education aimed at getting more people riding bikes. and there has been a 24% increase in the number of people
issue if peak time disruptions occur, with sometimes lengthy Hawke’s Bay is also working to promote the uptake of electric over 65. The number of households has also grown more than
diversions required and causing significant congestion. vehicles via a regional working group of interested parties. expected and household occupancy has decreased from 2.60
However, the region’s concerns about climate change The region wishes to explore other opportunities to mitigate to 2.55. The Heretaunga Plains Urban Development Strategy
should not be limited to possible effects on the resilience of the effects of the transport system on the environment and (2017) highlights the increased demand for retirement
the network. The transport system is responsible for about will commence this work as soon as possible. Any activities villages and higher density urban housing as a result.
one-fifth of New Zealand’s climate changing greenhouse which require funding through the National Land Transport Transport implications of the aging population are likely to
emissions and without action, these are anticipated to Fund can be added to this RLTP by way of a variation. include decreased peak time commuting and increased
demand for public transport and Total Mobility services. The
17
REGIONAL LAND TRANSPORT PLAN 2015 - 2025 REVIEWcoverage and frequency of public transport in the main cities A decision was made to close the Gorge permanently and via rates, as the forests are not located within the district. The
has increased significantly over the last nine years, resulting commence investigation of an entirely new route for this Earnslaw Forests harvest forecast equates to 60 loaded trucks
in good patronage growth, and there is no unmet demand at section of State Highway 3. In March 2018, a replacement and 60 empty return trips per day across Central Hawke’s Bay
present. While an immediate response is not required, the route was selected and will run close to the western entry of roads. This is an ongoing issue of concern for Central Hawke’s
region needs to monitor and plan for this change, ensuring the closed SH3 Gorge route and cross the Ruahine Ranges Bay District.
that funding is available and services can be provided where north of the Gorge before emerging near Woodville. In addition to the travel time issues on State Highway 2
and when necessary. Resilience issues such as this in neighbouring regions can between Bay View and Wairoa, opportunities for growth
» 5.3 PROBLEM STATEMENT 2: LIMITED SHARED VIEW have a major effect on the Hawke’s Bay economy, so the in tourism in the Urewera National Park may be limited by
OF CROSS-BOUNDARY TRANSPORT ISSUES INCREASES transport system must be viewed in terms of end-to-end the fact that State Highway 38 to Lake Waikaremoana and
THE RISK OF MISALIGNED INVESTMENT AND/OR journeys, not regions. The Manawatu Gorge closure and use beyond remains unsealed. A strategic business case for
MANAGEMENT OF THE TRANSPORT SYSTEM (10%) of the alternate route via the Saddle Road is costing freight improvements to this route (between Murupara and Wairoa)
» 5.3.1 INTEGRATED PLANNING BETWEEN REGIONS companies, businesses and private motorists, additional is underway and is a further example of the need to work
vehicle operating costs and time. An efficient solution is vital. across regional boundaries to improve strategic links.
The Hawke’s Bay transport system is part of a much wider The Hawke’s Bay region has been involved in the consultation
social and economic catchment area, much of which The need for improvements to State Highway 2 north of Napier
processes leading up to the selection of the preferred solution. has encouraged Hawke’s Bay and Gisborne to work together
connects to the Port or other key transport or land use hubs.
The region needs to work closely with neighbouring regions to The Napier-Taihape road connects Hawke’s Bay with to advocate for improvement to the entire state highway route
ensure that issues are jointly managed. Rangitikei District and the central North Island, and plays an between Opotiki and Bay View, Napier. A programme business
important role in the movement of freight, as an alternative case for this route has recently been announced, and the
For example, a major slip closed the Manawatu Gorge to State Highways 5 and 3 and, increasingly, as a tourist neighbouring regional transport committees met during 2017
for 15 months in 2011-12, requiring a substantial road route. The Hawke’s Bay and Horizons regions worked closely to discuss how they would jointly contribute to this.
reconstruction. While alternate routes were in place, the together to have this route sealed in the early 2000s and now
closure cost businesses and transport operators an estimated » 5.3.2 COORDINATION WITHIN THE REGION
both support its designation as a state highway in recognition
$63,000 a day. of its strategic role. Within the region, the four district councils, the NZ Transport
After several years without further significant problems, the Agency and HBRC need to work closely together to ensure
Large forests are now being harvested in the Tararua district aligned, integrated planning and solutions to cross-boundary
Manawatu Gorge was again closed by a major slip in April (in the Manawatu-Whanganui region) and traverse Central
2017. After several weeks of closure, further slips and issues. The One Network Road Classification (ONRC) is
Hawke’s Bay roads to access the Port, effectively using the intended to ensure consistent standards across routes with
geological investigations revealed that the Gorge was highly Central Hawke’s Bay district as a land bridge. These routes will
unstable and more large slips were imminent, necessitating similar functions, and asset management plans revised under
require increased road maintenance without any contribution the ONRC will implement this.
the withdrawal of workers attempting to clear the route.
18Napier City and Hastings District have made progress in this are made, and to continue to address the poor driver choices » 5.4.1 SAFER ROADS
area with a joint application for urban cycleway funding, a that lead to crashes.
A 2014 list of the 100 most dangerous intersections in New
special fund available through the NZ Transport Agency to The Communities at Risk Register sets out the personal and Zealand contained seven crash blackspot intersections
help local authorities to improve cycling infrastructure in collective risk of being involved in a crash caused by one of in Hawke’s Bay. While improvements have now been
urban areas. The neighbouring districts are working closely a range of factors, compared with other territorial authorities. completed or are well underway on all of these, the
together to ensure a seamless and consistent network of Personal risk reflects the distance travelled and is measured focus must remain on improving roads and roadsides to
cycle facilities. This approach is further enhanced by the by the number of deaths and serious injuries per 100 million make these more forgiving when drivers make mistakes.
establishment of a regional cycling governance group and a vehicle kilometres travelled9. Figure 7 Personal Risk to Road This work will be undertaken by all road controlling authorities
plan to enhance the cycling network across all Hawke’s Bay Users by District sets out the factors for which Hawke’s Bay in the region, on both local roads and state highways.
in a consistent manner. district residents are at high or medium personal risk.10
Within districts, land use and transport planning needs to
be closely integrated to ensure that the transport system can
effectively anticipate and respond to growth in demand and Figure 7: Personal Risk to Road Users by District
land use changes. There are concerns in some districts that
CYCLIST INVOLVED
LOSS OF CONTROL
this has not always operated effectively in the past.
INTERSECTIONS
INTERSECTIONS
INTERSECTIONS
MOTORCYCLIST
RURAL ROADS
ALCOHOL AND
DISTRACTION
»
OLDER ROAD
PEDESTRIAN
RESTRAINTS
5.4 PROBLEM STATEMENT 3: POOR USER BEHAVIOUR DISTRICT
INVOLVED
INVOLVED
OVERALL
DRIVERS
AND TRANSPORT SYSTEM DEFICIENCIES INCREASE THE
FATIGUE
URBAN
YOUNG
DRUGS
RURAL
USERS
SPEED
RISK OF DEATHS AND SERIOUS INJURIES (30%)
ALL
The region made significant improvements to its road toll
Wairoa DC
during the 1990s and early 2000s but the rate of improvement
Hastings DC
has slowed during the last ten years. This trend is consistent
with most other parts of New Zealand. Serious injuries in road Napier CC
crashes have shown a greater rate of decline, but spikes in Central Hawke’s
serious crashes over the last three years are starting to reverse Bay DC
this trend. High personal risk
Although the region’s major blackspot intersections are now Medium personal risk
being addressed, we need to maintain focus on improvements
that make the road environment more forgiving when mistakes
9
High Personal Risk – 1 standard deviation above the mean, Medium Personal Risk – 0.5 standard deviation above the mean
10
Communities at Risk Register, NZ Transport Agency website, 2017
19
REGIONAL LAND TRANSPORT PLAN 2015 - 2025 REVIEWThe Safe Roads Alliance consists of the NZ Transport Agency »• State Highway 2 Bay View to Wairoa. Over ten years, However, there has been no improvement in speed-related
and a number of infrastructure consultancies. Its aim is to there have been 21 deaths and 56 serious injuries on this crashes or in serious crashes caused by high-risk drivers .
work with stakeholders to deliver a programme of road and route. Recommended improvements include side barriers, Although there has been improvement since 2008, recent
roadside safety improvements to the state highway network shoulder widening, wide centrelines and rumble strips spikes in crashes have been of concern and the region must
over six years. 5.4.2 IMPROVING DRIVER CHOICES continue to focus on national and local education programmes
The Alliance has identified two routes for improvement in The NZ Transport Agency’s analysis of data from the Crash aimed at improving driver behaviour.
Hawke’s Bay, for which funding has now been approved. Analysis System reveals that there has been significant
These are: improvement in some crash causes where driver behaviour or
• State Highway 2 Pakipaki to Waipukurau. Over ten years choice is implicated. Fatal and serious injuries in alcohol and
there have been 13 deaths and 62 serious injuries on this drug related crashes have declined since 2008, as has the
route. Recommended improvements include side barriers, number of 15-24 year old drivers killed or seriously injured,
moderate shoulder widening, median barriers and a as well as vehicle occupants killed and not using restraints.
realignment from College Road to Silverstream.
Figure 8: Persons Killed in Road Crashes in Hawke’s Bay
10
9
8
7
6
5
4
3
2
1
Dec - 08
May - 09
Oct - 09
Mar - 10
Aug - 10
Jan - 11
Jun - 11
Nov - 11
Apr - 12
Sep - 12
Feb - 13
Jul - 13
Dec - 13
May - 14
Oct - 14
Mar - 15
Aug - 15
Jan - 16
Jun - 16
Nov - 16
Apr - 17
Sep - 17
205
10
15
20
25
30
35
40
45
50
2
4
6
8
10
12
14
16
18
20
Mar - 08 Jun - 08
Nov - 08
Sep - 08
Apr - 09
Mar - 09 Sep - 09
Sep - 09 Feb - 10
Jul - 10
Mar - 10
Dec - 10
Sep - 10
May - 11
Mar - 11 Oct - 11
Sep - 11 Mar - 12
Aug - 12
Figure 9: Serious injuries in Road Crashes
Mar - 12
Jan - 13
Sep - 12 Jun - 13
Mar - 13 Nov - 13
Apr - 14
Sep - 13
Sep - 14
Mar - 14 Feb - 15
Sep - 14 Jul - 15
Dec - 15
Figure 11: Fatal and Serious injuries Driver Fatigue or Distraction
Mar - 15
May - 16
Sep - 15 Oct - 16
Mar - 16 Mar - 17
Mar - 17
Sep - 17
2
4
6
8
10
12
14
16
18
20
2
4
6
8
10
12
14
16
18
20
Mar - 08 Mar - 08
Sep - 08 Sep - 08
Mar - 09 Mar - 09
Sep - 09 Sep - 09
Mar - 10 Mar - 10
Sep - 10 Sep - 10
Mar - 11 Mar - 11
Sep - 11 Sep - 11
Mar - 12 Mar - 12
Sep - 12 Sep - 12
REGIONAL LAND TRANSPORT PLAN 2015 - 2025 REVIEW
Mar - 13 Mar - 13
Sep - 13 Sep - 13
Mar - 14 Mar - 14
Sep - 14
Figure 12: Fatal and Serious Injuries Speed-Related Crashes.
Sep - 14
Figure 10: Fatal and Serious Injuries in Alcohol Related Crashes
Mar - 15 Mar - 15
Sep - 15 Sep - 15
Mar - 16 Mar - 16
Mar - 17
Sep - 17
21You can also read