UC Irvine UC Irvine Previously Published Works
←
→
Page content transcription
If your browser does not render page correctly, please read the page content below

UC Irvine
UC Irvine Previously Published Works

Title
adPerf: Characterizing the Performance of Third-party Ads

Permalink
https://escholarship.org/uc/item/6km6p01p

Journal
CoRR, abs/2002.05666

Authors
Pourghassemi, Behnam
Bonecutter, Jordan
Li, Zhou
et al.

Publication Date
2020

Peer reviewed

 eScholarship.org                                 Powered by the California Digital Library
                                                                  University of California
adPerf: Characterizing the Performance of Third-party Ads
                                                    Behnam Pourghassemi, Jordan Bonecutter, Zhou Li, Aparna Chandramowlishwaran
                                                                                               University of California, Irvine
                                                                                                      Irvine, CA, USA
                                        ABSTRACT                                                                  as ad providers, syndication agencies, ad exchange traders, track-
                                        Monetizing websites and web apps through online advertising is            ers, and analytics service providers) who are part of a complex ad
                                        widespread in the web ecosystem, creating a billion-dollar market.        network on the server-side [27]. The current ad delivery method
                                        This has led to the emergence of tertiary ad providers and ad syn-        forces publishers to embed unknown third-party content (such as
                                        dication that facilitate this growing market. The online advertising      JavaScript or HTML) on their website which could jeopardize user
                                                                                                                  privacy and security. There have been several studies in recent
arXiv:2002.05666v1 [cs.CY] 6 Feb 2020

                                        ecosystem nowadays forces publishers to integrate ads from these
                                        third-party domains. On the one hand, this raises several privacy         years to locate the untrusted sources and/or malicious ad contents
                                        and security concerns that are actively studied in recent years. On       [16, 17, 22, 27, 30, 31]. Accordingly, different blocking and evasion
                                        the other hand, given the ability of today’s browsers to load dy-         policies have been devised to guard against such malware and
                                        namic web pages with complex animations and Javascript, online            aggressive tracking [17, 29].
                                        advertising has also transformed and can have a significant impact            While user privacy and security are of paramount importance,
                                        on webpage performance. The performance cost of online ads is             it is not the solitary concern of the worldwide web community.
                                        critical since it eventually impacts user satisfaction as well as their   Online advertising also has a direct impact on website performance
                                        Internet bill and device energy consumption. Unfortunately, there         (eg., page load time) and in turn user satisfaction. According to
                                        are limited literature studies on understanding the performance           Google, 53% of mobile site visitors leave a page that takes longer
                                        impacts of online advertising which we argue is as important as           than three seconds to load [15].
                                        privacy and security.
                                            In this paper, we apply an in-depth and first-of-a-kind perfor-
                                        mance evaluation of web ads. Unlike prior efforts that rely primar-
                                        ily on adblockers, we perform a fine-grained analysis on the web
                                        browser’s page loading process to demystify the performance cost
                                        of web ads. We aim to characterize the cost by every component of
                                        an ad, so the publisher, ad syndicate, and advertiser can improve
                                        the ad’s performance with detailed guidance. For this purpose, we
                                        develop an infrastructure, adPerf, for the Chrome browser that clas-
                                        sifies page loading workloads into ad-related and main-content at
                                        the granularity of browser activities (such as Javascript and Layout).
                                        Our evaluations show that online advertising entails more than 15%                (a) ebay.com in 2002               (b) ebay.com in 2020
                                        of browser page loading workload and approximately 88% of that
                                        is spent on JavaScript. We also track the sources and delivery chain      Figure 1: Evolution of ads on the web. (a) Early web ads con-
                                        of web ads and analyze performance considering the origin of the          tain text, image, and hyperlink. (b) Today’s complex and
                                        ad contents. We observe that 2 of the well-known third-party ad           dynamic web ads (rotating on top of the website) contain
                                        domains contribute to 35% of the ads performance cost and surpris-        JavaScript, animation, multimedia, and iframe.
                                        ingly, top news websites implicitly include unknown third-party
                                        ads which in some cases build up to more than 37% of the ads                 Web ads have become more diverse and complex keeping up
                                        performance cost.                                                         with the pace of advances in web design. Figure 1 compares adver-
                                                                                                                  tising on ebay.com in 2002 and 2020. As we can observe, in the
                                        KEYWORDS                                                                  past, ads only included hypertext and images. However, today’s
                                        Third-party online ads, page load time, fine-grained performance          online ads comprise of JavaScript, iframe, animation, multimedia,
                                        analysis, Chrome browser                                                  etc. Therefore, evaluating and displaying these dynamic ad contents
                                                                                                                  demand increased computation from the browser. Coupling this
                                                                                                                  observation with recent studies [32, 35, 37] that show that most of
                                        1   INTRODUCTION                                                          the page load time is spent on computation activities in modern
                                        Online advertising has proliferated in the last decade to the ex-         browsers raises several intriguing questions. For instance, (a) how
                                        tent where it is now an integral part of the web ecosystem. Today,        much do ads increase the browser’s page rendering workload? and
                                        publishers display one or multiple advertisements (or ads) through        (b) what type of ad contents contribute more to the performance of
                                        pop-ups, banners, click-throughs, iframes, widgets, etc, to monetize      the website? The performance overhead of loading intrusive ads
                                        their websites and web apps. The majority of these ads neither            become even more important since it also has an impact on the
                                        come from the publisher (website) nor a specific domain. They are         energy consumption of the device and the user’s Internet bill. There-
                                        delivered through a chain of third-party content providers (such          fore, understanding how much ads contribute to the breakdown of
different activities in modern browsers can inform the design of                     image and JavaScript code), and we address this through a
efficient ads and/or optimizations targeting those specific activities.              carefully designed resource mapper.
Unfortunately, only a handful of studies [24, 26, 36] have been de-                • Using adPerf, we perform an in-depth and comprehensive
voted to the performance analysis of ads, yet many such important                    evaluation to demystify and locate the performance cost of
open questions remain to be answered.                                                web ads. We crawl and analyze over 500 websites from differ-
    Previous studies revolving around the performance analysis of                    ent categories. Our large-scale examination leads to several
ads lack a comprehensive examination for at least the following                      first-of-a-kind findings that shed light on the performance
reasons. First, the majority of them concentrate on the network                      cost of ads, giving website builders and web ad providers
data traffic overhead, neglecting the performance cost of browser                    deeper understanding to mitigate the performance penalty
computation activities such as rendering activities [24, 36]. Second,                of ads. For example, our results show that on average 15%
prior efforts fundamentally share the same approach for quantify-                    of browser page loading activities are spent on ad-related
ing the performance of ads. They use ad-blockers to block websites’                  content for Alexa top 350 news websites.
ad contents and assess the performance overhead via comparison                     • To perform a detailed source-to-target analysis of web ads,
with vanilla run (no ad-blocking). This approach, however, is prone                  we construct the dependency graph for the website’s re-
to inaccuracy as it does not take into account the intrinsic over-                   sources and track the delivery chain involved in third-party
head of the ad-blocker. Our measurement over 350 websites shows                      ads. The results show that googletagservices.com and
Adblock Plus [2], the most popular and optimized ad-blocker today,                   doubleclick.net, two reputable ad domains, contribute
adds 32% overhead (median) to the page loading due to exhaustive                     35% of the ad resources resulting in the largest performance
filter rule matching even though it ultimately reduces page load                     cost of online advertising. Moreover, we characterize the
time by aggressive content blocking. Furthermore, ad-blockers are                    trustworthiness and prevalence of third-party ad domains
known to lead to site breakage and undesired app functionality, par-                 and distinguish the performance overhead of such domains
ticularly, with the prevalence of anti-ad-blockers [26, 28]. Finally,                on the web ecosystem. Almost half of the highly-visited web-
the aforementioned approach suffers from an inability to conduct                     sites implicitly trust uncommon third-party ad domains and
comprehensive and fined-grained performance analysis. This is be-                    our results show that about 37% of ads performance cost is
cause ad-blockers block ad-related content as early as the initiation                related to untrusted ad domains.
of network requests. Thus, subsequent ad-related activities such                   • We will release the source code of adPerf and the detailed
as content parsing and rendering and descendent resource loading                     measurement results of each website 1 .
remain invisible for inspection.                                                 The rest of the paper is structured as follows. We discuss related
    In this paper, we extensively investigate the performance over-           work in section 2 followed by essential background in section 3. Our
head of all types of ad-related content by crawling over 500 web-             methodology to characterize performance and detailed description
sites. Unlike previous efforts, we take a novel approach based on             of the design and implementation of adPerf is presented in section
in-browser profiling that does not rely on ad-blockers. Our pro-              4. We discuss the experimental setup in section 5 and present our
posed methodology enables the browser to automatically fetch and              results along with a discussion of several findings in section 6. The
evaluate ads’ performance at scale. It correlates the browser’s com-          summary of this paper along with key takeaways are presented in
putation and network activities to the associated ad contents and             section 7.
quantifies the added cost of loading ads. We break down the perfor-
mance overhead to individual requests and content types through a             2        RELATED WORK
novel resource mapping technique. This procedure contrives a more
                                                                              Online advertising (essentially display ads on websites) has been
robust and detailed performance analysis. Moreover, we demystify
                                                                              rapidly growing in the last decade, generating a multi-billion dol-
and track down ad components on the publisher and characterize
                                                                              lar market [21, 23]. In the past few years, the focus of academic
the performance overhead considering the origin of ads and how
                                                                              research has been primarily centered on detecting malicious ad
they are delivered to the publisher. To the best of our knowledge,
                                                                              contents (malware and aggressive tracking) [16, 17, 22, 27, 30, 31]
this is the first time such an experiment has been conducted.
                                                                              and blocking them [29, 39, 40]. While user privacy and security are
    Contributions and Findings. To summarize, this paper makes
                                                                              of paramount importance, even ads that are safe and not tracking
the following contributions.
                                                                              users can have significant performance impact which in turn causes
                                                                              cascading effects on user satisfaction and Internet costs.
    • We employ a different yet more appropriate methodology to               2.1         Performance analysis of ads
      characterize the performance overhead of ads. Our method
      avoids using ad-blockers, providing higher accuracy and ca-             In a 2015 study, the New York Times analyzed the top 50 news
      pability for fine-grained measurements while suppressing                websites landing page containing both advertising and editorial
      site breakages and app failures observed in prior studies.              content and found that more than half of all data came from ads 2 .
      We implement an infrastructure called adPerf based on our               For instance, Boston.com’s mobile website ads took 31 seconds to
      proposed approach for the Chrome browser since it the most              load on a typical 4G connection while the editorial content only
      commonly used browser by desktop and mobile users. The                  took 8 seconds. This is equivalent to 32 cents of cell data in ads
      key challenge we encountered is how to align the perfor-                1 will   be available at https://gitlab.com/adPerf/adPerf
      mance cost with individual components within an ad (e.g.,               2 https://www.nytimes.com/interactive/2015/10/01/business/cost-of-mobile-ads.html

                                                                          2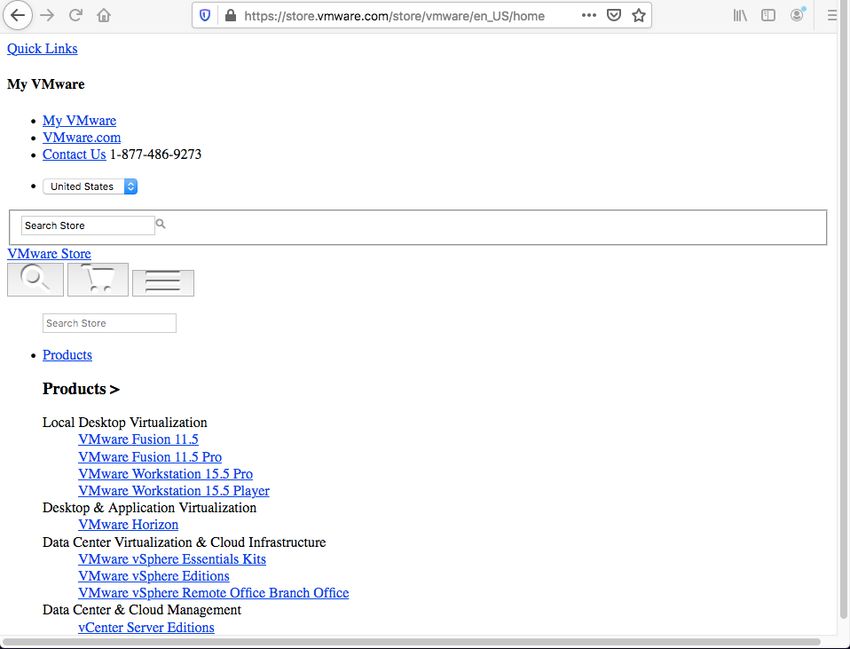
every time the landing page is loaded. However, this impact of                             the visibility of ads to DEAL (Detect, Explain, Ask, Limit) with
online advertising on webpage performance (i.e., page load time) is                        ad-blockers [33]. Typically, when the publisher detects a hidden or
still not well studied.                                                                    removed ad, it stops loading the website by displaying a popup that
    The few notable efforts similar to the New York Times study,                           asks the visitor to turn off the ad-blocker. Figure 3 shows a snapshot
rely on adblockers to measure the performance impact of ads. Pu-                           of the content-blocking of www.forbes.com when ad-blocker is on.
jol et al [36] crawled the Alexa top 1k sites and find that 18% of
total traffic in a residential broadband network was due to ads.
However, this does not account for the actual performance of the
adblockers themselves. Ikram et al [26] analyzed 97 ad-blocking
apps on Android and reported that 7% of user complaints relate
to crashes and performance-related aspects such as battery-life
overhead. Garimella et al. [24] analyze the performance of several
popular ad-blockers such as Adblock Plus, Ghostery, uBlock, etc.
They conclude that in some cases the time to load pages is not
faster when using adblockers since they contribute to additional
overhead due to various tracking services of their own.
    The key distinction between this paper and prior efforts is that
we do not rely on ad-blockers for performance analysis of ads for
three main reasons.
    Overhead. Similar to the above studies, our results show that ad-
blockers themselves can have significant performance overhead due
to exhaustive filter-list matching and tracking services. We analyzed
Adblock Plus by creating a modified version that still performs all                        Figure 3: Snapshot of www.forbes.com. This website prevents
of the content filtering operations without actually blocking any of                       loading contents if visitors attempt to block ads.
the content. We calculate the overhead imposed by these filtering
operations by measuring the difference in page load times from the                             Content-blocking can lead to site breakage and also other unde-
modified version of Adblock Plus to Vanilla Chromium. Figure 2                             sired app functionality [28]. This breakage can range from a dys-
shows the overhead of Adblock Plus on 350 webpages. According to                           functionality in part of the website (e.g. not displaying login popup)
the figure, for half of the websites, Adblock Plus adds more than 32%                      to the breakdown of the entire website layout. Figure 4 shows a
overhead to the page loading due to excessive and CPU-intensive                            snapshot of www.store.vmware.com when Mozilla’s ad and track-
filter rule matching. However, it ultimately reduces page load time                        ing protection is turned on. Furthermore, a large number of websites
by aggressive content blocking.                                                            employ ad-blocking circumvention to evade from adblocking. For
                                                                                           instance, www.thoughtcatalog.com and www.cnet.com obfuscate
                                                                                           advertising URLs when they detect that the ad-blocker is on. As a re-
                                      CDF of % Overhead for AdBlockers                     sult, the resources are translated to the local servers and eventually
                          1.0                                                              displayed on the page. In all of the above instances, performance
                          0.9                                                              analysis of ads cannot be achieved through adblocking which limits
                                                                                           its scope.
                          0.8
                          0.7
   Fraction of Websites

                          0.6
                          0.5
                          0.4
                          0.3
                          0.2
                          0.1
                                                             With Modified Adblocker
                          0.0
                                0   20 40 60 80 100 120 140 160 180 200 220
                                         % Overhead for Page Load Time                          (a) before content blocking         (b) after content blocking

Figure 2: CDF distribution of AdblockPlus overhead on the                                  Figure 4: Snapshots of www.store.vmware.com. The layout of
page loading of 350 webpages.                                                              the page is broken due to content blocking.

   Functionality. As ad-blockers become a threat to the "free" web                            Fine-grained analysis. Ad-blockers block content as early as
business model, many websites prevent displaying their content to                          the initiation of network requests, which results in two drawbacks.
the visitors that use ad-blockers. In this case, the publisher includes                    First, it prevents fine-grained performance analysis at the browser
a script such as IAB ad block detection script [1] that monitors                           level. Second, because the content is blocked at the network request,
                                                                                       3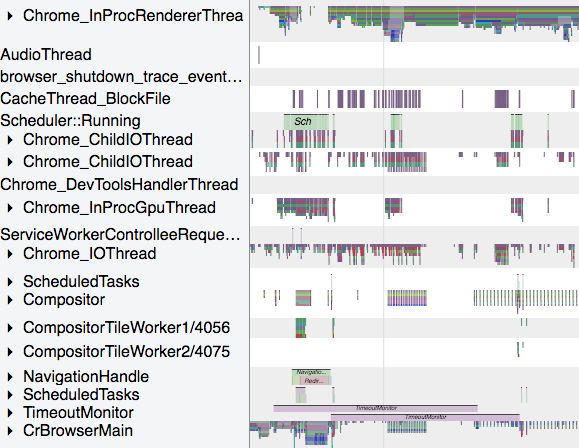
resources that are further requested by the blocked document dur-
                                                                                                                 Layout              Composite       Paint
ing page loading become invisible for inspection. Furthermore, the
current body of works focuses on the network data traffic overhead,
neglecting the in-browser computation overhead of ads.                            DOM                 Render                Layout           Layer
                                                                                                                                                             Display
                                                                                  Tree                 Tree                  Tree            Tree
   Our approach addresses the above limitations and enables an
in-depth performance analysis of ads without adding significant
overhead or causing site breakage. As a result, ad-related activities             HTML                          Scripting
                                                                                            Styling
                                                                                 Parsing
such as content parsing, rendering, and loading of descendant re-
sources are now visible for analysis. We present our findings from
                                                                                 HTML       CSS                JavaScript
fine-grained performance characterization in Section 6.

2.2    Performance analysis of browsers                                                    Resource Loader

Another notable line of research concerns the performance analysis
of browsers given its complexity, large codebase, and multi-process          Figure 5: High-level architecture of the web browser. The
execution. The majority of browser vendors have an integrated                components include the resource loader (purple), six major
profiler. Examples include the Chrome profiler [11] for Google               computation stages (green), and the intermediate trees (yel-
Chrome and Gecko profiler [8] for Mozilla Firefox, which provides            low) in the page loading pipeline.
statistics about task timing, call graph, memory usage, and net-
work activities. There have also been several efforts on critical path
analysis [25, 34, 37, 38]. Wprof extracts the dependency graph and           Each of these stages might contain multiple sub-tasks or simply
breaks down the activities based on type (computation and network            referred to as activities. For example, HTML parsing consists of
activities) [34, 37]. Coz+ [35] generates quantitative what-if graphs        byte stream decoding and preprocessing, tokenizing, and DOM tree
about the dynamic behavior of the critical path, based on the idea of        construction activities.
causal profiling [20]. By analyzing Alexa top webpages, the above               The computation activities are frequently invoked by the browser
studies conclude that computation activities contribute more to the          during page loading. Figure 6 illustrates a snapshot of browser ac-
page loading time than network activities.                                   tivities when loading www.apple.com. As we can observe, there
   Our approach to performance analysis is similar in spirit to the          are numerous instances of such activities during page load. The
above studies. However, prior efforts did not distinguish between            order in which these activities are executed is based on the de-
the time spent in the different browser stages/activities based on           pendency imposed by the page content. For instance, if JavaScript
the resource (ads vs main content). Since we are mainly interested           modifies an attribute of a DOM element, this forces the browser to
in analyzing the performance of ads, we address this challenge of            recalculate the style, update layouts, composite layers, and repaint
distinguishing resources by type and mapping browser activities to           the screen. This is commonly known as reflow which can have a
resource type for fine-grained performance analysis in this paper.           significant impact on performance. However, if the JavaScript only
                                                                             modifies the color of a DOM node, the reflow pipeline bypasses
3     BROWSER ARCHITECTURE                                                   layout and if the change does not modify the graphical layers, the
                                                                             reflow also bypasses compositing. On top of that, browsers exploit
Our performance characterization is based on distinguishing be-
                                                                             parallelization between independent activities to accelerate page
tween the amount of work the browser spends on loading the
                                                                             load time as shown in the figure. Due to the dependency between
primary or main content of the page and the extra work on loading
                                                                             activities, dynamic parallelization, and stochastic behavior of the
ad contents. Discriminating between these two workloads (main
                                                                             browser in resource downloading and dispatching tasks, the time of
vs ad content) requires an understanding of the way browsers load
                                                                             each activity is indeterminate. Therefore, tracking the dependency
webpages. Here we outline the browser’s high-level design and
                                                                             chain between browser activities and attributing activities to the
workflow.
                                                                             corresponding workload type, i.e. ads or non-ads, are challenging
   Modern browsers have different features and user interfaces but
                                                                             tasks.
they essentially employ the same architecture to load webpages.
Figure 5 shows the browser’s high-level page loading workflow.
The process begins when the user submits a URL request to the
                                                                             4   METHODOLOGY AND adPerf
browser interface. The resource loader is responsible for initiating             INFRASTRUCTURE
HTTP requests and fetching resources (network activities) from               To distinguish between the performance cost of web ads from the
the server. Once the resource is downloaded (incrementally or                main content (non-ads), we apply a systematic approach as follows.
fully), the six major computation stages (shown by green color               First, we extract all browser activities that are associated with the
in the figure) evaluate the resources and render the website. The            page loading process. Second, we identify which resource, i.e. a web
computation stages are HTML parsing (building DOM), Styling                  document, explicitly or implicitly initiates each browser activity.
(evaluating stylesheets and adding attributes to DOM tree), Scripting        Third, we classify activities into ads and main content considering
(responding to user interactions and dynamic behavior of the page),          the type of the resource corresponding to each activity. Finally, we
Layout (evaluating size and position of DOM elements), Composite             measure the total execution time spent on each class of activity as
(combining graphical layers), and Paint (mapping layers to pixels).          a performance index distinguishing the workload in each class.
                                                                         4
HTTP request. This information will be used later for resource
matching.
crawler
Zbrowse
MessageLoop::RunTask MessageLoop::RunTask
TaskQueueManager::DoWork TaskQueueManager::DoWork
Chrome remote
TaskQueueManager::ProcessTaskFromWorkQueue TaskQueueManager::ProcessTaskFromWorkQue
protocol API
ParseHTML ResourceMsg_RequestComplete
HTMLDocumentParser::processTokenizedChunkF WebURLLoaderImpl::Context::OnCompletedR
HTMLParserScriptRunner::execute ParseAuthorStyleSheet
LocalWindowProxy::initialize CSSParserImpl::parseStyleSheet
V8.NewContext parseStyleSheet.tokenize parseSty Chrome browser
resources
{"pid":54, ts":81407054,"ph":"X",tts":119412,
child-parent "dur":839, "cat":"devtools.timeline",
"name":"EvaluateScript", "args": {"data":{
Figure 6: Snapshot of the browser activities in loading information "url":"https://www.abc/lid.js",
"lineNumber":1, "columnNumber":1,
"frame":"EFF8B95C2"}}}
{"pid":54, ts":81419234,"ph":"X",tts":1412,
www.apple.com. "dur":537, "cat":”ipc”}}}
Chrome traces
network
To realize the above methodology, we implement an infrastruc- graph parser requests
ture, named adPerf, for the Chrome browser. Note that adPerf can builder
pruning
be extended to other browsers as well since the same technique
applies to all browser architectures. Figure 7 shows the design of data extraction
adPerf. Below, we describe each module in detail.
4.1 Crawler resource mapper
The first module in adPerf (top of the figure) is a crawler (Node.js
script) that is responsible for setting up the headless Chrome and classification
crawling websites. The crawler uses the Chrome remote protocol Resource
construct
dependency graph
APIs [6] under the hood to interact with the browser and streams call stack
Chrome traces [11] to the file. Chrome traces are primarily used
assign resource
for profiling and debugging the Chrome browser, so they are de-
filter list & rule matching
signed to be low-overhead. Tracing macros cost a few thousand
clocks at most [11] and the logging to file happens after the page
is loaded. Chrome traces are capable of recording intermediate non-ad ad related
browser computing activities including page loading activities in activities activities
the Blink rendering engine and V8 JavaScript engine with microsec-
ond precision. Each trace contains some information about the
Figure 7: Structure of adPerf. AdPerf contains crawler,
associated activity such as thread id and function arguments. Below
parser, resource mapper, and graph builder modules that are
is an example trace for one Scripting activity:
shown with dark boxes.
1 {" pid " : 5 4 ,
2 " tid " : 3 5 ,
3 " ts " : 8 1 4 0 7 0 5 4, 4.2 Parser
4 " ph " : " X " , When the website is loaded, the raw Chrome traces are fed to the
5 " tts " : 1 1 9 4 1 2 , parser as shown in the figure. The adPerf parser does two major
6 " dur " : 8 3 9 , tasks.
7 " cat " : " devtools . timeline ", Pruning. It goes through the traces and extracts all page loading
8 " name " : " EvaluateScript ", activities and prunes the browser-dependent ones (such as browser
9 " args " : { " data ":{ garbage collection and inter-process communication activities).
10 " url " : " https : // www . google - analytics . Essentially the collected activities are affiliated with one of the six
com / linkid . js ", browser stages shown in Figure 5. For instance, the parser considers
11 " lineNumber ":1, every trace connected to script evaluation, V8 script compiling,
12 " columnNumber ":1, V8 execution, callback functions triggered by browser events or
13 " frame ":" EFF 8B95C2"}}} timeout among others as part of the Scripting stage.
Data extraction. For each activity, the parser extracts the fol-
Additionally, the crawler intercepts network requests, i.e. lowing data: start time, end time, relative stage, thread and process
onBeforeRequest event, and extracts the header and body of every id, and function arguments if they contain resource information.
5This data is necessary to construct the call stack and attribute ac- resource file data in their traces. However, a small number of activ-
tivities to resources. ities do not contain any resource information. For activities with
unresolved resource files (activities shown with an orange color
4.3 Resource mapper and dotted texture in the figure), the resource mapper uses the con-
Once the traces are parsed and categorized, this data along with pre- structed call stack and follows their ancestors and associates them
viously obtained network information is fed to the resource mapper with the caller’s resource file. For example, appendChild JavaScript
module. The task of the resource mapper is to assign each activity function is called by updateList and this function along with Com-
to an associated resource. Unfortunately, we observed that a sig- pile Script activity are invoked by Evaluate Script activity that is
nificant number of traces do not contain any resource information. previously assigned to a JavaScript document.
Therefore, a key challenge for the resource mapper is to extract Tree manipulation and rendering. For this group, we have to
this relation. distinguish between the different resources that implicitly trigger
To address this challenge, the resource mapper first builds a call the activities that belong to this group. For styling activities, we
stack of activities for every thread by tracking the start time and end observe that Chrome recalculates styles after the Schedule Style
time of activities executed by each thread. Figure 8 demonstrates Recalculation event is fired. As seen from Figure 8, this event is
an example activity call stack timeline for a browser thread where fired in the middle of parsing and evaluation of a resource (typically
activities are shown with boxes. JavaScript document) that attempts to modify the DOM node style.
We track the call stack for this event to the initiated parsing and
evaluation activity and relate this styling activity to the triggered
time
document. Similarly, for layout, Chrome updates layout tree when
Composite
HTML Parsing Event: DOMContentLoaded Timer Fired Paint Layout Invalidate event is fired. In our example, this is fired when
Layers
Callback
the command this._util.elem.innerHTML=e is executed in the Insert-
Evaluate Script Callback Function
thread call stack
Function Before() function. We use a similar procedure as styling to relate
Compile layout activities to the initiating resource from the call stack of the
updateList() getAttribute() makeRequest() getScroll()
Script Layout Invalidate event.
Recalculate Note that the browser does not necessarily update the style
appendChild() InsertBefore() Layout
Style
and layout of nodes immediately after the events are triggered.
Depending on the priority of other activities in the task scheduler
Schedule Style Recalculation Layout Invalidate
queue, the browser might dispatch these activities later. As a result,
when a resource triggers one of these two events (Schedule Style
Figure 8: Call stack timeline for a Chrome thread con- Recalculation or Layout Invalidate), a second resource may fire one
structed by adPerf resource mapper. Resource mapper as- of these two events again before the browser updates the tree. In
signs resource to each activity using information in the this case, we consider the first resource as the initiator since the
traces (orange activities with solid texture) and call stack (or- tree will be traversed and updated even in the absence of the second
ange activities with dotted texture) for parsing and evalua- resource. Chrome tends to composite and/or paint immediately after
tion activities and tracks initiator for tree manipulation and styling or layout which leads to repaint. Therefore, the associated
rendering activities (purple activities). resource for the composite and paint activities simply derives by
following the chain to the last executed styling or layout activity
as shown by the red arrows in the figure.
After constructing call stacks, the resource mapper classifies Once page loading activities have been assigned to the resources,
activities into two groups – parsing and evaluation and tree manip- adPerf uses network data from the crawler to link the resources
ulation and rendering. The former contains activities that explic- to the associated network requests (i.e. URLs). Then it uses a filter
itly relate to a resource such as HTML parsing, image decoding, list to distinguish between ad resources and non-ad resources. We
stylesheet parsing, and JavaScript evaluation which directly operate use EasyList [7], the primary and most popular filter rules list
on a document. Activities belonging to this group are colored or- for advertisements, for our experiments. However, users can also
ange in the figure. The latter contains activities that implicitly relate provide their own custom filter rules. adPerf employs adblockparser
to a resource. These include activities in styling (except stylesheet (an optimized python package [3]) to match the URLs against filter
parsing which belong to the former group), layout, composite, and rules. One might think that since our methodology uses an identical
paint stages that deal with the browser’s intermediate data struc- rule matching procedure to ad-blockers, it might incur a similar
tures (trees) and display. Purple activities in the example belong to overhead. This is however not the case since that rule matching in
this group. Finally, the resource mapper finds the corresponding adPerf is passive and does not steal computation cycles from the
resource for each activity group as follows. page loading process. Finally, adPerf reports the execution time of
Parsing and evaluation. For the majority of the activities in the page loading activities categorized by ads and non-ads.
this group, the resource mapper extracts the resource file infor-
mation from function parameters extracted by the parser. Orange
activities with solid texture such as HTML Parsing and Callback 4.4 Graph builder
Function in Figure 8 are examples of activities that the document on There exist dependencies between resources on the website. For
which they parse or evaluate can be determined from frame id and instance, let’s say a website downloads a JavaScript file from a
6third-party domain. In this file, it can further request an image Network. The system is connected to the WiFi with a 400 Mbps net-
or an HTML document from another domain and this chain can work connection. To obtain accurate result about communication
go deeper. To evaluate the performance cost of different sources overhead, we do not set up any proxy and/or local server.
such as ad domains and to further evaluate their trustworthiness Test corpus. Our test corpus consists of two sets of web pages – (a)
(Section 6) requires first tracing this resource dependency chain top 350 websites from Alexa top500 news list [4] and (b) top 200
and building a resource dependency graph. websites from Alexa top500 list [5]. We will refer to these two web
We extract the dependency between resources of the websites us- page datasets as news and general respectively. For each dataset,
ing Zbrowse [14]. Zbrowse exploits Chrome devTools protocol that we crawl the corresponding corpus twice. The first time, we crawl
allows us to instrument, inspect, and debug the Chrome browser. It the home page or landing page of the website. The second time,
also generates the child-parent relation for every network request. we randomly click a link on the home page and crawl the page
We embed Zbrowse in the adPerf crawler module as shown in Fig- that it leads to. We exploit Chrome Popeteer [10] to automate link
ure 7. This way, we can extract the resources child-parent data at clicking. In our experiments, the former is referred to as the landing
the same time when we crawl the websites. The graph builder mod- page crawl and the latter is referred to as the post-click page crawl.
ule uses Zbrowse’s output and constructs the dependency graph for Experimental repeat. In each crawl over the corpus (total 4 crawls),
resources. In cases where third-party JavaScript gets loaded into a we load websites at least 3 times to account for fluctuations in page
first-party context and makes an AJAX request, the HTTP referrer loading.
appears to be the first-party. We follow [27] and allow the graph Evaluation domain. Since the main goal is to characterize the
builder to conserve this relation and include the URL of the third- performance cost of ads, we primarily provide evaluation results
party from which the JavaScript was loaded. Since one resource for the websites that contain ads. This is about 80% of news websites
can, in turn, request multiple resources, the constructed graph has and 40% of top general websites.
the shape of a tree rather than simple chains of dependencies.
6 RESULTS AND DISCUSSION
In this section, we analyze the performance cost of ads both at
the level of the ad domains (close to the origin) and deeper in the
browser (close to the metal). First, we analyze the performance
cost of ads on the websites using adPerf broken down by costs in-
curred by the computation (i.e. rendering engine) and network (i.e.
amazon- imrworldwide
resource loader). Then, we investigate a level deeper to further un-
facebook.com usabilla.com onetrust.com
adsystem.com .com derstand which computation stages and which network resources
contribute more to the computation and network ad costs respec-
tively. Finally, we zoom out and analyze the ad domains themselves
to demystify their contribution to the performance cost of web ads.
facebook.com doubleclick.com tidaltv.com googlesyndica domex.com
tion.com
6.1 Computation cost of ads
For every website, we calculate the fraction of time spent in ad-
related activities to the total activities (ad + non-ad). Figure 10 shows
Figure 9: Resource-dependency graph for www.cnn.com. Ad the CDF distribution of this fraction for the 4 different crawls.
nodes are colored red and non-ad nodes are colored blue. Finding 1. According to the figure, web ads have a significant
impact on the performance of the website. For example, half of the
Figure 9 shows this graph for an example website, www.cnn.com. news websites spend more than 15% of their computing workload
Here, we combine the resources from the same domain (at each on ads. Interestingly, 20% of them take more than 30% of the time on
level) into one node for easier visualization. The root node is the advertising which can be concerning from the user’s perspective. It
publisher and the remaining nodes are referred to as third-party do- also motivates website builders and ad providers to optimize their
mains. For differentiation, we color ad nodes (domains that deliver advert contents. Compared to the news sites, ads have a lower cost
at least one ad resource) red and non-ad nodes (domains without on the general corpus. The median in this corpus is 5%.
any ad resources) blue in this graph. As we can see from the figure, Finding 2. The figure presents another interesting detail when
a considerable number of third-party domains are ad nodes. This is we compare the landing and post-click page graphs. Ads have a
a concerning finding since typically publishers are not aware of the higher performance cost when loading the landing page versus the
contents delivered by third-party websites. Generally, publishers post-click page of news websites by about 25% on average. However,
trust the first-party domains (in the first-level of tree) but those this is not the case for general websites. Post-click pages of popular
websites might deliver their contents from another website or chain general websites have almost similar cost-performant ads as the
of websites that are not verified by the publishers. landing page. Further, we aggregate the total time spent on ad-
activities across all browser stages and compare that to the total
5 EXPERIMENTAL SETUP time spent on the main content. The average percentage of time
System. The experiments are conducted on a MacBook Pro with 2 spent on ads versus main content for the news landing page, news
cores and 8 GB RAM. post-click, general landing page, and general post-click datasets
7spent in computation across all the browser stages. Similarity, ctad
Ads Computation Cost (CDF) is the computation time spent on ad-activities while ct ∗ is the total
1.0 time spent on all activities. Therefore, ct ∗∗ is the total time of all
0.9 computation activities in the browser.
0.8 (1) The fraction of time spent on ad-activities in stage s to the
0.7 s /ct s ]. This
Fraction of Websites
total time spent on all activities in stage s [ctad ∗
0.6 is shown by the green bars. This is an intra-stage metric
0.5 depicting how the stage workload is split between ads and
0.4 the main content.
0.3
(2) The fraction of time spent on ad-activities in stage s to the
s /ct ∗ ].
total time spent on ad-activities across all stages [ctad
News (landing)
0.2 News (post-click)
ad
This is shown by the blue bars. This is an inter-stage metric
0.1 General (landing)
General (post-click) showing how much one stage deals with ads compared to
0.0 the other stages.
0.0 0.1 0.2 0.3 0.4 0.5 0.6 0.7 0.8 0.9 1.0
Computation Cost Ratio of Ads (3) The fraction of time spent on all activities in stage s to the
total page load computation time or total workload [ct ∗s /ct ∗∗ ].
Figure 10: Computation cost of ads in two datasets namely This is shown by the red bars. This is another inter-stage
top general and top news websites. Each domain in the metric but unlike the second metric, it shows the influence
dataset is crawled twice (landing page and post-click page). of a particular stage, s on the entire page load.
It is important to correlate both the inter-stage metrics to have
is 17, 15, 11, and 10% respectively. The averages are higher than a complete analysis. For example, if a stage shows a considerable
the median percentages reported earlier because a small number of contribution to ads (i.e. second metric) but has very little impact
websites spend 40-50% of the computation time on ad-activities. on page loading (i.e. third metric), that stage likely has a moderate
impact on the performance optimization of ads.
Finding 3. As we can observe from Figure 11, scripting has the
Contribution of stages in performance cost of ads
1.0 highest impact, more than 88%, on the computation cost of ads. In-
Stage ad-workload to stage workload
0.9 Stage ad-workload to total ad-workload cidentally, it also has a significant impact (73%) on the computation
Stage workload to total worklaod workload of the entire page load. The difference between these two
0.8
metrics indicates that ads are more scripting heavy than the total
0.7
workload. This is because ad-content shows 21% more dynamic
0.6 characteristics than the original page content in our news corpus
Ratio
0.5 which increases the time spent in the scripting stage. At the same
0.4 time, this stage only spends 25% of its time on ad-related content
0.3 (i.e. first metric) which is an interesting observation since it reveals
0.2
that ads are not the primary bottleneck of the scripting stage but
improving this stage will considerably improve the performance of
0.1
ads as scripting is the major workload of today’s web ads on news
0.0 sites.
ing ptin
g sing out Pain
t ite
Styl Scri Par Lay pos
HTM
L Com Finding 4. Another observation from Figure 11 is that HTML
parsing has a minor influence on page loading, i.e less than 5% in
comparison with scripting but ads have more impact on this stage
Figure 11: Contribution of the different browser stages to the (comparing green bars). In other words, optimizing ads HTML
performance cost of ads for the news landing corpus. The code is expected to improve HTML parsing workload more than
three bars for each stage correspond to the three ratio met- optimizing ads JavaScripts for the scripting stage, even though
s /ct s , ct s /ct ∗ , and ct s /ct ∗ from left to right).
rics (ctad HTML optimizations can only marginally improve page load time.
∗ ad ad ∗ ∗
This underscores the importance of correlating the intra- and inter-
Breakdown of ad computation cost. Since we observe that ads stage metrics to accurately guide optimization efforts. We observe
can have a significant impact on website loading, it is worthwhile similar behavior for the general corpus as well.
to explore where this overhead comes from. This will enable web-
site builders and ad providers to focus their optimization efforts 6.2 Network cost of ads
on those activities that are the primary sources of performance Beside computation activities, loading ads imposes overhead on the
loss. Accordingly, we classify the computation cost of ads by the network activities. To measure the performance cost of ads over the
granularity of the browser stages (outlined in Section 3). Figure 11 network, for each website, we calculate the ratio of time spent on
shows the contribution of the six major stages for the news corpus. fetching ad-related resources to the total time spent on fetching all
For each stage, s, we measure the following three metrics. Note that the requested resources. Figure 12 shows the CDF of this network
ct s is the computation time of stage s while ct ∗ is the total time cost ratio for the 4 crawls.
8(3) The fraction of the network time spent on resources
Ads Network Cost (CDF) of content type, c to the total network time spent on all
1.0 resources [nt ∗c /nt ∗∗ ] to highlight the performance impact
0.9 of content type, c
0.8
0.7 For instance, the first metric for network time for CSS refers to
Fraction of Websites
0.6 the fraction of time spent on fetching ad-related CSS resources to
the time spent on fetching all CSS resources [ntad css /nt css ].
0.5 ∗
Finding 6. Among all content types, Table 1 shows that XML has
0.4
the largest percentage of ad resources for both landing (54% which
0.3 take up 68% of the network time in fetching this type of resources
News (landing)
0.2 News (post-click) from metric 1) and post-click pages (46% which take up 43% of the
0.1 General (landing) network time). However, it contributes to an insignificant fraction
General (post-click)
0.0 of the network performance cost for both pages (metric 2). On the
0.0 0.1 0.2 0.3 0.4 0.5 0.6 0.7 0.8 0.9 1.0 contrary, scripts and images are commonly used by ad providers.
Network Cost Ratio of Ads
These two types of resources alone makeup nearly 80% of all ad
resources (metric 2) and all resources (metric 3) for both landing and
Figure 12: Network performance cost of ads over websites
post-click pages. However, comparing metrics 2 and 3 for scripts and
in two corpus’s: top general and news websites. Each corpus
images shows that scripts are on average over 20% more popular
contains landing and post-click landing pages.
than images for post-click pages compared to the landing page.
Script files used in advertising alone are responsible for almost
half of the network performance cost of ads, followed by images
Finding 5. The four distributions follow the same order as in at 40% for landing pages (metric 2). Since scripts are more popular
Figure 10 (computation cost of ads), i.e. news websites incur higher in post-click pages, they correspondingly also contribute more to
network performance cost than general websites. This is not sur- the network time spent in ads (57%) for these pages compared to
prising since more and/or larger ad resources also require more images (33%).
work in parsing, evaluating, and rendering. According to the figure, Finding 7. Ad-related HTML files constitute 34-36% of total
the median of the network-cost ratio is 15% for news websites’ HTML files but they only take 14-17% of download time. A deeper
landing page and 3% less on the post-click page. For the general investigation shows that ad HTML documents have a significantly
websites, the median is 6% for the landing page and post-click page small number of tags (on average 7) including only one or two
respectively. tags that encapsulate small and minified code compared
Breakdown of ad network cost. To dissect the network costs of to the main-content HTML files with 410 tags. This shows that
ads, we breakdown the network time consumption by content type HTML files used for ads are typically lighter than normal HTML
(such as HTML, image, media, etc). For each content type, Table 1 files. Surprisingly, XHR (XMLHttpRequest) resources make up a
summarizes statistics about the frequency of resources and network significant 7% of the network performance cost for the landing
time spent on fetching those resources for the news corpus for both page and 9% for post-click pages (metric 3). The corresponding time
landing and post-click pages. Given, the number of resources, nr spent on ad resources is 5% and 4% respectively (metric 2).
and network time spent on the resources, nt, we define three metrics
for each (similar to computation stages) as follows. 6.3 Breakdown of ad performance by source
• Metrics for the number of resources (nr ). The results so far breakdown the performance cost of web ads at
(1) The fraction of the number of resources of content type, the lower level of granularity. Now, we zoom out and attribute the
c to the total number of resources of c [nr ad c /nr c ] (intra
∗ performance cost of ads based on their origin, i.e. ad domains. This
resource-type metric). allows us to gain a clear picture of the third-party ad domains and
(2) The fraction of the number of ad-resources of content how they contribute to the performance cost. Accordingly, we build
type, c to the total number of ad-resources (of all content the resource-dependency graph (as described in Section 4) for all
c /nr ∗ ].
types)[nr ad ad news websites in our test corpus. Overall we identify more than
(3) The fraction of the number of resources of content type, 300 distinct ad domains.
c to the total number of resources [nr ∗c /nr ∗∗ ] to highlight Breakdown of computation performance cost by ad domains.
the popularity of the content type. For every ad domain, we first aggregate the time the rendering en-
• Metrics for the network time spent on resources (nt). gine spends on evaluating the resources that are delivered by that
(1) The fraction of the network time spent on ad-resources of domain. We also measure the total time spent on ads through the
content type, c to the total network time spent on resources crawl (ads computation cost). Then, we calculate the ratio between
c /nt c ].
of c [ntad ∗ the above two measures which is an indicator of how third-party
(2) The fraction of the network time spent on ad-resources ad domains contribute to the computation cost of ads. Finally, we
of content type, c to the total network time spent on ad- sort the ad domains by this ratio and plot the contribution of the
c /nt ∗ ].
resources (of all content types) [ntad top 10 domains (out of 300) in Figure 13. The number on top of
ad
9Table 1: Summary of the three metrics each for the number of resources and network time spent on resources across two types
of pages (landing page denoted by L and post-click page denoted by PC) for the news corpus.
Content type (c) Stats for the number of resources (nr ) Stats for the network time spent on resources (nt)
c /nr c
nr ad c /nr ∗
nr ad nr ∗c /nr ∗∗ c /nt c
ntad c /nt ∗
ntad nt ∗c /nt ∗∗
∗ ad ∗ ad
L PC L PC L PC L PC L PC L PC
Script 0.235 0.218 0.415 0.449 0.398 0.431 0.251 0.236 0.489 0.572 0.326 0.369
HTML 0.357 0.34 0.087 0.095 0.055 0.059 0.169 0.136 0.044 0.047 0.043 0.053
Image 0.228 0.221 0.371 0.352 0.367 0.332 0.13 0.117 0.392 0.325 0.505 0.425
Font 0.129 0.06 0.013 0.007 0.023 0.024 0.065 0.028 0.006 0.004 0.016 0.02
CSS 0.058 0.028 0.013 0.008 0.051 0.061 0.049 0.019 0.009 0.005 0.03 0.039
XML 0.542 0.457 0.006 0.003 0.002 0.001 0.681 0.426 0.008 0.003 0.002 0.001
XHR 0.179 0.125 0.045 0.032 0.057 0.053 0.122 0.069 0.048 0.038 0.066 0.085
Media 0.042 0.044Trust ratings
Finding 9. About 35% of the network cost of web ads on news very poor poor unsatisfactory good excellent
1.0
websites is traced to doubleclick.net followed by the popular
ad syndication googleadsyndication.com with 10% contribution. 0.9
These two domains along with other domains maintained by Google 0.8
Ratio of performance cost
constitute approximately 51% of the total ad network cost. 0.7
Finding 10. Contrasting the computation cost of domains with 0.6
their network cost shows that these two performance costs are cor-
0.5
related. This is expected since fetching more and larger documents
0.4
take a longer time to evaluate and display. Interestingly, we also ob-
serve domains that have a high computation cost but insignificant 0.3
network cost or vice versa. For instance, googletagservices.com 0.2
has the highest contribution (19.7%) to the computation cost of ads 0.1
among all 300 ad domains. However, it contributes to less than 1% 0.0
of the network cost (ranked 16 and therefore, not shown in the top 0.0 0.1 0.2 0.3 0.4 0.5 0.6 0.7 0.8 0.9 1.0
Trustworthiness score
10 domains in Figure 14). Further breakdown of its performance
cost with adPerf reveals two JavaScript documents (osd.js and (a) WOT
osd_listener.js) of size less than 75 KB belonging to this domain
are referenced by over 200 websites in the news corpus. These two Number of servers with safe flags
0 50 59 65 68 71
files are part of Google Ads that track the viewability of the ads to 1.0
assess the value of an impression to the publisher and advertiser. 0.9
To calculate what percentage of an ad appears in a viewable space 0.8
on the screen and for how long that portion of the ad remains
Ratio of performance cost
0.7
visible, these JavaScript snippets are frequently are invoked by the
webpage and take up precious CPU cycles. 0.6
Breakdown of performance cost by trustworthiness. When 0.5
an ad is included by the publisher, there is an explicit trust between 0.4
them. However, when syndication is performed by the ad provider, 0.3
the ad will be served through a chain of redirections going through
0.2
different ad domains. Our measurement result on the Alexa news
and general websites shows that the mean depth of the chain is 4, 0.1
revealing ad syndication is prevalent. Most of the ad domains on 0.0
0.0 0.1 0.2 0.3 0.4 0.5 0.6 0.7 0.8 0.9 1.0
the chain are not directly visible to the publisher (except the one Trustworthiness score
embedded by the publisher) and their intention (e.g., whether they (b) VirusTotal
are used for drive-by download or phishing) cannot be verified by
the publisher. There is an implicit trust placed by the publisher on Figure 15: Performance cost of ads delivered by ad domains
the ads but the real trustworthiness of those ad domains is uncertain. as a function of its trustworthiness score (CDF). Both scores,
We are interested in the correlation between the performance cost WOT (top) and VirusTotal (bottom) are normalized to [0,1].
an ad domain brings and its trustworthiness. Different colors highlight different trustworthiness rating.
To this end, we leveraged two online services, WOT (Web of
Trust) [13] and VirusTotal [12], to model the trustworthiness of
an ad domain. WOT is a community-based reputation system that for varying thresholds. Figure 15 illustrates the cumulative perfor-
assigns a score to a domain name based on user complaints and mance cost of ad domains as a function of trustworthiness assessed
other blacklists. The score ranges from 0 to 100 and WOT classifies by WOT and VirusTotal. For WOT, we use its default classification
domains based on their scores into 5 trust rating – excellent, good, (5 classes) [19]. For VirusTotal, we observe that almost all of the
unsatisfactory, poor, and very poor [19]. VirusTotal is a portal domains receive at least 50 safe flags, so we only breakdown the
that proxies the request of a security check of a domain/URL to region from 50 to 71 servers at the granularity of 3 servers.
its affiliated blacklist services (71 blacklists). When a domain is Finding 11. Following the default classification of WOT, about
submitted to VirusTotal, it reports the blacklists that flag it as red. 63% of ads cost is from ads delivered by trusted ad domains (excel-
We count the ratio of blacklists that did not raise an alarm on lent and good rating). Nevertheless, domains that are not trusted
the domain (i.e. safe flag) as the VirusTotal score (i.e., 0 means (unsatisfactory, poor and very poor rating) contribute to a consider-
highly malicious and 1 means completely benign). Both WOT and able portion of ads (37%) which is a flag for publishers. Accordingly,
VirusTotal have been used to determine the trustworthiness of a for VirusTotal, we see that only 5% of the performance cost of ads
domain by previous studies [18, 19, 27]. is connected to domains that don’t receive any red flags.
We find that the thresholds for trust ratings vary across different Finding 12. Domains that are moderately trusted (i.e., neither
services that report a trustworthiness score. Therefore, to provide a highly trusted nor untrusted) have the greatest contribution to the
fair analysis, we report the contribution of domains to the ad cost performance cost of ads. This can be interpreted from Figure 15.
The amount of drop in the fraction of performance cost (y-axis)
111.0
within each region indicates the portion of performance cost for
that level of trust. For example, domains with more than 80% WOT 0.9
score (excellent trust rating) contribute to 5% of ads performance 0.8
Ratio of performance cost
cost while 58% of ads cost belongs to domains with 60% to 80% score 0.7
(good trust rating). Likewise, domains with less than 3 VirusTotal 0.6
red flags (first class from the right in the figure) count for 18% of ads 0.5
cost but 55% for domains with 3 to 6 red flags (second class from the
0.4
right). Nonetheless, our results do not assert a strong correlation
between trustworthiness and the performance cost associated with 0.3
the third-party ad domains. 0.2
Breakdown of performance cost by popularity. Similar to the 0.1
trustworthiness gauged by the hygiene of the delivered content, the 0.0
reputation of an ad domain can be correlated with the performance 0.0 0.1 0.2 0.3 0.4 0.5 0.6 0.7 0.8 0.9 1.0
Popularity score
cost as well. One might expect the more popular ad domains to
(a) Number of referred websites
contribute a higher fraction of ads cost in the web ecosystem. To
test this hypothesis, we first model the domain reputation by its
popularity, which is determined by the Alexa ranking [4] and the
number of websites in our corpus referring to it. However, there 1.0
is no agreed-upon cutoff to split ad domains into popular versus 0.9
unpopular. For this reason, we follow a similar method to the trust- 0.8
worthiness study and draw the contribution of popular ad domains
Ratio of performance cost
0.7
to the performance cost at varying cutoff levels. Figure 16 illustrates
0.6
the cumulative contribution of popular domains to the performance
0.5
cost of ads for two metrics.
Finding 13. Even though earlier in this section we observed no 0.4
correlation between the popularity of the ad domains (i.e. number of 0.3
referred websites) and the performance cost for multiple domains, 0.2
at the macro-level, more popular ad domains contribute more to 0.1
the performance cost as we can see from Figure 16(a). As highligted 0.0
in this figure, the fraction of performance cost drops about 40% 0.0 0.1 0.2 0.3 0.4 0.5 0.6 0.7 0.8 0.9 1.0
Popularity score
within 5% range of the most popular ad domains. However, for the
Alexa ranking, we observe multiple sharp drops throughout the (b) Alexa ranking
score range, meaning there exist multiple ad-domains that have
a significant contribution to the performance that is neither very Figure 16: Performance cost of ads from popular domains
popular nor very unpopular. as a function of popularity score (CDF) on the number of
referrers (top) and Alexa ranking (bottom).
7 CONCLUSIONS AND TAKEAWAYS
Our evaluations on the performance cost of ads lead to multiple new can follow targeted optimizations to loading third-party JavaScript
and interesting observations. The key finding of this research is ads provided by Google Page Insights [9] such as lazy-loading scripts
have significant cost, more than 15% of page loading computation and libraries (e.g. serving an ad in the footer only when a user
workload. In addition to this, we discover Scripting contributes to scrolls down the page), splitting JavaScript bundles (e.g. dynamic
more than 88% of this cost. We also find out that the breakdown of import() statement), self-hosting scripts with Service workers par-
activities in displaying ads does not completely align with the main ticularly for ad domains with consistent APIs, using resource hints
contents of the pages. For example, HTML parsing comprises of like preconnect and DNS-prefetch, sandboxing script with iframes,
more ad-contents rather than the main content. Web ads have also and using asynchronous ad tag manager in the code to name a few.
increased the time spent on the network by almost the same ratio. In this study, we did not account for ad resources that might be
About 80% of the time overhead of ads is related to images and directly embedded in native HTML and ad resources that cannot be
script resources. Also, our results show that resources related to ad detected by filter lists (i.e. websites that use circumvention to evade
content are relatively dissimilar to the typical resources requested filter lists). In future work, we plan to also include such sources of ad
by pages. For example, XML files are requested more by the ad content. This addition would only increase the performance costs
contents. Our evaluations also show that a considerable fraction of of different ad breakdowns reported throughout this paper, which
the performance cost of ads is from untrusted domains. we believe is already significant to warrant deeper attention. We
We design and implement adPerf to provide insight and guidance anticipate this study primarily aimed at designing a methodology
to both publishers and third-party ad providers to improve the per- and open-source infrastructure for fine-grained analysis of ads will
formance of ads by identifying the stage and/or resource which are be a useful tool for web researchers to prioritize their optimization
the main bottlenecks. For example, if adPerf identifies Scripting to efforts and publishers to analyze the impact of their ad-delivery
be the computation and network bottleneck of ads on a website, one chain.
12You can also read