InfoSight User Guide for HPE Nimble Storage - Version E20 Published October, 2020
←
→
Page content transcription
If your browser does not render page correctly, please read the page content below
InfoSight User Guide for HPE
  Nimble Storage

Version E20

Published October, 2020
Documentation Feedback: doc-feedback-hpe-nimble@hpe.com
Legal Notices

Legal Notices
      ©   Copyright 2020 Hewlett Packard Enterprise Development LP
 Notices
      The information contained herein is subject to change without notice. The only warranties for Hewlett Packard
      Enterprise products and services are set forth in the express warranty statements accompanying such products
      and services. Nothing herein should be construed as constituting an additional warranty. Hewlett Packard Enterprise
      shall not be liable for technical or editorial errors or omissions contained herein.
      Confidential computer software. Valid license from Hewlett Packard Enterprise required for possession, use, or
      copying. Consistent with FAR 12.211 and 12.212, Commercial Computer Software, Computer Software Documen-
      tation, and Technical Data for Commercial Items are licensed to the U.S. Government under vendor's standard
      commercial license.
      Links to third-party websites take you outside the Hewlett Packard Enterprise website. Hewlett Packard Enterprise
      has no control over and is not responsible for information outside the Hewlett Packard Enterprise website.

 Acknowledgments
      Intel®, Itanium®, Pentium®, Intel Inside®, and the Intel Inside logo are trademarks of Intel Corporation in the
      United States and other countries.
      Microsoft® and Windows® are either registered trademarks or trademarks of Microsoft Corporation in the United
      States and/or other countries.
      Adobe® and Acrobat® are trademarks of Adobe Systems Incorporated.
      Java® and Oracle® are registered trademarks of Oracle and/or its affiliates.
      UNIX® is a registered trademark of The Open Group.

 Publication Date
      Tuesday October 27, 2020 15:02:19

 Document ID
      mtn1582564794393

 Support
      All documentation and knowledge base articles are available on HPE InfoSight at https://infosight.hpe.com.
      To register for HPE InfoSight, click the Create Account link on the main page.
      Email: mailto:support@nimblestorage.com
      For all other general support contact information, go to
      https://www.hpe.com/us/en/services/nimble-storage.html.

Copyright © 2020 by Hewlett Packard Enterprise Development LP. All rights reserved.
Contents

      HPE InfoSight Portal Overview...................................................................5
            Register Your HPE Nimble Storage Account.......................................................................................5
            Set up Email Notifications.....................................................................................................................6
            Select an Organization.........................................................................................................................6
            Configure Your Home Page.................................................................................................................7
                   Links Section.............................................................................................................................7
                   Landing Page Section................................................................................................................7
                   Bulletins Section........................................................................................................................8
            The Dashboards...................................................................................................................................8
                   Cross-Stack Performance Recommendations..........................................................................9
            Visual Overview of HPE InfoSight......................................................................................................13
            The List Views and Details Pages......................................................................................................14
            Data Availability FAQ..........................................................................................................................15
            Data Availability Details......................................................................................................................17

      Managing Your Arrays...............................................................................18
            HPE InfoSight Roles...........................................................................................................................18
            Configure Your Arrays........................................................................................................................18
            Configure Arrays to Send Data to HPE InfoSight...............................................................................19
                  Use the GUI to Configure Arrays.............................................................................................19
                  Use the CLI to Configure Arrays..............................................................................................19
            View Software Recommendations.....................................................................................................20
                  Control Release Statuses for Software Recommendations ...................................................20
            Wellness Issues and how to Manage Them.......................................................................................21
                  Configure Wellness Rules.......................................................................................................21
                  Set-up Email Notifications for Alerts........................................................................................21
                  Set a Snooze Period................................................................................................................22

      Displaying VMware Analytics....................................................................23
            Using VMware Virtualization Data to Evaluate Performance.............................................................23
                  Enable InfoSight to Collect VMware Information.....................................................................23
            Register the vCenter Plugin................................................................................................................24
                  Use the NimbleOS GUI to Register the vCenter Plugin .........................................................25
                  Use the NimbleOS CLI to Register the vCenter Plugin ..........................................................25
            Configure Arrays to Monitor your Virtual Environment.......................................................................25
            View Overprovisioned VMs................................................................................................................26
            View VMs by IOPS and Latency.........................................................................................................26
            View VM Latency Due to the ESX Host.............................................................................................26

Copyright © 2020 by Hewlett Packard Enterprise Development LP. All rights reserved.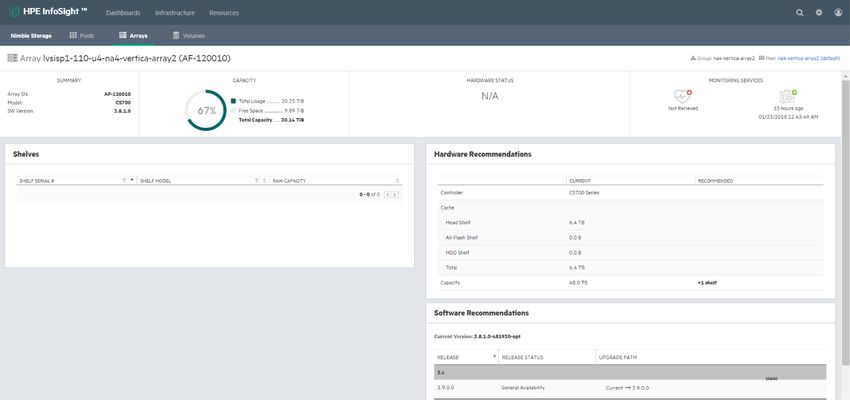
View Contentious VMs Based on the Datastore................................................................................26
            View Contentious VMs Based on the ESX Host................................................................................27

      Displaying Hyper-V Analytics....................................................................28
            Analyzing Hyper-V Performance Issues.............................................................................................28
                  Enabling InfoSight to Collect Hyper-V Data.............................................................................28
                  Key Data Provided by the Hyper-V Virtualization Pages.........................................................29
                  Hyper-V Cluster Analytics........................................................................................................29
                  Hyper-V Host Analytics............................................................................................................30
                  Hyper-V Storage Analytics......................................................................................................32
                  Hyper-V VM Analytics..............................................................................................................34
                  Navigating Between Analytic Stacks ......................................................................................40
                  Displaying Data from Multiple Stacks......................................................................................42
                  Current Behavior for Clustered/Standalone Hosts..................................................................42

      Monitoring Your Array Environment.........................................................44
            Monitor Equipment.............................................................................................................................44
            Potential Impact Score.......................................................................................................................44
            Monitor Volumes.................................................................................................................................44
            Monitor Synchronously Replicated Volumes......................................................................................44
            The Executive Dashboard..................................................................................................................45
            Streaming Performance Telemetry Data............................................................................................45
                  Enabling Stats Streaming........................................................................................................47
                  Viewing Arrays on which Stats Streaming is Enabled.............................................................47

      Viewing dHCI Data......................................................................................48
            HPE InfoSight Analytics and dHCI ....................................................................................................48
                  Enable InfoSight to Provide dHCI Information.........................................................................48

      Support of Your Arrays..............................................................................49
            Validate Contact and Install Location Information .............................................................................49
            Maintenance Windows.......................................................................................................................49
                   Schedule Maintenance Windows............................................................................................50
            Support Area Overview......................................................................................................................50
                   Create a Support Case ...........................................................................................................51
            Security of Customer-Originated Data ..............................................................................................52
                   Information Security Practices ................................................................................................53
                   Core Data Dumps ...................................................................................................................54
                   Failed Disk Drives ...................................................................................................................54
            Get Help.............................................................................................................................................54

Copyright © 2020 by Hewlett Packard Enterprise Development LP. All rights reserved.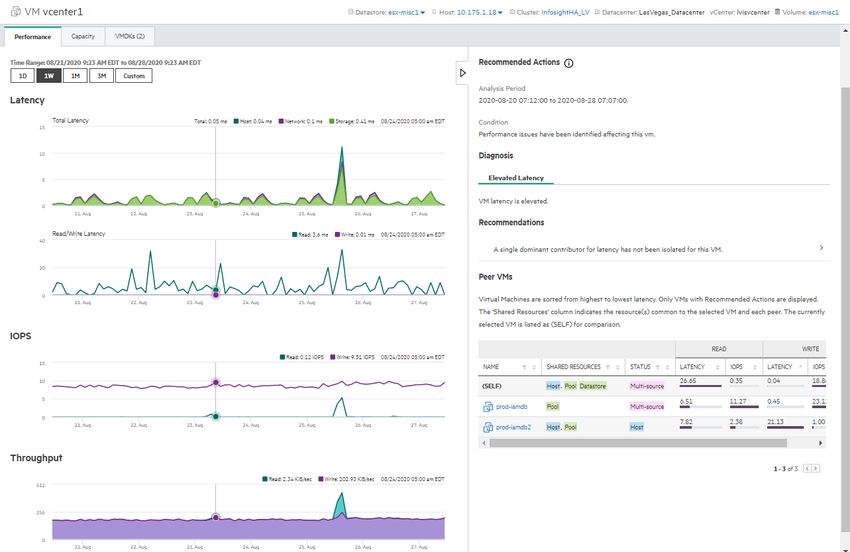
Documentation Feedback: doc-feedback-hpe-nimble@hpe.com
HPE InfoSight Portal Overview

HPE InfoSight Portal Overview
      HPE InfoSight is a portal that enables you to manage, monitor, and troubleshoot HPE assets in various HPE
      organizations. And while this document focuses on HPE Nimble Storage assets, you can access the
      documentation for other HPE products from the portal Resources menu.
      Access to HPE InfoSight (available at https://infosight.hpe.com) is included in your support subscription
      package.
      Note Nimble Storage legacy users will need to contact support to register their account with HPE Passport.
      You can use the HPE InfoSight portal to perform the following tasks:
      •   Monitor your environment:
          •   Manage storage health alerts and support cases
          •   Analyze top causes of and possible corrections to latency issues
          •   Monitor snapshots and replication
          •   View data protection status and recovery point objective times
          •   Monitor your virtual environment
          •   Get a comprehensive overview on the dashboards
      •   Plan for efficient use of your infrastructure:
          •   View capacity trends and forecasts
          •   Assess CPU headroom on your storage assets and virtual infrastructure
          •   View upgrade recommendations based on current utilization
          •   Customize wellness summary emails
          •   Customize array-originating events that require interaction with HPE Nimble Storage Support
          •   Schedule maintenance windows
          •   Plan array software updates
      •   Troubleshoot performance issues:
          •   At the storage level, use detailed analysis of latency factors
          •   At the per-VM level, troubleshoot with end-to-end visibility from the host to storage
          •   Get an analysis of your virtual and physical infrastructure usage on a per-consumer basis through
              interactive heatmaps
      •   Access content:
          •   View or download documentation
          •   Manage issues and support cases
          •   Download software and documentation

      To watch a demo of HPE InfoSight, click the InfoSight Demo link on YouTube. To view a self-guided iterative
      demo of HPE InfoSight, click HPE InfoSight Web Portal Demo.

Register Your HPE Nimble Storage Account

      Before you begin
      You must have created an HPE Passport account.

Copyright © 2020 by Hewlett Packard Enterprise Development LP. All rights reserved.                                           5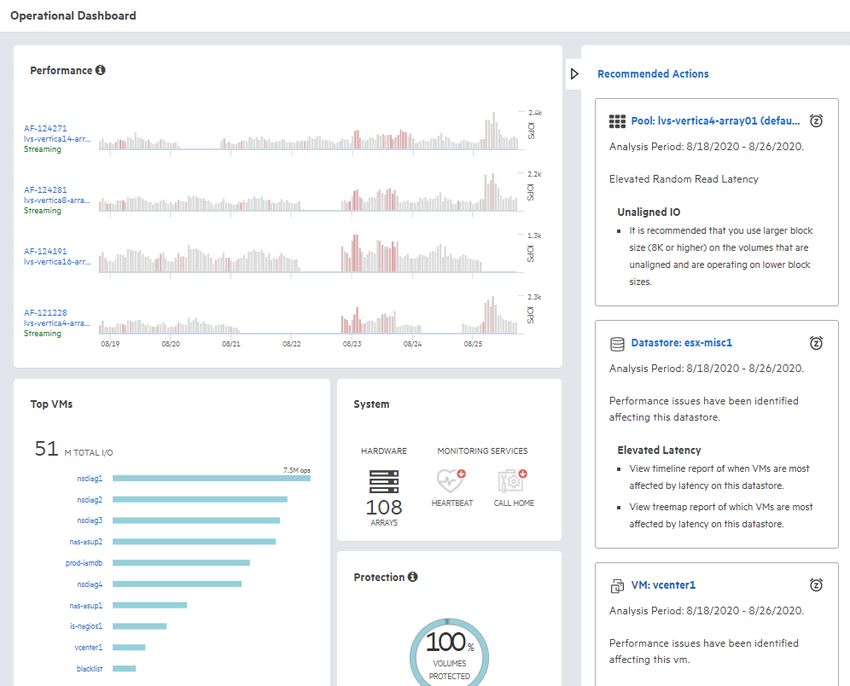
Documentation Feedback: doc-feedback-hpe-nimble@hpe.com
Set up Email Notifications

      If you are not associated with any HPE Nimble Storage account, you must be invited by another member of
      your organization. If you are a new customer and your email address is not recognized by our system, email
      support@nimblestorage.com for assistance.
      During the HPE Nimble Storage sales process, the following tasks are automatically completed for you:
      •   The HPE Nimble Storage organization is created.
      •   The HPE Nimble Storage system is added to the organization.
      •   An Administrator user is created in the organization.
      Note: The registration process is different for Nimble Storage than for other organizations. This following
      procedure is for HPE Nimble Storage only.

      Procedure
      1 Log into InfoSight at https://infosight.hpe.com..
        If this is your first time logging in to HPE InfoSight, a verification email is sent to the email address associated
        with your HPE Passport account. When you receive the verification email:
          1 Follow the instructions in the verification email until the HPE InfoSight Terms of Use are displayed.
          2 Accept the Terms of Use. The InfoSight Welcome page is displayed.

      2 Either click HPE Nimble Storage Registration on the InfoSight Welcome page or select Settings >
        Nimble Storage > Customer Registration.
        The HPE Nimble Storage Operational Dashboard is displayed.
      3 Add users to your HPE Nimble Storage organization.
          For instructions on adding users, see Associate New Users with an HPE InfoSight Account

Set up Email Notifications

      Procedure
          Setup email notification for alerts.
          a) Click Dashboards > Wellness
          b) Click the Daily Summary Emails button on right-hand side of screen.
          c) Enter an email address for delivery of the email alerts.
             1 Click Add to add the email address as a recipient for the alerts.
             2 (Optional) Click Test to send a test email to the email address that you indicated.

Select an Organization
      The HPE InfoSight portal supports multiple organizations. An organization is a collection of users and systems
      that are grouped together in InfoSight. When you navigate within InfoSight, you must select the group of
      assets and the applications that you have been given access to by selecting an organization from the
      Organization selector.
      The following are organizational models that are currently supported by HPE InfoSight. Each model is dedicated
      to managing a product domain:
      •   HPE Nimble Storage
      •   HPE 3PAR StoreServ, StoreOnce, Primera, and Recovery Manager Central
      •   HPE Compute/Servers
      •   HPE SimpliVity

Copyright © 2020 by Hewlett Packard Enterprise Development LP. All rights reserved.                                                 6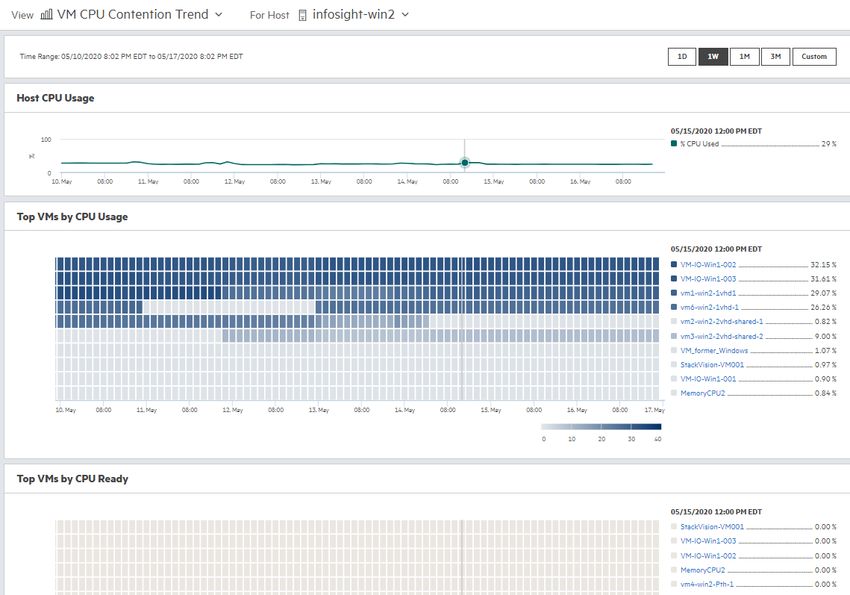
Documentation Feedback: doc-feedback-hpe-nimble@hpe.com
Configure Your Home Page

      While all HPE InfoSight users complete the same initial steps to create and verify their accounts, the procedures
      for registering devices, managing users, and navigating the user interface differ based on the product domain
      type.

Configure Your Home Page
      When you log into the HPE InfoSight portal, the HPE InfoSight Home page appears. The Home Page is
      designed to help you navigate the GUI and access key features and pages. You can display the Home Page
      from any other page in the GUI by clicking the HPE InfoSight logo at the top-left corner of every page.
      Note The Home Page appears only after you have registered with an organization or after you switch to a
      different organization.
      The Home Page is composed of three sections:
      •   The Links section at the top left hand side
      •   The Landing Page section at the top right hand side
      •   The Bulletins section as the bottom of the screen.

Links Section
      The links section of the Home Page is composed of two different type of hyperlinks:
      •   Recent Pages
      •   Product Pages
      The Recent Pages section shows recent pages you have visited in InfoSight. The list is updated each time
      you visit a new page. The list maintains a maximum of 10 pages, which will always be the last 10 pages
      you’ve visited. As you visit more pages, the older pages are pushed down and eventually disappear as new
      pages are displayed.
      The Product Pages section enables you to access specific InfoSight areas dedicated to a platform that has
      been configured for InfoSight. For example, clicking on Nimble Storage takes you to the Nimble Storage
      Operational Dashboard, while clicking on 3PAR StoreServ or Servers entries opens their respective
      Infrastructure pages.
      Note Product pages are filtered on a per user and per organization selection basis. Consequently, switching
      to a different organization while logged into the same user account could show different product pages as
      different products can be included in different organizations.

Landing Page Section
      The Landing Page section is used to set your preferred landing page. Before you select a landing page, make
      sure you have first selected an organization. Once you select an organization, the newly selected organization
      appears in the Landing Page Organization field.
      In the Landing Page drop-down list, the default page options are:
      •   The Home Page
      •   The products that are listed in the Product Pages section.
          Note The products in the drop-down list are not all the products that exist, but rather the pages for the
          type of product that you have configured to be managed by InfoSight.

      To select a landing page, click on the page in the drop down list, and then click Set as Default. The page
      that you selected is displayed immediately, and the page becomes the default page that appears when you
      next log into InfoSight.

Copyright © 2020 by Hewlett Packard Enterprise Development LP. All rights reserved.                                             7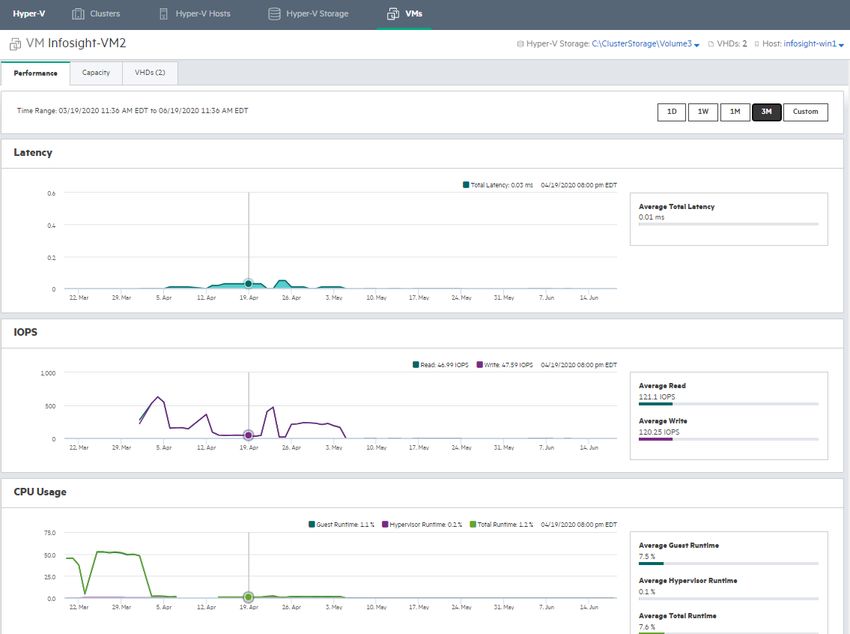
Documentation Feedback: doc-feedback-hpe-nimble@hpe.com
Bulletins Section

Bulletins Section
      By default, the Bulletins section shows all the InfoSight bulletins that have been released. Bulletins consist
      of notices, alerts, release notes, user tips and FAQs. You can dismiss a bulletin by clicking the Dismiss
      button that appears next to the bulletin or you can remove all bulletins by clicking Dismiss all.
      Note Once bulletins are dismissed, they can no longer be displayed in the Bulletins section of the Home
      Page. However, you can still view dismissed bullets at any time by clicking My Account > Past Bulletins.

The Dashboards
 Operational
     For owners of Nimble Storage assets, HPE InfoSight opens on the Operational Dashboard. This dashboard
     includes quick views of the performance of your arrays and the status of your system, protection, and capacity.
     It also shows pool and VMware object performance recommendations.
 Recommendations
     The Recommendations Dashboard displays cross-stack performance recommendations that can help you
     improve the performance of your virtual environment. These recommendations are generated by InfoSight’s
     AI recommendation engine, which leverages machine learning to identify and diagnose a wide variety of
     performance issues. See Cross-Stack Performance Recommendations on page 9 for more information.
 Executive
      The Executive Dashboard displays an overall view of the state of your arrays. The various graphs provide
      a quick picture of several aspects of your system, including space savings, operational efficiencies, data
      protection, and upgrade needs.
      You can get more information on the Executive Dashboard in The Executive Dashboard on page 45.
 Wellness
      The Wellness dashboard is where you can view issues against your arrays and details about those issues.
      You can get more information on the Wellness Dashboard in Wellness Issues and how to Manage Them on
      page 21.
 Capacity Report
      The Capacity Report displays the capacity of all your pools or a particular pool based on a time frame that
      you select. The information is presented as a summary in the headline bar or in graph format with the details
      listed at the bottom.
 Labs for Analytics
      HPE InfoSight Labs is a framework that allows you to quickly view advanced analytics. Each application in
      Labs supports near-real time analytics and can be queried on demand. Labs also enables you to obtain
      instant feedback that you can use to refine your models to ensure maximum accuracy. All the applications
      can be aggregated by volumes, applications, performance policies, or volume collections.
      The following is the current list of labs that you can access from the InfoSight portal.
      •   Resource Planner
      •   Cross Stack Recommendations
      •   Capacity Consumers Forecast
      •   HPE Cloud Volumes Sizing Tool
      •   AI Performance Recommendations
      •   Pool Performance Telemetry
      •   Reflection Planning
      •   Replication Timeline
      •   Capacity Consumers Timeline
      •   Volume Performance

Copyright © 2020 by Hewlett Packard Enterprise Development LP. All rights reserved.                                             8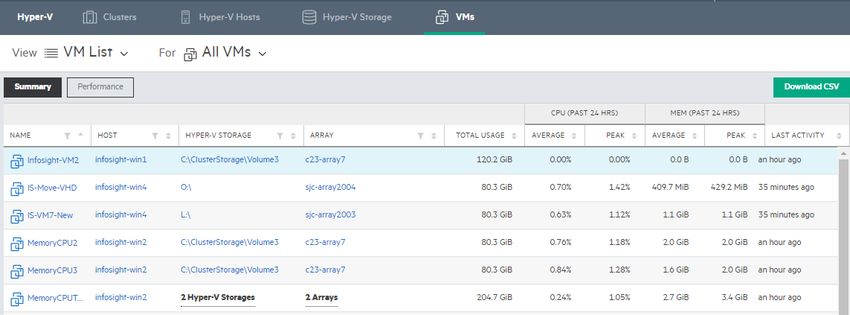
Documentation Feedback: doc-feedback-hpe-nimble@hpe.com
Cross-Stack Performance Recommendations

      •   Recurring Performance Patterns
      •   Inter-Volume Performance & Contention
      For each application, the input parameters that you select are crucial to the results.
      For information about a particular lab, open the lab and then click the information icon that appears next to
      the lab name. A Lab User Guide is displayed that explains the purpose of the lab as well as input and output
      information.

Cross-Stack Performance Recommendations
      HPE InfoSight automatically analyzes system telemetry to diagnose problems and recommend actions you
      can take to improve the performance of pools in your storage environment and in VMware hosts, datastores
      and VMs in your virtual environment.
      The recommended actions appear in cards that you can access from:
      •   The Recommendations Dashboard
      •   The Operational Dashboard
      •   The Performance window for individual objects.
      Note To watch a video demonstration of this new feature, click VM Recommendations.

      Display the Recommendations Dashboard
      To display the Recommendations Dashboard, click Dashboards > Recommendations.
      The Recommendations Dashboard displays information in cards that show the analysis period, the problem
      diagnosis, and recommended actions that you can take to improve the performance of the object.

      You can filter the display of objects in this dashboard by object type, diagnosis type, snoozed designation,
      and object name.

Copyright © 2020 by Hewlett Packard Enterprise Development LP. All rights reserved.                                            9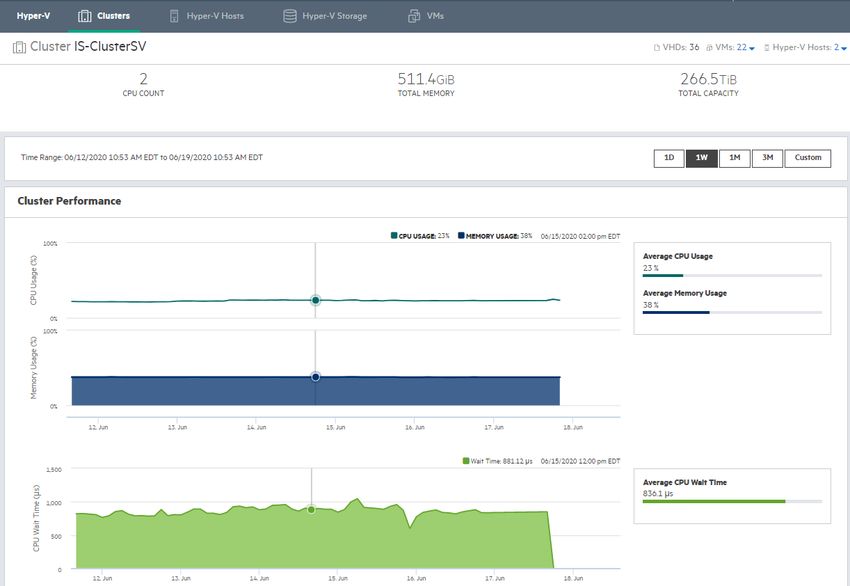
Documentation Feedback: doc-feedback-hpe-nimble@hpe.com
Filter by Object Type

      Filter by Object Type
      To filter objects in the dashboard by object type, select an object type from the Object Type drop-down list.
      You can select any of the following object type choices:
      •   ALL
      •   DATASTORE
      •   HOST
      •   POOL
      •   VM
      Note If VMware streaming is disabled or you don't have permission to view VMware data, then you can only
      display recommendations for pools.
      Filter by Diagnosis Type
      To filter objects in the dashboard by diagnosis type, select one or more diagnosis types from the Diagnosis
      Type drop-down list. You can select any of the following diagnosis types:

      Table 1: Diagnosis Types

       All
       Contention with Copy Offload
       Elevated Latency
       HDD Bandwidth Saturation
       IOPS Limit Throttling
       Low Compressibility
       MBPS Limit Throttling
       Network Bottleneck
       Optimize Deduplication
       Pending Deletes
       Physical CPU Saturation
       Random Read Cache Miss
       SSD Bandwidth Saturation
       Sequential IO Contention
       Sequential Read Cache Miss
       Storage CPU Saturation
       Synchronous Replication
       Unaligned IO
       Unidentified Root Cause
       Virtual CPU Overprovisioning
       Virtual CPU Underprovisioning

      Note that the diagnosis types that appear in the Diagnosis Types drop-down list are governed by the selected
      object type. For example, if you select Datastore as the object type, then only Elevated Latency will be
      available in the Diagnosis Type drop-down list.

Copyright © 2020 by Hewlett Packard Enterprise Development LP. All rights reserved.                                          10
Documentation Feedback: doc-feedback-hpe-nimble@hpe.com
Change Object Snooze Settings
Change Object Snooze Settings
You can snooze the recommendation notification for an object using the Snooze option. When you snooze
an object, the recommendation card is removed from the display for a specified time interval..
To change the snooze setting for an object, click the Snooze button (the alarm clock icon) next to the object
name and select a specific snooze period. You can elect to snooze an object for one month, three months,
or indefinitely.
You can filter snoozed objects in the dashboard by selecting either Yes, No, or All in the Snoozed drop-down
list.
Filter by Object Name
To filter objects in the dashboard by object name, type the name of the object in the Search field.
Note that the search results are governed by the inputs that you have selected in the Object Type, the
Diagnosis Type, and the Snoozed lists. For example, if you search for VMs that have a diagnosis type of
Elevated Latency, then the search will only return VMs with that diagnosis type.
View Performance and Object Details
To view the details of an object in the Recommendations Dashboard, click the object. The Performance tab
for the object appears with detailed Recommended Actions appearing in a collapsible panel on the right side
of the screen. The following example shows the Performance tab for a VM object:
In the Performance tab, you can move the mouse pointer in the performance graph to correlate VM Latency
with underlying IOPS and Throughput utilization. You can also click the graph and drag the mouse to zoom
in on a subset of the performance data.
Copyright © 2020 by Hewlett Packard Enterprise Development LP. All rights reserved. 11Documentation Feedback: doc-feedback-hpe-nimble@hpe.com
Display the Operational Dashboard
In the Recommended Actions panel, you can see a diagnosis of any discovered issues and view
recommendations on how to fix the issues. In addition, the Recommended Actions panel displays performance
analytics for Peer VMs, which enables you to analyze how peer objects might affect overall object performance.
For more detailed information about the Recommended Actions panel, click VM Recommendations to watch
a video demonstration.
Display the Operational Dashboard
To display the Operational Dashboard and view performance recommendations, click Dashboards >
Operational.
The performance recommendations appear in collapsible cards on the right side of the display in the same
manner as the cards in the Recommendations Dashboard. For each analyzed pool, host, datastore, or VM,
you can view the following information:
• The object name
• The dates the system telemetry was analyzed
• A brief description of any discovered performance issues
• Recommended actions you can take to address discovered performance issues
When working with performance recommendations in the Operational Dashboard, you can also:
• Snooze the objects in the Recommended Actions cards in the same manner as you can in the
Recommendations Dashboard.
• Navigate to the Recommendations Dashboard by clicking the Recommended Actions link.
• Display the performance tab and detailed recommended actions for an object in a card by clicking the
object.
• Click a VM in the Top VMs list to display detailed recommended actions for that object.
Copyright © 2020 by Hewlett Packard Enterprise Development LP. All rights reserved. 12Documentation Feedback: doc-feedback-hpe-nimble@hpe.com
Visual Overview of HPE InfoSight
Visual Overview of HPE InfoSight
The following images are of some of the most commonly viewed screens in HPE InfoSight and are intended
to help you get your bearings when you perform tasks to manage your arrays.
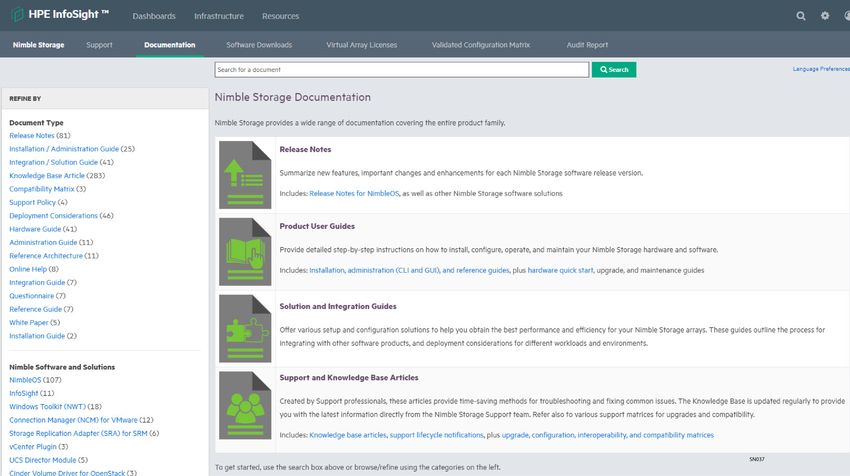
Software Downloads page:
You can download software for NimbleOS, Integrations kits, and Solution kits from the Software Downloads
page, as shown in the following image. To access the page, click Resources > Software Downloads.
Documentation page:
You can view and download documentation for HPE Nimble Storage software and hardware from the
Documentation page, as shown in the following image. To access the page, click Resources >
Documentation.
Copyright © 2020 by Hewlett Packard Enterprise Development LP. All rights reserved. 13Documentation Feedback: doc-feedback-hpe-nimble@hpe.com
The List Views and Details Pages
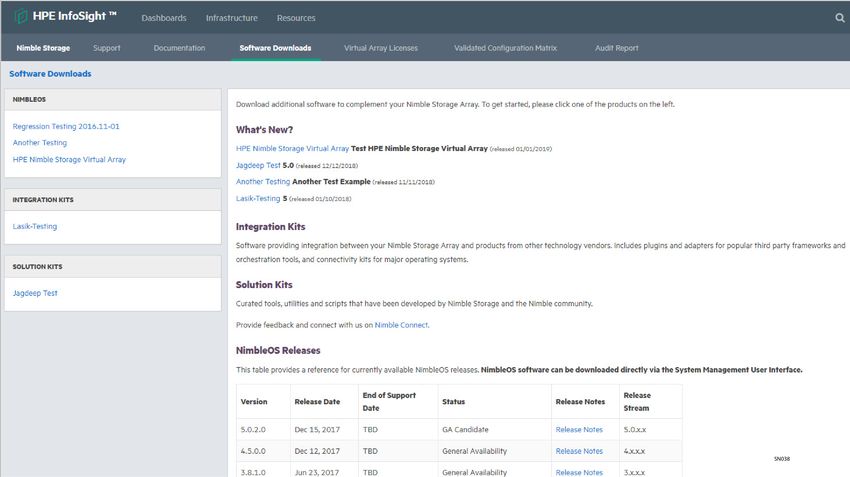
Support page:
If you have admin privileges, you can go to the Support page to view and manage information about your
arrays, cases, and contacts. To access the page, click Resources and then under Nimble Storage select
Support.
The List Views and Details Pages
The List Summary pages consist of a list of all the pools, arrays, volumes, VMs, datastores, or hosts that are
visible in your account. The columns can all be sorted and the contents of several columns are links to the
details pages for those items. The columns can also be filtered using the funnel icon on the column header.
On the Details pages, the headline bar indicates whether the information on display is for an array, VM,
volume, datastore or host. Below the headline bar are graphs that display information based on a particular
date range that you specify.
Copyright © 2020 by Hewlett Packard Enterprise Development LP. All rights reserved. 14Documentation Feedback: doc-feedback-hpe-nimble@hpe.com
Data Availability FAQ
Data Availability FAQ
Where can I view information on the latest data set that is being presented?
Page or View Location Details
Array Details Page • Last Heartbeat and Last Data Indicates the time the last data set
Sent columns and heartbeat was received
• The icons in the headline bar
VM List Page The column, Last Activity, on the Indicates the status and currency
Summary tab of the data
Wellness Dashboard In the Issue Details table Indicates the time and type of alert
that was created
How long after the installation of my array will I begin to see data and where will I see it?
• The majority of new arrays appear in HPE InfoSight within 48 hours after receiving the first daily data set.
• For trending data such as capacity graphs, although data points might appear, expect two weeks before
you have enough data for a meaningful forecast.
Although this data is updated on a weekly basis, it is not likely to be useful until there has been significant
activity on the array. For example, the cache utilization metric is not useful until you have written enough
data to fill the cache.
After I enable VM Monitoring, how long will I have to wait before I can view the statistics?
The statistics should be visible in HPE InfoSight within two to four hours. After the initial setup, which can
take up to 48 hours, VMvision statistics are updated within four hours.
After I enable the vCenter plugin, how much time does it take to start seeing associated data in HPE
InfoSight?
The VM related data in HPE InfoSight is based on a combination of the streaming statistics and VMware-related
data that is part of the regular data set. Both of these sets of data must be received and processed (which
requires at least 48 hours) before data is visible on HPE InfoSight.
Copyright © 2020 by Hewlett Packard Enterprise Development LP. All rights reserved. 15Documentation Feedback: doc-feedback-hpe-nimble@hpe.com
HPE InfoSight Portal Overview
What is the average processing time for the streaming statistics?
Usually about 4 hours.
At what time are the nightly data sets processed (for example, are they processed based on the arrays
time-zone or are they processed at the same time for all arrays?)
Daily data sets are scheduled to be delivered a few minutes after midnight array local time. Data sets are
processed in batches based on the order of arrival. Usually, the data sets are processed within 24 hours of
their arrival.
I upgraded my array. How long will it take for HPE InfoSight to show the version and other changes?
Configuration changes, including upgrades and hardware changes, are updated in HPE InfoSight within 48
hours.
When moving VMware virtual machines from one volume to another it generally takes time to reflect the
change in HPE InfoSight correctly. How long should it take?
You should see the changes within 48 hours, depending on the timing.
If there is an HPE InfoSight recommendation, when does it appear and how long does it persist if the root
cause is resolved?
Preliminary recommendations appear within four days. Cache recommendations are only meaningful after
the SSD cache has been fully written to at least once.
The recommendation is removed immediately after a data set event indicating a configuration change is
received and processed, which could take up to 48 hours.
If I have replication to an array that is in a different time zone, what is the impact of the time difference
and location?
We currently display time in local time of the browser unless where explicitly stated.
How long does HPE InfoSight retain the Diagnostics for Nimble Analytics (DNA)? Can I request that the
DNA be held longer?
The DNA is held for one year. It is not possible to request that the data be held for a longer period. HPE
InfoSight stops displaying the data of a particular array after the array stops sending heartbeats and data
sets for seven consecutive days.
Copyright © 2020 by Hewlett Packard Enterprise Development LP. All rights reserved. 16Documentation Feedback: doc-feedback-hpe-nimble@hpe.com
Data Availability Details
Data Availability Details
Data currency
Quantity of data Frequency
Type of data Notes necessary for initial (based on of updates
data visibility time change (visibility)
occurs)
Wellness Dash-
board, Issue Details Based on heartbeat, alerts and
1 day worth of data
(auto-opened case analysis of data sets
information)
Scroll over any graph and the
analytics appear below the
Array details graph. The time the analytics 1 week worth of data
were collected is in the far
right.
Capacity (raw data) 1 day worth of data
Capacity forecasts 14 days worth of data
Data protection infor- Volumes List page, Protection Updated within
1 day worth of data 24 hours
mation view 48 hours
Replication Planning Only available for volumes with 14 days worth of data
tool snapshots from snapped volumes
Data on IOPS, throughput, la-
Performance graph 7 days worth of data
tency and its breakdown
Performance infor-
1 day worth of data
mation
CPU and cache rec- Computed based on past 4
4 days worth of data
ommendations weeks
Assets inventory changes (up-
Virtual environment 1 day worth of data
grades and hardware changes)
1 day worth of data,
Datastore, host, and VM Updated within
Virtual environment post vCenter registra- 2 hours
statistics 2 hours
tion
Copyright © 2020 by Hewlett Packard Enterprise Development LP. All rights reserved. 17Documentation Feedback: doc-feedback-hpe-nimble@hpe.com
Managing Your Arrays
Managing Your Arrays
Before you can begin to monitor your arrays, you must perform some preparation and configuration tasks.
These tasks ensure that you have access to the arrays, that you have registered your plugins, and that you
can receive notifications and information on the health of your arrays.
Note For information on how to verify software updates paths, and how to download HPE Nimble Storage
software, refer to the GUI Administration Guide.
HPE InfoSight Roles
There are three that provide access to arrays on HPE InfoSight:
Admin
Users who have been assigned the Admin role can:
• Manage users
• Register systems
• Access all information within HPE InfoSight. In the case of Nimble Storage, this includes support cases
and asset management.
User
Users who have been assigned the User role can only view information in HPE InfoSight, with the exception
of the Support page.
Third Party
This role has the same privileges as the User role, but is used for external company users, such as partners.
To see all the users in your organization and their assigned roles, go to the settings menu (the gear icon)
and select Users.
Configure Your Arrays
Configure your arrays to send data sets to Nimble Storage Support.
It can take up to 48 hours for the array to show up in InfoSight after the first data set is sent.
Before you begin
These steps must be performed on the array GUI, not in InfoSight.
Procedure
1 From the Administration menu in the array GUI, select Alerts and Monitoring > Diagnostics for Nimble
Analytics > (DNA).
2 Select Allow Nimble Storage Support to collect analytics data from the array automatically.
3 Click Test Diagnostics for Nimble Analytics Settings to confirm that DNA is set up correctly.
If errors appear after the test completes, check the proxy settings to verify whether a required HTTP proxy
has been configured. If a proxy is not in use, the following external firewall ports will need to be opened
from the array management and controller IPs to benefit from full InfoSight functionality:
nsdiag.nimblestorage.com (Port 443, HTTPS)
nsstats.nimblestorage.com (Port 443, HTTPS)
Copyright © 2020 by Hewlett Packard Enterprise Development LP. All rights reserved. 18Documentation Feedback: doc-feedback-hpe-nimble@hpe.com
Configure Arrays to Send Data to HPE InfoSight
Further firewall ports are required for additional array features. See the appropriate Administration Guide
available on the InfoSight documentation portal for more details.
4 Click Save.
If errors appear after the autoSupport test completes, check the proxy settings to validate whether a
required HTTP proxy has been configured. If a proxy is not in use, the following external firewall ports
must be opened from the array management and controller IPs to benefit from complete InfoSight
functionality:
nsdiag.nimblestorage.com (Port 443, HTTPS)
nsstats.nimblestorage.com (Port 443, HTTPS)
Additional firewall ports are required for additional array features. See the appropriate Administration Guide
available on the InfoSight documentation portal for more details.
Configure Arrays to Send Data to HPE InfoSight
HPE InfoSight recommendations and automatic fault detection are based on data that is sent from your arrays
and processed by HPE InfoSight.
To take full advantage of the HPE InfoSight monitoring and analysis capabilities, configure your HPE Nimble
Storage arrays to send data sets, statistics, and events to HPE Nimble Storage Support through Diagnostics
for Nimble Analytics (DNA).
If you did not configure your arrays to send this data to HPE Nimble Storage Support during the initial setup,
you can change the configuration at any time by following this procedure or by running the group --edit
command in the CLI.
Use the GUI to Configure Arrays
Before you begin
This procedure must be performed in the NimbleOS array GUI, version 4.x and later. For information on how
to perform this procedure on NimbleOS array GUI, version 3.x and earlier, see the InfoSight User Guide
version E17.
Procedure
1 In NimbleOS, go to Administration > Alerts and Monitoring > Diagnostics for Nimble Analytics (DNA).
2 On the DNA page, select Allow Nimble Storage Support to collect analytics data from the array
automatically.
3 Click Test Diagnostics for Nimble Analytics Settings to confirm that DNA is set up correctly.
4 Click Save.
5 To enable event data, go to Administration > Alerts and Monitoring > Email.
6 On the Email Alerts page, select Send event data to Nimble Storage Support.
7 Enter an SMTP host and port.
Event data is relayed through HTTPS by default.
8 Click Save.
Use the CLI to Configure Arrays
Before you begin
This procedure must be performed in the NimbleOS CLI.
Copyright © 2020 by Hewlett Packard Enterprise Development LP. All rights reserved. 19Documentation Feedback: doc-feedback-hpe-nimble@hpe.com
View Software Recommendations
Procedure
1 Login to the CLI.
2 Enable sending data analytics to HPE Nimble Storage Support:
group --edit --autosupport yes
3 Enable sending event data to HPE Nimble Storage Support:
group --edit --send_event_data yes
View Software Recommendations
HPE InfoSight provides software recommendations for updating the software on your arrays. You might want
to update the current version of your software to incorporate a release that has new features or bug fixes.
To view recommended software updates for an array:
1 Log in to HPE InfoSight
2 Go to Infrastructure > Nimble Storage > Arrays
3 Click an array. The Software Recommendations window appears on the bottom right side of the page.
If the software release appears in red and is marked with a red dot, it means that the array has been added
to the Deny List for that release. The Deny List entry is applied to an array when HPE Nimble Support has
determined that the update is not suitable for the array, and the software is unavailable for download for the
array. Also, if there is information about an issue that might have caused an array to be added to the Deny
List, a description of the issue appears under the release name:
Control Release Statuses for Software Recommendations
InfoSight now enables you to control the software release statuses that you want to make visible to an array
for software download. The release statuses include:
• Long Term Support Release (LTSR)
• General Availability (GA)
• General Availability Candidate (GAC)
• Initial Production Release (IPR)
For a description of these software release statuses, refer to Release Statuses on the documentation portal.
To select the release statuses that you want to make visible to an array:
1 Click Release Statuses in the Software Recommendations window. The list of release statuses appears.
2 Select one or more release statuses.
3 Click Save.
Copyright © 2020 by Hewlett Packard Enterprise Development LP. All rights reserved. 20Documentation Feedback: doc-feedback-hpe-nimble@hpe.com
Wellness Issues and how to Manage Them
The Software Recommendation list changes based on the release statuses you have selected.
Note Filtering the release statuses in the Software Recommendation list does not affect arrays added to the
Deny List, which are controlled by the support team. The release for an array on the Deny List will always be
unavailable for downloading until the issue that caused the Deny List entry is addressed and the support
team removes the array from the Deny List.
Wellness Issues and how to Manage Them
Note The Wellness Issues view is not meant for real time monitoring of the status of your arrays. Refer to
the array GUI for real time monitoring.
Wellness issues arise when there are situations that you need to be aware of on any of your arrays. A wellness
issue may involve latency, remaining space, issues with your power supply or any condition that is important
to the health of your arrays.
You can track the wellness of your arrays on the Wellness Dashboard. The Wellness Dashboard is also where
you can review wellness rules and tailor them to your configuration. You can configure rules to control the
escalation of detected health conditions on the storage arrays.
You use the Create Issue checkbox to control the conversion of wellness issues for a given condition or object
pair. If issue creation is disabled, case creation is automatically disabled as well.
To disable the alerts, you uncheck Create Issue on the Configure Wellness Rules page.
The support case options control the creation of support cases from wellness issues. When a case is created,
subsequent occurrences of the condition do not cause the creation of additional cases until the snooze period
expires. Most conditions (annotated with the icon) allow only all or nothing control. In other words, you
cannot disable case creation independently of issue creation.
Configure Wellness Rules
Procedure
On the Wellness Dashboard, click Configure Wellness Rules.
In the Configure Wellness Rules window, you can perform the following actions:
• To enable or disable case creation and notification for all arrays, check or uncheck Create Issue next
to the wellness rule that you would like to modify.
• To enable or disable case creation and notification for a specific array, perform the following steps.
1 Expand the wellness rule that you would like to enable or disable.
2 Check or uncheck the Create Issue checkbox next to a specific serial number.
Note After you disable automatic case generation for a certain condition, support cases are not created
automatically until you manually re-enable case generation.
Set-up Email Notifications for Alerts
You can subscribe to daily wellness emails that inform you of the status of your arrays.
Procedure
1 On the Wellness Dashboard, click Daily Summary Emails.
2 Enter an email address for delivery of the email alerts.
3 (Optional) You can click Test to send a test email to the email address that you indicated.
4 Click Add to add the email address.
5 Click Close to conclude the email alerts setup.
Copyright © 2020 by Hewlett Packard Enterprise Development LP. All rights reserved. 21Documentation Feedback: doc-feedback-hpe-nimble@hpe.com
Set a Snooze Period
Set a Snooze Period
The snooze period is the number of days that a reccurring condition updates an existing case before creating
a new case. You are notified via email when a case is created. For most conditions, you are not notified when
a case is updated.
Before you begin
You must have both Create Issue and Support Case Create checked on the Configure Wellness Rules
page before you can set a snooze period.
Procedure
1 Make sure that Support Case Created is checked.
You can only check the Support Case Created box if the Create Issue box is already checked.
2 Select the number of days that you want to snooze the support case in the Snooze column.
You can also select "Do Not Snooze."
3 To disable the alerts, uncheck Create Issue.
Copyright © 2020 by Hewlett Packard Enterprise Development LP. All rights reserved. 22Documentation Feedback: doc-feedback-hpe-nimble@hpe.com
Displaying VMware Analytics
Displaying VMware Analytics
If you have set up VMware to work with your HPE Nimble Storage environment,you can access the VMware
Virtualization pages on HPE InfoSight., which include pages for the following storage features:
• Datacenters
• Clusters
• ESXi Hosts
• Datastores
• VMs
From these pages, you can drill down to look at the most granular aspects of your data and then drill up to
get a more global view.
Note For information on how to set up VMware to work with your HPE Nimble Storage environment, refer to
the VMware Integration Guide on the InfoSight documentation portal.
Using VMware Virtualization Data to Evaluate Performance
You can view detailed information about virtual machines (VMs) hosted on HPE Nimble Storage arrays on
the VMware Virtualization pages located under Infrastructure > Virtualization:VMware. You can use the
analytics found on the pages in this menu to monitor latency and performance across the storage, network,
and host stack. This information allows you to address potential issues and improve performance. For example,
the data can show you where there are CPU bottlenecks and which hosts have the most CPU headroom.
That way you can move a VM to a host that has more resources.
You can use the VMware Virtualization analytics to identify potential issues, such as:
• Contentious VMs
• Overloaded hosts (CPU and memory)
• Latent VMs by datastore
• Location of the HPE Nimble Storage volumes on VMware datastores
To collect this data, InfoSight uses the HPE Nimble Storage array and the VMware vSphere APIs. You do
not need to install anything on the vCenter server.
You can quickly set up InfoSight to gather information about the HPE Nimble Storage array and VMware.
From the NimbleOS, you must register an HPE Nimble Storage vCenter plugin or enable a VMware sychronized
volume collection. From InfoSight, you must enable both the Streaming button for the array you want monitor
and the VMware button. For detailed information about enabling this information, see Enable InfoSight to
Collect VMware Information on page 23.
After InfoSight starts gathering this information, it can take up to 48 hours for the initial processing to complete
and show data. After that, depending on the data, it can be updated as frequently as every 5 minutes. .
Note InfoSight only provides analytics information about VMs and datastores that are hosted on an HPE
Nimble Storage array.
Enable InfoSight to Collect VMware Information
You can enable HPE InfoSight to provide VMware data for your system by registering either the vCenter
Server used with the HPE Nimble Storage vCenter Plugin or a VMware synchronized snapshot volume
collection and then enabling InfoSight to collect data from the array and VMware. You perform steps in the
NimbleOS GUI and in InfoSight. You do not need to install anything on the vCenter Server.
Copyright © 2020 by Hewlett Packard Enterprise Development LP. All rights reserved. 23Documentation Feedback: doc-feedback-hpe-nimble@hpe.com
Register the vCenter Plugin
Before you begin
• Your HPE Nimble Storage environment must be set up to work with VMware.
• At least one VM must be on a datastore.
• You must have an InfoSight account.
• Ports 80 and 443 must be open between the vCenter Server and the array.
Procedure
1 Configure the vCenter Plugin on one or more HPE Nimble Storage arrays.
a) Log into the array.
b) From the NimbleOS GUI, select Administration > VMware Integration.
c) Register the vCenter Server by entering the vCenter Server name and login credentials.
Note If there is already a registered vCenter Server, select Add Another vCenter to add your vCenter
Server.
Optional: If you do not want to use the HPE Nimble Storage vCenter Plugin, you can enable a VMware
synchronized snapshot volume collection and register it instead of a vCenter Server.
After you register the vCenter Server, it is a good practice to verify that the array can communicate with
vCenter Server.
2 Configure InfoSight to access the VMware data.
a) Log into InfoSight.
b) From the settings menu (the gear icon) select Telemetry Settings.
c) Locate the array you want to monitor and click the button for Steaming to On.
This button enables data streaming from the array.
d) In the same row, click the button for VMware to On.
This button allows data to be collected from VMware.
Note If you do not set the VMware button to On, you will only receive streaming data from the array.
You will not receive any VMware data.
What to do next
It takes up to 48 hours for InfoSight to process the vCenter registration and start streaming VMware and array
data.
When the data streaming begins, you can view the analytics for the different objects by choosing
Infrastructure > Virtualization > VMware > [Datacenters | Clusters | ESXi Hosts | Datastores | VMs].
Register the vCenter Plugin
The HPE Nimble Storage vCenter plugin is part of the NimbleOS. To take advantage of it, you must first
register the plugin with a vCenter Server.
Important The vCenter plugin is supported on ESX 5.5 update 1 and later.
Note The plugin is not supported for:
• Multiple datastores located on one LUN.
• One datastore spanning multiple LUNs.
• LUNs located on a storage device not made by HPE Nimble Storage.
You can register multiple vCenter plugins on the array. Each array that registers the vCenter plugin adds a
tab to the vSphere client.
Copyright © 2020 by Hewlett Packard Enterprise Development LP. All rights reserved. 24Documentation Feedback: doc-feedback-hpe-nimble@hpe.com
Use the NimbleOS GUI to Register the vCenter Plugin
Use the NimbleOS GUI to Register the vCenter Plugin
Before you begin
Use a vCenter account that has sufficient privileges to install a plugin (for example, the root account,
administrator@vsphere.local or any administrator account). You need to know the vCenter hostname or IP
address.
Procedure
1 From NimbleOS, select Administration > VMware Integration.
2 If the fields are not already filled, enter the vCenter name, subnet, vCenter server host name or IP address,
port, description, username, and password; and check the appropriate boxes to register the web client,
thin client, or VASA Provider.
3 Click Save.
If a Security Warning message appears, click Ignore.
4 Click Test Status to ensure that the plugin has been registered.
5 Relaunch the vSphere client.
Results
If the registration was successful, you can right click a datacenter, host cluster, host, or datastore and the
Nimble Actions menu appears.
Use the NimbleOS CLI to Register the vCenter Plugin
Before you begin
Use a vCenter account that has sufficient privileges to install a plugin (for example, the root account,
administrator@vsphere.local or any administrator account). You need to know the vCenter hostname or IP
address.
Procedure
1 Log into your array using the NimbleOS CLI.
2 At the command prompt, type:
vcenter --register [--extension {web|vasa}]
Add the following command option if you want to run the web client:
• --client web (for web client)
3 Relaunch the vSphere client.
Results
If the registration was successful, you can right click a datacenter, host cluster, host, or datastore and the
Nimble Actions menu appears.
Configure Arrays to Monitor your Virtual Environment
Procedure
1 Go to the settings menu (the gear icon) and click Telemetry Settings.
2 In the Array list, find the array for which you want to monitor the virtual environment.
3 In the Streaming column, make sure the On/Off box is set to On.
Copyright © 2020 by Hewlett Packard Enterprise Development LP. All rights reserved. 25Documentation Feedback: doc-feedback-hpe-nimble@hpe.com
View Overprovisioned VMs
You must have streaming enabled to send diagnostic content.
4 In the Diagnostics Content column, make sure the On/Off box is set to On.
View Overprovisioned VMs
Procedure
1 Go to Infrastructure > Virtualization > VMs.
2 To view the utilization compared to all other VMs, sort the list on the column headers for CPU usage or
memory usage.
3 To view the utilization of a particular VM, click the VM in the list.
In the headline bar, the allocation and usage for the VM is listed.
View VMs by IOPS and Latency
Procedure
1 Go to Infrastructure > Virtualization > VMs.
2 From the View list, select VM I/O Contention Trend.
3 Select a datastore from the Host list.
Results
The top 10 VMs are shown in tile graphs where the date is depicted along the bottom of the graph and the
number of IOPS or the degree of latency is represented by the depth of the color. The deeper the color of
the tile, the higher the number of IOPS or degree of latency.
You can run your cursor along the graph to view details about a particular date.
View VM Latency Due to the ESX Host
Procedure
1 Go to Infrastructure > Virtualization > VMs.
2 From the summary list, select the VM for which you want to view latency.
3 On the Performance tab, under Latency, the average latency is indicated for the host, the network, and
the storage.
View Contentious VMs Based on the Datastore
Procedure
1 Go to Infrastructure > Virtualization > VMs.
2 From the View dropdown list, select VM I/O Contention Treemap.
3 Select a vCenter or DataCenter from the Host list.
Copyright © 2020 by Hewlett Packard Enterprise Development LP. All rights reserved. 26You can also read