Estimation of Determinants of Farmland Abandonment and Its Data Problems
←
→
Page content transcription
If your browser does not render page correctly, please read the page content below
land
Article
Estimation of Determinants of Farmland Abandonment and Its
Data Problems
Shinichi Kitano

                                          Division of Natural Resource Economics, Graduate School of Agriculture, Kyoto University, Oiwake-cho,
                                          Kitashirakawa, Sakyo-ku, Kyoto 606-8502, Japan; kitano.shinichi.4s@kyoto-u.ac.jp; Tel.: +81-(0)-75-753-6203

                                          Abstract: Abandoned farmland is particularly problematic in developed countries where agriculture
                                          has a comparative disadvantage in terms of effective use of land resources invested over time. While
                                          many studies have estimated the causes of these problems, few have discussed in detail the impact
                                          of data characteristics and accuracy on the estimation results. In this study, issues related to the
                                          underlying data and the estimation of the determinants of farmland abandonment were examined.
                                          Most previous studies on farmland abandonment in Japan have used census data as the basis of
                                          their analyses. However, census data are recorded subjectively by farmers. To address this, surveys
                                          of abandoned farmland are being conducted by a third party, and the results are compiled into a
                                          geographic information system (GIS) database. Two types of datasets (subjective census data and
                                          objective GIS data) were examined for their estimation performance. Although the two sets of data are
                                          correlated, there are considerable differences between them. Subjective variables are compatible with
                                          subjective data, and objective variables are compatible with objective data (meaning that parameters
                                          are easily identified). Original data for analysis, such as policy variables, are compatible with
                                          objective data. In policy evaluation research, attention should be paid to objective data collection.


                                          Keywords: farmland abandonment; agricultural production; land use; subjective and objective data;
Citation: Kitano, S. Estimation of
                                          geographic information system; food security
Determinants of Farmland
Abandonment and Its Data Problems.
Land 2021, 10, 596. https://doi.org/
10.3390/land10060596
                                          1. Introduction
Academic Editors: Ilan Stavi and                Many developed countries, such as Japan and those in the European Union (EU), have
Manuel Pulido Fernádez                    been experiencing farmland abandonment problems for decades. The determinants of
                                          abandonment are a key concern for government policymakers and researchers [1–7]. This
Received: 8 May 2021                      is the case because generally, farmland has been cultivated over a long period of time and
Accepted: 30 May 2021                     once it is degraded, it not only incurs huge costs to restore but also has a significant impact
Published: 4 June 2021                    on the surrounding ecosystem [8]. In addition, farmland is an important and essential
                                          food production factor and, therefore, the prevention of abandonment is an important
Publisher’s Note: MDPI stays neutral      component of food security [3,9–11].
with regard to jurisdictional claims in         There have been many analyses of the causes of farmland abandonment but relatively
published maps and institutional affil-   little discussion of what kind of data should be used in these analyses. In Japan, where
iations.                                  the farmland abandonment problem is becoming increasingly serious, many researchers
                                          have analyzed the determinants of farmland abandonment [12–19]. They have used data
                                          from the census surveys conducted by the Ministry of Agriculture, Forestry and Fisheries
                                          (MAFF) every five years as the basis [20]. However, these data are based on subjective
Copyright: © 2021 by the author.          abandoned areas as declared by farmers. Therefore, it may contain measurement errors
Licensee MDPI, Basel, Switzerland.        based on subjective judgments and farmers’ social desirability biases [21].
This article is an open access article          Fortunately, in Japan, apart from these subjective data, field surveys are conducted
distributed under the terms and           under the initiative of agricultural committees (called “Nougyo iinkai”) established in
conditions of the Creative Commons        each municipality, with some of these surveys compiled into databases. This type of
Attribution (CC BY) license (https://
                                          survey, called “farmland patrol,” is regulated by the amended Agricultural Land Act and
creativecommons.org/licenses/by/
                                          is conducted at least once a year on all farmland [22,23]. However, this information is not
4.0/).

Land 2021, 10, 596. https://doi.org/10.3390/land10060596                                                         https://www.mdpi.com/journal/land
Land 2021, 10, 596                                                                                               2 of 17

                     available to the public because it contains sensitive personal information. To conduct this
                     analysis, the research institute to which the author belongs signed an academic cooperation
                     agreement with a municipality, Yabu City, Hyogo Prefecture, Japan, to obtain permission to
                     use these databases, which are managed using GIS software. The difference in performance
                     between these (GIS-based) data (GBD) and the conventional (census-based) data (CBD)
                     was examined.
                           In Japan and in many other countries where agriculture has lost its comparative
                     advantage due to economic development, the increase in abandoned farmland has become
                     a major problem. Japan was one of the first Asian countries to achieve industrialization, and
                     this economic development has increased the opportunity cost of agricultural labor [24].
                     However, it was inevitable that Japan would lose its comparative advantage in agriculture
                     due to the inelastic supply of farmland and the small size of farmland per farmer, which
                     would consequently increase the transaction costs of farmland among farmers [25–27]. In
                     addition, socioeconomic factors such as a declining and aging population have led to a
                     shortage of agricultural labor, so the abandonment of farmland is accelerating. In other
                     words, extreme labor-saving and capital-intensive agriculture have developed, and rice
                     farming, the most important part of Japanese agriculture, requires a huge initial investment,
                     making it difficult for the younger generation to easily gain entry. In developed countries,
                     farmland abandonment has become a national food security issue in the event of shocks
                     such as crop failure and embargoes [28,29]; thus, the Japanese government has positioned
                     its prevention as an important policy issue [30,31]. In addition, farmland abandonment is
                     accompanied by a loss of multifunctionality in agriculture [32].
                           An increase in abandoned farmland means a decrease in the essential factor of agri-
                     cultural production, and the cost of farmland reclamation is enormous. It also has a
                     negative impact on the government’s long-standing efforts to increase food self-sufficiency
                     in Japan [33]. Given this situation, the Japanese government clearly states in its Basic Plan
                     for Food, Agriculture and Rural Areas (approved by the Cabinet on 31 March 2020) that
                     the prevention of abandoned farmland will be addressed as follows [9].
                          In order to prevent and eliminate abandoned farmland, we will strategically carry out
                          measures such as promoting discussions on the future use of farmland in communities
                          and villages through “payments for activities to enhance multifunctionality” and “direct
                          payments to farmers in hilly and mountainous areas,” supporting collective actions,
                          mitigating damage to crops through bird and animal damage, promoting the consolidation
                          of farmland through “farmland intermediary management projects,” and effectively
                          implementing the development of farmland infrastructure.
                           As referenced, the prevention of farmland abandonment is closely related to payments
                     for activities to enhance multifunctionality (PAEMF) and direct payments to farmers in
                     hilly and mountainous areas (DPFHM) among the Japanese direct payment schemes. The
                     DPFHM scheme, in particular, is designed to compensate for the difference in produc-
                     tion costs between the flatlands and the group of hilly and mountainous areas, and it
                     strongly supports agriculture in the disadvantaged areas in Japan. On the other hand,
                     it imposes a rule that all subsidies received during the support period must be returned
                     when abandoned farmland occurs, which effectively functions as a policy “condition-
                     ality” [7,34,35]. Thus, the accuracy of data used for farmland abandonment analysis is
                     important to accurately estimate the causal effects of these policies.
                           A review paper by Huang et al. [36] points out that research on farmland abandon-
                     ment has increased in the last decade. They argue that among the factors of farmland
                     abandonment, socioeconomic factors are the most important and that research on them
                     will continue to be important. Until now, how abandoned farmland affects the natural
                     environment and ecosystems has been important in research fields such as landscape, and
                     similar research has been conducted in Japan [37]. Terres et al. [29] examined the drivers
                     of farmland abandonment in the EU using large-scale and extensively aggregated data.
                     However, they acknowledged that farmland abandonment is a local phenomenon and that
                     local data are needed to estimate its risk.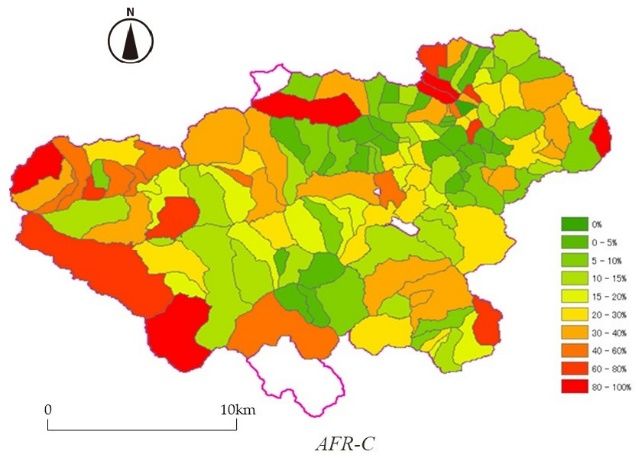
Land 2021, 10, 596                                                                                           3 of 17

                           Corbelle-Rico et al. [38] also conducted a causal analysis of long-term farm abandon-
                     ment in Spain using categorical data and multinomial logistic models and found that the
                     phenomenon is a complex local phenomenon that needs to be analyzed using at least
                     municipal-level data. Shi et al. [39] used GIS-processed data and multiple regression analy-
                     sis to analyze the factors of agricultural land abandonment in mountainous areas in China,
                     but the analysis does not consider a sufficient number of socioeconomic factors and related
                     policies. The community data used in this study were much more localized and allowed
                     the current analysis to be tailored to local conditions (in this study, each community has
                     only about 20 farmers on average).
                           In Japan, most studies on the farmland abandonment problem use data from the
                     agricultural censuses. One study was conducted in 2011 by Takayama and Nakatani [16]
                     using a rich dataset, which covered six prefectures in Japan. However, they used census
                     data prior to 2000, with a binary dependent variable indicating whether a community
                     had abandoned farmland. Now that almost every community has a sizeable amount of
                     abandoned farmland, analyses need to focus on the percentage of abandoned farmland
                     area rather than a simple binary variable.
                           Early studies in 1998 of farmland abandonment in Japan used data on individual
                     farmers from agricultural census data, for example, Senda [12] and Senda [13]. Although
                     individual-level data, now unavailable due to restrictions of the Personal Information
                     Protection Law, are attractive, they have the same problem as that in the study by Takayama
                     and Nakatani [16], as they are used as binary variables of farmland abandonment. In
                     addition, these studies did not consider variables related to regional agricultural structure,
                     so no implications for regional policies were obtained.
                           In 2018, Su [19] analyzed the determinants of farmland abandonment using GIS data,
                     and in 2014 Matsui [17] developed an estimation model for the area of abandoned farmland
                     using machine learning (generalized linear models, random forest, and multivariate adap-
                     tive regression splines). However, the data used in these studies were also census-based.
                     The current study used data based on objective measurements by a third party rather than
                     census data based on subjective statements about farming and farmland. The novelty of
                     this study lies in the fact that it used objective data and GIS data-processing (by ArcGIS
                     10.8) to accurately estimate the abandoned farmland rate model, then the data’s estimation
                     result was compared with the result from conventional data, ultimately deriving a new,
                     more accurate estimation result.
                           Specifically, the survey-based data measured by a third person were defined as objec-
                     tive data (GBD), while the conventional data reported by farmers were treated as subjective
                     data (CBD). After examining the characteristics of both types of data, their performance
                     was compared using a statistical analysis of the determinants of farmland abandonment.
                     The second objective was to refine the model of these mechanisms by adding new variables,
                     such as altitude and slope maps, bird and animal damage data, and direct subsidy payment
                     data in terms of monetary amounts, which were obtained from Yabu City. These data have
                     not been used in previous similar analyses. The statistical models used to analyze the
                     determinants of abandoned farmland were the ordinary least squares (OLS) method and a
                     modified version of it, the Tobit model.
                           The structure of this article is as follows. Section 2 provides an overview of the
                     author’s field of study, the estimation model and the data, the most important element of
                     this study. Section 3 presents the estimation results and a comparison of the models. The
                     implications of the results and the limitations of this study are discussed in Section 4, and
                     the conclusion summarizes the findings of this study.

                     2. Method and Data
                     2.1. Study Area
                          In this study, data from Yabu City, Hyogo Prefecture, Japan were used. Yabu City
                     is located in the center of the Tajima area in Hyogo Prefecture, with 84% of its total
                     area covered by forest [40]. Because of its proximity to the Sea of Japan, the region is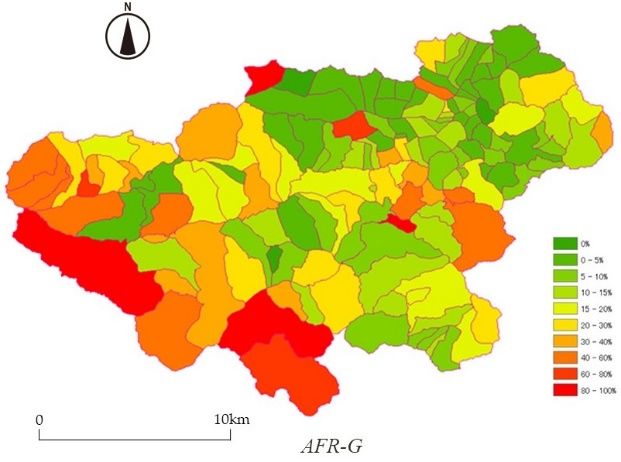
2. Method and Data
2.1. Study Area
Land 2021, 10, 596 In this study, data from Yabu City, Hyogo Prefecture, Japan were used. Yabu City 4 of 17is
located in the center of the Tajima area in Hyogo Prefecture, with 84% of its total area
covered by forest [40]. Because of its proximity to the Sea of Japan, the region is character-
ized by high humidity
characterized and rainfall
by high humidity andin summer
rainfall and significant
in summer snowfallsnowfall
and significant in winter. inAccord-
winter.
ing to the MAFF’s classification of agricultural regions, 8 of the 14 administrative
According to the MAFF’s classification of agricultural regions, 8 of the 14 administrative districts
in Yabuin
districts City
YabuareCity
categorized as hillyas
are categorized areas
hillyand 6 as
areas mountainous
and areas, making
6 as mountainous it a typical
areas, making it a
hilly and mountainous area. In addition, 12 of the 14 districts are categorized
typical hilly and mountainous area. In addition, 12 of the 14 districts are categorized as paddy- as
based districts
paddy-based by the by
districts MAFF, with the
the MAFF, majority
with of farmers
the majority engaged
of farmers in ricein
engaged farming.
rice farming.
Figure11shows
Figure showsthethelocation
locationandandtopography
topographyof ofYabu
YabuCity.City.The
Thewestern
westernpartpartofofthethe
city is mountainous, with some areas rising to over 1000 m in altitude. From
city is mountainous, with some areas rising to over 1000 m in altitude. From here, several here, several
riversflow
rivers floweastward
eastwardalong
alongthethevalleys,
valleys,joining
joiningthe
theMaruyama
MaruyamaRiver,River,aamajor
majorriver
riverininthethe
eastern part of the city. Along the valleys around the tributaries and the
eastern part of the city. Along the valleys around the tributaries and the Maruyama River,Maruyama River,
thereare
there areflat
flatareas
areaswith
withgood
goodconditions
conditionsforforpaddies,
paddies,where
wherelarge-scale
large-scalerice
ricefarming
farmingtakes
takes
place. The
place. The light
light blue
bluearea
areain inthe
thefigure
figurereflects
reflectsaalow
lowaltitude
altitudemainly
mainlydominated
dominatedby byrice
rice
paddiesthat
paddies thatisisdensely
denselypopulated.
populated.
Figure 1. Location and topography of Yabu City and its agricultural community.
Figure 1. Location and topography of Yabu City and its agricultural community.
In 2015, the average area of farmland per farmer in Yabu City was 0.41 ha, which was
quite In 2015,
small the average
compared witharea
theof farmland
national per farmer
average at theintime
Yabuof City
1.42 was 0.41 ha,Prefecture:
ha (Hyogo which was
quite small compared with the national average at the time of 1.42 ha (Hyogo
0.62 ha) [20]. The proportion of subsistence farmers was also high at 59%, Prefecture:
compared with
38%
0.62nationwide
ha) [20]. The (Hyogo: 42%)of
proportion [20]. The abandoned
subsistence farmersfarmland
was also rate
high(AFR) reached
at 59%, 23.5%with
compared in
terms of area, which was much higher than the national average of 11.4%
38% nationwide (Hyogo: 42%) [20]. The abandoned farmland rate (AFR) reached 23.5% in [20]. In terms of
AFR byoffarmer
terms type, the
area, which wasrate
muchwashigher
higherthanfor subsistence
the nationalfarmers
average(32.2%)
of 11.4% and landholding
[20]. In terms of
non-farmers (62.3%) than for commercial farmers (8.2%) [20]. The national
AFR by farmer type, the rate was higher for subsistence farmers (32.2%) and landholding AFR for land-
holding non-farmers was 31.1%; it is likely that more farmland abandonment
non-farmers (62.3%) than for commercial farmers (8.2%) [20]. The national AFR for land- occurred
because
holdingfarmers retired
non-farmers from
was farming
31.1%; it is due to that
likely small-scale and unfavorable
more farmland conditions
abandonment for
occurred
agricultural production [20]. The average age of farmers was 61.9 years, which was higher
because farmers retired from farming due to small-scale and unfavorable conditions for
than the national average of 60 years. In particular, 58.2% of farmers in Yabu City were over
agricultural production [20]. The average age of farmers was 61.9 years, which was higher
70 years old. Since the national average for this age group was 46.9%, the farming commu-
nity of Yabu City was considerably aged. The percentage of farm managers over 70 years
old had reached 49.2%, which was likely to accelerate future farmland abandonment [20].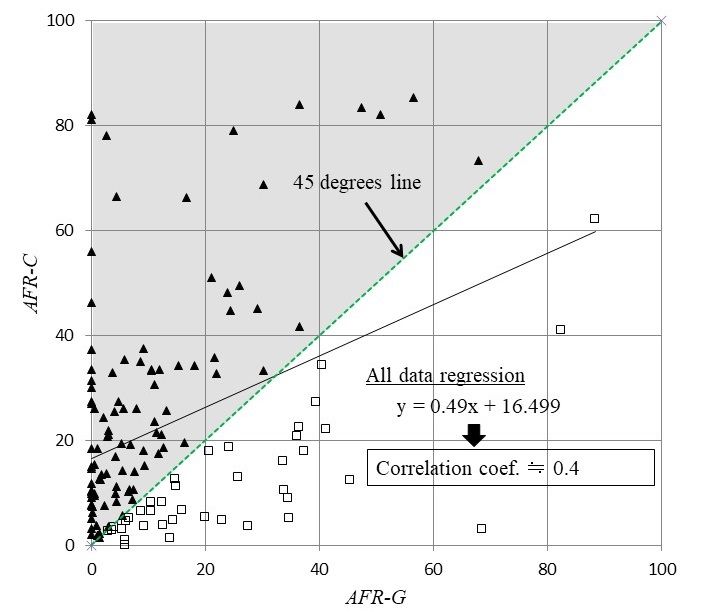
Land 2021, 10, 596                                                                                                5 of 17

                     2.2. Data
                           The characteristics of the data and their handling were the most important elements of
                     the study. In addition, to analyze the causes of farmland abandonment precisely, GIS data
                     in 2010, which have not been used in many similar studies targeting Japan, were used. In
                     this subsection, the details of the GIS data and then the characteristics and problems of the
                     two types of AFRs, which are used as the dependent variables in the regression analysis,
                     are introduced. Finally, the socioeconomic variables that affect farmland abandonment
                     are explained, along with their hypotheses. The descriptive statistics of the data are
                     summarized in Table 1. Due to the academic agreement with Yabu City, the detailed
                     farmland GIS data used could be obtained. It should be noted that since the GIS data were
                     available only for 2010, the 2010 data were used for the other variables.

                     Table 1. Descriptive statistics.

                                                                                                     Mean        s.d.
                                                            GIS
                             Abandoned farmland ratio from GIS (objective data) (%): AFR-G           15.18      22.05
                                 Average altitude of farmlands in the village (m): AVAL              169.55     141.57
                                Average slope of farmlands in the village (degree): GRAD             10.36       5.04
                                                            CBD
                           Abandoned farmland ratio from CBD (subjective data) (%): AFR-C            22.41      20.75
                                        Farmland area in community (ha): AREA                        16.26      10.87
                                     Percentage of paddy fields in AREA (%): PPUD                    67.74      17.51
                                      Percentage of rented out farmland (%): ROUT                    20.57      15.20
                               Percentage of land tenure non-farm households (%): NFHH               34.05      18.16
                                   Number of non-farm household producers: NFHP                       0.01       0.12
                                     Number of tractors per farm household: TRAC                      0.35       0.23
                                    Variation (Gini coefficient) in farmland size: GINI               0.18       0.14
                                                            YOD
                                         Number of deer caught annually: DEER                         4.14       6.99
                                        Number of boars caught annually: BOAR                         0.72       1.76
                      Direct payments to farmers in hilly and mountainous areas (yen/FHH): DPFHM      77.5      220.76
                       Payment for activities to enhance multi-functionality (yen/FHH): PAEMF         0.92       1.44
                                                             N                                               138
                     Note: YOD = Yabu Original Data. FHH = Number of farm households in community.

                     2.2.1. GIS Data
                          First, the abandoned farmland rate, the altitude and the slope of each agricultural
                     land plot were calculated from the information of 18,600 agricultural land plots in the
                     farmland ledger of Yabu City using GIS software (ESRI’s ArcGIS). Each polygon indicates
                     an individual agricultural land plot contains information regarding the results of farmland
                     patrols conducted by the agricultural committee. All of this information has been compiled
                     into a GIS database by Yabu City. Therefore, it is possible to calculate the AFR-G (abandoned
                     farmland ratio from GIS) for each community (Table 1) by taking the ratio of abandoned
                     farmland area to all farmland area derived from each polygon. The use of these databases
                     is one of the innovations and objectives of this research, as there has been no research using
                     such databases in Japan. Finally, a GIS database of the 138 agricultural communities was
                     compiled and used for the analysis.
                          Figure 2 shows an example of the GIS map using an aerial photograph. The plots
                     surrounded by blue lines are paddy fields; the plots surrounded by green lines are farmland
                     excluding paddy fields, and the red areas are abandoned farmlands. The yellow areas refer
                     to plots that are not currently being cultivated but are expected to be cultivated in the near
                     future. Therefore, these yellow areas were excluded from the list of abandoned farmlands.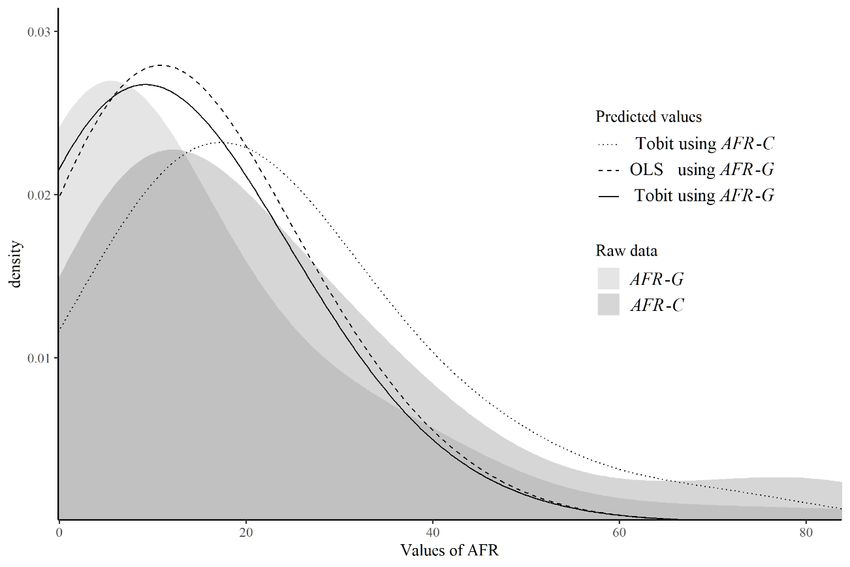
communities was compiled and used for the analysis.
Figure 2 shows an example of the GIS map using an aerial photograph. The plots
surrounded by blue lines are paddy fields; the plots surrounded by green lines are farm-
land excluding paddy fields, and the red areas are abandoned farmlands. The yellow ar-
Land 2021, 10, 596 eas refer to plots that are not currently being cultivated but are expected to be cultivated
6 of 17
in the near future. Therefore, these yellow areas were excluded from the list of abandoned
farmlands.
Figure
Figure 2.
2. GIS
GIS data
data of
of farmland
farmland abandonment
abandonment in
in Yabu City.
Yabu City.
In
In addition,
addition, GISGIS data
data on on the
the average
average altitude
altitude andand slope
slope ofof the
the plots,
plots, which
which represent
represent
the
the geographical
geographical conditions
conditions of of each
each community,
community, was was created.
created. ForFor the
the average
average altitude, the
altitude, the
10
10 mm mesh
mesh data
data ofofthe
the“Fundamental
“FundamentalGeospatial GeospatialInformation”
Information”published
published bybythethe Geospa-
Geospatial
tial Information
Information Authority
Authority of Japan
of Japan waswas used used to create
to create an an altitude
altitude model
model in GIS
in GIS as shown
as shown in
in Figure
Figure 1 [41].
1 [41]. TheThe firststep
first stepwaswastotocreate
createaatriangulated
triangulatedirregular
irregularnetwork
network (TIN)
(TIN) surface
surface
and
and to tointerpolate
interpolatethe theshape
shape [42] (TIN
[42] (TINwaswas created fromfrom
created digital elevation
digital modelmodel
elevation data using
data
the
using ArcGIS 3D Analyst
the ArcGIS 3D Analyst function). Shape Shape
function). interpolation is the is
interpolation process of adding
the process z-infor-
of adding z-
mation, which is height information, to the x- and y-coordinates of polygons. All altitudes
information, which is height information, to the x- and y-coordinates of polygons. All
calculated for all plots
altitudes calculated forinalleach community
plots were aggregated
in each community were and then used
aggregated and to then
calculate
usedthe to
average
calculatealtitude (AVAL)
the average (Table(AV
altitude 1). AL)
A higher
(Tableaverage altitudeaverage
1). A higher means altitude
that the farmland
means that is
likely to belong
the farmland to a hilly
is likely and mountainous
to belong to a hilly andarea, and its conditions
mountainous area, andfor itsagriculture
conditions are for
more severe.are
agriculture Therefore,
more severe. the sign of the coefficient
Therefore, the signofofthisthevariable wasofexpected
coefficient to be pos-
this variable was
itive.
expected to be positive.
Other
Other data
data indicating
indicating field field conditions
conditions include
include the average slope
the average slope (gradient)
(gradient) of of the
the
farmland (the unit is “degree”). Similar to the average altitude, it was calculated from the
farmland (the unit is “degree”). Similar to the average altitude, it was calculated from the
altitude
altitude model
model using
using GIS.
GIS. It It is
is calculated
calculated as as the ratio of
the ratio of the
the vertical
vertical change
change to to horizontal
horizontal
change between
change between anyany twotwo plots
plots inin the
the altitude
altitude model.
model. InIn the
the case
case of
of this
this gradient
gradient variable
variable
(GRAD) (Table 1), the sign of the coefficient is expected to be positive because the burden
(GRAD) (Table 1), the sign of the coefficient is expected to be positive because the burden
on agricultural
on agricultural work
work is is greater
greater and and itit is
is more
more difficult
difficult for
for farmers
farmers to to increase
increase plot
plot size.
size.
2.2.2. Farmland Abandonment Rate: Objective vs. Subjective Data
This section describes two types of AFRs that served as the dependent variables for
the regression. The AFR-G was calculated from the results of the farmland patrol survey
and GIS, referred to as objective data. The conventional AFR-C (abandoned farmland ratio
from CBD) (Table 1) is derived from census data, referred to as subjective data. The effect
of the differences in the data on the estimation performance is this study’s most important
and interesting finding because it suggests a reconsideration of the data used.
Figure 3 presents a comparison between two types of AFRs, where AFR-G is shown on
the x-axis and AFR-C on the y-axis. Although these two AFRs have a positive correlation,Land 2021, 10, 596 7 of 17
Land 2021, 10, x FOR PEER REVIEW 2 of 19
each municipality, with some of these surveys compiled into databases. This type of sur-
there is a considerable difference
vey, called between
“farmland patrol,” them.
is regulated by theThere
amended are two major
Agricultural Land Actreasons
and is for this. First,
while the AFR-C isconducted
based at least once a year on all farmland [22,23]. However, this information is not
on people, the AFR-G is based on territory. In the
available to the public because it contains sensitive personal information. To conduct this
case of AFR-C,
the abandoned farmland is notinstitute
analysis, the research necessarily
to which thelocated in the
author belongs signedcommunity where the farmer
an academic coopera-
tion agreement with a municipality, Yabu City, Hyogo Prefecture, Japan, to obtain per-
who reported it lives.
mission Therefore,
to use these databases, AFR-C
the which differs
are managed from
using the AFR-G,
GIS software. which
The difference in is calculated
from observed abandoned farmland
performance between that is data
these (GIS-based) definitely located
(GBD) and the in the
conventional community.
(census-based)
data (CBD) was examined.
In Japan and in many other countries where agriculture has lost its comparative ad-
Figure 3. Correlation between
vantage AFR-G development,
due to economic and AFR-C.the increase in abandoned farmland has become
a major problem. Japan was one of the first Asian countries to achieve industrialization,
and this economic development has increased the opportunity cost of agricultural labor
The second reason is related to Japan’s Agricultural Land Act. Under this act, unless
[24]. However, it was inevitable that Japan would lose its comparative advantage in agri-
there is a special reason, those
culture due who own
to the inelastic supply agricultural
of farmland and theland areofrequired
small size farmland perto “ensure the proper
farmer,
which would consequently increase the transaction costs of farmland among farmers [25–
and efficient use of agricultural land” [22]. In addition, Japanese farmers have a norm that
27]. In addition, socioeconomic factors such as a declining and aging population have led
they must not disturb other farmers by neglecting their own farmland [43]. This is because,
for example, paddy fields with many weeds attract pests and wildlife. Hence, farmers have
an incentive to manage their farmland, even if they have no intention of cultivating it for
production. However, the AFR-G may be estimated as smaller than the AFR-C because it
depends on whether the farmland is objectively uncultivable, regardless of the intention
of the owning farmer. AFR-G is a more appropriate indicator from the perspective of
food security because some of the abandoned areas in AFR-G include farmland that is
managed properly. Figure 4 illustrates the two abandoned farmland rates (AFR-G and
AFR-C). Generally, in northeastern Yabu, where there are many flat areas, the AFRs are low.
However, some communities show significant differences between the two AFRs.
Until now, AFR-C data have been used in the analysis of farmland abandonment
problems in Japan. The AFR-G, introduced in this study for the first time, was measured by
a farmland patrol. Therefore, the AFR-G can be considered to be more objective than the
declaration-based AFR-C. However, which dataset should be used depends on the purpose
of the analysis. In recent years, many community-based agricultural policies have been
implemented in Japan, such as the Japanese direct payment system [33]. In this context,
it is important to pay attention to appropriate community-based data collection when
conducting sophisticated policy evaluations. This study assumed that objective data are
more desirable for such an evaluation and examined measurement error and estimation
bias when using conventional data.Land 2021,
Land 10,10,
2021, x FOR
596 PEER REVIEW 8 of8 18
of 17
(a) (b)
Figure 4. Distribution
Figure of of
4. Distribution abandoned farmland
abandoned rate.
farmland rate. AFR-G
(a)(a) and
AFR-G AFR-C.
(b)(b)
and AFR-C.
Until
2.2.3. now, AFR-C dataData
Community-Based have been used in the analysis of farmland abandonment
problems This insubsection AFR-G, introduced
Japan. Thedescribes the explanatory in thisvariables
study forinthe thefirst time, was
estimation measured
model and the
byhypotheses
a farmlandregarding
patrol. Therefore,
their impact theonAFR-G
the AFR. can Since
be considered
the AFR isto be more objective
aggregated than
on a community
thebasis,
declaration-based AFR-C.
the explanatory variables must also be based on community data. Many studiesthe
However, which dataset should be used depends on have
purpose of the analysis.
used agricultural In recent years,data
community-based many community-based
from Japanese censuses agricultural policies
[44]. For more haveon
details
been
suchimplemented
data, please in Japan,
refer such asstudies
to previous the Japanese
[7,45–47].direct payment
Among thesesystem [33]. In
data, seven this con-
determinants
text, it is important
shown in Table 1to paywere
that attention
likelytotoappropriate
influence AFR community-based
were used for the data collection when
analyses.
conducting sophisticated
The first is the AREA, policywhich
evaluations.
shows the Thisareastudy of assumed
farmlandthat objective
in the data areAs
community.
more
showndesirable for 1,
in Table such
the an evaluation
average area isand examined
16.2 ha, which measurement
is close to the error and estimation
average of 15 ha in
bias
thewhen
Kinki using conventional
region where Hyogo data.Prefecture is located. If the average number of farmers
is homogeneous among communities, it is expected that the larger the area of farmland
2.2.3.
in aCommunity-Based
community, the greater Data the burden of collective action for farmland management,
andThis
thus subsection
the higherdescribes the explanatory
the abandonment variables
rate. Next, PPUD, in which
the estimation
represents model and the
the percentage
hypotheses regarding their impact on the AFR. Since the AFR is aggregated on a commu-
of paddy field area to all farmland, is expected to have a negative impact on the AFR,
nity basis, the explanatory variables must also be based on community data. Many studies
because paddy fields are generally found in every community in Japan and, owing to high
have used agricultural community-based data from Japanese censuses [44]. For more de-
tariffs, labor-saving technology for rice farming has advanced considerably. ROUT is the
tails on such data, please refer to previous studies [7,45–47]. Among these data, seventhe
percentage of rented-out farmland in the community. This variable is higher when
farmland market
determinants shownworks
in Tablewell, and were
1 that if so, the efficient
likely use of farmland
to influence AFR wereisused expected to anal-
for the reduce
farmland abandonment.
yses.
The NFHH the NFHP
first isand AREA, are whichvariables
shows related
the areato ofthe ownersinand
farmland users of farmland
the community. in the
As shown
community, respectively. NFHH indicates the percentage of landholding
in Table 1, the average area is 16.2 ha, which is close to the average of 15 ha in the Kinki non-farmers who
own farmland but do not cultivate it and rent out all their
region where Hyogo Prefecture is located. If the average number of farmers is homogene- farmland. These are mainly
ouspeople
among who have retired
communities, from
it is farming
expected thatand, if the transaction
the larger cost of renting
the area of farmland out their
in a commu-
farmland exceeds the land rent, they may abandon the farmland without renting it out.
nity, the greater the burden of collective action for farmland management, and thus the
Hence, an increase in NFHH is expected to increase the AFR. NFHP indicates the number of
higher the abandonment rate. Next, PPUD, which represents the percentage of paddy
agricultural management entities (non-farm household producers) other than family farms
field area to all farmland, is expected to have a negative impact on the AFR, because paddy
in the community. In recent years, they have increased their presence in Japan, and they
fields are generally found in every community in Japan and, owing to high tariffs, labor-
are expected to become the main lessees of farmland, playing a role in reducing farmland
saving technology for rice farming has advanced considerably. ROUT is the percentage of
abandonment [48].
rented-out farmland in the community. This variable is higher when the farmland market
TRAC indicates the number of tractors owned per farmer. The use of tractors enables
works well, and if so, the efficient use of farmland is expected to reduce farmland aban-
labor-saving management and is expected to reduce farmland abandonment in areas where
donment.
there is a shortage of agricultural labor force [17]. In addition, GINI is an indicator of
NFHH and NFHP are variables related to the owners and users of farmland in the
the diversity of farm sizes in the community. The greater the diversity, the more diverse
community, respectively. NFHH indicates the percentage of landholding non-farmers
the farmers’ motivation toward agriculture, and consequently, collective action for the
who own farmland
management but do notand
of farmland cultivate it and
irrigation rentnot
may outwork
all their
well.farmland.
However, These are mainly
a stratified farm
people who have retired from farming and, if the transaction
size may lead farmers to share roles more efficiently. Hence, the expected sign conditioncost of renting out their is
farmland
not clear. exceeds the land rent, they may abandon the farmland without renting it out.
Hence, an increase in NFHH is expected to increase the AFR. NFHP indicates the numberLand 2021, 10, 596 9 of 17
2.3. Confidential Data
In addition to the data presented in the previous subsections, new data (animal
damage and the amounts of agricultural subsidies) that had not been used in previous
studies was used. As mentioned above, thanks to the agreement with Yabu City, GIS data
of farmland at an individual level and confidential data could be accessed. Currently,
published CBD aggregated for each community do not include some information when the
number of households in a community is less than two to protect personal information [49].
In other words, the CBD used in previous studies excluded confidential data (ECD).
However, thanks to our agreement, all data from the 138 communities (ACD) were available
(there are 144 agricultural communities in Yabu City, but the data of six communities were
not available due to a lack of farmers or farmland). However, ECD only contain data on
105 communities. The estimation bias due to ECD was also examined (see Appendix A).
In addition to CBD (ACD), two original data types (YOD) from Yabu City were used.
The first were data on animal damage caused by wild birds and animals, mainly in hilly
and mountainous areas, with a total of 15.8 billion yen in damage nationwide. This is
one of the most important reasons why farmers abandon cultivation [50]. Specifically,
the data obtained were the number of deer and wild boars captured in each community
(DEER and BOAR). Deer and wild boar account for the most and second most damage,
respectively; the data were therefore used as proxy variables for animal damage. Naturally,
these variables are expected to be positively correlated with damage and, consequently,
with the AFR.
Other new variables were the amounts of agricultural subsidies of the DPFHM and
PAEMF. Several studies have analyzed the impact of these policies on AFR, but they have
used only binary variables indicating whether they are implemented in a community.
The DPFHM scheme is designed to fill the productivity gap between flatlands and geo-
graphically disadvantaged areas and to prevent abandonment of cultivation [51], while the
PAEMF scheme is designed to maintain agricultural multifunctionality that involves exter-
nal economies [52]. Both are community-based schemes, and two variables, DPFHM and
PAEMF, were created by dividing the amount received in the community by the number of
farmers (beneficiaries). Naturally, the expected effects of these variables are negative [7,47].
2.4. Estimation Method and Performance Check
A regression model was used to derive the determinants of farmland abandonment.
The AFR percentage was used as the dependent variable. The unit of observation was
the agricultural community within the administrative boundary [45]. However, in some
communities, there is no farmland abandonment; therefore, the data inevitably contain
many zeros. Hence, applying the usual OLS with these data will lead to a bias in the
parameter estimates. To overcome this problem, in addition to the OLS estimation, the
Tobit model was used for the censored data [53].
The Tobit model, which corresponds to censored data, is an approach that uses latent
variables like used in binary choice models such as the logit model. Placing the observed
continuous variable, AFR, as y, and its latent variable as y∗ , the Tobit model can be
expressed as Equation (1).
0
yi∗ = xi β + ui
y∗ y∗ > 0
yi = { i ∗i (1)
0 yi ≤ 0
0
where x i is an explanatory variable that affects AFR, β is the parameter to be estimated,
and u is the error term, which follows a normal distribution with mean 0 and variance
0
σ 2 . The other variables shown in Table 1 and in the previous subsections are used for x i .
By testing the coefficients β of these variables, it is possible to identify the determinants
of farmland abandonment. The likelihood function is formed by the product of densitiesLand 2021, 10, 596 10 of 17
of y i ( y i∗ > 0) and the probability when y i = 0 is estimated using the maximum
likelihood method.
Furthermore, the predicted values of the estimation results were used to compare
the performance between the subjective and objective data. The root mean squared er-
ror (RMSE) and mean absolute error (MAE) were used as performance measures of the
predicted values [54]. In addition, I used kernel density estimation of the predictive dis-
tribution to compare performance [55]. In the analysis of bias when using CDC against
ACD, whether there is a difference in each coefficient between both estimates was checked
by conducting Welch’s pairwise t-test. Finally, whether the estimation bias is larger for
AFR-C or AFR-G was examined by calculating the ratio of the estimated coefficients and
computing their root mean square (RMS).
3. Results
3.1. Estimation Results
The estimation results are shown in Table 2. The left side shows the results with
AFR-C as the dependent variable, and the right side shows the results with AFR-G as the
dependent variable. There is no difference in the coefficients for AFR-C between the OLS
and Tobit models because there are no censored observations among the AFR-C dependent
variables. However, due to the robust estimation of the Tobit model, the significances of
the parameters are different. When the AFR-G is used as the dependent variable, the Tobit
model fits better than OLS in terms of the Akaike information criterion (AIC). As a result,
both Tobit models were considered as the final ones.
Table 2. Estimation results.
AFR-C AFR-G
OLS Tobit OLS Tobit
coef. s.e. coef. s.e. coef. s.e. coef. s.e.
const. 15.243 ** 7.648 15.243 * 7.961 −4.743 8.237 −12.731 9.385
AVAL 0.029 ** 0.013 0.029 * 0.016 0.056 *** 0.014 0.057 *** 0.014
GRAD 0.474 0.343 0.474 0.551 0.764 ** 0.370 0.927 * 0.475
AREA 0.223 0.136 0.223 ** 0.113 −0.154 0.146 −0.115 0.113
PPUD −0.139 * 0.083 −0.139 * 0.077 0.022 0.089 0.089 0.085
ROUT −0.456 *** 0.096 −0.456 *** 0.101 −0.119 0.103 −0.139 0.128
NFHH 0.608 *** 0.083 0.608 *** 0.077 0.128 0.089 0.110 0.118
NFHP −10.976 9.451 −10.976 *** 3.489 6.381 10.180 7.077 5.953
TRAC −22.755 *** 6.507 −22.755 *** 6.249 −7.975 7.009 −10.387 7.197
GINI −3.078 10.708 −3.078 7.364 15.355 11.533 20.249 ** 10.283
DEER 0.122 0.213 0.122 0.150 0.483 ** 0.230 0.453 ** 0.217
BOAR 0.724 0.676 0.724 * 0.381 −0.722 0.728 −0.889 0.598
DPFHM 0.004 0.006 0.004 0.006 −0.012 * 0.007 −0.011 ** 0.005
PAEMF −0.253 0.841 −0.253 1.003 −0.286 0.906 0.097 0.512
Log(scale) 2.518 *** 0.080 2.721 *** 0.109
aj-R2/pseudoR2 0.606 0.116 0.320 0.054
AIC 1116.7 1116.7 1137.2 1030.9
Note: *, **, and *** indicate statistical significance at the 10%, 5%, and 1% levels, respectively.
First, for the AFR-C, the AREA (farmland area in a community) is positively signifi-
cant. This is a reasonable result, indicating that the more farmland a community has, the
more farmland is abandoned. PPUD (percentage of paddy fields in AREA) has a negative
impact on the AFR, which is consistent with the findings of Takayama and Nakatani [16].
ROUT (percentage of rented out farmland) also has a negative impact, meaning that a
well-functioning agricultural land market prevents farmland abandonment. Since NFHH
(percentage of land tenure non-farm households) includes many retired farmers, it posi-
tively promotes farmland abandonment. NFHP (number of non-farm household producers)
has a negative impact, suggesting the importance of non-farm household producers, suchLand 2021, 10, 596 11 of 17
as community farms [56]. The coefficient of TRAC (number of tractors per farm household)
is also negative and significant, indicating the effect of tractor ownership on reducing the
AFR. These results are consistent with those of previous studies [13]. The results of BOAR
(number of boars caught annually), the proxy variable for animal damage, also support
the hypothesis.
For AFR-G, variables from CBD are hardly significant, while variables from GIS data
and YOD tend to be significant. GINI (variation in farmland size) is positively significant,
indicating that uneven or diverse farmland sizes tend to increase abandoned farmland. As
expected, DEER (number of deer caught annually), AVAL (average altitude of farmlands
in the village), and GRAD (average slope of farmlands in the village) show positive and
significant effects on AFR. The policy variable DPFHM (direct payments to farmers in hilly
and mountainous areas) is not significant for AFR-C but shows a significant policy effect
for the AFR-G model, which is consistent with the results of Ito et al. [7].
3.2. Performance of Models and Data
First, under the assumption that the objective dataset AFR-G is a desirable measure
of farmland abandonment rates, the predictive accuracy of the estimation model was
evaluated. First, RMSE and MAE, both of which are shown in Table 3, were calculated.
AFR-G is superior to AFR-C in terms of prediction accuracy. Figure 5 shows the results of
the kernel density estimation of raw data (AFR-G and AFR-C) and the predicted values
from the models. For both the AFR-G and AFR-C data, the predictions appear to be
overestimated compared with the raw data. It should be noted that the original AFR
distribution was smaller for AFR-G than for AFR-C; therefore, by using the AFR-G data,
estimation results can become conservative and robust.
Table 3. Prediction performance of AFR-C and AFR-G.
AFR-C AFR-G
Land 2021, 10, x FOR PEER REVIEW RMSE MAE RMSE MAE 12 of 18
20.12 15.22 13.36 9.27
Figure
Figure 5.
5. Kernel
Kernel density
density estimation
estimation of
of raw
raw data
data and
and predicted
predicted values.
values.
The bottom row of Table 4 shows RMS of the distance from the ratio of each coeffi-
cient to 1. The ratio of the coefficients for AFR-C is almost twice as large as that of AFR-G,
suggesting that the bias is relatively larger when subjective data are used. Note that alt-Land 2021, 10, 596 12 of 17
Next, how the results change when ACD is used was examined. Table 4 shows the ratio
of the estimated parameters when using the Tobit model with the ACD to the estimated
results when using the ECD. The rightmost column shows the results of a pairwise t-test to
determine whether there are significant differences in the estimated coefficients between
ECD and ACD. While the AFR-C model has four significant coefficients, AFR-G has only
two at the 1% significance level, indicating that the estimation using AFR-G is more robust
regardless of the presence of confidential data.
Table 4. Estimation result using ECD and performance comparison with ACD.
AFR-C AFR-G
coef. Ratio Welch t Test coef. Ratio Welch t Test
p-Value p-Value
AREA 0.279 1.252 0.000 *** 0.223
PPUD −0.075 −0.139
ROUT −0.606 1.329 0.000 *** −0.456
NFHH 0.529 0.870 0.000 *** 0.608
NFHP −10.713 0.976 0.523 −10.976
TRAC −14.990 0.659 0.000 *** −22.755
GINI 0.062 −3.078 1.105 0.102
DEER −0.070 0.122 1.103 0.094 *
BOAR 0.484 0.724
AVAL 0.005 0.029 1.128 0.000 ***
GRAD 0.977 0.474
DPHMC 0.005 0.004 0.823 0.001 ***
PAEMF 0.113 −0.253
Bias 0.215 0.128
Note: *, **, and *** indicate statistical significance at the 10%, 5%, and 1% levels, respectively.
The bottom row of Table 4 shows RMS of the distance from the ratio of each coefficient
to 1. The ratio of the coefficients for AFR-C is almost twice as large as that of AFR-G,
suggesting that the bias is relatively larger when subjective data are used. Note that
although bias occurs in many variables, there are no results where the sign conditions of
the significant coefficients are opposite.
4. Discussion
The results of the estimation (Table 2) support many of the hypotheses. However,
the results show that the significant variables tend to depend on the type of data used.
An important finding is that AFR-C data are compatible with CBD data, and AFR-G
data are compatible with geographic information and other data. The meaning of the
word “compatible” here is that the coefficients of a variable are likely to pass the test (be
identified). Presumably, census-derived subjective data are highly correlated with census-
derived data; namely, there is a possibility of a high correlation between the same types
of data. For example, the AFR-C is likely to be effective when analyzing the relationship
between community structure and farmland abandonment from the CBD. However, in the
case of objective data, such as geographic information or original data, it is more efficient
to use AFR-G.
The important point is the relationship between the AFR and the original data, such
as DEER, BOAR, DPFHM, and PAEMF. The latter two are particularly important, as these
kinds of data have recently been used for evidence-based policy research, which needs to
capture causal relationships accurately. The results show that AFR-G is more accurate in
capturing the causal relationships. In particular, previous studies have demonstrated that
direct payments for hilly and mountainous areas reduce farmland abandonment [7]. In
this study, the relationship between DPFHM and AFR was significant only in the AFR-G
model. Hence, in the field of policy research, the use of objective data such as AFR-G and
GIS is likely to be more effective.Land 2021, 10, 596 13 of 17
The results also show that ECD can generate bias. In Japan, MAFF avoids publishing
data on a community with two or fewer households to protect personal information. While
such treatment is inevitable from the perspective of privacy protection, it may distort policy
evaluation and judgments in policy decision-making. Therefore, it is necessary to establish
a system in which comprehensive data (without selection bias), such as the ACD, can be
used for policy purposes and academic research.
The implications of the estimation results of the AFR-G validated in this study were
reviewed. Geographical conditions that are unfavorable to agriculture, such as high altitude
and steep slope, naturally induce farmland abandonment. The occurrence of bird and
animal damage is also likely to reduce farmers’ motivation to cultivate. Therefore, strong
measures to prevent birds and animals from entering the community are also required. The
most important policy implication is that the direct payment for hilly and mountainous
areas is effective against farmland abandonment. This is a finding that is not possible when
using the binary AFR-C data.
Let us now discuss the position of the problem of abandoned farmland from interna-
tional and policy perspectives: the international literature on abandoned farmland in the
EU is vast, but most of it is concerned with the impact of abandoned farmland, and little of
it identifies the drivers of abandonment. Some studies suggest that public policy exoge-
nously influences farmland abandonment but that socioeconomic factors and ownership
systems dominate its dynamics [57].
In the EU, many researchers have proposed amendments to the Common Agricultural
Policy (CAP) in response to the increase in abandoned farmland [58]. However, there
are two main opinions on the impact of abandoned farmland: one is that abandonment
harms the environment, and the other is that abandonment improves the environment by
returning farmland to the wilderness. Dolton-Thornton [58] argues that the CAP’s agro-
environmental measures are still too productive and neoliberal to address the problem of
abandoned farmland as a part of them and that they need to be repositioned to address
population decline, including in the rural non-farm sector.
Since the population decline in rural areas is also serious in Japan, it is believed that
the problem of abandoned farmland needs to be considered as a part of regional economic
policy, beyond the scope of mere agricultural policy. As Terres et al. [29] argue in the EU
case, food security is an extremely important factor in Japan, where the grain self-sufficiency
rate has fallen to 30%, and securing the potential of agricultural production is a policy that
is not only materially but also psychologically important for the Japanese people.
Finally, this study has some limitations. It used 2010 data from Yabu City in Hyogo
Prefecture, one of the many municipalities in Japan; therefore, the limitation of the external
validity of the results should be noted. However, because 73% of the country’s land and 41%
of its farmland belong to hilly and mountainous areas such as the area of this study [59],
and Japanese society and communities are relatively homogeneous in character [60], the
results of this study should have some generalizability in Japan. Moreover, since the
academic value of this study is in the estimation and use of data, the results are sufficient
to point out the problems in a particular case (i.e., in at least one case, a problem arises
when using conventional materials and methods). Although this study addresses the case
of Japan, where rice farming dominates, it is only a matter of time before similar problems
emerge in the rest of East Asia, which is experiencing rapid economic development. In fact,
problems of farmland abandonment are beginning to arise in China according to a 2020
study by Zhou [61], and the analysis of Japan will provide useful insights for these regions.
Another shortcoming concerns the estimation method. When presenting the estimation
results, the causal relationship between some variables and the AFR was mentioned. How-
ever, causal effects, such as policy and socially operative variables, require close attention to
their identification. For example, the results show that damage from birds and animals tends
to increase the amount of abandoned land, but the opposite causal relationship can also be
assumed. Specifically, abandoned land tends to attract birds and animals to the community.
Due to data limitations, it was not possible to examine these endogenous issues. TheseLand 2021, 10, 596 14 of 17
issues need to be examined based on more extensive data collection and advanced estimation
methods, such as the instrumental variable (IV) method (if IV is available) [62].
5. Conclusions
This study mainly focused on the data problem related to analyzing the determinants
of the farmland abandonment problem, which is becoming a serious problem in developed
countries such as Japan, where agriculture has lost its comparative advantage. The main
findings are as follows.
• The estimation results differed if objective or subjective data were used.
• There is a possibility of bias in the estimation when conventional census data, which
farmers subjectively provide, was used in the analysis.
• Correlations (coefficient parameters) between the same types of data (objective or
subjective) are easy to identify.
• When using data restricted from the perspective of privacy protection, a bias occurred
in some estimates, but it did not reach a serious level. (This is the issue of confiden-
tiality of community-based data, which has been used in many studies on Japanese
agricultural policy.)
The important implication of the third finding mentioned above is that while the
variables from CBD data are more compatible with each other, variables from GIS are more
compatible with the same type of data (GIS-related data). In addition, other original data,
such as policy variables, were shown to be more compatible with objective data such as
GIS data.
In recent years, there has been a rapid development of analytical methods in microe-
conomic analysis and policy research, but it is assumed that the data used in these analyses
are accurately measured. However, as seen in this study, when there are differences in
measures of land use conditions, or when the data are not fully available for social reasons,
there may be differences or biases in the results. Therefore, when using land use data, the
origin of the data should be carefully considered before conducting an analysis.
Funding: This research was supported by the Japan Society for the Promotion of Science (grant
number: 21K05796).
Data Availability Statement: The data presented in this study are available on request from the
author. The data are not publicly available due to privacy protection.
Acknowledgments: I would like to express appreciation to the Agriculture and Forestry Promo-
tion Divisions, Yabu City, for providing data on issues such as agricultural status, land use, and
agricultural subsidies in Yabu City.
Conflicts of Interest: The author declares no conflict of interest.
Appendix A
Table A1. Descriptive statistics of confidential data and ECD.
Confidential Data Data Excluding CD Pairwise Comparison
(CD) (ECD)
Mean Mean p-Value
(s.d.) (s.d.)
GIS
AFR-G 26.38 11.22 0.001 ***
(36.12) (12.13)
AVAL 198.89 159.2 0.149
(160.96) (133.39)
GRAD 12.17 9.72 0.012 **
(6.54) (4.25)Land 2021, 10, 596 15 of 17
Table A1. Cont.
Confidential Data Data Excluding CD Pairwise Comparison
(CD) (ECD)
Mean Mean p-Value
(s.d.) (s.d.)
CBD
AFR-C 39.38 17.08 0.000 ***
(29.21) (13.60)
AREA 8.08 19.15 0.001 ***
(6.48) (10.65)
PPUD 59.81 70.53 0.001 ***
(24.20) (13.52)
ROUT 16.17 21.95 0.060 **
(21.64) (12.35)
NFHH 50.81 28.8 0.001 ***
(24.09) (11.81)
NFHP 0.00 0.02 0.401
0.00 (0.14)
TRAC 0.09 0.42 0.001 ***
(0.16) (0.18)
GINI 0.02 0.24 0.001 ***
(0.06) (0.11)
YOD
DEER 0.86 5.3 0.001 ***
(2.07) (7.72)
BOAR 0.17 0.92 0.026 **
(0.61) (1.98)
DPFHM 11.1 97.03 0.061 *
(60.78) (245.88)
PAEMF 0.85 0.94 0.761
(2.64) (0.83)
N 36 102
Note: *, **, and *** indicate statistical significance at the 10%, 5%, and 1% levels, respectively.
References
1. Keenleyside, C.; Tucker, G. Farmland Abandonment in the EU: An Assessment of Trends and Prospects; Institute for European
Environmental Policy: London, UK, 2010.
2. Terres, J.; Nisini, L.; Anguiano, E. Assessing the Risk of Farmland Abandonment in the EU; European Union: Brussels, Belgium, 2013.
3. Renwick, A.; Jansson, T.; Verburg, P.H.; Revoredo-Giha, C.; Britz, W.; Gocht, A.; McCracken, D. Policy reform and agricultural
land abandonment in the EU. Land Use Policy 2013, 30, 446–457. [CrossRef]
4. Li, S.; Li, X. Global understanding of farmland abandonment: A review and prospects. J. Geogr. Sci. 2017, 27, 1123–1150.
[CrossRef]
5. Ustaoglu, E.; Collier, M.J. Farmland abandonment in Europe: An overview of drivers, consequences, and assessment of the
sustainability implications. Environ. Rev. 2018, 26, 396–416. [CrossRef]
6. Perpina Castillo, C.; Kavalov, B.; Diogo, V.; Jacobs-Crisioni, C.; Batista e Silva, F.; Lavalle, C. Agricultural Land Abandonment in the
EU within 2015–2030; Joint Research Centre of the European Commission: Seville, Spain, 2018.
7. Ito, J.; Feuer, H.N.; Kitano, S.; Asahi, H. Assessing the effectiveness of Japan’s community-based direct payment scheme for hilly
and mountainous areas. Ecol. Econ. 2019, 160, 62–75. [CrossRef]
8. Koshida, C.; Katayama, N. Meta-analysis of the effects of rice-field abandonment on biodiversity in Japan. Conserv. Biol. 2018, 32,
1392–1402. [CrossRef]
9. MAFF. Basic Plan for Food, Agriculture and Rural Areas 2015. Available online: https://www.maff.go.jp/j/keikaku/k_aratana/
pdf/1_27keikaku.pdf (accessed on 10 February 2021).
10. Zavalloni, M.; D’Alberto, R.; Raggi, M.; Viaggi, D. Farmland abandonment, public goods and the CAP in a marginal area of Italy.
Land Use Policy 2019, 104365. [CrossRef]
11. Xu, D.; Deng, X.; Guo, S.; Liu, S. Labor migration and farmland abandonment in rural China: Empirical results and policy
implications. J. Environ. Manag. 2019, 232, 738–750. [CrossRef]
12. Senda, T. An Econometric Analysis for Farmer’s Behavior of Abandoned Cultivated Land in Japan: Microdata Evidence from
“The Census of Agriculture” in 1990. Statistics 1998, 75, 26–40.
13. Senda, T. A Quantitative Analysis of Abandoned Cultivated Land in Japan. Jpn. J. Farm. Manag. 1998, 36, 57–62. [CrossRef]You can also read