Geographical Accessibility of Community Health Assist Scheme General Practitioners for the Elderly Population in Singapore: A Case Study on the ...
←
→
Page content transcription
If your browser does not render page correctly, please read the page content below
International Journal of
           Environmental Research
           and Public Health

Article
Geographical Accessibility of Community Health
Assist Scheme General Practitioners for the Elderly
Population in Singapore: A Case Study on the Elderly
Living in Housing Development Board Flats
Ong Ming Lee Deborah 1 , Marcus Yu Lung Chiu 2, *                       and Kai Cao 1, *
 1    Department of Geography, National University of Singapore, Singapore, Singapore
 2    Department of Social and Behavioural Sciences, City University of Hong Kong, Hong Kong, China
 *    Correspondence: mylchiu@cityu.edu.hk (M.Y.L.C.); geock@nus.edu.sg (K.C.)

 Received: 9 August 2018; Accepted: 4 September 2018; Published: 12 September 2018

 Abstract: Accessible primary healthcare is important to national healthcare in general and for older
 persons in particular, in societies where the population is ageing rapidly, as in Singapore. However,
 although much policy and research efforts have been put into this area, we hardly find any spatial
 perspective to assess the accessibility of these primary healthcare services. This paper analyzes the
 geographical accessibility of one major healthcare service in Singapore, namely, General Practitioners
 (GPs) services under the Community Health Assist Scheme (CHAS) for older persons. A Python script
 was developed to filter the website data of the Housing Development Board (HDB) of Singapore.
 The data derived was comprehensively analyzed by an Enhanced 2-Step Floating Catchment Area
 (E2SFCA) method based on a Gaussian distance-decay function and the GIS technique. This enabled
 the identification of areas with relatively weak geographical accessibility of CHAS-GPs. The findings
 are discussed along with suggestions for health practitioners, service planners and policy makers.
 Despite its initial nature, this study has demonstrated the value of innovative approaches in data
 collection and processing for the elderly-related studies, and contributed to the field of healthcare
 services optimization and possibly to other human services.

 Keywords: geographical accessibility; Healthcare services; GIS; E2SFCA; CHAS; Singapore

1. Introduction
     It is widely recognized that primary healthcare services are critical to national healthcare and play
a vital role in support of elderly population [1–3]. Accessibility to healthcare services is variable across
space and time, so it is affected by where health professionals are located (supply) and where people
reside (demand) [4]. Besides, the value of healthcare professionals is dependent on the geographical
accessibility of healthcare services [5], which depends on the impact of spatial gap between the supply
and the demand sides of healthcare resource. In this regard, Geographical Information Systems (GIS)
as well as spatial analysis technologies are particularly useful in addressing these kind of issues [6].
     Rapid ageing is a key demographic challenge impacting Singapore. The ratio of seniors aged
over 65 years, changed from 3.2% in 1970, to 13.0% in 2017, and will reach 24.1% in 2030 and 28.2%
(over 900,000) in 2050 [7]. In addition to the challenge arising from the dramatic fall in Old-Age Support
Ratio, demand for social and healthcare services is also rapidly increasing [8,9]. When home-based
support and family caregiving are preferred to institutional care, policies of various types have
been developed to enable seniors to age in place. In the case of Singapore, government seeks
to maintain good health among older persons through health and exercise campaigns, building
senior-friendly housing and towns, creating senior-friendly communities, and making quality and
affordable healthcare services available.
Int. J. Environ. Res. Public Health 2018, 15, 1988; doi:10.3390/ijerph15091988             www.mdpi.com/journal/ijerph
Int. J. Environ. Res. Public Health 2018, 15, 1988                                                  2 of 15

      Availability and accessibility of healthcare services is one of the major objectives of Singapore’s
national health plans and strategies in Singapore. Singapore’s government is planning to add around
11,000 community hospitals and nursing home beds by 2020. In addition, the government is planning
to expand home and community care with nursing homes as back up. One may assume that these
additional resources will be accessible to meet the increasing need of the ageing population. However,
this assumption may not be valid as revealed in other studies. Cheng [10] found that the distribution
of the elderly population and residential care resources is geographically uneven across the districts
in Beijing, so the supply of resources does not match with the needs. Similar studies have also been
carried out in Hong Kong [11] and metro Atlanta [12]. It should therefore be beneficial to conduct
a study on primary healthcare services in Singapore and examine how far the new provisions are
meeting the changing spatial and temporal demand [13].
      One common approach for assessing physical accessibility is to consider potential spatial
accessibility. This approach has been used frequently while analyzing primary healthcare facilities in
relation to the population of a catchment area on the basis of a variable of distance [14] that takes the
availability as a supply-demand ratio within a region. However, it has been criticized for ignoring
spatial variations within administrative boundaries as it assumes that people within the region do
not seek healthcare services outside the boundaries [4,15]. Being an extension of accessibility-based
approach, the regional accessibility approach considers the contribution and interactions of supply
and demand between different regions [16,17]. By contrast, the gravity model integrates both the
regional availability and regional accessibility as a unified measure of healthcare services accessibility.
This measure has been widely employed in a variety of related studies [18,19].
      In spite of the above mentioned advances in spatial analysis, most of the existing studies of the
elderly in Singapore have focused on health and socio-economic correlates or determinants [20–26].
There have been some related studies, e.g., Wong, Heng [27], who used GIS to identify service gaps and
suggest optimal sites for future polyclinics in Singapore. Koh, Leow [28] have also studied the mobility
of the elderly in densely populated neighbourhoods in Singapore through a survey. Their study reflects
more the perception of elderly subjects rather than objective effort to investigate the geographical
accessibility of healthcare services for the elderly in Singapore.
      In view of this dearth of spatial analysis for Singapore, this paper aims to assess the state of
geographical accessibility of primary healthcare services for the elderly living in HDB flats in Singapore.
This study is methodologically apt to the city-state of Singapore that is geographically confined with
about 3 million resident populations.

2. Methodological Considerations
     The early versions of a floating catchment area method have been used to measure geographical
accessibility to calculate job accessibility. This is done by using the concept of a kernel density model
estimation where the events within the kernel were used to represent the density at the center [29,30].
This has been considered a superior method for measuring geographical accessibility because it takes
into consideration the cross-boundary demand and the distance decay effect [5,31].
     Another popular method is the two-step floating catchment area (2SFCA) method, which is
a gravity based model that takes into account both the accessibility and availability of population
and service providers [4,32]. This method is intuitive while retaining the advantages of a gravity
based model [18]. The 2SFCA method has been utilized in a variety of recent studies to measure
healthcare services accessibility, e.g., measuring the accessibility of healthcare centers for villagers
living in the Indian Alwar district of Rajasthan, the spatial accessibility of primary care physicians
and mammography centers for women with breast cancer in the American Appalachian region,
and the spatial accessibility of primary healthcare services for Australians [33–35]. However, caution
is needed while using the method since it makes the unrealistic assumption of equal accessibility for
all population living within each catchment area [4].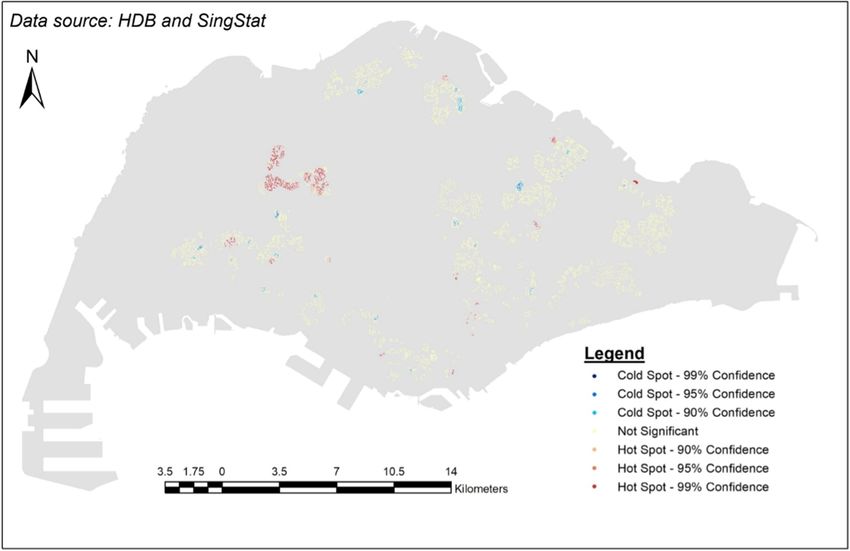
Int. J. Environ. Res. Public Health 2018, 15, 1988                                                         3 of 15

      A distance decay function has been proposed in many studies to model continuous gradual
decay within a threshold distance. The distance decay effect is dependent on the phenomena being
studied and should be examined separately for each study to account for the different effect distance
has on different groups of people for different types of services. Researchers have identified several
common forms of the continuous distance decay function: linear decay, Butterworth filter, Gaussian
function, inverse-power function, and negative exponential function [36,37]. The enhanced two-step
floating catchment area (E2SFCA) method combines a chosen distance decay function with the 2SFCA
method [21]. Researchers have used a kernel density function, a Gaussian function, a downward
log-logistic function, amongst others, to model the distance decay function [5,38–41]. However,
adjustments still need to be made to the final method to ensure a satisfactory real-world behaviour
such as possibly adjusting the radius of a service area or even varying the catchment sizes [40,42,43].
      The three-step floating catchment area (3SFCA) method attempts to overcome the possible
overestimation of potential population demand in an area with access to multiple service facilities in
view of lack of information about potential competition between service facilities by incorporating an
extra step to calculate the selection weight in these situations [20]. However, Delamater [38] found
that the 3SFCA method produced outcomes that do not necessarily match logic-based outcomes and
overestimates the role of competition resulting in both and over- and under- estimation of spatial
accessibility for the study area.
      Therefore, considering the pros and cons of different approaches as well as the characteristics of
our research context, we chose the E2SFCA method as adapted by incorporating a Gaussian distance
decay function Equation (4) to estimate geographical accessibility.
      The 2SFCA method is essentially a gravity-based accessibility measure of the spatial accessibility
to healthcare resources [4,44]. In the first step, all population locations (k) that fall within a defined
catchment area of a threshold travel time or distance (d0 ) around physician location j are used to
calculate the physician-to-population ratio (Rj ) Equation (1):

                                                                       Sj
                                                     Rj =                                                      (1)
                                                                ∑ j∈{dkj ≤d0 } Pk

     In the second step, for each population cluster (i), all physician-to-population ratios of facility
locations (j) within the catchment area of a threshold travel time or distance (d0 ) are summed to arrive
at the spatial accessibility index of population cluster (Ai ) Equation (2):

                                                                                            Sj
                                  Ai =     ∑ j∈{dij ≤d0 }   Rj =    ∑ j∈{dij ≤d0 } ∑                  Pk
                                                                                                               (2)
                                                                                       j∈{dkj ≤d0 }

     Many studies have proposed a distance decay function (i.e., Wkj ) to model the continuous gradual
decay within a threshold distance, with no effect beyond the threshold distance. A possible model
could use a continuous Gaussian distance-decay function. In Equation (3), β = d0 /2 and dkj is the
shortest network distance between population location k and physician location j:

                                                                       − d2
                                                                          kj
                                                            Wkj =     e β2                                     (3)

      The distance decay function is then added into the 2SFCA method Equation (4):

                                                                               Sj
                                              Ai =          ∑       ∑ j∈{dkj ≤d0 } Pk Wkj
                                                                                                               (4)
                                                     j∈{dij ≤d0 }

    Our study adopts an E2SFCA method based on the modified 2SFCA method proposed by
Langford, Fry [37] and incorporates a Gaussian distance decay function Equation (4) to calculate
geographical accessibility. These parameters will be introduced in the case study below.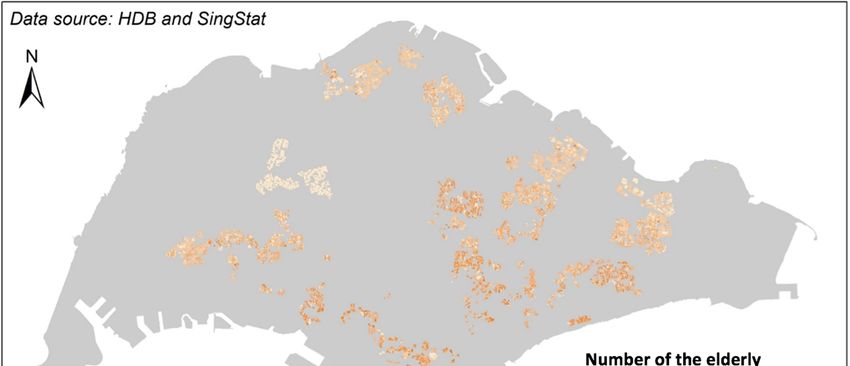
Int. J. Environ. Res. Public Health 2018, 15, 1988                                                  4 of 15

3. Case Study

3.1. Background Information
      The Singapore government has implemented several policies in light of city-state’s ageing
population, including increased healthcare support through an SGD$8 billion Pioneer Generation
Fund [8,45]. All Singapore citizens born on or before the 31st of December 1949 and received their
citizenship by 31 December 1986 are eligible for the benefits under the Pioneer Generation Scheme,
which covers about 87% of the elderly in Singapore in 2017 [46,47]. With regard to healthcare, pioneers
under this scheme can receive an additional 50% off on subsidized services at polyclinics, and special
subsidies at private GPs participating in the CHAS.
      In Singapore, there are two forms of primary healthcare services: private GP clinics and public
polyclinics. Private GP clinics are dispersed in different neighbourhoods across the entire Singapore
region. Normally, the patients can see the same doctor continuously, whereas public polyclinics
provide subsidized services with less choices and convenience, and the patients are randomly allocated
to a duty doctor [48–51]. It is necessary to note here that the elderly would benefit especially from the
continuity of care [52] provided by GP clinics rather than public polyclinics.
      Singapore’s Ministry of Health acknowledges that only 20% of primary healthcare services is
provided by government polyclinics while the remaining 80% is provided by private practitioners [48].
Although the elderly can already receive 50% off on subsidized services at polyclinics, there are
only 18 polyclinics that they can choose from [50,51]. In addition, all Singaporeans and Permanent
Residents receive subsidies at polyclinics to a very large extent, making polyclinics an attractive primary
healthcare option for most Singaporean residents and increasing competition for medical attention [53].
On the other hand, only pioneers (predefined the elderly) and low-income individuals are eligible
for subsidies at Private GP clinics participating in CHAS (henceforth referred to as “CHAS GPs”),
with pioneers receiving the most subsidies [54]. Presently, there are 20 polyclinics, 1100 CHAS clinics,
and 500 GP clinics [48].
      Over the past decade, Singapore has seen an increasing doctor to population ratio, with an all-time
high ratio of 1:430 in 2016 [55]. However, in a national survey commissioned by the Ministry of Social
and Family Development in 2013, Singaporean elderly said that financial constraint and the lack of
clinic or polyclinic near their homes were some of the major reasons for not seeking treatment [56].
While the subsidies under CHAS would ease the financial burden of seeing a doctor, the issue of the
proximity to a clinic is still unclear despite the claim that there is a good geographical spread among
CHAS GPs and more than 97% of pioneers have “more than one CHAS clinic within 1 km of their
homes, or about 15 minutes by public transport” [57]. However, there are some elements that still
worry the elderly, such as the difficulty in getting to a bus stop or MRT station, boarding or alighting,
and maintaining their balance or obtaining a seat [58,59]. Singapore’s elderly are mobile, with nearly
96% ambulant and physically independent, and 98% ambulant with the help of a walking aid [56].
Thus, if GP services are within walking distance, elderly in Singapore would be more willing to visit
a doctor.
      Furthermore, the Singapore’s elderly living in HDB flats–Singapore’s public housing–account for
80.6% of Singapore residents aged 65 or above, meaning that this group constitutes the majority of
elderly population in Singapore [58]. Given that the average monthly income for HDB flats is less than
half of the other dwelling types such as condominiums or landed properties, it stands to reason that
elderly individuals living in HDB flats would face more financial constraints while seeking healthcare
and would benefit two-fold from the CHAS subsidies, in terms of increased spatial accessibility, and
more healthcare service options being made available to them [60].

3.2. Data Sources
     The datasets used in this case study were provided by various Singapore government
agencies—Housing Development Board (HDB), Singapore Land Authority (SLA), and Department of
Statistics (SingStat). The unit of analysis used in this study is one HDB block.
Int. J. Environ. Res. Public Health 2018, 15, 1988 5 of 15
Int. J. Environ. Res. Public Health 2018, 15, x 5 of 15
3.2.1. Address Points
A shapefile containing all buildings in Singapore linking the address and postal code of the
building to its geo-coded location was obtained from
from Singapore
Singapore Land
Land Authority
Authority (SLA).
(SLA).
3.2.2. HDB
3.2.2. HDB Address
Address Points
Points with
with Flat
Flat Type
Type Information
Information
HDB flats
HDB flats with
with flat
flat type
type information
information cannot
cannot bebe collected
collected directly
directly nor
nor purchased,
purchased, but
but wewe managed
managed
to crawl the data by developing and using a Python script on the HDB website,
to crawl the data by developing and using a Python script on the HDB website, which provides which provides a map a
service where users can look at all the HDB flats in Singapore and obtain information
map service where users can look at all the HDB flats in Singapore and obtain information about about individual
flats, such as
individual the postal
flats, such ascode
the and
postalthecode
number
andof each
the type of
number ofunit
each(Figure
type of1).unit
This(Figure
data is1).
stored
Thisin XML
data is
files accessible through a URL that can be found in the Network tab under Developer
stored in XML files accessible through a URL that can be found in the Network tab under Developer Tools, and is
available
Tools, andtoisanyone who
available to accesses
anyone whothe website.
accesses the website.
Figure
Figure 1.
1. HDB’s
HDB’smap
mapservice
service that shows
that detailed
shows information
detailed about
information each each
about flat. Inflat.
the screenshot, a HDB
In the screenshot,
flat with postal code “212672” was selected and the popup showing its information is displayed.
a HDB flat with postal code “212672” was selected and the popup showing its information is displayed. The
corresponding
The correspondingXMLXMLfilefilewas located ininthethe
was located Network
Network tabDeveloper
tab of of Developer Tools https://
Tools (Source: (Source:
https://services2.hdb.gov.sg/web/fi10/emap.html
services2.hdb.gov.sg/web/fi10/emap.html last accessed last accessed
on 12 on 12 November
November 2017).2017).
A Python
Python script
scriptwas
wasdesigned
designedtotorun
runthe
theURL
URL forfor
allall postal
postal codes
codes in Singapore
in Singapore (obtained
(obtained from from
the
the
SLASLA Address
Address PointPoint dataset),
dataset), read
read the the file,
XML XML file,
and andthe
write write the information
information into
into a csv file.a If
csvthefile. If the
building
building did not
did not exist, thenexist, then
it was it was excluded
excluded from thefrom
outputthecsvoutput csv file.
file. The The
script script
had had
to be runtoforbe over
run for
24 over
h on
24 h on
three three computers
computers using PyCharm
using PyCharm CommunityCommunity Edition Eventually,
Edition 2017.2.4. 2017.2.4. Eventually, a csv containing
a csv containing the postal
the
codepostal code
and the and the
number ofnumber of of
each type each type
unit wasofproduced.
unit was produced.
3.2.3. Masterplan
3.2.3. Masterplan 2014
2014 Planning
Planning Area
Area
A shapefile
A shapefilecontaining Singapore’s
containing 2014 2014
Singapore’s masterplan planning
masterplan areas was
planning obtained
areas was from data.gov.sg,
obtained from
a portal launched
data.gov.sg, by launched
a portal the Singapore government
by the Singapore to release publicly
government available
to release datasets
publicly from datasets
available various
public agencies.
from various public agencies.
3.3. Data
3.3. Data Pre-Processing
Pre-Processing for
for Calculating
Calculating Spatial
Spatial Accessibility
Accessibility
3.3.1. Location of HDBs in Singapore
3.3.1. Location of HDBs in Singapore
A shapefile containing the location of HDBs in Singapore was produced by joining (1) SLA
A shapefile containing the location of HDBs in Singapore was produced by joining (1) SLA
Address Point shapefile, (2) HDB postal codes with flat type information from the HDB website,
Address Point shapefile, (2) HDB postal codes with flat type information from the HDB website, and
and (3) URA’s Masterplan 2014 Planning Areas. The map of all the HDBs can be seen from Figure 2.
(3) URA’s Masterplan 2014 Planning Areas. The map of all the HDBs can be seen from Figure 2.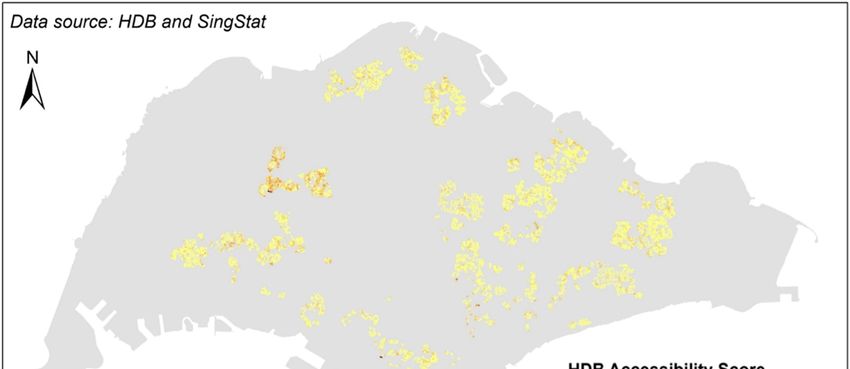
Int. J. Environ. Res. Public Health 2018, 15, 1988                                                               6 of 15
   Int.
   Int. J.J. Environ.
             Environ. Res.
                      Res. Public
                           Public Health
                                  Health 2018,
                                         2018, 15,
                                               15, xx                                                          66 of
                                                                                                                  of 15
                                                                                                                     15

                                                  Figure
                                                   Figure2. Map  of HDBs
                                                                    HDBs in Singapore.
                                                                            Singapore.
                                                   Figure 2.
                                                          2. Map
                                                             Map of
                                                                 of HDBs in
                                                                         in Singapore.
3.3.2. Population Density of Singapore Elderly Living in HDBs
   3.3.2.
   3.3.2. Population
          Population Density
                       Density ofof Singapore
                                    Singapore Elderly
                                                 Elderly Living
                                                         Living inin HDBs
                                                                      HDBs
      AA shapefile  containing    the   population   density   of Singaporeans       aged 65andand over  per HDB    block
         A shapefile
            shapefile containing
                      containing thethe population
                                         population density
                                                     density ofof Singaporeans
                                                                  Singaporeans aged aged 65
                                                                                          65 and over
                                                                                                  over per
                                                                                                       per HDB
                                                                                                            HDB block
                                                                                                                  block
was  produced
   was            using  (1) a SingStat   dataset  categorizing    the  Singapore     resident  population  by  planning
   was produced
          produced using
                     using (1)(1) aa SingStat
                                      SingStat dataset
                                                dataset categorizing
                                                         categorizing the  the Singapore
                                                                                Singapore resident
                                                                                              resident population
                                                                                                       population by by
area,  age group
   planning         and   type of   dwelling   in June 2017    and    (2)and
                                                                          URA’s    Masterplan      2014 2014
                                                                                                        Planning Areas.
   planning area, age group and type of dwelling in June 2017 and (2) URA’s Masterplan 2014 Planning
              area, age  group   and   type of dwelling  in  June  2017       (2) URA’s    Masterplan        Planning
The  map The
   Areas.
   Areas.   of the
           The     distribution
                 map
                 map  of
                      of the       of the elderly
                         the distribution
                              distribution  of the living
                                            of the elderlyin
                                                   elderly    HDBin
                                                            living
                                                            living  inflats
                                                                        HDB
                                                                        HDB can  becan
                                                                              flats
                                                                              flats  seen
                                                                                     can befrom
                                                                                         be  seenFigure
                                                                                            seen  from   3.
                                                                                                  from Figure
                                                                                                        Figure 3.
                                                                                                               3.

                                Figure
                                 Figure3.3. Density
                                         3.Density  map
                                            Densitymap  of
                                                    mapof  elderly
                                                           elderly living
                                                        of elderly living in
                                                                          in HDB flats in Singapore.
                               Figure                              living  in HDB
                                                                              HDBflats
                                                                                  flatsininSingapore.
                                                                                            Singapore.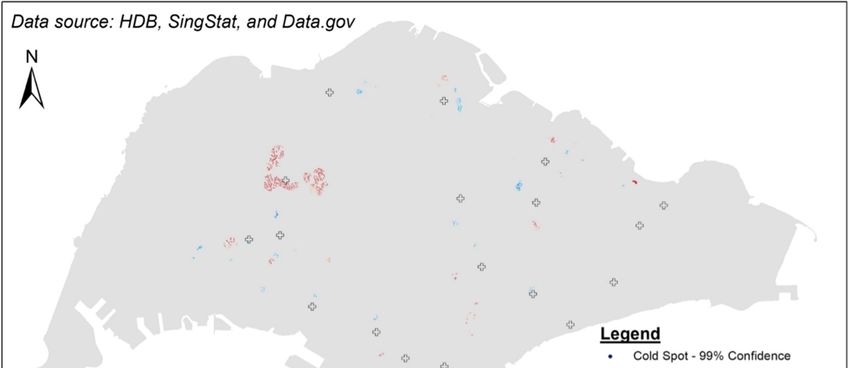
Int. J. Environ. Res. Public Health 2018, 15, 1988 7 of 15
Int. J.Parameter
3.3.3. Environ. Res. Setting
Public Health 2018, 15, x 7 of 15
In this
3.3.3. Ai is the spatial accessibility index for a HDB at location i. Pk is the number of the
study, Setting
Parameter
elderly in a HDB flat at location k. Sj is assumed to be a constant value of 1 for all CHAS GPs because
In this study, Ai is the spatial accessibility index for a HDB at location i. Pk is the number of the
it is the minimum number of doctors that can possibly be available at each CHAS GP, ensuring there
elderly in a HDB flat at location k. Sj is assumed to be a constant value of 1 for all CHAS GPs because
willit not
is thebeminimum
an over-calculation
number of of the physician-to-population
doctors that can possibly be available dkjeach
ratio. at is the distance
CHAS GP, between
ensuring athere
CHAS
GPwillat location j and a HDB flat at location k.
not be an over-calculation of the physician-to-population ratio. dkj is the distance between a
CHASThe GPthreshold distance
at location j and a(dHDB
0 ) wasflatset
at at 400 mk.because the elderly prefer to live within 1 km of a
location
healthcare The threshold distance (d0) was set at 400healthy
center, and the distance covered by m becauseSingaporeans
the elderly up to age
prefer 85 in
to live an assessment
within 1 km of a of
their functional exercise capacity was 560–105 m, independent of age. The
healthcare center, and the distance covered by healthy Singaporeans up to age 85 in an assessment lower end of this rangeof is
455their
m. However,
functional since
exerciseno capacity
networkwas dataset
560–105wasm, used and it canofbeage.
independent assumed
The lowerthatend
the of
route
this the elderly
range is
take455tom.reach their since
However, chosen no CHAS
networkGP will not
dataset wasalways
used and beitacan
straight line, 455
be assumed thatmthewas rounded
route down
the elderly
to take
400 m. to reach their chosen
A distance CHAS
threshold GP will
rather thannota always be a straight
travel-time thresholdline,
was455chosen
m was because
rounded thedown to
elderly
walk400at m.aA distance
varied pacethreshold rather than
but, if healthy andawilling,
travel-time
theythreshold
are able was chosen
to cover becausedistance
a certain the elderly
in awalk
given
timeat a[61–65].
varied pace but, if healthy and willing, they are able to cover a certain distance in a given time
[61–65].
3.4. Results
3.4. Results
The Ai values ranged between 0.000027 and 0.351234. Figure 4 is a thematic map showing the Ai
values;The Ai values
a darker shaderanged between
of color 0.000027
represents and 0.351234.
a higher Ai value, Figure
and 4a is a thematic
lighter shademap showing
of color the Ai a
represents
values;
lower Ai value.a darker shade of color represents a higher A i value, and a lighter shade of color represents a
lower
A hotAi value.
spot analysis was then performed on the Ai values. The Getis-Ord Gi* statistic for each
A hot spot analysis was then performed on the Ai values. The Getis-Ord Gi* statistic for each
HDB flat was calculated to find statistically significant hot spots of high or low value spatial clusters
HDB flat was calculated to find statistically significant hot spots of high or low value spatial clusters
based on z-scores and p-values.
based on z-scores and p-values.
The result from hot spot analysis is shown in Figure 5, where the blue areas represent statistically
The result from hot spot analysis is shown in Figure 5, where the blue areas represent statistically
significant clusters of cold spots, and the orange/red areas represent statistically significant clusters of
significant clusters of cold spots, and the orange/red areas represent statistically significant clusters
hot spots. Within the clusters of cold spots, the lightest blue indicates a confidence level of 90%, while
of hot spots. Within the clusters of cold spots, the lightest blue indicates a confidence level of 90%,
thewhile
darkest blue a confidence
the darkest level of
blue a confidence 99%,
level and so
of 99%, andon.so The yellow
on. The yellow points
pointsrepresent
representareas
areaswhere
whereno
statistically significant
no statistically clusters
significant are found.
clusters are found.
Figure4.
Figure 4. The
The Aii values
values of
ofeach
eachHDB
HDBflat.
flat.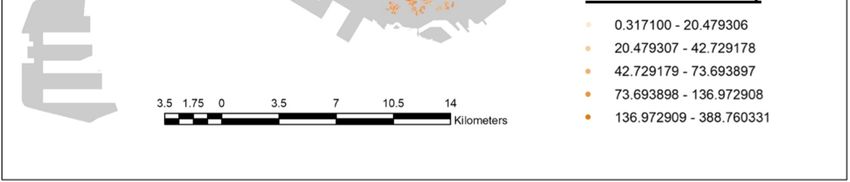
Int.
 Int.J.J.Environ.
          Environ.Res.
                   Res.Public
                        PublicHealth 2018,15,
                              Health2018,  15,1988
                                               x                                                             8 8ofof1515
   Int. J. Environ. Res. Public Health 2018, 15, x                                                         8 of 15

                                              Figure5.5.
                                              Figure
                                             Figure      Results
                                                      5.Results  of
                                                         Resultsof  the
                                                                     thehot
                                                                  ofthe  hotspot
                                                                        hot  spotanalysis.
                                                                            spot  analysis.
                                                                                 analysis.

4.4.Discussion
    4.Discussion
       Discussion

    ForFor
     For   further
        further
         further   analysisand
                 analysis
                  analysis    anddiscussion,
                             and   discussion, we
                                  discussion,   we produced
                                                    producedaaamap
                                                weproduced       mapdemarcating
                                                                map   demarcatingthe
                                                                       demarcatingtheplanning
                                                                                   theplanningboundaries
                                                                                       planning boundaries
                                                                                                 boundaries
  and
and   displaying
    displaying    onlythe
                only    theclusters
                             clustersofofhot
                                          hotand
                                              andcold
                                                  cold spots
                                                       spots (Figure
                                                             (Figure 6).
                                                                     6).
 and displaying only the clusters of hot and cold spots (Figure 6).

                    Figure 6. Results of hot spot analysis against the planning boundaries of Singapore.

               Figure
   4.1. Explanations
              Figure  6.6.the
                     on    Results ofhot
                                      hotspot
                              Hot Spots
                          Results of      spotanalysis
                                               analysisagainst
                                                        againstthe
                                                                theplanning
                                                                    planningboundaries
                                                                             boundariesofofSingapore.
                                                                                            Singapore.

 4.1. Explanations on the Hot Spots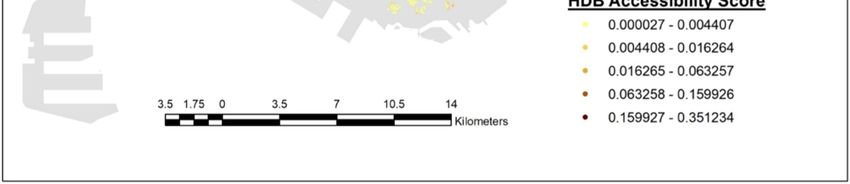
Int. J. Environ. Res. Public Health 2018, 15, 1988                                                  9 of 15

4.1. Explanations on the Hot Spots
      The hot spots could be a result of the maturity of the HDB Town. These spots are usually located
in or near to towns and estates that were developed before the 1980s, In fact these towns are regarded
as Mature Towns/Estates [66]. The Mature category includes areas such as Queenstown, Toa Payoh,
Clementi, Kallang, and the Middle-Aged category includes areas such as Jurong West, Bukit Panjang,
Choa Chu Kang, Hougang and Bukit Timah. In the map, these areas do have a cluster of hot spots,
possibly due to the organic growth of businesses in the area over the years. Understandably it also
includes GPs, and has a higher possibility of GPs in the area joining CHAS due to the larger number
(competition per se) of GPs. Interestingly, some of these hot spots are very close to where the first
HDB towns were built in the area. For example, the hot spot between Queenstown and Bukit Merah
is located near Forfar Heights, which stands in the place of Forfar House, the very first high-rise
apartment block built in 1956 [67,68]. Another example would be the hot spot in the north of Yishun,
which is located very close to the Chong Pang area, where the first HDB flats were built in the 1980s [67].
      Another reason for the hot spots could be the government’s setting up of rejuvenation projects in
the area. The Singapore government announced the Remaking Our Heartland (ROH) initiative in 2007
to help mature HDB towns keep up with modern designs [46]. This initiative tailors renewal plans
based on the needs of the community and ensures that the areas remain relevant and sustainable while
still maintaining their unique characteristics [69]. Areas like Punggol and Yishun were part of the first
batch of the chosen towns in 2007, and Hougang was part of the second batch in 2011. An outcome of
this initiative is that more GPs moved to these areas attracted by new facilities such as community
plazas and the enhancement of community and connectivity. This would cause an increase in the
number of people who would potentially visit the community plaza, thereby providing the GPs with a
larger potential consumer market [70]. Such an increased number of GPs would once again result in
more GPs in the area joining CHAS. With the ongoing and future projects under the ROH initiative,
this could attract more GPs to new areas and provide more primary healthcare services.

4.2. Explanations on the Cold Spots
      As for the cold spots, one very compelling reason could be the locations of polyclinics. The spread
of polyclinics does seem to match the spread of cold spots (Figure 7). As mentioned earlier, it would
be cheaper for elderly individuals to visit a polyclinic (further 50% subsidy on the already subsidized
services). Thus, it makes sense that GPs would try to avoid being close to them. On the other hand,
GPs may not have sufficient number of patients to join CHAS. This would then result in fewer GPs in
the area participating in CHAS (cold spots). It is quite likely that additional incentives are needed if
the government wants to encourage more GPs in the area to participate in CHAS.
      Another reason for cold spots could relate to the government’s city planning. For example,
Punggol is considered a “young” area because it was one of the few areas that had build-to-order
(BTO) HDB flats in around 2011. Since eligibility to purchase requires at least a nuclear family,
the demographics of the area tend to be young families and their children. This is actually echoed in
the figure where more than 11% of Punggol’s residents are aged 4 and below [47,71]. Consequently,
the infrastructure of the neighbourhood is featured with 52 childcare centers and two mega childcare
centers with 1000 places in each [71]. This concentration of efforts for a certain demographic group
may also mean overlooking the other, namely the elderly. A more balanced and comprehensive town
planning may be required while planning future new towns.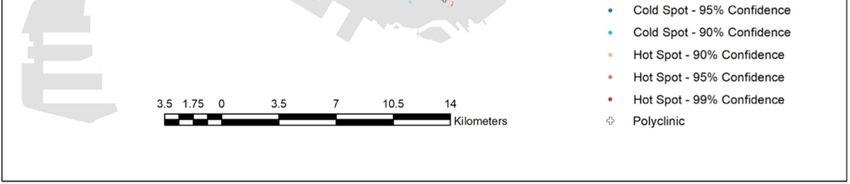
Int. J. Environ. Res. Public Health 2018, 15, 1988 10 of 15
Int. J. Environ. Res. Public Health 2018, 15, x 10 of 15
Figure7.7.Results
Figure Resultsof
ofhot
hotspot
spot analysis
analysis against
against locations
locationsofofpolyclinics.
polyclinics.
4.3.4.3. More
More Implications
Implications
In In this
this study,
study, GISconcept
GIS conceptandandmethods
methods havehave been utilized
utilizedto tomeasure
measuregeographical
geographical accessibility
accessibility
of one
of one major
major typetype of primary
of primary healthcare
healthcare services,
services, i.e., i.e.,
CHAS CHAS GPs,GPs,
to a to a scale
scale of HDBof HDB
flats,flats, i.e.,elderly
i.e., the the
living in HDB flats. This has worked better than in most other studies using the centroida of
elderly living in HDB flats. This has worked better than in most other studies using the centroid of
census population
a census populationtract tracttotoindicate
indicatethethe
demand
demand for for
all individuals
all individuals within the same
within the catchment
same catchment area
[4,18,43,44,72].
area [4,18,43,44,72]. This advantage
This advantage is aisdirect
a directoutcome
outcome of ofthethefiner
finerscale this
scale research
this research hashas reached.
reached.
Therefore, the results are considered more reliable for policy makers in the relevant fields.short
Therefore, the results are considered more reliable for policy makers in the relevant fields. In the In the
term, more efforts could be put into convincing and incentivizing GPs located near areas with clusters
short term, more efforts could be put into convincing and incentivizing GPs located near areas with
of low accessibility scores to participate in CHAS so as to improve the elderly’s geographical
clusters of low accessibility scores to participate in CHAS so as to improve the elderly’s geographical
accessibility to a GP at a subsidized cost. In addition, it should be noted that even within the areas
accessibility to a GP at a subsidized cost. In addition, it should be noted that even within the areas that
that do not have statistically significant clusters of high or low values, there are still individual places
do not have statistically significant clusters of high or low values, there are still individual places that
that may have low accessibility scores. These findings can also contribute the decision making process
mayin have
termslow accessibility
of directing scores.and
the current These findings
future effortscan also contribute the decision making process in
in CHAS.
terms ofOn directing the current and future efforts in CHAS.
the other hand, geographically (according to the map) more specific efforts should be put
Onincreasing
into the otherthe hand, geographically
number of CHAS GPs (according
in certaintoareas.
the map) more specific
It is worth efforts
noting that shouldareas
cold-spot be putsuch into
increasing
as Woodlands, Hougang/Sengkang/Punggol, Geylang, and Bishan/Ang Mo Kio are quite far away as
the number of CHAS GPs in certain areas. It is worth noting that cold-spot areas such
Woodlands,
from any hot Hougang/Sengkang/Punggol,
spots, making it quite impossible Geylang,
to drawand Bishan/Ang
on the resources Mo inKiothearehot-spot
quite farareas.
awayItfrom is
anyimportant
hot spots,tomaking
note thatit quite impossible
in a small to draw
city-state on the resources
like Singapore, although in planning
the hot-spot areas. It were
boundaries is important
used
to to
note that attention
direct in a smalltocity-state
specific like
hot Singapore,
or cold spots, although
peopleplanning
may notboundaries
view area were used as
boundary to direct
the
administratively determined boundary. This could contribute to the existence
attention to specific hot or cold spots, people may not view area boundary as the administratively of both hot and cold
spots within
determined one planning
boundary. boundary.
This could There istoathe
contribute need for greater
existence flexibility
of both hot andwith the spots
cold administrative
within one
arrangement
planning boundary.so that elderly
There is acitizens
need for may drawflexibility
greater on a nearby with yetthe
different administrative
administrative area. so that
arrangement
elderly In the long
citizens may term,
drawbasedon on the hotyet
a nearby spotdifferent
analysisadministrative
or accessibility scores,
area. follow-up research efforts
should be put into the optimization study to find out the best
In the long term, based on the hot spot analysis or accessibility scores, follow-up locations to set up GPsresearchwhoefforts
are
considering
should be putsetting
into theup new service centers.
optimization studyCarrying
to find out out athe hotbest
spotlocations
analysis on toaset
regular
up GPs basis,whosuchare
as once per year, has the potential to inform/update the status of gaps between
considering setting up new service centers. Carrying out a hot spot analysis on a regular basis, such the demand from the as
elderly and the supply from existing CHAS GPs.
once per year, has the potential to inform/update the status of gaps between the demand from the
elderly and the supply from existing CHAS GPs.
4.4. LimitationsInt. J. Environ. Res. Public Health 2018, 15, 1988 11 of 15
4.4. Limitations
One major limitation of the study relates to the distance decay function used, which reflects
the willingness to access a medical service and its determinant should be a function of a variety of
factors that is unique to the population under study. Ideally, the distance decay function should be
generated following an empirical investigation possibly applying regression methods on the data
collected. However, such a dataset was not available for this study, so a mathematical model had to
be used in this study as in many other studies [18,33,73–78]. Secondly, this study is cross-sectional
rather than a longitudinal study. There certainly are some dynamic factors that may bring about
very different results over time. Among them are targeted healthcare policy, increased health hazards
caused by global warming, and change in economy that may affect the contribution of income and
savings to elderly parents. These are all beyond the scope and control of this study.
5. Conclusions
Rapid ageing is a major regional if not global demographic challenge; it is not just faced by
Singapore, but many other countries. Primary healthcare services are critical to the elderly, and it is
important not only to have the concerned services available, but also has to be geographically accessible.
This study has examined the geographical accessibility of one representative healthcare service, i.e.,
CHAS GPs, for the elderly living in HDBs at the block level in Singapore by employing an enhanced
2-step floating catchment area method and a Gaussian distance-decay function in combination with
the GIS technology. This research has succeeded in reflecting the current status of the geographical
accessibility of CHAS GPs for elderly individuals living in HDBs across the entire Singapore. Areas
with relatively weak geographical accessibility of CHAS GPs have been spotted, explained and
discussed. Suggestions have been put forward for policy makers, and the value of using innovative
technology and approaches has been demonstrated, along with recommendation for future studies.
In the long run, the spatial analysis should also be repeated on a regular basis for better understanding
the change in geographical accessibility of CHAS GPs alongside the change of the elderly demographics
in Singapore. Similar geographical accessibility studies could be conducted with respect to a variety of
healthcare resources such as general hospitals, polyclinics, post-acute care, with support from GIS, for
meeting the needs of the elderly and other specific groups.
Author Contributions: O.M.L.D., M.Y.L.C. and K.C. conceived the research ideas and wrote the paper; O.M.L.D.
and K.C. conceived and designed the experiments; O.M.L.D. performed the experiments and analyzed the data;
M.Y.L.C. and K.C. contributed to subsequent manuscript revisions.
Acknowledgments: This work was supported by the research grant (R-101-000-054-720) from the Next Age
Institute (NAI) at the National University of Singapore.
Conflicts of Interest: The authors declare no conflicts of interest.
References and Note
1. Bynum, J.; Chang, C.; Austin, A.; Carmichael, D.; Meara, E. Outcomes in Older Adults with Multimorbidity
Associated with Predominant Provider of Care Specialty. J. Am. Geriatr. Soc. 2017, 65, 1916–1923. [CrossRef]
[PubMed]
2. Edwards, S.; Landon, B. Seeking Value in Healthcare: The Importance of Generalists as Primary Care
Physicians. J. Am. Geriatr. Soc. 2017, 65, 1900–1901. [CrossRef] [PubMed]
3. Deraas, T.; Berntsen, G.; Jones, A.; Førde, O.; Sund, E. Associations between primary healthcare and
unplanned medical admissions in Norway: A multilevel analysis of the entire elderly population. BMJ Open
2014, 4, e004293. [CrossRef] [PubMed]
4. Luo, W.; Wang, F. Measure of spatial accessibility to healthcare in a GIS environment: Synthesis and a case
study in the Chicago region. Environ. Plan. B 2003, 30, 865–884. [CrossRef]
5. Guagliardo, M. Spatial accessibility of primary care: Concept, methods and challenges. Int. J. Health Geogr.
2004, 3. [CrossRef] [PubMed]Int. J. Environ. Res. Public Health 2018, 15, 1988 12 of 15
6. Joseph, A.E.; Phillips, D.R. Accessibility and Utilization: Geographical Perspectives on Health Care Delivery;
Sage: Newcastle upon Tyne, UK, 1984.
7. DOS. Population Trends. 2017. Available online: https://www.singstat.gov.sg/statistics/visualising-data/
storyboards/population-trends (accessed on 12 November 2017).
8. NPTD. Ageing. 2017. Available online: https://www.population.sg/ageing (accessed on 12 November 2017).
9. MOH. Speech by Mr Gan Kim Yong, Minister for Health, at the SG50 Scientific Conference on Ageing,
on 19 March 2015, ‘Ageing in Singapore in the Next 50 Years’.
10. Cheng, Y. Residential Care for Elderly People in Beijing; A Study of the Relationship between Health and Place:
Beijing, China, 2010.
11. Loo, B.P.; Lam, W.W.Y. Geographic accessibility around health care facilities for elderly residents in
Hong Kong: A microscale walkability assessment. Environ. Plan. B Plan. Des. 2012, 39, 629–646.
12. Wei, Z. A Study of Accessibility to Health Facilities for Elderly People in Metro Atlanta Using a Categorical
Multi-Step Floating Catchment Area Method. Master’s Thesis, University of Georgia, Athens, GA, USA, 2013.
13. MOH. Life Expectancy in Singapore. 2016. Available online: http://www.singstat.gov.sg/docs/default-
source/default-document-library/publications/publications_and_papers/births_and_deaths/lifetable15-
16.pdf (accessed on 12 November 2017).
14. Khan, A. An integrated approach to measuring potential spatial access to health care services. Soc.-Econ.
Plan. Sci. 1992, 26, 275–287. [CrossRef]
15. Wing, P.; Reynolds, C. The availability of physician services: A geographic analysis. Health Serv. Res. 1988,
23, 649–667. [PubMed]
16. Huff, D.L. A probabilistic analysis of shopping center trade areas. Land Econ. 1963, 39, 81–90. [CrossRef]
17. Huff, D.L. Defining and estimating a trading area. J. Mark. 1964, 28, 34–38. [CrossRef]
18. Luo, W.; Qi, Y. An enhanced two-step floating catchment area (E2SFCA) method for measuring spatial
accessibility to primary care physicians. Health Place 2009, 15, 110–1107. [CrossRef] [PubMed]
19. Joseph, A.E.; Bantock, P.R. Measuring potential physical accessibility to general practitioners in rural areas:
A method and case study. Soc. Sci. Med. 1982, 16, 85–90. [CrossRef]
20. Seow, L.S.E.; Subramaniam, M.; Abdin, E.; Vaingankar, J.A.; Chong, S.A. Hypertension and its associated
risks among Singapore elderly residential population. J. Clin. Gerontol. Geriatr. 2015, 6, 125–132. [CrossRef]
21. Lim, W.S.; Ding, Y.Y. Evidence-balance Medicine: “Real” Evidence-based Medicine in the Elderly.
Ann. Acad. Med. 2015, 44, 1–5.
22. Tan, N.E.; Sagayadevan, V.; Abdin, E.; Picco, L.; Vaingankar, J.; Chong, S.A.; Subramaniam, M. Employment
status among the Singapore elderly and its correlates. Psychogeriatrics 2017, 17, 155–163. [CrossRef] [PubMed]
23. Kua, E.H. Colours of Ageing: 30 Years of Research on the Mental Health of the Singapore Elderly;
Write Editions: Singapore, 2017. Available online: http://www.nlb.gov.sg/biblio/202747162 (accessed on
12 November 2017).
24. Chen, A.J.; Cheung PP, L. The Elderly in Singapore; ASEAN Population Co-ordinating Unit: Singapore, 1988.
25. Wee, L.E.; Yong, Y.Z.; Chng, M.W.X.; Chew, S.H.; Cheng, L.; Chua, Q.H.A.; Yek, J.J.L.; Lau, L.J.F.; Anand, P.;
Hoe, J.T.M.; et al. Individual and area-level socioeconomic status and their association with depression
amongst community-dwelling elderly in Singapore. Aging Ment. Health 2014, 18, 628–641. [CrossRef]
[PubMed]
26. Yap, M.T. State of the Elderly in Singapore 2008–2009; Ministry of Community Development, Youth and Sports:
Singapore, 2010.
27. Wong, L.Y.; Heng, B.H.; Cheah, J.T.S.; Tan, C.B. Using spatial accessibility to identify polyclinic service gaps
and volume of under-served population in Singapore using Geographic Information System. Int. J. Health
Plan. Manag. 2012, 27. [CrossRef] [PubMed]
28. Koh, P.; Leow, B.; Wong, Y. Mobility of the elderly in densely populated neighbourhoods in Singapore.
Sustain. Cities Soc. 2015, 14, 126–132. [CrossRef]
29. Peng, Z. The job-housing balance and urban commuting. Urban Stud. 1997, 34, 1215–1235. [CrossRef]
30. Wang, F. Modeling commuting patterns in Chicago in a GIS environment: A job accessibility perspective.
Prof. Geogr. 2000, 52, 120–133. [CrossRef]
31. Silverman, B.W. Density Estimation for Statistics and Data Analysis; Chapman and Hall: London, UK, 1986.Int. J. Environ. Res. Public Health 2018, 15, 1988 13 of 15
32. Luo, W.; Qi, Y. Using a GIS-based floating catchment method to assess areas with shortage of physicians.
Health Place 2004, 10, 1–11. [CrossRef]
33. Kanuganti, S.; Sarkar, A.; Singh, A. Evaluation of access to health care in rural areas using enhanced two-step
floating catchment area (E2SFCA) method. J. Transp. Geogr. 2016, 56, 45–52. [CrossRef]
34. Donohoe, J.; Marshall, V.; Tan, X.; Camacho, F.; Anderson, R.; Balkrishnan, R. Predicting Late-stage Breast
Cancer Diagnosis and Receipt of Adjuvant Therapy: Applying Current Spatial Access to Care Methods in
Appalachia. Med. Care 2015, 53, 980–988. [CrossRef] [PubMed]
35. McGrail, M.R.; Humphreys, J.S. Measuring spatial accessibility to primary healthcare services: Utilising
dynamic catchment sizes. Appl. Geogr. 2014, 54, 182–188. [CrossRef]
36. Kwan, M.P. Space-time and integral measures of individual accessibility: A comparative analysis using a
point-based framework. Geogr. Anal. 1998, 30, 191–216. [CrossRef]
37. Langford, M.; Fry, R.; Higgs, G. Measuring transit system accessibility using a modified two-step floating
catchment technique. Int. J. Geogr. Inf. Sci. 2012, 26, 193–214. [CrossRef]
38. Delamater, P.L. Spatial accessibility in suboptimally configured health care systems: A modified two-step
floating catchment area (M2SFCA) metric. Health Place 2013, 24, 30–43. [CrossRef] [PubMed]
39. Dai, D. Black residential segregation, disparities in spatial access to health care facilities, and late-stage breast
cancer diagnosis in metropolitan Detroit. Health Place 2010, 16, 1038–1052. [CrossRef] [PubMed]
40. Wang, F. Measurement, optimization, and impact of health care accessibility: A methodological review.
Ann. Assoc. Am. Geogr. 2012, 102, 1104–1112. [CrossRef] [PubMed]
41. Dai, D.; Wang, F. Geographic disparities in accessibility to food stores in southwest Mississippi. Environ. Plan.
B Plan. Des. 2011, 38, 659–677. [CrossRef]
42. Yang, D.H.; Goerge, R.; Mullner, R. Comparing GIS-based methods of 187 measuring spatial accessibility to
health services. J. Med. Syst. 2006, 30, 23–32. [CrossRef] [PubMed]
43. Luo, W.; Whippo, T. Variable catchment sizes for the two-step floating catchment area (2SFCA) method.
Health Place 2012, 18, 789–795. [CrossRef] [PubMed]
44. Schuurman, N.; Bérubé, M.; Crooks, V. Measuring potential spatial access to primary health care physicians
using a modified gravity model. Can. Geogr. Géogr. Can. 2010, 54, 29–45. [CrossRef]
45. MOF. Pioneer Generation Package is Adequately Funded and will be Transparent. 2014. Available
online: http://www.mof.gov.sg/news-reader/articleid/1446/parentId/59/year/undefined?wmode=
transparent (accessed on 12 November 2017).
46. Singapore_Government. Pioneer Generation Package Overview. 2017. Available online: https://www.
pioneers.sg/en-sg/Pages/Overview.aspx (accessed on 12 November 2017).
47. DOS. Resident Population by Planning Area, Age Group and Type of Dwelling Jun 2017; DOS: Singapore, 2017.
48. MOH. Healthcare Institution Statistics. 2017. Available online: https://www.moh.gov.sg/content/moh_
web/home/statistics/healthcare_institutionstatistics.html (accessed on 12 November 2017).
49. MOH. Polyclinics. 2011. Available online: https://www.moh.gov.sg/content/moh_web/home/
pressRoom/Parliamentary_QA/2011/polyclinics.html (accessed on 12 November 2017).
50. NHGP. Our Clinics. 2017. Available online: https://www.nhgp.com.sg/Find_A_Polyclinic_Near_You/
(accessed on 12 November 2017).
51. SingHealth. About Us. 2014. Available online: https://polyclinic.singhealth.com.sg/aboutus/ourpolyclinics/
Pages/home.aspx (accessed on 12 November 2017).
52. Saultz, J.; Lochner, J. Interpersonal Continuity of Care and Care Outcomes: A Critical Review. Ann. Fam. Med.
2005, 3, 159–166. [CrossRef] [PubMed]
53. MOH. Primary Care Subsidies. 2017. Available online: https://www.moh.gov.sg/content/moh_
web/home/pressRoom/Current_Issues/2014/s-3ms-resources/primary-care-subsidies.html (accessed on
12 November 2017).
54. CHAS. About CHAS. 2017. Available online: http://www.chas.sg/content.aspx?id=636 (accessed on
12 November 2017).
55. MOH. Health Manpower. 2017. Available online: https://www.moh.gov.sg/content/moh_web/home/
statistics/Health_Facts_Singapore/Health_Manpower.html (accessed on 12 November 2017).Int. J. Environ. Res. Public Health 2018, 15, 1988 14 of 15
56. Kang, S.; Tan, E.; Yap, M. National Survey of Senior Citizens 2011. 2013. Available online: Duke-nus.edu.sg:
https://www.duke-nus.edu.sg/care/wp-content/uploads/National-Survey-of-Senior-Citizens-2011.pdf
(accessed on 12 November 2017).
57. MOH. Bulk of Clinics Are in CHAS Scheme. 2017. Available online: https://www.moh.gov.sg/content/
moh_web/home/pressRoom/Media_Forums/2017/bulk-of-clinics-are-in-chas-scheme.html (accessed on
12 November 2017).
58. LTA. Enhancing Physical Accessibility for All. Making Travel Easier For You; Public Transport; 2017.
Available online: https://www.lta.gov.sg/content/ltaweb/en/public-transport/system-design/enhancing-
physical-accessibility-for-all.html (accessed on 12 November 2017).
59. Krishnasamy, C.; Unsworth, C.; Howie, L. Exploring the mobility preferences and perceived difficulties in
using transport and driving with a sample of healthy and outpatient older adults in Singapore. Aust. Occup.
Ther. J. 2013, 60, 129–137. [CrossRef] [PubMed]
60. DOS. Table 11A. Average Monthly Household Income from Work (Including Employer CPF Contributions)
Among Resident Employed Households by Type of Dwelling, 2000–2016. 2017. Available online:
http://www.tablebuilder.singstat.gov.sg/publicfacing/createSpecialTable.action?refId=12315 (accessed on
12 November 2017).
61. Bollard, E.; Fleming, H. A study to investigate the walking speed of elderly adults with relation to pedestrian
crossings. Physiother. Theory Pract. 2013, 29, 142–149. [CrossRef] [PubMed]
62. Fiser, W.; Hays, N.; Rogers, S.; Kajkenova, O.; Williams, A.; Evans, C.; Evans, W. Energetics of Walking in
Elderly People: Factors Related to Gait Speed. J. Gerontol. Ser. A Biol. Sci. Med. Sci. 2010, 65, 1332–1337.
[CrossRef] [PubMed]
63. Harwood, R.; Conroy, S. Slow walking speed in elderly people. BMJ 2009, 339, b4236. [CrossRef] [PubMed]
64. Lindemann, U.; Najafi, B.; Zijlstra, W.; Hauer, K.; Muche, R.; Becker, C.; Aminian, K. Distance to achieve
steady state walking speed in frail elderly persons. Gait Posture 2008, 27, 91–96. [CrossRef] [PubMed]
65. Yeo, S.; He, Y. Commuter characteristics in mass rapid transit stations in Singapore. Fire Saf. J. 2009, 44,
183–191. [CrossRef]
66. HDB. Public Housing in Singapore: Residents’ Profile, Housing Satisfaction and Preferences; HDB: Singapore, 2014.
67. HDB. History. 2017. Available online: http://www.hdb.gov.sg/cs/infoweb/about-us/history (accessed on
12 November 2017).
68. Remember_Singapore. From Villages to Flats (Part 2)—Public Housing in Singapore. 2012.
Available online: https://remembersingapore.org/2012/05/11/from-villages-to-flats-part-2/ (accessed on
12 November 2017).
69. HDB. Remaking Our Heartland. 2017. Available online: http://www20.hdb.gov.sg/fi10/fi10349p.nsf/
hdbroh/index.html (accessed on 12 November 2017).
70. Karthigayan, R. Remarking Our Heartland—Rejuvenating Singapore. 2017. Available online: https://www.
gov.sg/news/content/remaking-our-heartlands-rejuvenating-singapore (accessed on 12 November 2017).
71. Abdullah, Z. Punggol: Singapore’s Baby Town. The Straits Times. 8 June 2017. Available online: http:
//www.straitstimes.com/singapore/singapores-baby-town (accessed on 12 November 2017).
72. Kuai, X.; Zhao, Q. Examining healthy food accessibility and disparity in Baton Rouge, Louisiana. Ann. GIS
2017, 23, 103–116. [CrossRef]
73. Yu, J.C. GIS-Based Approach to the Characterisation of Spatial Accessibility to Primary Health Care
Facilities in the Melbourne Metropolitan Area. Master’s Thesis, RMIT University, RMIT University Research
Repository, Melbourne, Australia, 2014.
74. Dai, D. Racial/ethnic and socioeconomic disparities in urban green space accessibility: Where to intervene.
Landsc. Urban Plan. 2011, 102, 234–244. [CrossRef]
75. Ni, J.; Wang, J.; Rui, Y.; Qian, T.; Wang, J. An Enhanced Variable Two-Step Floating Catchment Area Method
for Measuring Spatial Accessibility to Residential Care Facilities in Nanjing. Int. J. Environ. Res. Public Health
2015, 12, 14490–14504. [CrossRef] [PubMed]
76. Polo, G.; Acosta, C.M.; Ferreira, F.; Dias, R.A. Location-Allocation and Accessibility Models for Improving
Spatial Planning of Public Health Services. PLoS ONE 2015, 10, e0119190. [CrossRef] [PubMed]Int. J. Environ. Res. Public Health 2018, 15, 1988 15 of 15
77. Zhan, Q.; Wang, X.; Sliuzas, R. A GIS-based method to assess the shortage areas of community health service.
In Proceedings of the 2011 International Conference On Remote Sensing, Environment and Transportation
Engineering, Nanjing, China, 24–26 June 2011; pp. 5654–5657. [CrossRef]
78. Polo, G.; Acosta, C.M.; Dias, R.A. Spatial accessibility to vaccination sites in a campaign against rabies in São
Paulo city, Brazil. Prev. Vet. Med. 2013, 111, 10–16. [CrossRef] [PubMed]
© 2018 by the authors. Licensee MDPI, Basel, Switzerland. This article is an open access
article distributed under the terms and conditions of the Creative Commons Attribution
(CC BY) license (http://creativecommons.org/licenses/by/4.0/).You can also read