Evidence for transmission of COVID-19 prior to symptom onset - eLife
←
→
Page content transcription
If your browser does not render page correctly, please read the page content below
RESEARCH ARTICLE

                                    Evidence for transmission of COVID-19
                                    prior to symptom onset
                                    Lauren C Tindale1†, Jessica E Stockdale2†, Michelle Coombe1, Emma S Garlock2,
                                    Wing Yin Venus Lau2, Manu Saraswat1, Louxin Zhang3, Dongxuan Chen4,5,
                                    Jacco Wallinga4,5, Caroline Colijn2*
                                    1
                                     University of British Columbia, Vancouver, Canada; 2Simon Fraser University,
                                    Burnaby, Canada; 3National University of Singapore, Singapore, Singapore; 4Centre
                                    for Infectious Disease Control, National Institute for Public Health and the
                                    Environment, Bilthoven, Netherlands; 5Leiden University Medical Center, Leiden,
                                    Netherlands

                                    Abstract We collated contact tracing data from COVID-19 clusters in Singapore and Tianjin,
                                    China and estimated the extent of pre-symptomatic transmission by estimating incubation periods
                                    and serial intervals. The mean incubation periods accounting for intermediate cases were 4.91 days
                                    (95%CI 4.35, 5.69) and 7.54 (95%CI 6.76, 8.56) days for Singapore and Tianjin, respectively. The
                                    mean serial interval was 4.17 (95%CI 2.44, 5.89) and 4.31 (95%CI 2.91, 5.72) days (Singapore,
                                    Tianjin). The serial intervals are shorter than incubation periods, suggesting that pre-symptomatic
                                    transmission may occur in a large proportion of transmission events (0.4–0.5 in Singapore and 0.6–
                                    0.8 in Tianjin, in our analysis with intermediate cases, and more without intermediates). Given the
                                    evidence for pre-symptomatic transmission, it is vital that even individuals who appear healthy
                                    abide by public health measures to control COVID-19.

*For correspondence:
ccolijn@sfu.ca                      Introduction
†
 These authors contributed          The novel coronavirus disease, COVID-19, was first identified in Wuhan, Hubei Province, China in
equally to this work                December 2019 (Li et al., 2020b; Huang et al., 2020). The virus causing the disease was soon
                                    named severe acute respiratory syndrome coronavirus 2 (SARS-CoV-2) (Hui et al., 2020) and quickly
Competing interest: See
                                    spread to other regions of China and then across the globe, causing a pandemic with over 5 million
page 15
                                    cases and 300,000 deaths at the time of writing (Johns Hopkins University, 2020). In Tianjin, a
Funding: See page 15                metropolis located at the north of China, the first case was confirmed on January 21, 2020
Received: 23 March 2020             (Tianjin Health Commission, 2020). Two days later, the first case was confirmed in Singapore
Accepted: 21 June 2020              (Ministry of Health Singapore, 2020), a city country in Southeast Asia. As of February 28, 2020, 93
Published: 22 June 2020             and 135 cases had been confirmed in Singapore and Tianjin (Ministry of Health Singapore, 2020;
                                    Tianjin Health Commission, 2020). The first Singapore COVID-19 case was confirmed as an individ-
Reviewing editor: Marc
                                    ual who had travelled to Singapore from Wuhan. Many of the initial cases were imported from
Lipsitch, Harvard TH Chan
School of Public Health, United
                                    Wuhan, with later cases being caused by local transmission. Singaporean officials worked to identify
States                              potential contacts of confirmed cases; close contacts were monitored and quarantined for 14 days
                                    from their last exposure to the patient, and other low-risk contacts were put under active surveil-
   Copyright Tindale et al. This
                                    lance and contacted daily to monitor their health status. These early outbreaks continue to provide
article is distributed under the
                                    the opportunity to estimate key parameters to understand COVID-19 transmission dynamics.
terms of the Creative Commons
Attribution License, which             We screened publicly available data to identify datasets for two COVID-19 clusters that could be
permits unrestricted use and        used to estimate transmission dynamics. In both Singapore and Tianjin, the COVID-19 outbreak
redistribution provided that the    occurred within a relatively closed system where immediate public health responses were imple-
original author and source are      mented, contacts were identified and quarantined, and key infection dates were tracked and
credited.                           updated daily. With its experiences in control of the SARS outbreak, the Singaporean government

Tindale et al. eLife 2020;9:e57149. DOI: https://doi.org/10.7554/eLife.57149                                                     1 of 23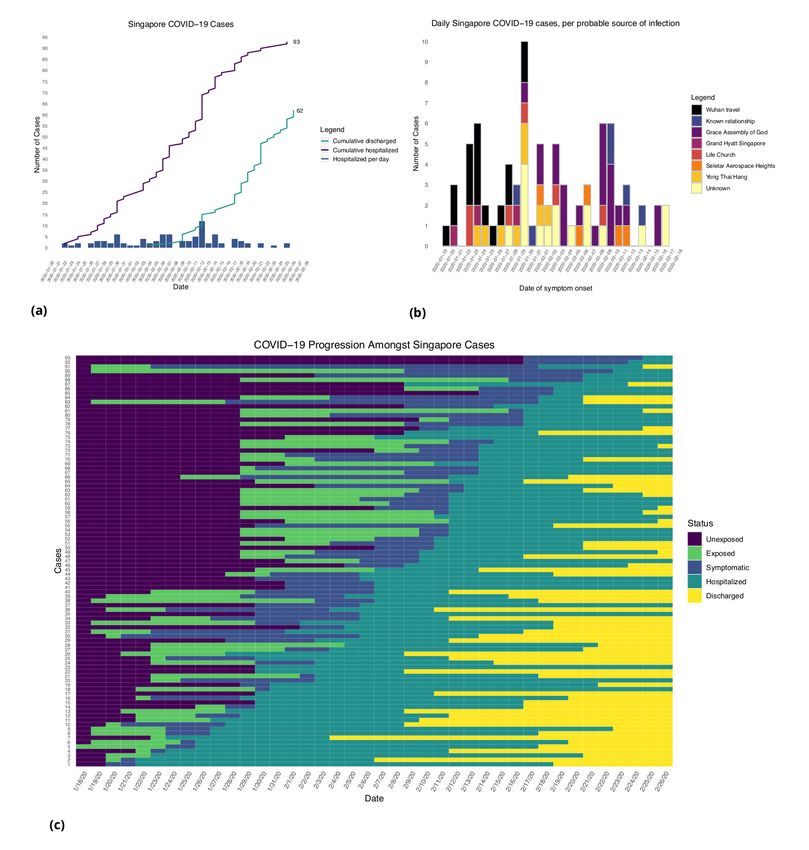
Research article                                                                                    Epidemiology and Global Health

                                    eLife digest The first cases of COVID-19 were identified in Wuhan, a city in Central China, in
                                    December 2019. The virus quickly spread within the country and then across the globe. By the third
                                    week in January, the first cases were confirmed in Tianjin, a city in Northern China, and in Singapore,
                                    a city country in Southeast Asia. By late February, Tianjin had 135 cases and Singapore had 93 cases.
                                    In both cities, public health officials immediately began identifying and quarantining the contacts of
                                    infected people.
                                       The information collected in Tianjin and Singapore about COVID-19 is very useful for scientists. It
                                    makes it possible to determine the disease’s incubation period, which is how long it takes to
                                    develop symptoms after virus exposure. It can also show how many days pass between an infected
                                    person developing symptoms and a person they infect developing symptoms. This period is called
                                    the serial interval. Scientists use this information to determine whether individuals infect others
                                    before showing symptoms themselves and how often this occurs.
                                       Using data from Tianjin and Singapore, Tindale, Stockdale et al. now estimate the incubation
                                    period for COVID-19 is between five and eight days and the serial interval is about four days. About
                                    40% to 80% of the novel coronavirus transmission occurs two to four days before an infected person
                                    has symptoms. This transmission from apparently healthy individuals means that staying home when
                                    symptomatic is not enough to control the spread of COVID-19. Instead, broad-scale social
                                    distancing measures are necessary.
                                       Understanding how COVID-19 spreads can help public health officials determine how to best
                                    contain the virus and stop the outbreak. The new data suggest that public health measures aimed at
                                    preventing asymptomatic transmission are essential. This means that even people who appear
                                    healthy need to comply with preventive measures like mask use and social distancing.

                                    had been adopting a case-by-case control policy from January 2, 2020. Only close contacts of a con-
                                    firmed case were monitored and quarantined for 14 days. In Tianjin, a number of COVID-19 cases
                                    were traced to a department store, where numerous customers and sales associates were likely
                                    infected. Additional customers who had potential contact were asked to come forward through state
                                    news and social media, as well as asked if they had visited the department store at various check-
                                    points in the city. All individuals identified as having visited the store in late January were quaran-
                                    tined and sections of the Baodi District where the store is located were sealed and put under
                                    security patrol.
                                        We estimate the serial interval and incubation period of COVID-19 from clusters of cases in Singa-
                                    pore and Tianjin. The serial interval is defined as the length of time between symptom onset in a pri-
                                    mary case (infector) and symptom onset in a secondary case (infectee), whereas the incubation
                                    period is defined as the length of time between an infectee’s exposure to a virus and their symptom
                                    onset. Both are important parameters that are widely used in modeling in infectious disease, as they
                                    impact model dynamics and hence fits of models to data. While the pandemic has progressed far
                                    beyond these early outbreaks, it remains the case that mathematical modelling, using parameters
                                    derived from estimates like these, is widely used in forecasting and policy.
                                        The serial interval and incubation period distributions, in particular, can be used to identify the
                                    extent of pre-symptomatic transmission (i.e. viral transmission from an individual that occurs prior to
                                    symptom onset). There is evidence that pre-symptomatic transmission accounts for a considerable
                                    portion of COVID-19 spread (Arons et al., 2020; Baggett et al., 2020; Li et al., 2020a) and it is
                                    important to determine the degree to which this is occurring (Peak et al., 2020). Early COVID-19
                                    estimates borrowed parameters from SARS (Wu et al., 2020; Jiang et al., 2020; Abbott et al.,
                                    2020), but more recent estimates have been made using information from early clusters of COVID-
                                    19 cases, primarily in Wuhan. Depending on the population used, estimates for incubation periods
                                    have ranged from 3.6 to 6.4 days and serial intervals have ranged from 4.0 to 7.5 days (Li et al.,
                                    2020b; Ki and Task Force for 2019-nCoV, 2020; Backer et al., 2019; Linton et al., 2020;
                                    Nishiura et al., 2020); however, it is crucial that the estimates of incubation period and serial interval
                                    are based on the same outbreak, and are compared to those obtained from outbreaks in other pop-
                                    ulations. Distinct outbreak clusters are ideal for understanding how COVID-19 can spread through a

Tindale et al. eLife 2020;9:e57149. DOI: https://doi.org/10.7554/eLife.57149                                                           2 of 23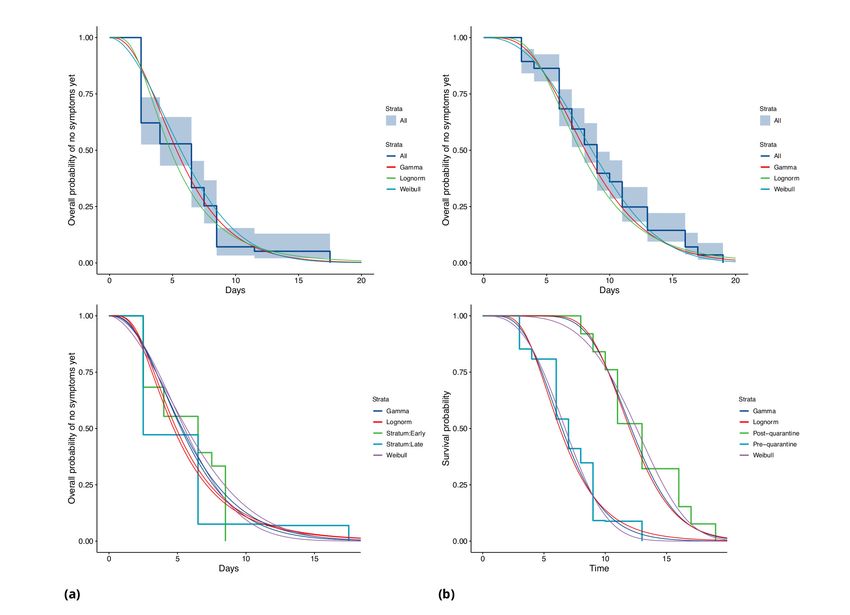
Research article Epidemiology and Global Health
population with no prior exposure to the virus. Here, we estimate the portion of transmission that is
pre-symptomatic based on estimates of the incubation period and serial interval. We estimate both
quantities under two frameworks: first, we use samples as directly as is feasible from the data, for
example assuming that the health authorities’ epidemiological inferences regarding who exposed
whom and who was exposed at which times are correct. Second, we use estimation methods that
allow for unknown intermediate cases, such that the presumed exposure and infection events may
not be complete. We also separate the analysis of incubation period according to earlier and later
phases of the outbreaks, since measures were introduced during the time frame of the data.
Results
Descriptive analyses
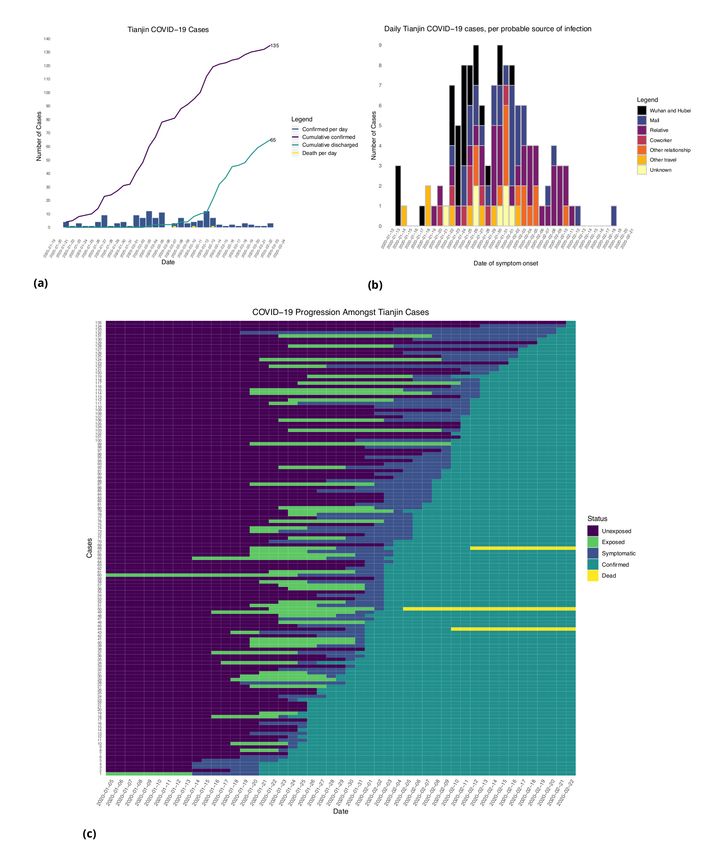
Figures 1 and 2 show the daily counts, putative origin of the exposure and individual time courses
for the Singapore and Tianjin data. In the Singapore dataset, new hospitalization and discharge
Figure 1. Singapore COVID-19 cases. (a) Daily hospitalized cases and cumulative hospitalized and discharged cases. (b) Daily incidence with probable
source of infection. (C) Disease timeline, including dates at which each case is unexposed, exposed, symptomatic, hospitalized, and discharged. Not all
cases go through each status as a result of missing dates for some cases.
Tindale et al. eLife 2020;9:e57149. DOI: https://doi.org/10.7554/eLife.57149 3 of 23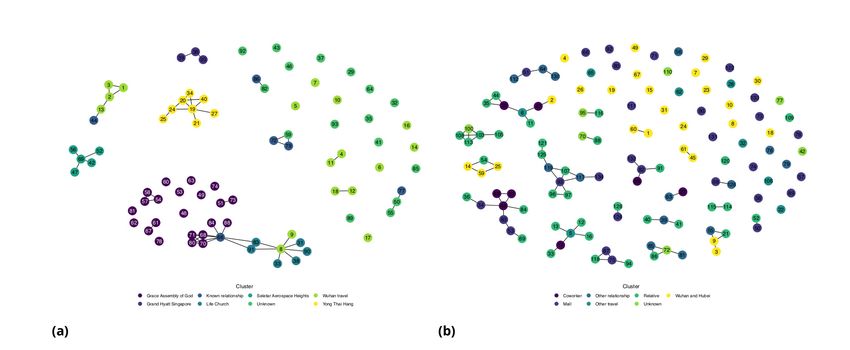
Research article                                                                                           Epidemiology and Global Health

Figure 2. Tianjin COVID-19 cases. (a) Daily and cumulative confirmed cases, cumulative discharges and daily death cases. (b) Daily incidence with
probable source of infection. (c) Disease progression timeline; not all cases go through each status as a result of missing dates for some cases.

                                     cases were documented daily from January 23 to February 26, 2020. 66.7% (62/93) of the confirmed
                                     cases recovered and were discharged from the hospital by the end of the study period (Figure 1(a)).
                                     The disease progression timeline of the 93 documented cases in Figure 1(c) indicates that symptom
                                     onset occurred 1.71 ± 3.01 (mean ± SD) days after the end of possible viral exposure window and
                                     cases were confirmed 7.43 ± 5.28 days after symptom onset. The mean length of hospital stay was
                                     13.3 ± 6.01 days before individuals recovered and were discharged.
                                        In the Tianjin dataset, new confirmed cases were documented daily from January 21 to February
                                     22, 2020. 48.1% (65/135) recovered and 2.2% (3/135) had died by the end of the study period (Fig-
                                     ure 2(a)). The timeline of the 135 cases is shown in Figure 2(c). Symptom onset occurred 4.98 ±
                                     4.83 (mean ± SD) days after the end of the possible viral exposure window. Cases were confirmed
                                     5.23 ± 4.15 days after symptom onset. The duration of hospital stay of the Tianjin cases is unknown

Tindale et al. eLife 2020;9:e57149. DOI: https://doi.org/10.7554/eLife.57149                                                                    4 of 23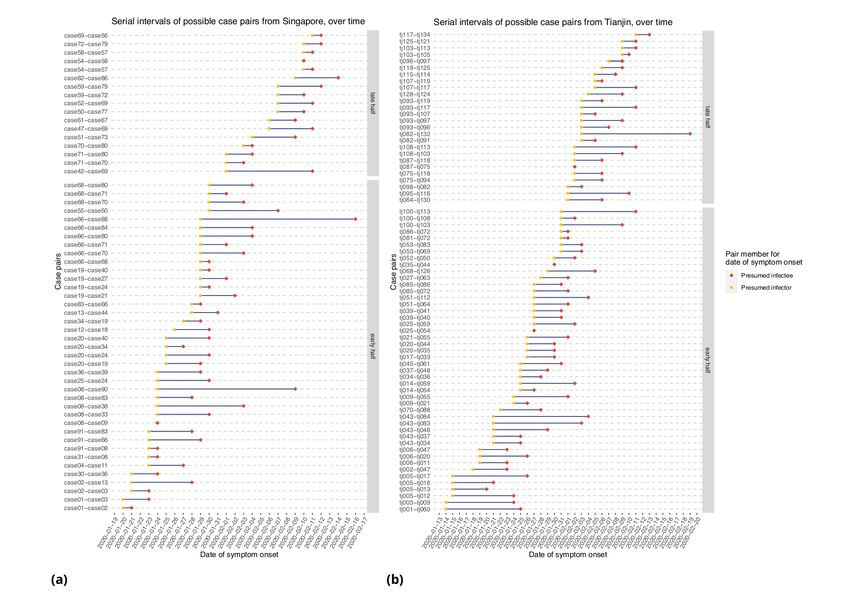
Research article                                                                                   Epidemiology and Global Health

         0.15

         0.10
                                                                                                                                Singapore, all
                                                                                                                                Singapore, early
                                                                                                                                Singapore, late
                                                                                                                                Tianjin, all

         0.05                                                                                                                   Tianjin, early
                                                                                                                                Tianjin, late

         0.00

                      0                      5                 10                     15                     20
                                                             Days

Figure 3. Fitted gamma COVID-19 incubation period distributions (without intermediates). Cases are defined as ‘early’ if they have symptom onset on
or prior to January 31, and are classified ‘late’ otherwise.

Table 1. Mean incubation period, serial interval and pre-symptomatic transmission.
Incubation periods are based on the gamma estimates because these are the most convenient for taking the covariation of serial inter-
vals and incubation periods into account (done throughout the table). 95% CIs are provided in brackets.
Without intermediates              Incubation (days)      Serial interval (days)       Mean difference (days)           Portion pre-symptomatic(-)
Singapore (all)                    5.99 (4.97, 7.14)      4.0 (2.73, 5.57)             1.99                             0.74
Singapore (early)                  5.91 (4.50,7.64)                                    1.91                             0.742
Singapore (late)                   6.06 (4.70, 7.67 )                                  2.06                             0.744
Tianjin (all)                      8.68 (7.72, 9.7)       5.0 (3.82, 6.12)             3.68                             0.81
Tianjin (early)                    6.88 (5.97,7.87)                                    1.88                             0.72
Tianjin (late)                     12.4 (11.1,13.7)                                    7.4                              0.96
Account for intermediates
Singapore r ¼ 0:05                 4.91                   4.17 (2.44, 5.89)            0.77                             0.53
Singapore r ¼ 0:1                  4.43                                                0.26                             0.46
Singapore r ¼ 0:15                 4.12                                                    0.05                         0.41
Singapore r ¼ 0:2                  3.89                                                    0.28                         0.38
Tianjin r ¼ 0:05                   7.54                   4.31 (2.91, 5.72)            3.23                             0.79
Tianjin r ¼ 0:1                    6.89                                                2.58                             0.74
Tianjin r ¼ 0:15                   6.30                                                1.99                             0.67
Tianjin r ¼ 0:2                    5.91                                                1.6                              0.64

Tindale et al. eLife 2020;9:e57149. DOI: https://doi.org/10.7554/eLife.57149                                                                      5 of 23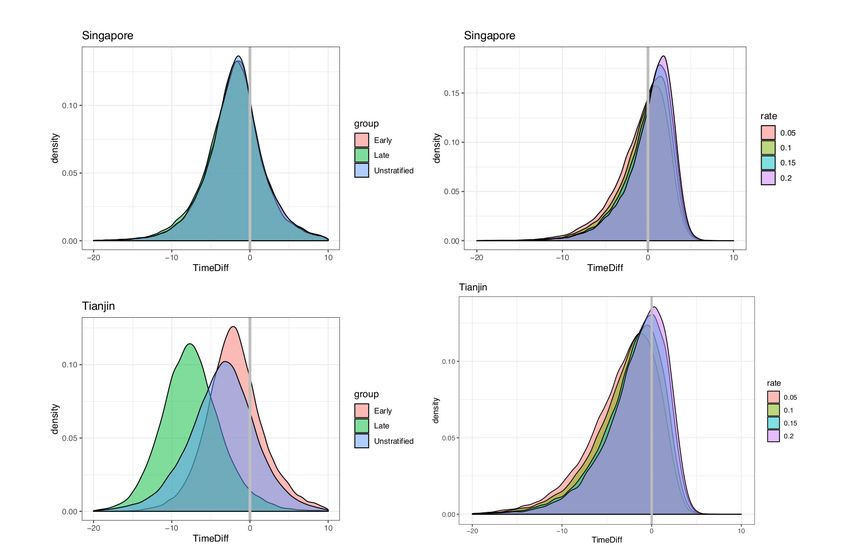
Research article                                                                                           Epidemiology and Global Health

                                     as the discharge date of each case was not available. In both datasets, daily counts decline over
                                     time, which is likely a combination of delays to symptom onset and between symptom onset and
                                     reporting, combined with the effects of strong social distancing and contact tracing.

                                     Incubation period
                                     In the Singapore dataset, we find that the median incubation period in our direct analysis (without
                                     accounting for intermediate cases) is 5.32 days with the gamma distribution; shape 3.05 (95%CI 2.0,
                                     3.84); and scale 1.95 (1.23, 2.34). The mean incubation period is 5.99 (95%CI 4.97, 7.14) days. In
                                     Tianjin, we find a median 8.06 days; shape 4.74 (3.35, 5.72); scale 1.83 (1.29, 2.04). The mean is 8.68
                                     (7.72, 9.7) days. These results are summarised in Table 1, and we also fitted Weibull and log normal
                                     distributions; see Appendix 1—table 1. These are consistent with, or slightly longer than, previous
                                     estimates, see Appendix 1—table 5 for comparison.
                                         In Singapore, these estimates are based on a combination of cases for whom last possible expo-
                                     sure is given by travel, and later cases (for whom the presumed infector was used). In Tianjin, social
                                     distancing measures were implemented during the outbreak. We find that the estimated incubation
                                     period is different, particularly in Tianjin, for cases with symptom onset on or prior to January 31st:
                                     see Figure 3 and Figure 4. The estimated median incubation period for pre-Feb one cases in Tianjin
                                     is 6.48 days; the q ¼ ð0:025; 0:975Þ quantiles are (2.5, 13.3) days. In contrast, post-Jan 31 the median
                                     is 12.13 days with q ¼ ð0:025; 0:975Þ quantiles (7.3, 18.7) days. The means are 6.88 (5.97, 7.87) days
                                     for early cases and 12.4 (11.1, 13.7) days for later cases. Social distancing seems unlikely to change
                                     the natural course of infection, but these results might be explained if exposure occurred during
                                     group quarantine or otherwise later than the last time individuals thought they could have been
                                     exposed. Pre-symptomatic transmission would enable this, if an individual was thought to have been
                                     exposed before group quarantine, but in actuality was exposed during quarantine by a pre-

Figure 4. COVID-19 incubation period Kaplan-Meier curves for (a) Singapore and (b) Tianjin. Top panels show unstratified data (all cases with symptom
onset given). Bottom panels show ‘early’ and ‘late’ cases, where early cases are defined as those with symptom onset on or prior to January 31, and late
otherwise.

Tindale et al. eLife 2020;9:e57149. DOI: https://doi.org/10.7554/eLife.57149                                                                    6 of 23
Research article Epidemiology and Global Health
symptomatic individual. The time interval in the data would then not be a sample of the incubation
period, instead it would be a sample of one or more generation times plus an incubation period.
In Singapore, we find the same effect, although much less pronounced. The estimated median
incubation time is 5.26, with (0.025, 0.975) quantiles of (1.30, 13.8) days for early cases (also defined
as cases with symptom onset on or prior to January 31st) and 5.35 (quantiles (1.22, 14.6)) days for
late-arising cases. The means are 5.91 (4.50, 7.64) days for early cases and 6.06 (4.70, 7.67) days for
later cases. Fits of gamma and log-normal distributions are similar; see Appendix 1—table 2.
Changes in perception of exposure times after control measures were introduced (i.e. people may
assume that they must have been exposed prior to control measures), together with pre-symptom-
atic transmission, could result in missing intermediate transmission events and hence lengthened
incubation period estimates. This in part motivates our analysis with intermediate cases.
Our estimates of the incubation period with intermediates are similar, under the assumption that
intermediates are relatively rare. Results are shown in Figure 5 and Table 1. We find that the median
of the bootstrapped mean incubation periods for Singapore with a low (0.05 per day) rate of
unknown intermediates is 4.91 days (4.35, 5.69 95% bootstrap CI), compared to a generation time
of 3.71 (2.36, 4.91) days. The Tianjin bootstrapped mean incubation period is 7.54 (6.76, 8.56 95%
CI) days and the generation time is only 2.82 (1.83, 3.52) days. The estimates are lower when the
assumed probability of unknown intermediates is higher. Indeed, if intermediates were present
Figure 5. Mean incubation period and generation time estimates from the incubation period intermediates
analysis, under the assumption that the scale parameter for both distributions is equal, shown with dependence on
the mean number of unknown intermediate cases per day of the empirical time elapsed between exposure and
symptom onset. The incubation period is longer than the generation time, so this analysis suggests that symptom
onset occurs after infectiousness begins. Top: Singapore. Bottom: Tianjin. The means are the scale times the
shape, which is fixed at 2.1 in Singapore and 2.2 in Tianjin. Varying this fixed value for the shape parameter was
not found to significantly impact the results.
Tindale et al. eLife 2020;9:e57149. DOI: https://doi.org/10.7554/eLife.57149 7 of 23Research article Epidemiology and Global Health
between assumed exposure and onset, naturally the generation time would be shorter than if they
were not. The mean generation times are consistently shorter than the mean incubation periods,
indicating that infection can occur prior to symptom onset. The difference is particularly pronounced
in Tianjin, where long intervals were observed.
However, this approach makes a number of assumptions and is limited by the fact that if we do
not know the true infectors then we are also unlikely to know the true exposure. The data we have is
well suited to this method in the sense that there were particular events where exposure is thought
to have occurred, and so we can account for intermediates in the manner we have done, but we do
not have information for the alternative scenario in which the true exposures were prior to those
given in the data. This could happen if, for example, individuals were exposed before attending an
event or before known contact, and developed symptoms well after it. Exposure would thus be
wrongly attributed to the event or contact. We have accommodated this with uncertainty in the
exposure intervals, in particular not insisting that individuals who are likely to be the index case for a
cluster (e.g. who developed symptoms on the same day as an event) must have been exposed then,
but instead allowing the possibility that they were exposed earlier.
Serial intervals
Figure 6 represents the empirical serial intervals between all potential transmission case-pairs as
noted in the data and represented in Figure 7, split into groups based on date of first symptom
onset for each case-pair. The empirical mean serial intervals shorten in the ’late’ group in both Singa-
pore and Tianjin; however, the empirically derived 95% confidence intervals overlap (Singapore early
4.44 (-2.81, 11.7) vs. late 3.18 (-1.52, 7.88); Tianjin early 5.48 (-0.968, 11.9) vs. late 4.18 (-2.33, 10.7)).
Negative lower bounds are due to the high standard deviation.
Shortening serial intervals are expected as increased quarantine measures are enacted during the
course of an outbreak and can be an indication of improved control through successful contact trac-
ing, as seen in SARS (Lipsitch et al., 2003). Our results suggest that serial intervals shortened as the
outbreak progressed in both clusters, but they could also be due to right truncation. Accounting for
Figure 6. Serial intervals of possible case pairs in (a) Singapore and (b) Tianjin. Pairs represent a presumed infector and their presumed infectee plotted
by date of symptom onset. Cases are defined as ’early’ if they have symptom onset on or prior to January 31st.
Tindale et al. eLife 2020;9:e57149. DOI: https://doi.org/10.7554/eLife.57149 8 of 23Research article Epidemiology and Global Health
Figure 7. Network diagram for (a) Singapore (b) Tianjin.
this, we found that the mean serial intervals were 4 and 5 days (Singapore, Tianjin); a Cox regression
found no significant difference between the early and late groups’ serial intervals. This estimate is
made directly from case pairs in the data without accounting for intermediate infectors and co-pri-
mary infection, as in the ICC analysis.
Table 1 shows our ICC estimates of the mean and standard deviation for the serial intervals, with
comparison to other analyses and assumptions in Appendix 1—table 5. The ICC method finds the
mean serial interval to be 4.17 (2.44, 5.89 95% bootstrap CI) days (0.882 bootstrap standard devia-
tion) for Singapore and 4.31 (2.91, 5.72) days (0.716 bootstrap sd) for Tianjin, using the first four
cases in each cluster. This is consistent with the results with right truncation.
Pre-symptomatic transmission
We estimated incubation periods and serial intervals with and without accounting for intermediate
unknown cases. To estimate the portion of transmission that occurs before symptom onset, we com-
pare the ‘direct’ (no intermediate) estimates of each, and the ‘indirect’ (accounting for intermediates)
estimates of each. We estimate consistently shorter serial intervals than incubation period, suggest-
ing that there is pre-symptomatic transmission.
We took the covariation of incubation periods and serial intervals (and of generation times and
incubation periods) into account by sampling the intervals jointly before estimating the fraction of
the relevant differences that are negative. Even accounting for correlation, the estimated fraction of
pre-symptomatic transmission for Singapore is 0.74 (regardless of early/late split) and for Tianjin is
0.72, 0.96, 0.81 (early, late, all), based on the direct estimates of the incubation periods and serial
intervals (see also Figure 8). When we use the incubation period estimates that account for inter-
mediates, the portions pre-symptomatic transmission are 0.53 in Singapore and 0.79 in Tianjin, when
the assumed ‘rate of appearance’ of intermediates r is 0.05 (i.e. when we assume a relatively low
rate of unknown intermediates). If this rate r is increased, the portion of pre-symptomatic transmis-
sion decreases, but even for r ¼ 0:2 we estimate the pre-symptomatic portion to be 0.38 in Singa-
pore and 0.64 in Tianjin.
These results were obtained under an estimated correlation between the incubation period and
serial interval of 0.289 in Tianjin. If instead the correlation were 0.1, the portion of pre-symptomatic
transmission in Tianjin under r = 0.05, 0.1, 0.15 and 0.2, respectively, is estimated as 0.783, 0.725,
0.663 and 0.62. With correlation 0.8, the equivalent portions are 0.849, 0.781, 0.704 and 0.660. We
therefore find that the degree of positive correlation does not greatly impact our estimates of pre-
symptomatic transmission. We retain high estimates of the fraction pre-symptomatic in Tianjin, due
to the long apparent incubation periods. It seems likely that these are an artifact of either pre-symp-
tomatic transmission during quarantine/lockdown, or of other assumptions made about exposures in
the creation of the original dataset. We conclude that overall for this data and under reasonable
assumptions, we see evidence of at least 65% of transmission occurring before symptom onset.
Tindale et al. eLife 2020;9:e57149. DOI: https://doi.org/10.7554/eLife.57149 9 of 23Research article Epidemiology and Global Health
Figure 8. Pre-symptomatic infection as estimated by samples of (serial interval - incubation period), accounting for covariation. Top: Singapore.
Bottom: Tianjin. Left: without intermediates. Right: accounting for intermediates. Grey vertical line: 0. Samples below zero indicate pre-symptomatic
transmission. In all cases there is substantial pre-symptomatic transmission.
In our direct analysis, we estimate that infection occurred on average 1.99 and 3.68 days before
symptom onset of the infector (Singapore, Tianjin). Because the incubation period is different for
early- and late-occurring cases in our data, on average transmission for early-occurring cases is 1.91
and 2.06 days before symptom onset (Singapore, Tianjin) and 1.88, 7.4 days before (Singapore, Tian-
jin) for late-occurring cases. Taking a low rate (r ¼ 0:05) of potential unknown intermediate cases
into account, the mean difference reduces to 0.77 and 3.23 days (Singapore, Tianjin), though we still
estimate a significant portion of pre-symptomatic transmission (0.53, 0.79), as above.
Overall, serial intervals are robustly shorter than incubation periods in our analyses (Table 1).
These estimates are strengthened by the fact that we have estimated both incubation period and
serial interval in the same populations and by the fact that we obtain the same result in two distinct
datasets. In both sets of estimates, samples of the incubation period minus serial interval are nega-
tive with probability 0.38 or higher (Singapore) and 0.64 or higher (Tianjin), and these lower bounds
require a high rate of unknown intermediates early in the outbreak. This indicates that a substantial
portion of transmission may occur before symptom onset (see Appendix 1 and Figure 8), consistent
with the clinical observations reported by Rothe et al., 2020 and (Bai et al., 2020).
Shorter serial intervals yield lower reproduction number estimates. For example, if the epidemic
grows at a rate of 0.15 (doubling time of 4.6 days [Jung et al., 2020], scenario 1), an estimated
reproduction number using the mean of the bootstrapped estimates is R ¼ 1:76 ~ ð1:30; 2:17Þ with a
serial interval of 4.17 days (Singapore) and R ¼ 1:95 ~ ð1:72; 2:47Þ with a serial interval of 4.3 days
(Tianjin). In contrast, if a longer serial interval (7.5 days [Jung et al., 2020; Li et al., 2020b]) is used,
the estimate is R ¼ 3:05. This is based on the relationship between R0, serial interval, and growth
rate, and is a simple estimate that does not take into account a complex and variable natural history
of infection (Wallinga and Lipsitch, 2007). It serves primarily to illustrate how our estimated serial
intervals impact R in simple models for COVID-19 dynamics.
Tindale et al. eLife 2020;9:e57149. DOI: https://doi.org/10.7554/eLife.57149 10 of 23Research article Epidemiology and Global Health
Discussion
Here, we use transmission clusters in two locations where cases have reported links, exposure and
symptom onset times to estimate both the incubation period and serial interval of COVID-19. We
make these datasets available in a convenient spreadsheet form; they were available publicly but the
Singapore dataset was presented in free text updates and the Tianjin cluster was described on multi-
ple sites and in graphical form, in Chinese. We anticipate that the datasets themselves will remain
useful for understanding COVID-19’s early spread in these well-documented outbreaks.
The incubation period and serial interval are key parameters for transmission modeling and for
informing public health interventions; modeling remains one of the primary policy aids in use in plan-
ning local and global COVID-19 responses. Serial intervals, together with R0, control the shape and
distribution of the epidemic curve (Anderson et al., 2004). They influence the disease’s incidence
and prevalence, how quickly an epidemic grows, and how quickly intervention methods need to be
implemented by public health officials to control the disease (Anderson et al., 2004; Fraser et al.,
2004). In particular, the portion of transmission events that occur before symptom onset is a central
quantity for infection control (Fraser et al., 2004), and will impact the efficacy of contact tracing and
case finding efforts (Peak et al., 2020).
Singapore and Tianjin officials both reacted quickly when COVID-19 cases appeared and started
implementing contact tracing and containment measures; however, there was a dramatic difference
in the severity of the measures taken. The first case was identified in Singapore on Jan 23, 2020 and
in Tianjin on Jan 21. By Feb 9, Singapore had identified 989 close contacts and implemented a travel
advisory to defer all travel to Hubei Province and all non-essential travel to Mainland China, asked
travellers to monitor their health closely for 2 weeks upon return to Singapore, and asked the public
to adopt precautions including avoiding close contact with people who are unwell, practicing good
hygiene and hand washing, and wearing a mask if they had respiratory symptoms (Ministry of
Health Singapore, 2020). Comparatively, by February 9 in Tianjin, 11,700 contacts were under
observations and the Baodi district of almost 1 million people was placed under lockdown with
restrictions including: one person per household could leave every 2 days to purchase basic needs,
public gatherings were banned, no one could leave their homes between 10PM and 6AM without an
exemption, entrances to Tianjin were put under control, and all the buses linking nearby provinces
and cities were halted (www.chinadaily.com). While Singapore contained the virus spread relatively
well until mid-March, they reached 500 confirmed cases on March 23, 1000 cases on April 1, 10,000
cases on April 22, and 25,000 cases on May 13 (Ministry of Health Singapore, 2020); Tianjin prov-
ince began to flatten their epidemic curve by mid-to-late-February and had plateaued at 192 con-
firmed cases as of May 19 (github.com/CSSEGISandData/COVID-19).
In Singapore and Tianjin we estimated relatively short serial intervals. Of particular note, early
estimates of R0 for COVID-19 used the SARS serial interval of 8.4 days (Abbott et al., 2020;
Majumder and Mandl, 2020; Wu et al., 2020). Our serial interval findings from two populations
mirror those of Zhao et al., 2020 and (Nishiura et al., 2020), who estimated a serial interval of 4.4
and 4.0 days. Du et al., 2020 obtain a similar estimate for the serial interval (3.96 days with 95% CI:
3.53–4.39) but with standard deviation 4.75 days, based on 468 cases in 18 provinces. Furthermore,
we estimate the serial interval to be shorter than the incubation period in both clusters, which sug-
gests pre-symptomatic transmission. This indicates that spread of SARS-CoV-2 is likely to be difficult
to stop by isolation of detected cases alone. However, shorter serial intervals also lead to lower esti-
mates of R0, and our serial intervals support R0 values just below 2; if correct this means that half of
the transmissions need to be prevented to contain outbreaks.
We stratified the incubation period analysis for Tianjin by time of symptom onset (pre- or post-
Jan 31, 2020; motivated by quarantine/social distancing measures) and found that the apparent incu-
bation period was longer for those with post-quarantine symptom onset. The reason for this is
unclear, but one possible explanation is that there were (unknown, therefore unreported) exposures
during the quarantine period. If people are quarantined in groups of (presumed) uninfected cases,
pre-symptomatic transmission in quarantine would result in true exposure times that are more recent
than reported last possible exposure times.
Although it may seem contradictory that for example Singapore’s efforts were able to keep the
epidemic under control using mainly case-based controls if pre-symptomatic transmission is com-
mon, it remains the case that detailed contact tracing combined with case finding may be key to
Tindale et al. eLife 2020;9:e57149. DOI: https://doi.org/10.7554/eLife.57149 11 of 23Research article Epidemiology and Global Health
limiting both symptomatic and pre-symptomatic spread. In Singapore, symptom-free close contacts
of known cases were quarantined preemptively for 14 days, and other less high-risk contacts were
placed under phone surveillance (Lee et al., 2020). In addition, if case finding is able to prevent a
large portion of symptomatic transmission, it seems logical that the remaining observed transmission
may be pre-symptomatic. The large extent of pre-symptomatic spread that is occurring, however,
may be one reason that the spread of COVID-19 in Singapore was ultimately only delayed and not
prevented.
There are several limitations to this work. First, the times of exposure and the presumed infectors
are uncertain, and the incubation period is variable. We have not incorporated uncertainty in the
dates of symptom onset. We have used the mixture model approach for serial intervals to avoid
assuming that the presumed infector is always the true infector, but the mixture does not capture all
possible transmission configurations. Our R0 estimates are simple, based on a doubling time of 4.6
days, and could be refined with more sophisticated modeling in combination with case count data.
We have not adjusted for truncation (e.g. shorter serial intervals are likely to be observed first) or the
growth curve of the epidemic. However, the serial interval estimates are consistent between the two
datasets, are robust to the parameter choices, and are consistently shorter than the estimated incu-
bation times.
We estimated both the incubation period and the serial interval in Singapore and Tianjin COVID-
19 clusters. Our results suggest that there is substantial transmission prior to onset of symptoms, as
the serial interval is shorter than incubation period by 2–4 days. We find differences in estimated
incubation period between early and later cases; this may be due to pre-symptomatic transmission
or differences in reporting and/or in perceived exposure as the outbreak progressed, in the context
of social distancing measures. Evidence of transmission from apparently healthy individuals makes
broad-scale social distancing measures particularly important in controlling the spread of the
disease.
Materials and methods
Data
All datasets and R code are available on GitHub (github.com/carolinecolijn/
ClustersCOVID19; Tindale et al., 2020; copy archived at https://github.com/elifesciences-publica-
tions/ClustersCOVID19).
Singapore data was obtained from the Ministry of Health Singapore, 2020 online press releases.
The Singapore dataset comprised 93 confirmed cases from the date of the initial case on January
23, 2020 until February 26, 2020. Tianjin data was obtained from the Tianjin Health Commission,
2020 online press releases. The Tianjin dataset comprises 135 cases confirmed from January 21 to
February 22, 2020. The symptom onsets were available on the official website for all but a few
patients who had not had symptoms before being diagnosed at a quarantine center. Both datasets
contained mainly information on exposure times, contacts among cases, time of symptom onset
(See Appendix 1 for column descriptions and data processing).
Statistical analysis
All statistical analyses were performed using R (R Development Core Team, 2013).
Incubation periods: not accounting for intermediate cases
The daily incidence of hospitalization and mortality was plotted with the cumulative number of cases
confirmed and discharged. The daily incidence was also visualized by date of symptom onset. For
the symptom onset plots, any cases that did not have information on date of onset of symptoms
were removed. Cases were then grouped based on their assumed source of infection (see Appendix
1 for full details).
Incubation periods were estimated in two ways: directly from the exposure to symptom onset
times, and using a model allowing for unknown intermediate cases to have been the true source of
infection (see below). The direct estimates were based on the earliest and latest possible exposure
times, and on the reported times of symptom onset. It is impossible to confirm the exact times of
exposure and thus we used interval censoring, which uses the likelihood of a time falling in a defined
Tindale et al. eLife 2020;9:e57149. DOI: https://doi.org/10.7554/eLife.57149 12 of 23Research article Epidemiology and Global Health
window, (R package icenReg [Anderson-Bergman, 2017]) to make parametric estimates of the incu-
bation period distribution. For cases without a known earliest possible exposure time, we assume
that the case must have been exposed within the 20 days prior to their symptom onset. For cases
without a known latest possible exposure time, we assume that exposure had to have occurred
before symptom onset. Some cases had a travel history or contact with a known location or pre-
sumed source of the virus and this defined their window for exposure. In the Singapore dataset,
other individuals had estimated exposure times based on the symptom times for their presumed
infector. For these, we define an exposure window using the symptoms of their presumed infector
7/+4 days. Having defined exposure windows, we proceed with interval censoring. In both data-
sets we stratified the data according to whether symptom onset occurred early or late, and esti-
mated incubation periods separately. We define ‘early’ cases as those with symptom onset on or
prior to January 31.
Incubation periods: accounting for intermediate cases
Standard estimates of the incubation period from exposure and symptom data require knowledge
of the true exposure event. In our data, exposures were frequently attributed to attendance at
events or locations where there had been known COVID-19 cases. It is conceivable that some cases
were not in fact exposed at the event, but subsequent to it, by an unknown (perhaps asymptomatic)
case who also attended the event or was otherwise linked. We developed the following approach to
account for possible unknown intermediates. Suppose the data suggest that case i was exposed at
an event by individual A, but in fact, there is an unknown intermediate x who was infected at the
event and who subsequently infected i. In this case, the time between i’s apparent exposure and i’s
symptom onset is not a sample of the incubation period. Instead, it is one generation time (the time
between A infecting x and x infecting i) followed by one incubation period (from x infecting i to i’s
symptoms). Similarly, if x infects a second unknown intermediate y, and y infects i, then the time
elapsed is two generation intervals followed by an incubation period. Under the simplifying assump-
tion that the generation time and the incubation period follow a gamma distribution with the same
scale parameter, we can explicitly write the density for the elapsed time, given k intermediates. We
model the assumption that longer times between (presumed) exposure and symptom onset have
more room for undetected intermediate cases. To describe this with likelihoods, we model unknown
intermediate cases occurring with a probability proportional to the length of the apparent incubation
period, using a Poisson process (see Appendix 1). We estimate the mean incubation period and gen-
eration interval with this approach, also accounting for right truncation (which is not available in the
interval censoring estimator in icenReg). If f ðtÞ, gðtÞ are the densities for the incubation period and
generation time respectively, then with k intermediates, the time elapsed has density
Rt
hk ðtÞ ¼ g ::: g f ¼ gðkÞ f , where * denotes convolution, i.e., g f ¼ 0 gðsÞf ðt sÞds. The right
trunctation time Ti is the time between i’s exposure and the end of the observation period (because
if the symptom onset does not happen after Ti has elapsed it will not be observed, and this can bias
i
estimates). Let the time from symptom onset to the beginning of the exposure window be tmax , and
i i i
to the end of the window tmin . The incubation period is then somewhere in the interval ðtmin ; tmax Þ. The
i i
Hk ðtmax Þ Hk ðtmin Þ
likelihood of observing a time in this interval, conditional on k intermediates, is Lik ¼ Hk ðTi Þ . We
use a Poisson process with rate r to model the probability that there are k intermediates. This means
that the likelihood for the i’th observation is Li ¼ 3k¼0 pk Lik . The complete likelihood is the product
P
Q i
over all cases, L ¼ i L : To compute this, note that if g and f are both gamma densities with shapes
ag and ai , and if they have the same scale parameter b, then the convolution
g f ðtÞ ¼ Gammaðag þ ai ; bÞ. We can extend this to k intermediates: the density is
gðkÞ f ¼ Gammaðkag þ ai ; bÞ. We truncate the number of possible intermediates at n, so we condition
the usual Poisson probability for k arrivals, k;r ¼ rk e r =k!, accordingly. Let Cn;r ¼ ni¼0 pi ðrÞ, and use
P
k;r =Cn;r ; k n
pk ¼ (1)
0 otherwise
We use maximum likelihood to estimate the shape parameters ag and ai of the generation and
incubation periods under a range of intermediate ‘arrival rates’ r and we use bootstrapping to
Tindale et al. eLife 2020;9:e57149. DOI: https://doi.org/10.7554/eLife.57149 13 of 23Research article Epidemiology and Global Health
estimate the credible intervals. We refer to this analysis as the ‘incubation period with intermediates’
analysis.
Serial intervals: not accounting for intermediates
We illustrate the empirical serial intervals implied by contact links reported in the data. We compute
the mean and standard deviation of these in entirety, and separated into early- and late-occurring
cases, calculating summary statistics of possible transmission pairs in ’early’ (i.e. first date of symp-
tom onset on or before Jan 31, 2020) vs. ‘late‘ portions of both clusters. We estimate the mean serial
intervals using these ‘directly reported’ contacts, accounting for right truncation (R package Surv-
Trunc) and using Cox proportional hazards to determine whether there is a significant early vs. late
difference. We use the non-parametric survival curves to estimate the mean serial interval for both
datasets.
Serial intervals: accounting for intermediates
As with incubation periods, reported serial intervals may miss unknown intermediates, and co-infec-
tors of two cases presumed to be a transmission pair. We used the expectation-maximization
approach described in Vink et al., 2014, which not only takes unknown intermediates into account
but also explicitly models a fixed set of possible mis-allocation of infector-infectee pairs in contact
data. Briefly, this approach assigns the case with earliest symptom onset in a cluster a ‘putative
index’ (PI) status, and uses the time difference between symptom onset of subsequent cases in the
cluster and the putative index as ‘index case to case’ (ICC) intervals for putative index cases in small,
closely-linked sets of cases (‘small clusters’). The ICC intervals are the time differences between the
symptom onset time tpi of the putative index (PI) case and the other members’ symptom onset (call
these times tj , where j is another case in the same small cluster as this PI). These intervals are not
samples of the serial interval distribution, because it need not be the case that the PI infected the
others. Vink et al., 2014 used a mixture model in which ICC intervals tj tpi can arise in four ways:
(1) an outside case infects PI and j; (2) PI infects j; (3) PI infects an unknown who infects j and (4) PI
infects unknown one who infects unknown two who infects j. Accordingly, if the serial interval
x ~ N ð; s2 Þ, the density for the ICC intervals is
X
f ðx; ; s2 Þ ¼ wi fi ð; s2 Þ
i
where wi are weights of the i’th component density and fi are the component densities for the i’th
transmission route. Expectation-maximization is used to determine and s (See Vink et al., 2014
for more details).
For each dataset, we create a network, with individuals represented by nodes. The network’s
edges are the reported direct contacts between individuals. Every such network (or graph) consists
of one or more components – sets of nodes that are connected by edges. We use the components
of the network to define transmission clusters. Since the four models in the mixture are likely insuffi-
cient to model the transmission in large clusters, we restrict the analysis to only the first four cases
per cluster (or the first 3, 5, or 6 cases per cluster to determine impact of altering number of cases
per cluster; see Appendix 1). We defined the first case within the cluster as the case with the earliest
date of symptom onset within the cluster; however we also examined the impact of using the earliest
end exposure time if the first symptomatic case was not the index case for the cluster (See Appendix
1). Given the serial interval, we calculate an approximate reproduction number using the empirical
growth rate (Wallinga and Lipsitch, 2007): R ¼ exp ðr 1=2r 2 s2 Þ, where r, and s are the expo-
nential growth rate, the mean serial interval and the standard deviation of the serial interval, respec-
tively). To obtain confidence intervals for R we resample and s using bootstrapping.
Pre-symptomatic transmission
We estimate the portion of transmission that occurs before symptoms as the fraction of samples
where serial interval minus incubation period is negative. We introduce an approach to take covaria-
tion between the two variables into account, as follows. The mean difference between two random
variables is the difference between the means. Therefore, the mean serial interval minus the mean
incubation periods gives an estimate of the mean time before symptoms that transmission occurs
Tindale et al. eLife 2020;9:e57149. DOI: https://doi.org/10.7554/eLife.57149 14 of 23Research article Epidemiology and Global Health
according to our data. However, the distribution of the difference depends on the covariance
between the incubation period and the serial interval. Unfortunately, it is challenging to obtain a
good estimate of the covariance between these quantities. We estimated the covariance (and corre-
lation) using case pairs; each pair is associated with two numbers: a serial interval estimate and an
incubation period for the infectee. The covariance between these is a (somewhat crude) estimate of
the covariance in the incubation period and serial intervals. We sampled incubation periods and
serial intervals from our estimated distributions, ensuring that we respected the observed correla-
tion, and used the serial interval - incubation period differences to estimate the portion of transmis-
sion that is pre-symptomatic. Further details of this approach are given in Appendix 1.
In estimating pre-symptomatic transmission, we compare ‘direct’ (not accounting for intermedi-
ates) incubation periods and serial intervals, and we compare the two with accounting for intermedi-
ates. We take the covariation into account throughout.
Acknowledgements
We thank the Ministry of Health Singapore and the Tianjin Health Commission for publishing infor-
mation about cases through online press releases. We thank the participants of ’EpiCoronaHack’ at
Simon Fraser University for their roles in curating these two datasets. We thank the public health
teams and the patients whose data have been included in these analyses.
Additional information
Competing interests
Caroline Colijn: Reviewing editor, eLife. Jacco Wallinga: Reviewing editor, eLife. The other authors
declare that no competing interests exist.
Funding
Funder Grant reference number Author
Government of Canada Canada 150 Research Chair Caroline Colijn
program
The funders had no role in study design, data collection and interpretation, or the
decision to submit the work for publication.
Author contributions
Lauren C Tindale, Data curation, Validation, Visualization, Methodology, Writing - original draft,
Writing - review and editing; Jessica E Stockdale, Michelle Coombe, Formal analysis, Visualization,
Methodology, Writing - review and editing; Emma S Garlock, Visualization, Writing - review and edit-
ing; Wing Yin Venus Lau, Data curation, Visualization, Writing - review and editing; Manu Saraswat,
Formal analysis; Louxin Zhang, Jacco Wallinga, Data curation, Writing - review and editing; Dong-
xuan Chen, Data curation; Caroline Colijn, Conceptualization, Software, Formal analysis, Supervision,
Validation, Investigation, Methodology, Writing - original draft, Project administration, Writing -
review and editing
Author ORCIDs
Lauren C Tindale https://orcid.org/0000-0001-7751-1042
Jessica E Stockdale https://orcid.org/0000-0001-7984-1010
Louxin Zhang http://orcid.org/0000-0003-0260-824X
Caroline Colijn https://orcid.org/0000-0001-6097-6708
Decision letter and Author response
Decision letter https://doi.org/10.7554/eLife.57149.sa1
Author response https://doi.org/10.7554/eLife.57149.sa2
Tindale et al. eLife 2020;9:e57149. DOI: https://doi.org/10.7554/eLife.57149 15 of 23Research article Epidemiology and Global Health
Additional files
Supplementary files
. Transparent reporting form
Data availability
Data are available on github at https://github.com/carolinecolijn/ClustersCOVID19 (copy archived at
https://github.com/elifesciences-publications/ClustersCOVID19). Code to produce all analyses is
also available there. Source data files of the Singapore and Tianjin clusters have been provided.
References
Abbott S, Hellewell J, Munday J, Funk S, CMMID nCoV working group. 2020. The transmissibility of novel
coronavirus in the early stages of the 2019-20 outbreak in Wuhan: exploring initial point-source exposure sizes
and durations using scenario analysis. Wellcome Open Research 5:17. DOI: https://doi.org/10.12688/
wellcomeopenres.15718.1, PMID: 32322691
Anderson RM, Fraser C, Ghani AC, Donnelly CA, Riley S, Ferguson NM, Leung GM, Lam TH, Hedley AJ. 2004.
Epidemiology, transmission dynamics and control of SARS: the 2002–2003 epidemic. Philosophical Transactions
of the Royal Society of London. Series B: Biological Sciences 359:1091–1105. DOI: https://doi.org/10.1098/
rstb.2004.1490
Anderson-Bergman C. 2017. icenReg: regression models for interval censored data in R. Journal of Statistical
Software 81:i12. DOI: https://doi.org/10.18637/jss.v081.i12
Arons MM, Hatfield KM, Reddy SC, Kimball A, James A, Jacobs JR, Taylor J, Spicer K, Bardossy AC, Oakley LP,
Tanwar S, Dyal JW, Harney J, Chisty Z, Bell JM, Methner M, Paul P, Carlson CM, McLaughlin HP, Thornburg N,
et al. 2020. Presymptomatic SARS-CoV-2 infections and transmission in a skilled nursing facility. New England
Journal of Medicine 382:2081–2090. DOI: https://doi.org/10.1056/NEJMoa2008457, PMID: 32329971
Backer JA, Klinkenberg D, Wallinga J. 2019. Incubation period of 2019 novel coronavirus (2019-nCoV) infections
among travellers from Wuhan, China, 20-28 January 2020. Euro Surveillance : Bulletin Europeen Sur Les
Maladies Transmissibles = European Communicable Disease Bulletin 25:2000062. DOI: https://doi.org/10.
2807/1560-7917.ES.2020.25.5.2000062
Baggett TP, Keyes H, Sporn N, Gaeta JM. 2020. Prevalence of SARS-CoV-2 infection in residents of a large
homeless shelter in Boston. Jama 323:2191–2192. DOI: https://doi.org/10.1001/jama.2020.6887
Bai Y, Yao L, Wei T, Tian F, Jin D-Y, Chen L, Wang M. 2020. Presumed asymptomatic carrier transmission of
COVID-19. Jama 323:1406–1407. DOI: https://doi.org/10.1001/jama.2020.2565
Du Z, Wang L, Xu X, Wu Y, Cowling BJ, Meyers LA. 2020. The serial interval of COVID-19 from publicly reported
confirmed cases. medRxiv. DOI: https://doi.org/10.1101/2020.02.19.20025452
Fraser C, Riley S, Anderson RM, Ferguson NM. 2004. Factors that make an infectious disease outbreak
controllable. PNAS 101:6146–6151. DOI: https://doi.org/10.1073/pnas.0307506101, PMID: 15071187
Huang C, Wang Y, Li X, Ren L, Zhao J, Hu Y, Zhang L, Fan G, Xu J, Gu X, Cheng Z, Yu T, Xia J, Wei Y, Wu W, Xie
X, Yin W, Li H, Liu M, Xiao Y, et al. 2020. Clinical features of patients infected with 2019 novel coronavirus in
Wuhan, China. The Lancet 395:497–506. DOI: https://doi.org/10.1016/S0140-6736(20)30183-5
Hui DS, Azhar DZ, Madani TA. 2020. The continuing 2019-nCoV epidemic threat of novel coronaviruses to global
health. The Latest 2019 Novel Coronavirus Outbreak in Wuhan, China 264–266. DOI: https://doi.org/10.1016/j.
ijid.2020.01.009
Jiang X, Rayner S, Luo MH. 2020. Does SARS-CoV-2 has a longer incubation period than SARS and MERS?
Journal of Medical Virology 92:476–478. DOI: https://doi.org/10.1002/jmv.25708, PMID: 32056235
Jinyun News. 2020. Jinyun news reference. https://m.weibo.cn/status/IrrHI1FHm?jumpfrom=weibocom
[Accessed February 28, 2020].
Johns Hopkins University. 2020. Coronavirus resource center. https://coronavirus.jhu.edu/ [Accessed May 22,
2020].
Jung S, Akhmetzhanov AR, Hayashi K, Linton NM, Yang Y, Yuan B, Kobayashi T, Kinoshita R, Nishiura H. 2020.
Real-Time estimation of the risk of death from novel coronavirus (COVID-19) Infection: inference using
exported cases. Journal of Clinical Medicine 9:523. DOI: https://doi.org/10.3390/jcm9020523
Ki M, Task Force for 2019-nCoV. 2020. Epidemiologic characteristics of early cases with 2019 novel coronavirus
(2019-nCoV) disease in Korea. Epidemiology and Health 42:e2020007. DOI: https://doi.org/10.4178/epih.
e2020007, PMID: 32035431
Lee VJ, Chiew CJ, Khong WX. 2020. Interrupting transmission of COVID-19: lessons from containment efforts in
Singapore. Journal of Travel Medicine 27:taaa039. DOI: https://doi.org/10.1093/jtm/taaa039, PMID: 32167146
Li P, Fu JB, Li KF, Liu JN, Wang HL, Liu LJ, Chen Y, Zhang YL, Liu SL, Tang A, Tong ZD, Yan JB. 2020a.
Transmission of COVID-19 in the terminal stages of the incubation period: a familial cluster. International
Journal of Infectious Diseases 96:452–453. DOI: https://doi.org/10.1016/j.ijid.2020.03.027, PMID: 32194239
Li Q, Guan X, Wu P, Wang X, Zhou L, Tong Y, Ren R, Leung KSM, Lau EHY, Wong JY, Xing X, Xiang N, Wu Y, Li
C, Chen Q, Li D, Liu T, Zhao J, Liu M, Tu W, et al. 2020b. Early transmission dynamics in Wuhan, China, of novel
Tindale et al. eLife 2020;9:e57149. DOI: https://doi.org/10.7554/eLife.57149 16 of 23Research article Epidemiology and Global Health
Coronavirus-Infected pneumonia. New England Journal of Medicine 382:1199–1207. DOI: https://doi.org/10.
1056/NEJMoa2001316, PMID: 31995857
Linton NM, Kobayashi T, Yang Y, Hayashi K, Akhmetzhanov AR, Jung S, Yuan B, Kinoshita R, Nishiura H. 2020.
Incubation period and other epidemiological characteristics of 2019 novel coronavirus infections with right
truncation: a statistical analysis of publicly available case data. Journal of Clinical Medicine 9:538. DOI: https://
doi.org/10.3390/jcm9020538
Lipsitch M, Cohen T, Cooper B, Robins JM, Ma S, James L, Gopalakrishna G, Chew SK, Tan CC, Samore MH,
Fisman D, Murray M. 2003. Transmission dynamics and control of severe acute respiratory syndrome. Science
300:1966–1970. DOI: https://doi.org/10.1126/science.1086616, PMID: 12766207
Majumder M, Mandl KD. 2020. Early transmissibility assessment of a novel coronavirus in Wuhan, China,
Available at SSRN. http://dx.doi.org/10.2139/ssrn.3524675 [Accessed February 28, 2020].
Ministry of Health Singapore. 2020. Updates on COVID-19 (Coronavirus disease 2019) Local situation. https://
www.moh.gov.sg/covid-19 [Accessed February 28, 2020].
Nishiura H, Linton NM, Akhmetzhanov AR. 2020. Serial interval of novel coronavirus (2019-nCoV) infections.
medRxiv. DOI: https://doi.org/10.1101/2020.02.03.20019497
Peak CM, Kahn R, Grad YH, Childs LM, Li R, Lipsitch M, Buckee CO. 2020. Individual quarantine versus active
monitoring of contacts for the mitigation of COVID-19: a modelling study. The Lancet Infectious Diseases.
DOI: https://doi.org/10.1016/S1473-3099(20)30361-3, PMID: 32445710
R Development Core Team. 2013. R: A Language and Environment for Statistical Computing. Vienna, Austria, R
Foundation for Statistical Computing. http://www.R-project.org/
Rothe C, Schunk M, Sothmann P, Bretzel G, Froeschl G, Wallrauch C, Zimmer T, Thiel V, Janke C, Guggemos W,
Seilmaier M, Drosten C, Vollmar P, Zwirglmaier K, Zange S, Wölfel R, Hoelscher M. 2020. Transmission of 2019-
nCoV infection from an asymptomatic contact in Germany. New England Journal of Medicine 382:970–971.
DOI: https://doi.org/10.1056/NEJMc2001468, PMID: 32003551
Tianjin Baodi People’s Government. 2020 News, Hot Topics. http://www.tjbd.gov.cn/zjbd/gsgg/ February 28,
2020 ].
Tianjin Health Commission. 2020. Tianjin epidemic situation updates. http://wsjk.tj.gov.cn [Accessed February
28, 2020].
Tindale LC, Stockdale JE, Coombe M, Garlock E, Lau WYV, Saraswat M, Zhang L, Chen D, Wallinga J, Colijn C.
2020. Analysis of novel Coronavirus Disease (COVID-19) Singapore and Tianjin outbreak clusters. GitHub. 262.
http://github.com/carolinecolijn/ClustersCOVID19
Vink MA, Bootsma MC, Wallinga J. 2014. Serial intervals of respiratory infectious diseases: a systematic review
and analysis. American Journal of Epidemiology 180:865–875. DOI: https://doi.org/10.1093/aje/kwu209,
PMID: 25294601
Wallinga J, Lipsitch M. 2007. How generation intervals shape the relationship between growth rates and
reproductive numbers. Proceedings of the Royal Society B: Biological Sciences 274:599–604. DOI: https://doi.
org/10.1098/rspb.2006.3754
Wu JT, Leung K, Leung GM. 2020. Nowcasting and forecasting the potential domestic and international spread
of the 2019-nCoV outbreak originating in Wuhan, China: a modelling study. The Lancet 395:689–697.
DOI: https://doi.org/10.1016/S0140-6736(20)30260-9
Zhao S, Gao D, Zhuang Z. 2020. Estimating the serial interval of the novel coronavirus disease (COVID-19): A
statistical analysis using the public data in hong kong from January 16 to February 15. medRxiv. DOI: https://
doi.org/10.1101/2020.02.21.20026559
Tindale et al. eLife 2020;9:e57149. DOI: https://doi.org/10.7554/eLife.57149 17 of 23You can also read