Relative Infectuousness of Asymptomatic and Symptomatic COVID-19 Infections - Analytical time table
←
→
Page content transcription
If your browser does not render page correctly, please read the page content below
Munich Personal RePEc Archive

Relative Infectuousness of Asymptomatic
and Symptomatic COVID-19 Infections -
Analytical time table

Kox, Henk L.M.

KVL Policy Research (Den Bosch, The Netherlands

30 June 2021

Online at https://mpra.ub.uni-muenchen.de/108569/
MPRA Paper No. 108569, posted 04 Jul 2021 14:33 UTC

Relative Infectuousness of Asymptomatic and
 Symptomatic COVID-19 Infections

 Analytical time table

 Henk L.M. Kox

 June 2021

 KVL Discussion Paper No. 2021-04

KVL Policy Research

Colophon

KVL Discussion Papers are published to disseminate academic results, stimulate academic discussion and the
recombination of ideas. The KVL Discussion Papers do not necessarily reflect the opinion of KVL Policy
Research. Only the author is responsible for the contents of a Discussion Paper. The copyrights are held by
the author.

 KVL Policy Research
 Het Wielsem 10, k326
 5231 BW Hertogenbosch
 The Netherlands

Abstract:

The question on the relative infectuousness of asymptomatic and symptomatic infections of COVID-19 is
surrounded by contradictory clinical findings and confusion. This article undertakes a critical review of the
available clinical literature on this topic, from the perspective of individual infection cycles and from the
perpective of epidemiologic dynamics. Using the available results from the clinical and virological lietrature,
we analyse how they fit in the time table of individual infection cycles, separately for the symptomatic and
asymptomatic infection mode. The time table is based on a Susceptible-Infected-Resolve (SIR) mainframe,
but the Infection compartment is sub-divided in 5 clinical stages for the symptomatic infection mode and 3
clinical stages for the asymptomatic infection mode. From the perpective of epidemiologic dynamics, the
only period that matters is the time interval that infectives shed viable virus material, which is capable of
self-replication in another host. The duration of this period can only be assessed by subjecting the positive
RT-PCR tests samples to viral culture to isolate virus material that is able to self-replicate. Doing this on a
daily basis reveals the time profile of effective infectuousness, separately for symptomatics and
asymptomatics. For mild to moderate symptomatic cases we calculate that this period is 14 days on average,
while for asymptomatic cases it is 9 days. Most of the replication-competent virus material is emitted during
the first 4 days of this period, with few differences between symptomatics and asymptomatics. Because they
shed virus over a longer interval, symptomatic infectives are likely to constitute the largest source of
secondary infections. However, asymptomatic infectives have the largest average daily infectivity, because
they shed most infective virus load during a short period. If the contact network of susceptibles has a
sufficiently high share of asymptomatics in their early infection stage, the asymptomatic persons become the
dominant source of secondary infections.

2
1. Introduction
Decision-making for public health policies is more complicated when infections, either
bacterial or viral, are not immediately manifest from symptoms. The COVID-19 virus
pandemic is characterised by two different infection modes, a symptomatic and an
asymptomatic one. In the latter case, persons get infected without experiencing any
symptoms, and during their unmitigated interaction they may disseminate the virus to
other people. On top of that, the symptomatic infection mode has a pre-symptomatic
stage during which the infected person, without knowing it, is already capable of
transmitting the virus to others. Persons without symptoms tend to move freely in
society and interact with non-infected people [8,70,79,35]. Symptomless infection
transmission provides the virus with a distinct evolutionary advantage that allowed it
to develop COVID-19 into a worldwide pandemic. The present paper proposes a new
framework for analysing and quantifying the transmission probability of
asymptomatic infections.
Most asymptomatic COVID-19 infections remain unidentified [4]. If identified, it is often
in the context of outbreak-related contact tracing or localised community-wide testing
(e.g. cruise ships). Only then are tested through RT-PCR swabs or serological antibody
tests. Two large random-sampled, community-wide antibody test studies in Spain [57]
and the United Kingdom [76] found that 32-33 percent of the persons who tested
positive, reported to have had no symptoms. Reducing the number of undetected
asymptomatic infections would requires mass testing of people without symptoms.
This is only applied in a few regions and countries (e.g. China, Singapore). In the early
stages of the current pandemic many countries had a lack of testing material, and
national CDCs targeted all testing activity at symptomatic infectives and their contacts.
In the presence of symptomless infection modes, public health authorities require
informed assessments of the relative infectuousness and dynamics of the unobserved,
part of the pandemic. Attention for heterogeneous infection modes existed already for
tuberculosis, which also has an unobserved infection mode. In the following citation
from a recent paper on this topic [72], we might as well read COVID-19 where
tuberculosis (TB) is mentioned:
 "To advance toward TB elimination, this heterogeneity must be better understood and
 addressed. Drivers of heterogeneity in TB epidemiology act at the level of the infectious
 host, organism, susceptible host, environment, and distal determinants. These effects
 may be amplified by social mixing patterns, while the variable latent period between
 infection and disease may mask heterogeneity in transmission. Reliance on notified cases
 may lead to misidentification of the most affected groups, as case detection is often
 poorest where prevalence is highest" [72] .

Since the second half of 2020, the increase in testing activity yielded a stream of
scientific publications on the characteristics of asymptomatic infections [8,4,12,7,
53,70,26,81,52,25]. Nonetheless, at the moment of writing there is still a lack of consensus,

 3
and even confusion regarding to the role of asymptomatics persons in the transmission
of the COVID-19 virus, partly due to contradictory empirical findings. In The BMJ of
December 2020, Pollock and Lancaster [58] concluded: "The relations between viral load,
viral shedding, infectiousness, and duration of infectuousness are not well understood".
Similarly, in April 2021, McEvoy et al. [46] concluded in BMJ Open that: "Overall, there is
currently only a limited number of published studies from which it is possible to derive a
quantitative estimate of the relative infectiousness of asymptomatics. [..]. There is considerable
heterogeneity in estimates of relative infectiousness highlighting the need for further
investigation of this important parameter". In May 2021, Chen et al. [16] state that "data
concerning the epidemiological features, viral shedding, and antibody dynamics between
asymptomatic SARS-CoV-2 carriers and COVID-19 patients remain controversial".

This paper delves into this matter by offering a new analytic framework on the concept
of relative infectuousness of the two main infection modes. It is based on a stylised time
table of individual infection cycles, and on recent research advances regarding the
quantity of virus-shedding activity, and regarding the time pattern of the emitted virus
quality. Using empirical inputs from a large number of clinical studies, our paper
derives numerical estimates for the relative probability that susceptibles are infected
by asymptomatic or symptomatic COVID-19 carriers.
The paper is structured as follows. The second section constructs an analytic time table
for an infection model with parallel symptomatic and asymptomatic infection modes,
each with linearly-related stages. The third section provides a stylised empirical
version of this time table, building on clinical studies and meta analyses on the
differences of infection modes, virus shedding, virus loads, and on the self-replication
quality of the latter. This yields a stylised 'average' time path of individual infection
cycles. The clinical sources are documented in two separate annexes. For
symptomatics, we focus on the mild and moderate cases, because the severest cases
are generally hospitalised and, from the perspective of epidemic dynamics, isolated.
The fourth section proposes a rigorous quantitative definition of the relative
infectuousness of the asymptomatic and symptomatic infection modes, further
documented in a model annex. The fifth section discusses the implications of the
results, and a final section concludes the paper.

2. Time table of symptomatic and asymptomatic infection cycles
The analytical set-up follows the Susceptible-Infected-Resolved model with with two
parallel infection modes (symptomatic, asymptomatic) for the "Infected" compart-
ment. Moreover, the "Infected" compartment is sub-divided in sequential sub-periods
that differ by infection mode. The first column demarcates the jumps or switches
between the main epidemic state variables (Susceptible, Infected, Resolved). The
second column offers more detail by giving the switching points between different
stages of the infection, demarcated by the events p, v, m, and u. Time is measured in
4
days. Table 1 presents the analytic stages between the infection event and the resolve
of individual infection cases. The third column identifies the length of time intervals
between the events. The two last two columns highlight the stages of the two main
infection modes, i.e. the symptomatic (I) and the asymptomatic (A) mode.

 Table 1 Transitions in individual infection cycles (symptomatic, asymptomatic)

 State Change Interval Infection mode
 event duration
 (in days) symptomatic (I) asymptomatic (A)

 Susceptible (S)

 Infection (θ) stage 1
 stage 1 incubation period,
 θ - (p - 1) Incubation, non-infectuous for others non-infectuous for
 others

 Capable of
 stage 2
 infecting stage 2 Infectuous, shedding
 others (p) Infectuous, but pre-symptomatic, viable virus, without
 shedding viable virus without knowing it, non-
 knowing it isolated
 p - (v-1)
 p - (u_a - 1)

 First stage 3
 Infected symptoms (v) symptoms occur, shedding viable
 virus, but non-confirmed, no
 v - (m - 1) treatment, no isolation

 Test,
 treatment, stage 4
 isolation (m) medical treatment and isolation, still
 shedding viable virus
 m - (u_s - 1)

 End of stage 3
 infectivity stage 5
 Non-infective, or
 (u_a, u_s) medical treatment and isolation,
 shedding virus that is
 shedding non-viable virus
 no longer viable
 u_s - (r_s - 1)
 u - (r- 1) u_a - (r_a - 1)

 Case resolves
 Resolved (R) (r_a , r_s)
 (removal from
 infected group) Cured / Immune
 Dead (D) Cured / Immune (C)
 (C)

The symptomatic mode has five infection stages, and the asymptomatic mode three.
Stage 1 in both COVID-19 variants is the incubation period in which the freshly infected
cannot yet transmit the disease. Stage 2 in the symptomatic mode is the pre-
symptomatic stage, in which an individual can unknowingly spread the infection. This
 5
stage runs from event p (start transmission capability) to event v (onset of symptoms).
The onset of symptoms starts stage 3 in which symptoms gradually become more
serious and eventually medical assistance is sought for. After event m, stage 4 starts
with confirmation of the disease, medical treatment and a form of isolation. Table 1
contains refines the infectivity concept, in line with Lavezzo et al.[35]. Event " is the
moment at which the symptomatic still emits virus RNA and may still be ill, but is no
longer emitting virus RNA that has the quality to self-replicate in another host. Event "
is therefore the end of the effective transmission period from an epidemiological
perspective. After that, stage 5 forms the end of the individual infection cycle in the
symptomatic mode. The symptomatic continues to shed virus load until the resolve of
the individual infection cycle (event " ), which may be death in critical cases, or as the
virus goes in remission, recovery and discharge of medical isolation.
The course of the individual infection cycle in the asymptomatic mode is much simpler.
The presence of the asymptomatic infection mode can be assessed objectively by
testing for emitting of virus RNA (RT-PCR test) or for the presence of antibodies
(serological test). However, the asymptomatic person experiences and reports no
symptoms during the full infection cycle. As an important consequence, most
asymptomatics remain unidentified. The event p, at which the freshly infected person
becomes capable of infecting others, passes unnoticed. And by definition, event v (onset
of symptoms) also never happens in the asymptomatic infection mode. During stage 2,
the asymptomatic person is capable of transmitting the disease to susceptibles and
often mixes freely with susceptibles. Stage 2 ends when the infect person no longer
sheds virus material that has the quality to self-replicate in another host (event $ ).
Stage 3 is the final phase of the asymptomatic infection cycle. This stage has little
implications, except that the person by chance could still be identified as COVID-19-
positive in a PCR test, although the shedded virus material is not replication-competent
any more. The resolve of the individual infection cycle (event $ ) follows in the same
silent way, when the shedding of virus material does not even pass PCR test threshold
values any more.
The time-window where unrestricted transmission of the infection to susceptibles may
take place, has been shaded area in Table 1: stage 2 and 3 for the symptomatic mode,
and stage 2 for the asymptomatic mode. These are the periods for which it is necessary
to assess the relative infectuousness of both infection modes.
Note that Table 1 does not distinguish specific sub-intervals for time spent in home
quarantaine, hospital treatment, or ICU treatment. While this can be important for
medical capacity planning in the early outbreak phases, it is not essential for
understanding the overall dynamics in the epidemic.

6
3. The individual infection cycles in an `average' quantitative version
This section sets out to construct an empirical version of Table 1, a stylised quantitative
time table that measures the 'average' duration of all stages of the individual infection
cycle in days. "Stylised" unescapably means that we lose statistical detail, for instance,
with regard to case severity and national differences. "Average" means that we focus
on the centre of the statistical distribution, using mean or median duration data. With
regard to the symptomatic infections we focus on mild and moderately-severe cases.
This assuages our relative disregard of the right-hand tail of the duration distribution.
The stylised time-table of the individual infection cycles is based on the empirical
evidence from a broad clinical and epidemiological literature. Annex I provides details
on the distribution of the duration variable in the original source material (95%
confidence intervals, inter-quartile range, standard deviation).
The gains of the simplifications occur in terms of the tractability and controllability of
our results. The empirical model that we construct of both infection modes is
consistent, offers an explanation for the confusion sketched in the introduction , and it
is testable by future research.
Table 2 provides a flavour of the confusing empirical results regarding the duration of
virus-shedding period for both infection modes. Virus shedding is in all cases measured
through nasopharyngeal RT-PCR tests. The quoted clinical results in all cases report
the mean or median number of days that virus loads on PCR swabs exceded a pre-
selected threshold value. The results for symptomatic infectives do not show a
consistent picture, given the relation between different clinicals intervals. The results
for asymptomatic infectives may be upward biased, if sampling is based on contact
tracing [37] instead of community-wide, aselective testing. Note that Table 2 does not
provide strong evidence that the duration of virus shedding by symptomatics is longer
than for asymptomatics.
The number of days with with above-threshold virus shedding is not enough to
construct the time table of both infection modes. Two more aspects of virus shedding
should be considered for evaluating infectuousness: the absolute magnitude of the
virus load, and the replicative quality of the virus. The evidence strongly suggests that
higher virus loads are positively correlated with the number of secondary infections
and with the severity of the COVID-19 infection[81,1,78,36,62,77,29]. The second aspect is the
replicative quality aspect of the virus RNA. Virus shedding is only relevant for
infectivity, if the virus is able to self-replicate in new hosts. To derive the full empirical
time table of the symptomatic and asymptomatic infection cycles, we build on many
empirical findings. When obliged to select from heterogeneous findings, we prefer
recent meta-analyses and reviews that use strict definitions, and control for
observation period, sample size, non-selectivity in testing, and for endogenous

 7
Table 2 Duration of virus-shedding, as measured from nasal PCR swabs

 Mean Median Range Range Stand.
 Clinical stage min max Estimation details and
 length length deviat-
 intervals ‡) (C.I. (C.I. sources
 (days) (days) ion
 95%) 95%)

 Symptomatics
 v to ( " - 1) $) 21.8 .. .. .. 7.6 S. Korea, [37]

 m to ( " - 1) &) 25.2 .. .. .. 4.9 S. Korea, [52]

 m to ( " - 1) &) .. 18.0 15.0 a) 22.0 a) .. S. Korea, n=328, [73]

 p to ( " - 1) @) 17.0 .. 15.5 18.6 .. meta study [12]

 Asymptomatics

 m to ( $ - 1) %) .. 9.5 7.0 a) 14.0 a) .. S. Korea, m to first negative
 PCR test, n=68, [73]
 m to ( $ - 1) %) .. 14.5 11.0 a) 21.0 a) .. S. Korea, m to full negative
 conversion, n=68, [73]
 p to ( $ - 1) §) 12.8 US CDC, [10], this section

 p to ( $ - 1) §) 19.1 .. .. .. 7.5 S. Korea, [37]

 p to ( $ - 1) §) 22.6 .. .. .. 4.0 S. Korea, [52]

 Notes: ‡) Codes refer to the Table 1; $) onset symptoms to resolve; &) treatment / quarantaine /
 hospitalisation; @) time from transmission capability to resolve, for symptomatics; §) idem, for
 asymptomatics; %) time between first positive test and negative conversion; a) inter-quartile
 range.

measurement impact from testing itself [8,4,12,7,53,70,26]. Moreover, for a consistent
interpretation we build on a formal model that is separately presented in Annex I. Here
we describe the procedure stepwise by evaluating the relevant empirical findings.
Virus shedding by symptomatics. A high nasopharyngeal viral load in RT-PCR tests
increases the probability of secondary infections [29]. For symptomatics, the viral loads
in the upper respiratory tract build up around the moment (p), peeking a few days
before the first symptoms occur (event v). The viral load is highest in the first week of
illness and then declines gradually. The mean duration of virus shedding is 17-18 days,
according to a large meta study and a large clinical study [12,73] that are both cited in
Table 2.
Shedding active virus by symptomatics. After subjecting positive PCR samples to viral
culture, light and moderately severe infections, most studies [5,67] report no live and
replication-competent virus beyond day v+9. The viral load remaining in PCR tests after
v+9 is apparently neutralised by the immune system and can no longer make copies of
itself. Seroconversion occurs in 50% of patients at v+7, and by day v+14 it is found in
8
all symptomatic patients.[77,83,49] For severe illness cases, replication-competent virus
was found even later.[53,54,77] Also immunocompromised patients may emit culture-
positive virus material for a longer period.[55,75] A different detection method[65,38]
based on subgenomic RNA, also found rare cases of persistent active virus beyond
v+10. Severe cases are in most countries hospitalised and isolated, thus reducing their
impact on overall infection dynamics. Walsh et al. draw the following qualified
conclusion: "COVID-19 patients with mild-to-moderate illness are highly unlikely to be
infectuous beyond 10 days of symptoms".[75] For modelling the epidemiologic dynamics of
secondary infections it may thus be sufficient to concentrate on the pre-symptomatic
period plus the first nine illness days after onset.
Time structure in shedded active virus material by symptomatics. The development of
infectuousness over time may be quantified using the time profile for successfully
recovered replication-competent viruses from positive RT-PCR nasopharyngeal
specimens. A large US cohort study [54] reports a time profile of virus-recovery success
rates from daily positive PCR samples. The study itself presents the profile relative to
event v (onset of symptoms), but for comparability with asymptomatics, who by
definition have no symptoms, we transpose the profile to a common event in both
infection modes, namely event p (infective acquires capability to transmit the virus).
Clinical evidence summarised in Annex Table A2 finds that there are on average 4 days
between events p and v. So the time profile of successfull virus recovery from daily
positive PCR samples becomes: [54]
 • interval p - (p+3) : 71% of specimens with viable virus
 • interval (p+4) -(p+8) : 47% of specimens with viable virus
 • interval (p+9) -(p+13) : 30% of specimens with viable virus
 • interval (p+14) - ( " − 1) : 0% of specimens with viable virus

The first interval is the presymptomatic phase, which turns out to be the most infective
sub-period.[24] Using the virus-recovery results of the third time interval as the
reference point, the comparative infectuousness of the first interval is: 71/30 ≈ 2.37.
Doing the same for all sub-periods, gives the daily infectuousness weights for the four
sub-periods: 2.37—1.57—1—0. It means that, from the perspective of infection-
transmission probability, one day from the first time interval counts the same as 2.37
days from the third interval. The days from the third interval can be labelled 'standard
infection days'. The infectuousness of the full symptomatic infection cycle can thus be
expressed in the number of 'standard infection days'. The first sub-period has four
days, so its infectuousness weight is 9.48. The second and third sub-periods have five
days, with infectuousness weights of, respectively, 7.85 and 5.0. Adding up, the average
symptomatic accounts for 22.33 'standard infection days'. The average daily infectivity
during the 14 days with shedding active virus material is 1.595 for symptomatics.
Virus shedding by asymptomatics. In March 2021, the US CDC[10] published the
modelling assumptions for their latest epidemic planning scenarios for COVID-19.

 9
Their preferred estimate is that viral-shedding by asymptomatics lasts 25 percent
shorter than holds for symptomatic infectives. Using the estimate of 17-day shedding
from a meta-study[12] (cf. Table 2), it implies that virus shedding for asymptomatics on
average lasts 12.8 days. A small Chinese study [81] found that virus-shedding by nine
asymptomatic infectives was 7-8 days. A South Korean study[73] of 68 asymptomatic
infectives found that PCR test positivity disappeared in 50% of the cases after 9.5 days,
but with a long tail in the distribution: still 10% positive PCR tests remained after four
weeks, and 2.5% after five weeks. Given these results, the estimate of almost 13 days
by the US CDC is a plausible average for the duration of virus shedding by
asymptomatics. None of the eight studies[37,83,81,52,24,9,48,28] on which US CDC[10] bases its
estimate, applied viral culture tests to assess the replication competence of shedded
viral loads. The 13-day average for virus-shedding by asymptomatics must therefore
be considered as an upper limit for the effective infectuous period.
Shedding active virus by asymptomatics. The viral loads shedded shortly after event p
are comparable to those of symptomatics.[35,73] However, the decay of virus loads after
the initial peak is faster than for symptomatic patients.[79,53,14,13,29,61,25,54,37,10, 12,84,73] A
British study[67] on the kinetics of viable virus load found that time-related decay rates
and the absolute levels of the virus load are the same for symptomatic and
asymptomatic infectives. After 10 days, the probability of finding self-replicable virus
material in serological testing dropped to 6%. A Korean study [73] of 68 asymptomatic
cases found that 50% of them had their first negative PCR test after 9.5 days, 25% after
7 days, and 75% after 14 days. In all cases this most probably means that shedding of
active virus material must have stopped a few days earlier, e.g. after, respectively, 5.5,
8 and 11 days. Also for asymptomatics there are long-shedding outlayers. Immuno-
depressed, severely ill patients with other diseases than COVID-19 and infected by the
asymptomatic COVID-19 infection mode, display shedding of active virus for a long
time, even up to 70 days.[2] Due to their non-COVID-19 illness, such cases tend to occur
in isolated and well-controlled environments, with little impact on overall epidemic
dynamics.
Time structure in shedded active virus material by symptomatics. Given the evidence, it
is plausible to assume that the asymptomatics' time pattern for shedding viable virus
is comparable to that of symptomatic infectives, but for a shorter total duration (9 days,
including the infection day) and with a steeper time-related decay. Compared to the
time pattern for symptomatic infectives, the three sub-periods with culture-positive
virus shedding are reduced with, respectively, 1, 2 and 2 days for asymptomatics:
 • interval: (p) — (p+2) : 71% of specimens ( . . = 2.37)
 • interval: (p+3) — (p+5) : 47% of specimens ( . . = 1.57)
 • interval: (p+6) — (p+8) : 30% of specimens ( . . = 1.0)
 • interval: (p+9) — ( $ ) : 0% of specimens ( . . = 0)

10
The abbreviation c.i. stands for the comparative infectuousness weights of each sub-
period, using the infectivity of the third period as reference, similar to the procedure
for symptomatics. Using these c.i. values as weights we may aggregate the full personal
infectivity cycle of asymptomatics in terms of these 'standard infection days'.
For the average asymptomatic this yields 14.82 'standard infectivity days' during the
course of his/her infection cycle. This is only two-thirds of the corresponding figure for
the symptomatics. However, the average daily infectivity for asymptomatics during
their 9 days with shedding active virus material is 1.65, which is higher than for
symptomatics due to the time profile of shedded replicable virus loads. Their less
infective sub-periods are relatively shorter.
Quantifying clinical intervals of both COVID-19 infection modes. The key missing link for
an empirical version of Table 1 were the events us and ua , i.e. the moments at which the
effective individual capability to transmit the disease ends for both COVID-19 infection
modes. With the evidence provided in this section and in the detailed references of
Annex 2, it is now possible to quantify the average duration of the effective individual
infection cycles. Table 3 summarises the stylised empirical results per clinical interval
of the COVID19 infection cycle.

 Table 3 Clinical intervals COVID-19 infection cycle: stylised, empirics-based model values
 Average
 Clinical stage intervals (legends in Table 1) duration, Details and references:
 in days
 Symptomatic infectives
 stage 1: Incubation (latency), θ to p 2 Annex tables A1 and A2
 stage 2: Presymptomatic infectivity, p to (v-1) 4 Annex table A2
 stage 3: Onset symptoms to medical treatment, v to (m-1) 3 Annex table A4
 stage 4: Shedding of active virus load: m to (us - 1) 7 [21], this section
 Stage 5: Non-active virus-shedding to resolve : us to ( " -1) 1-11 [21], Annex table A5
 PM: stage 4+5, Treatment/hospital/ isolation: m to ( " -1) 8-18 Annex table A5
 Asymptomatic infectives
 Stage 1: Incubation (latency): θ to p 2 same as symptomatics
 Stage 2: Shedding of active, virus load: p to (ua - 1) 9 this section
 Stage 3: ua to ( $ - 1) PM undefined

Quantifying `average' duration is not equally different for all stages of the infection
process. The virological research results with regard to the duration of stage 4
(shedding of viable virus material by symptomatic infectives) forms the least
problematic source material. The available research results appear to converge on this
issue, which allows to pinpoint event " quite precisely. Conversely, it is complicated
 11
to determine the average duration of the medical care trajectory (period from event m
to event " ), because of the large national differences in the organisation and density of
medical systems. The priority concern is that the length of stage 4 is in accordance with
the international clinical research results. The length of stage 5 will be allowed to differ
by country.
The effective infection cycle for symptomatics (stages 2-3-4) ends at event us and it
lasts on average 14 days for mild and moderate cases. In the first half of this interval
(7 days), the infected individual is non-tested, non-isolated and non-treated. This is
followed by a period of again 7 days, during which the person is confirmed, treated and
has some form of isolation. The effective infection cycle for asymptomatics (stage 2)
lasts on average 9 days. Most often, this full period is without testing, isolation or
treatment. An important result is also that the average daily infectuousness of
asymptomatics is rather higher than lower, compared to symptomatics. The result
corroborates some empirical findings.[25,83]

4. Relative infectuousness and epidemiological consequences
We searched the literature for a clear-cut, operational definition of the relative
infectuousness concept, but we did not find a generally accepted methodology.[dx, ea, eb]
Most of the literature agrees that virus-shedding activity matters, and that also the
quality of the virus matters, but that is where the agreement stops. Here we define
relative infectuousness as the product of (i) the mean number of virus-shedding days
per infective, (ii) daily recovery rate of active, replicable virus material, and if
applicable, (iii) downward mitigation of contacts with susceptibles through medical
isolation or self-isolation.
The third element is added for symptomatics in particular. After confirmation, the
latter enter stage 4 of their individual infection cycle (Table 3). It is plausible to assume
that the frequency and intensity of their individual contacts with susceptibles will be
reduced in this stage. While studies are available that quantify the generic contact-
reducing effects of public-health policies, we did not find any study that quantifies the
individual contact-reducing effects of being confirmed as a COVID-19 infective. We will
therefore impose plausible factors to lower the comparative infectuousness weights
(c.i.) from the day of seeking medical assistance (event m) up to the day that shedding
of replicable virus material stops (event us). The reduction factors are: -50% at day m
(day p+7 in Table 3) and -66% per day during the rest of their effective infection period
(days p+8 to p+13 in Table 3). The consequence of this medically-induced individual
isolation is that the number of 'standard infection days' in the average symptomatic's
personal infection cycle is reduced to 17.14 (down from 22.33, as was calculated in the
preceding section). The next effect is that also the average daily infectivity over the
total individual infection cycle drops to 1.22 (was 1.60). Calculation details can be
found in Annex 1.

12
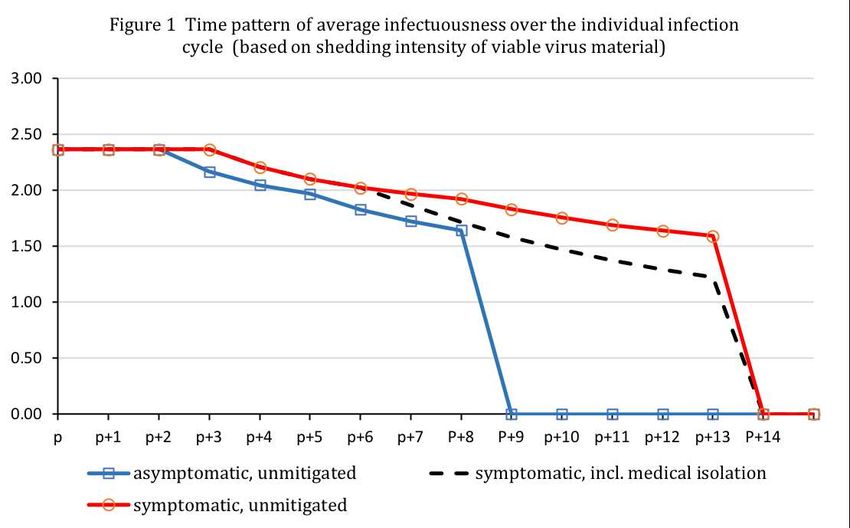
For asymptomatics, calculating the effects self-isolation or medically-induced isolation
has much less relevance. If asymptomatic infections are identified through contact-
tracing or community-wide PCR testing, it is likely that some form of isolation is
strongly advised or imposed. Best estimates[7,4,10,8,48,35,37,70,53] of the share of
asymptomatics vary between 15% and 67% of total infections, while only tiny numbers
of asymptomatic infections are indeed identified. The effect of isolation after detection
on asymptomatic infections is therefore probably small and may disappear in
statistical noise.
It is now possible to put all elements together and to depict the comparative kinetics of
infectuousness for both modes over the course of the full individual infection cycle. The
vertical axis measures the shedding intensity of viable virus material, i.e. the amount
of viable virus per shedding day, normalised by the amount of viable virus per day
during the last sub-period of the individual infection cycle (c.i.).

The dynamic pattern has implications for the infection risk. Suppose that there are 100
'average' susceptibles, who homogeneously interact with 50 'standard' asymptomatics
and 50 'standard' symptomatics. All infectives are of the same infection cohort .
Figure 1 shows that the susceptibles in the first three days have an equal probability of
contracting the disease from an asymptomatic or symptomatic person. From day p+3
onwards, the probability of contracting the disease from a symptomatic becomes
dominant. However, once accounting for the impact of medically induced isolation, the
dashed line in Figure 1 shows that the probability dominance of symptomatics shrinks
rapidly after day p+6, and in p+8 it has all but disappeared. Between day p+9 and day
p+13, the disease may only be contracted from a symptomatic person.

 13
A quantitative measure for overall infectuousness per infection mode is the number of
'standard infection days' per individual infection cycle, as defined in section 3: for
unmitigated symptomatics it is 22.33; for symptomatics with medically-induced
isolation it is 17.14, and for asymptomatics it is 14.80. Hence, if all circumstances are
the same, there is a higher probability of contracting the COVID-19 virus from a
symptomatic. The main reason is that symptomatics shed active virus over a longer
period. A second reason could be the phenomenon of super spreaders (severe
symptomatic cases with large loads of viable virus and many contacts) who may
generate a disproportionally larger infection risk. So far, we did not find any peer-
reviewed empirical report that documents similar super spreaders among
asymptomatics.[62,80]
The susceptible's actual probability of contracting COVID-19 from either infection
mode depends not only on their relative infectuousness, but also on the composition of
the susceptible's contacts network. Recall that the mean daily infectuousness of
asymptomatics over the course of their (shorter) infection cycle is higher than for a
symptomatic person. Figure 2 depicts how the probability of becoming infected by an
asymptomatic becomes dominant if there are enough asymptomatic infectives in the
susceptible's network. The shift occurs when 66% of the contacts group of the
susceptible are asymptomatics. We corrected for the length of the infective cycle.

 Share (%) of asymptomatic infectives in contacts network

5. Discussion of the results
The analytical time table of the individual infection cycles could provide important
inputs for public health policies and for epidemiologic research. The methodology

14
proposed in this paper can be adapted for use in case of other bacterial or viral
infections that are characterised by partly symptomless transmission. It could answer
several of the four key questions that were quoted from the recent literature in the
introductory section:
• the relations between viral load, viral shedding, infectiousness, and duration of
 infectuousness are now framed in a consistent framework that may unify much
 empirical and clinical work;
• the paper provides a quantitative estimate of the relative infectiousness of
 asymptomatics.
• Many confusing and apparently contradictory finding on virus-shedding and
 infectuousness in earlier studies can now be interpreted. Early papers often
 described a cross-section of infected persons in different stages of their individual
 infection cycles. It is only logical that such mixing up results in contradictory
 findings. By controlling for the stage of the individual infection cycle, it becomes
 possible to interpret apparently contradictory and controversial findings and
 measurement in a single framework. We propose to treat infection data as
 infection-cohort panel data instead of cross-section data that only control for
 individual differences as age, sex and physical condition.
• When accounting for the change in medical knowledge since January 2020, changes
 in the testing activity, and contact-reducing public health policies, our results may
 also shed new light on certain anomalies in the data, for instance in strange patterns
 between current case fatality rates and the number of confirmed COVID-19
 infections at the time that infection took place (event ). If current case fatality rates
 correlate negatively with confirmed infections at time , this is most likely caused
 by asymptomatic infections. Such patterns are typically found at the start of a new
 infections wave. We address this issue in a separate companion paper.[31]
Our results, when found to be correct in further clinical research, should have
consequences for the modelling of the epidemic. Most SIR/SEIR/SIRD models assume
that the time during which individuals remain infectuous can be described by an
exponential function and a single `exit rate' ( ) . This is biologically unrealistic, because
it implies that the chance of recovery in a given time interval is independent of the time
since infection. This leads to the distribution of infectuous periods being overly
dispersed, whereas in fact they are often closely centred around the mean infection
duration.[43] Non-exponential distributions make it necessary that the model keeps
track of the time since infection. If the shedding of viable virus material indeed follows
the time profiles that we have constructed from the empirical material, then it is clear
that the bulk of the secondary transmissions must occur in the early part of the
individual infection cycles.

 15
6. Conclusions
The paper proposes an analytical time table of individual infection cycles for parallel
symptomatic and asymptomatic infection modes. Symptomatic infectives with mild to
moderate infections, can on average transmit the infection during 14 days. Most
secondary transmissions occur in the first 7 days when the infectives are not isolated,
do not yet have symptoms, and emit the largest daily loads of self-replicable virus
material. After seeking medical assistance, the illness is confirmed, mostly followed by
some form of isolation. This reduces the effective infectivity during the second half of
the symptomatic infection cycle. The effective transmission period for asymptomatic
infectives lasts on average 9 days, with also the largest infectuousness in the first half
of this period. During their full infection cycle, the asymptomatics generally mix freely
with susceptibles and are able to transmit the disease
We propose to calculate the relative infectuousness of both infection modes by the
number of 'standard infection days'. Symptomatic infectives have the largest total
number of 'standard infection days' and thus are likely to constitute the largest source
of secondary infections. However, we also find that asymptomatic infectives have the
largest average daily infectivity; they shed most infective virus load during a short
period. This means that if the share of asymptomatics in the contact network of
susceptibles is large enough (>66%), they may become the dominant source of
secondary infections. Early detection of asymptomatic infectives by aselective
community-wide testing is important and more research should be focused on their
shedding of active virus material.

References

[1] Adam, D., P. Weng, Y. Wong, E. Lau, T. Tsang, et al. (2020), Clustering and superspreading potential
 of SARS-CoV-2 infections in Hong Kong, Nature Medicine, 26 (September), 1714-1719.
[2] Avanzato V., M. Matson, S. Seifert, R. Pryce, et al. (2020), Case study: Prolonged infectious SARS-CoV-
 2 shedding from an asymptomatic immunocompromised individual with cancer, Cell, 183 (7),
 1901–1912.
[3] Backer, J., D. Klinkenberg, and J. Wallinga(2020), Incubation period of 2019 novel coronavirus
 (2019- nCoV) infections among travellers from Wuhan, China, 20–28 January 2020, Euro
 Surveillance, 25 (5), 1-6
 [4] Beale S, A. Hayward, L. Shallcross, R. Aldridge and E. Fragaszy (2020), A rapid review and meta-
 analysis of the asymptomatic proportion of PCR-confirmed SARS-CoV-2 infections in community
 settings, Wellcome Open Res 2020 (Nov), 5:266
 (https://doi.org/10.12688/wellcomeopenres.16387.1).
[5] Bullard, J., K. Dust, D. Funk, et al. (2020), Predicting infectious severe acute respiratory syndrome
 coronavirus 2 from diagnostic samples, Clinical Infectious Diseases, 71 (10, Nov.). 2663–2666.
[6] Brauer, F., C. Castillo-Chavez (2010), Mathematical models in population biology and epidemiology,
 Second edition, Springer, New York.
[7] Buitrago-Garcia, D., D. Egli-Gany, M. Counotte, S. Hossmann, H. Imeri, A. Ipekci, G. Salanti, and N.
 Low (2020), Occurrence and transmission potential of asymptomatic and presymptomatic SARS-

16
CoV-2 infections: A living systematic review and meta-analysis, PLOS Medicine, 17(9): e1003346.
 (https://doi. org/10.1371/journal.pmed.1003346).
 [8] Byambasuren, O., M. Cardona et all. (2020), Estimating the extent of asymptomatic COVID-19 and
 its potential for community transmission: Systematic review and meta-analysis, Off. Journal Assoc.
 Med. Microbiology and Infectuous Diseases Canada, 5 (4, Dec.), 223–234
 (https://doi.org/10.3138/jammi-2020-0030).
[9] Casey, M. , J. Griffin, C. McAloon, A. Byrne, et al. (2020), Pre-symptomatic transmission of SARS-
 CoV-2 infection: a secondary analysis using published data, MedRxiv, June,
 (https://doi.org/10.1101/2020.05.08.20094870).
[10] CDC (2020-21), COVID-19 Pandemic Planning Scenarios: Updates April 2020, September 2020, and
 March 2021, Center for Disease Control and Prevention (USA).
 [11] Cereda, D., M. Tirani, F. Rovida, et al. (2020), The early phase of the COVID-19 outbreak in
 Lombardy, Italy, March 20, 2020 [https://arxiv.org/abs/2003.09320).
 [12] Cevik, M., M. Tate, O. Lloyd, A. Maraolo, J. Schafers, and A. Ho (2021), SARS-CoV-2, SARS-CoV, and
 MERS-CoV viral load dynamics, duration of viral shedding, and infectiousness: a systematic
 review and meta-analysis, The Lancet / Microbe, 2 (Jan), e13-e22.
[13] Chau N, L. Thanh, D. Thanh et all. (2020), The natural history and transmission potential of
 asymptomatic SARS-CoV-2 infection, Clinical Infectuous Diseases, 71 (10, Nov.), 2679–2687 (doi:
 10.1093/cid/ciaa711).
[14] Chau, N., V. Lam, N. Dung, et al. (2020), The natural history and transmission potential of
 asymptomatic SARS-CoV-2 infection, Clinical Infectious Diseases, 71 (15 Nov.), 2679-2687.
[15] Chen X., B. Zhu, W. Hong, et al. (2020), Associations of clinical characteristics and treatment
 regimens with the duration of viral RNA shedding in patients with COVID-19, International
 Journal of Infectious Diseases, 98 (Sept.), 252–60.
[16] Chen Y., P. Li, Y. Ding, M. Liu, L. Liu, B. Yi, et al. (2021), Epidemiological feature, viral shedding, and
 antibody seroconversion among asymptomatic SARS-CoV-2 carriers and symptomatic/ pre-
 symptomatic COVID-19 patients, Journal of Infection and Public Health, May. (PMCID:
 PMC8154191).
 [17] Contreras, S., J. Birron-Lattes, H. Villavicencio, et al. (2020), Statistically-based methodology for
 revealing real contagion trends and correcting delay-induced errors in the assessment of COVID-
 19 pandemic, Chaos, Solitons and Fractals, 139 (2020) 110087.
[18] Daley D. and J. Gani (1999), Epidemic Modelling: An Introduction, C.U.P. , Cambridge.
[19] Davies, N., P. Klepac, Y. Liu, K. Prem, M. Jit, et all. (2020), Age-dependent effects in the
 transmission and control of COVID-19 epidemics, Nature Medicine, 26 (Aug), 1205-1211.
 [20] Fernandez-Villaverde, J. and C.I. Jones (2020), Estimating and simulating a SIRD model of COVID-
 19 for many countries, states, and cities, NBER WP #27128, NBER, Cambridge (MA).
[21] Fried, M., J. Crawford, A. Mospan, S. Watkins, et al. (2021), Patient Characteristics and outcomes
 of 11,721 Patients with COVID-19 hospitalized across the United States, Clinical Infectuous
 Diseases, 72 (10, May), e558-e565.
[22] Guan, W., Z. Ni, Y. Hu, W. Liang et al. (2020), Clinical Characteristics of Coronavirus Disease 2019
 in China, New England Journal of Medicine, 382, 1708-1720
[23] Gudbjartsson, D., A. Helgason, H. Jonsson, O. Magnusson, et al. (2020), Spread of SARS-CoV-2 in the
 Icelandic population, New England Journal of Medicine, 382 (June), 2302-2315.
 [24] He, X., E. Lau, P. Wu, X. Deng , J. Wang, et al. (2020), Temporal dynamics in viral shedding and
 transmissibility of COVID-19, Nature Medicine, 26 (May), 672–675.
 [25] Hasanoglu, I., G. Korukluogu, D. Asilturk, Y. Cosgun et al. (2021), Higher viral loads in
 asymptomatic COVID-19 patients might be the invisible part of the iceberg, Infection, 49 (1), 117-
 126.
 [26] He, J., Y. Guo, R. Mao, and J. Zhang (2021), Proportion of asymptomatic coronavirus disease 2019:
 A systematic review and meta-analysis, Journal of Medical Virology, 93 (2, Febr), 820-830 (doi:
 10.1002/jmv.26326).
[27] Jefferson T., E. Spencer, L. Brassey, C. Heneghan (2020), Viral cultures for COVID-19 infectious
 potential assessment — a systematic review, Clinical Infectuous Diseases, (December 3) (epub
 ahead of print).
[28] Johansson, M., T. Quandelacy, S. Kada, P. Prasad, et al. (2021), SARS-CoV-2 Transmission From
 People Without COVID-19 Symptoms, JAMA Network Open, 4 (1, January), e2035057.

 17
[29] Kawasuji, H., Y. Takegoshi, M. Kaneda, A. Ueno, Y. Myajima, et al. (2020), Transmissibility of
 COVID-19 depends on the viral load around onset in adult and symptomatic patients, Plos One,
 Dec. 9 2020, (https://doi.org/10.1371/journal.pone.0243597).
[30] Koh, W., L. Naing, M. Rosledzana, M. Alikhan, L. Chaw, M. Griffith, R. Pastore and J. Wong (2020),
 What do we know about SARS-CoV-2 transmission? A systematic review and meta-analysis of the
 secondary attack rate and associated risk factors, Plos One, Oct. 8 2020
 (https://doi.org/10.371/journal.pone. 0240205).
[31] Kox, H. (2021), A discrete-time model for quantifying the impact of asymptomatic COVID-19
 infections, KVL Discussion Paper No. 2021-05, KVL Policy Research, Hertogenbosch.
[32] Kristiansen, M., B. Heimustovu, S. á Borg, et al. (2021), Epidemiology and clinical course of first
 wave coronavirus disease cases, Faroe Islands, Emerging Infectuous Diseases, 27 (3, March), 749–
 758.
 [33] Kucharski, A., T. Russell,C. Diamond, Y. Liu, et al. (2020), Early dynamics of transmission and
 control of COVID-19: A mathematical modelling study, The Lancet Infection, 20 (May), 553-558.
[34] Lauer, S., K. Grantz, Q. Bi, F. Jones, et al. (2020), The Incubation Period of Coronavirus Disease
 2019 (COVID-19) From Publicly Reported Confirmed Cases: Estimation and Application, Annals of
 Internal Medicine, 172 (9, May 5), 577-582.
[35] Lavezzo, E., E. Franchin, C. Ciavarell, et all. (2020), Suppression of a SARS-CoV-2 outbreak in the
 Italian municipality of Vo', Nature 584 (August), 425-429 (plus online Annex).
[36] Leclerc, Q., N. Fuller, L. Knight, et al. (2020), What settings have been linked to SARS-CoV-2
 transmission clusters? , Wellcome Open Research, 5, 83
 (doi:10.12688/wellcomeopenres.15889.1.)
[37] Lee Y., C. Hong, D. Kim, T. Lee , and J Lee (2020), Clinical course of asymptomatic and mildly
 symptomatic patients with coronavirus disease admitted to community treatment center in the
 Republic of Korea, JAMA Internal Medicine, 180, 1447-1452.
[38] Lewis, N., L. Duca, P. Marcenac, E. Dietrich, et al. (2021), Characteristics and timing of initial virus
 shedding in Severe Acute Respiratory Syndrome Coronavirus 2, Utah, USA, Emerging Infectuous
 Diseases, 27 (2, Febr.), 352-359.
[39] Li, J., D. Huang, B. Zou, H. Yang, et al. (2020), Epidemiology of COVID-19: A systematic review and
 meta-analysis of clinical characteristics, risk factors, and outcomes, Journal of Medical Virology,
 August.
[40] Li. Q., P. Wu, X. Wang et all. (2020), Early transmission dynamics in Wuhan, China, of novel
 coronavirus–infected pneumonia, The New England Journal of Medicine, 382 (13, March 26),
 1199-1207.
[41] Liu, Z., R. Chu, L. Gong, B. Su, and J. Wu (2020), The assessment of transmission efficiency and
 latent infection period in asymptomatic carriers of SARS-CoV-2 infection, International Journal of
 Infectious Diseases, 99, 325–327.
 [42] Liu, Y., L. Yan, L. Wan,T. Xiang, et al. (2020), Viral dynamics in mild and severe cases of COVID-
 19, Lancet Infectuous Diseases, 20 (6, June), 656–657.
 [43] Lloyd, A. (2001), Destabilisation of epidemic models with the inclusion of realistic distributions
 of infectuous period, Proceedings of the Royal Society London (Proc. R. Soc.Lond), B 268, 985-993.
[44] Ma, S., J. Zhang, M. Zeng, Q. Jun, et al. (2020), Epidemiological Parameters of COVID-19: Case
 Series Study, Journal of Medical Internet Research, 22 (10, October), e19994 (doi:
 10.2196/19994).
 [45] McAloon, C., A. Collins, K. Hunt, A. Barber, A. Byrne, et al. (2020), Incubation period of COVID-19:
 a rapid systematic review and meta-analysis of observational research, BMJ Open, 10 (8),
 e039652 (doi: 10.1136/bmjopen-2020-039652).
[46] McEvoy, S, C. McAloon, A. Colllins, K. Hunt, F. Butler, et al. (2021), Relative infectiousness of
 asymptomatic SARS-CoV-2 infected persons compared with symptomatic individuals: a rapid
 scoping review, BMJ Open, 11, e042354. [doi:10.1136/ bmjopen-2020-042354].
 [47] Melsew, Y., A. Adekunle, A. Cheng, E. McBryde, et al. (2020), Heterogeneous infectiousness in
 mathematical models of tuberculosis: A systematic review, Epidemics, 30, 100374.
 [48] Moghadas, S., M. Kirkpatrick, P. Sah, A. Pandey, A. Shoukat. B. Singer, and A. Galvani (2020), The
 implications of silent transmission for the control of COVID-19 outbreaks, PNAS (Proceedings of
 the National Academy of Sciences), 117 (30, July), 17513-17515.

18
[49] Mollan, K., J. Eron, T. Krajewski, W, Painter, et al. (2021), SARS-CoV-2 infectious virus, viral RNA in
 nasopharyngeal swabs, and serostatus of symptomatic COVID-19 outpatients in the United States,
 medRxiv preprint, June, (doi: https://doi.org/10.1101/2021.05.28.21258011).
 [50] Ng, S., P. Kaur, C. Kremer, W. Tan et al. (2020), Estimating Transmission Parameters for COVID-
 19 Clusters by Using Symptom Onset Data, Singapore, January–April 2020, Emerging Infectuous
 Diseases, 27 (2), 582-585.
[51] Ng, O., K. Marimuthu, V. Koh, J. Pang, K. Linn, et al. (2021), SARS-CoV-2 seroprevalence and
 transmission risk factors among high-risk close contacts: A retrospective cohort study, The
 Lancet/Infection, 21 (March), 333-343.
[52] Noh, J., J. Yoon, H. Seong, et al. (2020), Asymptomatic infection and atypical manifestations of
 COVID-19: Comparison of viral shedding duration, Journal of Infection, 81 (5, Nov.), 816-846.
[53] Oran, D., and E. Topol (2021), The proportion of SARS-CoV-2 Infections that are asymptomatic: A
 systematic review, American College of Physicians, Annals of Internal Medicine, Jan.21
 (doi:10.7326/M20-6976).
 [54] Owusu, D., M. Pomeroy, N. Lewis, A. Wadhwa, A, Yousaf, et al. (2021), Persistent SARS-CoV-2 RNA
 shedding without evidence of infectiousness: A cohort study of individuals with COVID-19, The
 Journal of Infectious Diseases, 27 Febr. 2021, 1-10 (DOI: 10.1093/infdis/jiab107).
[55] Pan, D., S. Sze, A. Abraham, C. Williams, et al. (2021), Rapid tests for quantification of infectuousness
 are urgently needed in patients with COVID-19, The Lancet Microbe, (May 12), (epub ahead of
 print).
[56] Park, S., Y. Kim, S. Yi, S. Lee, B. Na, et al. (2020), Coronavirus disease outbreak in call center, South
 Korea, Emerging Infectious Diseases, 26 (8), 1666-1670.
 [57] Pollán, M., B. Perez-Gomez, R. Pastor-Barriuso, et al. (2020), Prevalence of SARS-Cov-2 in Spain
 (ENE-COVID): A nationwide, population-based seroepidemiological study, Lancet, 396, 535-544.
 (doi: 10.1016/S0140-6736(20)31483-5).
 [58] Pollock, A. and J. Lancaster (2020), Asymptomatic transmission of COVID-19, The BMJ, #371
 (Dec.), m4851 (http://dx.doi.org/10.1136/bmj.m4851).
[59] Pung, R., C. Chiew, B. Young, S. Chin, et al. (2020), Investigation of three clusters of COVID-19 in
 Singapore: implications for surveillance and response measures, The Lancet, 395 (10229, March),
 1039-1046.
[60] Qui, X., A. Nergiz, A. Maraolo, I. Bogoch, N. Low and M. Cevik (2021), Defining the role of
 asymptomatic and pre-symptomatic SARS-CoV-2 transmission, Clinical Microbiology and
 Infection, pre-publication (https//www.doi.org/10.1016/j.cmi.2021.01.011).
[61] Ra, S., J. Lim, G. Kim, M. Kim, et al. (2021), Upper respiratory viral load in asymptomatic
 individuals and mildly symptomatic patients with SARS-CoV-2 infection, BMJ Thorax, 76, 61-63.
 [62] Rambo, A., L. Goncalves, A. Gonzales, et al. (2021), Impact of super-spreaders on COVID-19:
 systematic review, Sao Paulo Medical Journal, 139 (2, March-April), 163-169 (doi: 10.1590/1516-
 3180.2020.0618.R1.10122020).
[40] Ravindra, K., V. Malik, B. Padhi, S. Goel, and S. Gupta (2020), Consideration for the asymptomatic
 transmission of COVID-19: Systematic review and meta-analysis, medRxiv (DOI:
 10.1101/2020.10.06.20207597).
[64] RIVM (2021), Epidemiologische situatie van SARS-CoV-2 in Nederland, Rijksinstituut voor
 Volksgezondheid en Milieu (RIVM), 16 februari 2021, 47-49.
[65] Rodrigues-Grande, C., J. Adan-Jimenez, P. Catalan, L. Alcala, et al. (2021), Inference of active viral
 replication in cases with sustained positive Reverse Transcription-PCR Results for SARS-CoV-2,
 Journal of Clinical Microbiology, 59 (2, Febr.), e02277-20.
[66] Sanche S., Y. Lin, C. Xu, E. Romero-Severson, N. Hengartner, R. Ke (2020), High contagiousness and
 rapid spread of Severe Acute Respiratory Syndrome Coronavirus 2, Emerging Infectuous Diseases,
 26 (7), 1470-1477.
[67] Singanayagam, A., M. Patel, A. Charlett, et al. (2020), Duration of infectiousness and correlation
 with RT-PCR cycle threshold values in cases of COVID-19, England, January to May 2020,
 Eurosurveillance, 25 (32, Aug.).
[68] Siordia, J. (2020), Epidemiology and clinical features of COVID-19: a review of current literature,
 Journal of Clinical Virology, 127, (June), 104357 (Online 20 April 20,
 https://doi.org/10.1016/j.jcv.2020.104357).

 19
[69] Strahlin, K., E. Wahlström, S. Walther, A. Bennet-Bark, et al. (2021), Mortality trends among
 hospitalised COVID-19 patients in Sweden: A nationwide observational cohort study, The Lancet
 Regional Health - Europe, 4 (May). (https://doi.org/10.1016/j.lanepe.2021.100054).
[70] Subramanian, R., Q. He and M. Pascual (2021), Quantifying asymptomatic infection and
 transmission of COVID-19 in New York City using observed cases, serology, and testing capacity,
 PNAS (Proceedings of the National Academy of Sciences), 118 (9, Feb.)
 (https://doi.org/10.1073/pnas.2019716118).
[71] Tindale, L., J. Stockdale, M. Coombe, E. Garlock, W. Lau, M. Saraswat, L. Zhang, D. Chen, J. Wallinga,
 and, C. Colijn (2020), Evidence for transmission of COVID-19 prior to symptom onset, Elife, 2020
 (Jun), (DOI: https://doi.org/10.7554/eLife.57149).
[72] Trauer, J., P. Dodd, M. Gomes, G. Gomez, R. Houben , et al. (2019), The importance of
 heterogeneity to the epidemiology of tuberculosis, Clinical Infectious Diseases, 69 (1 July), 159-
 166.
[73] Uhm, J., J. Ahn, J. Hyun, Y. Sohn, et al. (2020), Patterns of viral clearance in the natural course of
 asymptomatic COVID-19: Comparison with symptomatic non-severe COVID-19, International
 Journal of Infectuous Diseases, 99, 279-285.
[74] Verity, R., L. Okell, I. Dorigatti, P. Winskill, et al. (2020), Estimates of the severity of coronavirus
 disease 2019: A model-based analysis, The Lancet Infection, 20 (June), 669-677.
[75] Walsh, K., S. Spillane, L. Comber, K. Cardwell, et al. (2020), The duration of infectiousness of
 individuals infected with SARS-CoV-2, Journal of Infection, 81 (Dec.), 847–856.
[76] Ward, H., G. Cooke,C. Atchinson, et al. (2020), Declining prevalence of antibody positivity to SARS-
 Cov-2: A community study of 365,000 adults. medRxiv, posted online October 2020
 (doi:10.1101/2020. 10.26.20219725).
[77] Wölfel R., V. Corman, W. Guggemos, et al. (2020), Virological assessment of hospitalized patients
 with COVID-2019, Nature, 581, 465-469.
[78] Xu, X., et al. (2020), Reconstruction of transmission pairs for novel coronavirus disease 2019
 (COVID-19) in mainland China: estimation of super-spreading events, serial interval and hazard
 of infection, Clinical Infectuous Diseases, 71 (12, December), 3163–3167.
 [79] Yu, C., M. Zhou, Y. Liu, C. Ou, et al. (2020) Characteristics of asymptomatic COVID-19 infection and
 progression: A multicenter, retrospective study, Virulence, 11 (1), 1006-1014.
[80] Zhang, Y., Y. Li, L. Wang, M. Li, X. Zhou (2021), Evaluating transmission heterogeneity and super-
 spreading event of COVID-19 in a metropolis of China, International Journal of Environmental
 Research and Public Health, 17( 10), 3705; (https://doi.org/10.3390/ijerph17103705).
 [81] Zhou, R., F. Li, F. Chen, H. Liu, et al. (2020), Viral dynamics in asymptomatic patients with COVID-
 19, International Journal of Infectious Diseases, 96, 288–290.
[82] Zhou, F., T. Yu, R. Du, G. Fan, Y. Liu, et al. (2020), Clinical course and risk factors for mortality of
 adult inpatients with COVID-19 in Wuhan, China: a retrospective cohort study, The Lancet, 395,
 1054-1062.
[83] Zou L., F. Ruan, M. Huang, L. Liang, et al. (2020), SARS-CoV-2 viral load in upper respiratory
 specimens of infected patients, New England Journal of Medicine, 382 (12, March), 1177–1179.
[84] Cheng, H., S. Jian, D. Liu, T. Ng, W.Hung, et al. (2020), Contact tracing assessment of COVID-19
 transmission dynamics in Taiwan and risk at different exposure periods before and after
 symptom onset, JAMA Internal Medicine, 180 (9), 1156–1163.
[85] Hu, Y., J. Sun, Z. Dai, H. Deng, et al. (2020) , Prevalence and severity of corona virus disease 2019
 (COVID-19): A systematic review and meta-analysis, Journal of Clinical Virology, 127 ( June),
 104371.

20
You can also read