Overlap Intensity: An ImageJ Macro for Analyzing the HIV-1 In Situ Uncoating Assay
←
→
Page content transcription
If your browser does not render page correctly, please read the page content below
viruses
Article
Overlap Intensity: An ImageJ Macro for Analyzing the HIV-1
In Situ Uncoating Assay
Zachary Ingram, Hannah Matheney, Emma Wise, Courtney Weatherford and Amy E. Hulme *

                                          Department of Biomedical Sciences, Missouri State University, Springfield, MO 65987, USA;
                                          Ingram13@live.missouristate.edu (Z.I.); Hannah023@live.missouristate.edu (H.M.);
                                          Emma230@live.missouristate.edu (E.W.); Courtney145@live.missouristate.edu (C.W.)
                                          * Correspondence: amyhulme@missouristate.edu

                                          Abstract: Capsid uncoating is at the crossroads of early steps in HIV-1 replication. In recent years,
                                          the development of novel assays has expanded how HIV-1 uncoating can be studied. In the in situ
                                          uncoating assay, dual fluorescently labelled virus allows for the identification of fused viral cores.
                                          Antibody staining then detects the amount of capsid associated with each viral core at different
                                          times post-infection. Following fixed cell imaging, manual counting can be used to assess the fusion
                                          state and capsid signal for each viral core, but this method can introduce bias with increased time of
                                          analysis. To address these limitations, we developed the Overlap Intensity macro in ImageJ. This
                                          macro automates the detection of viral cores and quantification of overlapping fusion and capsid
                                          signals. We demonstrated the high accuracy of the macro by comparing core detection to manual
                                          methods. Analysis of an in situ uncoating assay further verified the macro by detecting progressive
                                          uncoating as expected. Therefore, this macro improves the accessibility of the in situ uncoating assay
                                by replacing time-consuming manual methods or the need for expensive data analysis software.

                                          Beyond the described assay, the Overlap Intensity macro includes adjustable settings for use in other
Citation: Ingram, Z.; Matheney, H.;       methods requiring quantification of overlapping fluorescent signals.
Wise, E.; Weatherford, C.; Hulme, A.E.
Overlap Intensity: An ImageJ Macro        Keywords: HIV-1; capsid; uncoating; ImageJ; image quantification; fluorescent microscopy; fluores-
for Analyzing the HIV-1 In Situ           cent overlap
Uncoating Assay. Viruses 2021, 13,
1604. https://doi.org/10.3390/
v13081604

                                          1. Introduction
Academic Editor: Markus Thali
                                               The viral capsid is critical for multiple early steps of HIV-1 replication. The conical
Received: 30 July 2021                    capsid is made of ~1500 monomers of the viral capsid (CA) protein which surrounds
Accepted: 10 August 2021                  the genomic RNAs and other associated proteins to form the viral core [1,2]. The capsid
Published: 13 August 2021                 is implicated in the protection of the reverse transcription complex (RTC), microtubule
                                          assisted transport, and nucleoporin interactions [3–6]. The disassembly or remodeling
Publisher’s Note: MDPI stays neutral      of the capsid, a step termed uncoating, is a requirement for replication with hyperstable
with regard to jurisdictional claims in   and unstable capsid mutants associated with decreased infectivity [3,7]. Furthermore, the
published maps and institutional affil-   process of uncoating also has an interplay with reverse transcription and nuclear import of
iations.                                  the viral genome [8–11]. The ability to study the capsid and uncoating has improved due
                                          to recent advancements in the field.
                                               There are multiple assays available to study uncoating including capsid core stability
                                          assays, the fate of the capsid assay, the CsA washout assay, and fluorescence microscopy-
Copyright: © 2021 by the authors.         based uncoating assays [1,3,12–25]. Each of these assays has different strengths and weak-
Licensee MDPI, Basel, Switzerland.        nesses, so often a combination of assays is used to study the factors that influence uncoating.
This article is an open access article    Several uncoating assays have been developed utilizing fluorescence microscopy with cap-
distributed under the terms and           sid detection by antibody staining or through the use of fluorescent markers [8,15–17,19–22].
conditions of the Creative Commons        Collectively, fluorescence microscopy techniques allow the process of uncoating to be stud-
Attribution (CC BY) license (https://     ied in infected cells with direct visualization of the capsid and the process of uncoating
creativecommons.org/licenses/by/          relative to other cellular structures or proteins. However, these assays are dependent of
4.0/).

Viruses 2021, 13, 1604. https://doi.org/10.3390/v13081604                                                    https://www.mdpi.com/journal/viruses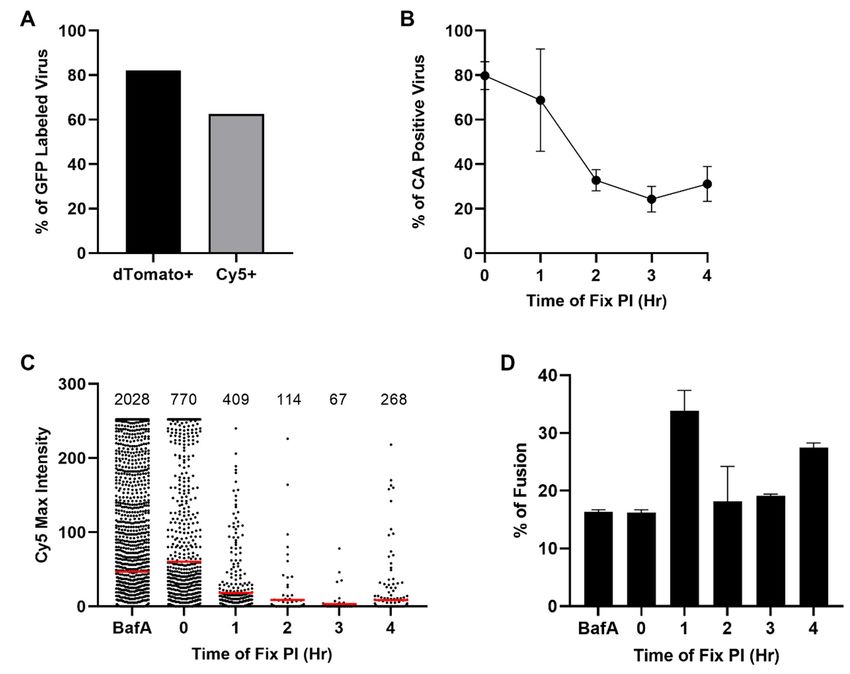
Viruses 2021, 13, 1604                                                                                             2 of 15

                         optimal fluorescent labelling and staining of virus. Some of these fluorescent microscopy
                         assays may also focus on a bulk population of virions, some of which may be uninfectious.
                               Most recently, fluorescent microscopy-based uncoating assays have been developed
                         that utilize live cell imaging to track the progression of early steps of replication (uncoating,
                         reverse transcription, cytoplasmic transit, nuclear import) in single virions and, in some
                         assays, infection of the target cell [15–17,22–25]. Despite the importance of these exper-
                         iments, the equipment needed to maintain live cell imaging can be limiting to research
                         institutions. A more accessible alternative to live microscopy-based experiments is the in
                         situ uncoating assay, which relies on fixed cell imaging over a time course [8,19]. The in
                         situ uncoating assay is a confocal microscopy-based experiment where dual-labelled HIV-1
                         is used to infect cells. The dual-labelled virus includes either GFP-tagged Vpr or integrase
                         (IN) viral proteins [18,26,27]. The GFP-tagged proteins associate with the viral core and
                         act as a marker for its location in the cytoplasm and nucleus of the cell. In addition, the
                         virus producer cells are transfected with a S15-dTomato plasmid. S15-dTomato includes
                         the N-terminal segment of c-Src which embeds into the cell membrane [27,28]. As progeny
                         virions bud from producer cells, the tagged host membrane is incorporated into the HIV
                         viral membrane. Inclusion of the S15-dTomato into the viral membrane allows fusion to
                         be tracked with the loss of the dTomato signal. In the in situ uncoating assay, cells are
                         infected with this dual-labelled virus and then fixed over a time course. Fixed cells undergo
                         antibody staining for CA with a Cy5-conjugated secondary antibody. The Cy5 signal allows
                         the extent of uncoating to be quantified by either the percentage of Cy5-positive virus or
                         the mean maximum Cy5 intensity at different times post infection [19,29]. Since its devel-
                         opment, the in situ uncoating assay has been used to examine general uncoating kinetics,
                         the effects of capsid mutations on uncoating, and the impact of reverse transcription on
                         uncoating [7,8,11,19,30]. More recently, the in situ uncoating assay has been instrumental
                         in examining the role of multiple cellular factors (Dynein, Kif5B, FEZ1, BICD2, Nup358,
                         Dia1, Dia2, EB1, CLIP170) involved with cellular trafficking and nuclear import on un-
                         coating [14,29,31–34]. These findings have been further supported by alternate uncoating
                         assays or by characterizing related replication steps. Therefore, the in situ uncoating assay
                         is a valuable tool for revealing different aspects of the early steps of HIV replication.
                               Following the imaging of fixed cell samples in the in situ uncoating assay, images must
                         be analyzed to determine the extent of uncoating. First the GFP-positive viral particles
                         must be sorted into fused (dTomato-negative) and unfused (dTomato-positive) categories.
                         GFP-positive viral particles that have fused are then measured for Cy5 intensity as the
                         primary readout of capsid. Typically, the majority of imaged puncta represent unfused
                         cores resulting in a lower population of fused virus for analysis [8,14,29]. To quantify
                         a sufficient number of fused viral cores, multiple images are necessary. Increasing the
                         number of images per sample increases the total viral core count but extends the time of
                         data analysis. Several approaches can be used for data analysis. One option is to manually
                         count GFP signals before sorting each virus into fused, unfused, coated, and uncoated
                         groups. This manual analysis is carried out through the placement of regions of interest
                         (ROIs) around GFP signals. Total ROIs are counted, followed by visual inspection for
                         dTomato and Cy5 signal that overlaps with the ROI. While the manual method can be
                         utilized with a variety of image processing software applications, the analysis proves to be
                         laborious. Potential bias may also be introduced as a dim GFP signal may be undercounted
                         or vary between individual counters. In instances where the signal is low or a confocal
                         system lacks sensitivity, virus detection can be inaccurate and imprecise under visual
                         inspection. An alternative to manual counting is the use of semi-automatic methods. Semi-
                         automatic analysis requires an established protocol or macro within an image processing
                         software, but user bias is removed with automatic detection of virus labelling. Rapid
                         detection and measurement of signal overlap further eliminate the downsides found in
                         the manual method. Currently no freely available software is designed for detection and
                         quantification methods specific to the in situ uncoating assay. Software that has been used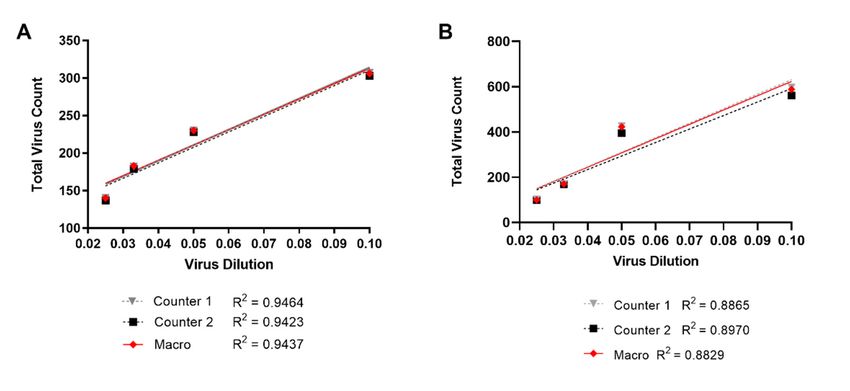
Viruses 2021, 13, 1604                                                                                           3 of 15

                         in previous research, such as Imaris and MetaMorph Imaging Software, are capable of
                         analysis but are limited by the cost for software access [14,29].
                               ImageJ is a free open source alternative to cost restrictive imaging software [35].
                         ImageJ includes a flexible toolset for image processing with plugins available to expand
                         analysis options. Within ImageJ is a set of adaptable tools, including scripting capabilities,
                         to develop macros and plugins. Building on the ImageJ framework, Fiji Is Just ImageJ
                         (FIJI) represents a packaged version of ImageJ with the inclusion of various plugins and
                         tools [36]. The colocalization analysis found in FIJI or ImageJ cannot be used for the in
                         situ uncoating assay. Colocalization measures the degree of overlap between two signals,
                         which is often expressed as the Pearson’s correlation coefficient or Manders coefficient.
                         The output of these analyses does not include a fluorescence intensity for each fluorophore
                         in an ROI. When using the current capabilities of ImageJ for the in situ uncoating assay,
                         GFP punctate can be manually counted as ROIs followed by the measurement of dTomato
                         and Cy5 intensity in each ROI. However, the large number of particles counted contributes
                         extensive time spent processing images during analysis, as previously described.
                               In this work, we have developed the semi-automated Overlap Intensity macro for
                         ImageJ to automatically count GFP signal and then measure dTomato and Cy5 intensity in
                         each ROI. We validated our macro’s ability to detect GFP signal above background against
                         a manual counting method. Additionally, we used this macro to analyze data from the
                         in situ uncoating assay. In developing this macro, we hope to expand the accessibility of
                         the in situ uncoating assay. Importantly, we have designed the Overlap Intensity macro
                         with adjustable settings to allow for use beyond the described uncoating experiment. The
                         Overlap Intensity macro is available for download at https://github.com/HulmeLab/
                         Overlap-Intensity-Macro (accessed on 11 August 2021).

                         2. Materials and Methods
                         2.1. Cell Lines and Pharmaceuticals
                                The 293T HEK cell line was received from the Hope lab at Northwestern University [8].
                         293T cells were cultured in Dulbecco’s Modification of Eagle’s Medium (DMEM, Corning),
                         1% Penicillin/Streptomycin/L-Glutamine (PSG, Corning), and 10% Fetal Bovine Serum
                         (FBS, R&D Systems, Minneapolis, MN, USA). The human microglial cell line CHME3
                         was received from the Naghavi lab at Northwestern University [37]. CHME3 cells were
                         maintained in DMEM with 1% PSG, 5% FBS, and 0.91 mM Sodium Pyruvate (Corning). All
                         cell lines were maintained at 37 ◦ C with 5% CO2 . Baflomycin A (BafA, Sigma, St. Louis, MO,
                         USA) was stored at −20 ◦ C and used at a working concentration of 0.02 uM. DEAE Dextran
                         (Sigma) was used at a concentration of 10 ng/µL and was stored at 4 ◦ C. Polyethyleneimine
                         (PEI) was aliquoted in sterile ddH2 O and stored at 4 ◦ C.

                         2.2. Virus Production and Characterization
                              Dual-labelled VSV g pseudotyped HIV-1 was produced through PEI transfection
                         of 293T HEK cells with four plasmids as previously described: CMV-VSV-G, HIV-GFP,
                         GFP-Vpr, and S15-dTomato [27]. The HIV-GFP proviral plasmid has mutations present
                         in the Env gene to render it replication defective (∆Env, [38]). In this plasmid, GFP is
                         cloned into the Nef position and functions as a GFP reporter for infection of the cell. For
                         the imaging experiments described here, the GFP reporter does not impact GFP labelling
                         when making dual-labelled virus. Virus was harvested by passage of transfected cell media
                         through a 0.45 um syringe filter (Millex-HV) before storing virus aliquots at −80 ◦ C. Virus
                         was characterized on glass to confirm GFP co-labelling with dTomato and CA staining
                         percentage of at least 80% and 50%, respectively. Sterile glass coverslips were transferred to
                         a 24-well plate before a 15 min treatment with Poly-L-Lysine (Sigma). Dual-labelled virus
                         was added to the subbed glass coverslips at 3 concentrations (undiluted, 1/10 dilution,
                         and 1/20 dilution) to determine the concentration used for future experiments. Plated
                         virus was then centrifuged for 1 h at 1200× g, 16 ◦ C. After centrifugation, all coverslips
                         were fixed with 4% paraformaldehyde for 15 min. Coverslips were then washed with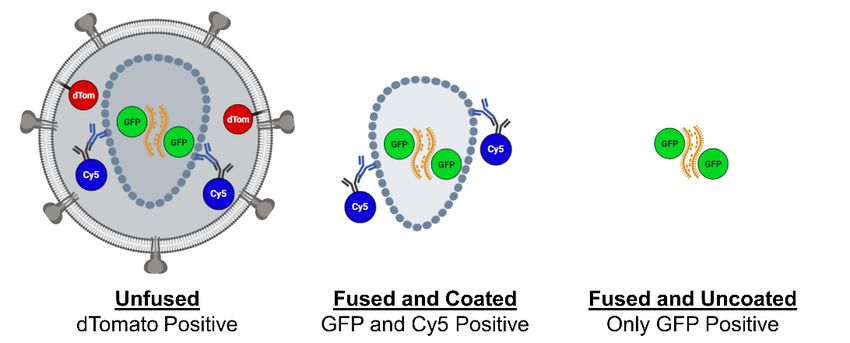
Viruses 2021, 13, 1604                                                                                           4 of 15

                         PBS, permeabilized with 0.05% Triton X in PBS for 15 min, and blocked with 10% FBS
                         solution for 45 min. Primary antibody staining with the human Anti-HIV-1 p24 monoclonal
                         antibody (241-D) was carried out overnight at 4 ◦ C [39–41]. Secondary antibody stain
                         was carried out with an anti-human 647 antibody (Jackson ImmunoResearch) at room
                         temperature for 1 h. Coverslips were mounted onto glass slides using ProLong™ Glass
                         Antifade Mountant and imaged using confocal microscopy.

                         2.3. Validation Assays
                               For virus on glass validation assays, sterile glass coverslips were transferred to a
                         24-well plate before a 15 min treatment with Poly-L-Lysine (Sigma). For virus on cell
                         validation assays, glass coverslips stored in 70% ethanol were transferred into 24-well
                         plates and treated for 30 min with EmbryoMax 0.1% Gelatin (MilliporeSigma) at room
                         temperature. CHME3 cells were plated at 120,000 cells per well and incubated overnight.
                         Dual-labelled virus was applied to the coverslips at 1/10th, 1/20th, 1/30th, and 1/40th dilu-
                         tions in media. Plates were then centrifuged for 1 h at 1200× g, 16 ◦ C. After centrifugation,
                         all coverslips were immediately fixed with 4% paraformaldehyde for 15 min. Antibody
                         staining and coverslip mounting were carried out as described in the Virus Production and
                         Characterization section. Coverslips were imaged using confocal microscopy.

                         2.4. In Situ Uncoating Assay
                               Glass coverslips stored in 70% ethanol were transferred into 24-well plates and treated
                         for 30 min with EmbryoMax 0.1% Gelatin (MilliporeSigma) at room temperature. CHME3
                         cells were plated at 120,000 cells per well and incubated overnight. Infection was carried
                         out with a 1/10th dilution of dual-labelled virus with 1X DEAE Dextran. A cell only
                         condition was included with mock infection to determine cell background. As a fusion
                         control, one coverslip underwent four hours of infection with constant BafA treatment.
                         Cells underwent spinoculation for 1 h at 1200× g, 16 ◦ C. Following spinoculation, the
                         infection media was aspirated with the addition of 37 ◦ C culture media initiating the
                         infection time course. At each time point, coverslips were fixed with 4% paraformaldehyde
                         for 15 min. Antibody staining and coverslip mounting were carried out as described in
                         the Virus Production and Characterization section. An antibody control was included by
                         staining one infected coverslip with only the secondary antibody. Coverslips were imaged
                         using confocal microscopy.

                         2.5. Confocal Microscopy and Image Processing
                              Fixed coverslips on glass slides were imaged with a Leica SP8 DMI8 confocal micro-
                         scope using the Leica Application Suite X (LASX) software (Leica Microsystems, Buffalo
                         Grove, IL, USA). All images were acquired with a pinhole size of 1.00 AU. GFP, dTomato,
                         and Cy5 signal were sequentially captured with 488 nm, 532 nm, and 635 nm wavelength
                         lasers. For each experimental condition, 10 images were acquired as a Z-stack. For each
                         image, the Z-stack was maximum projected into a 2D image. Using the LASX software,
                         images were then thresholded to remove background in the GFP, dTomato, and Cy5 chan-
                         nels. The background level thresholds were determined for GFP and dTomato according to
                         the stained cell only control. Cy5 background threshold was set based on the secondary
                         antibody only negative control. After thresholding for background, images were exported
                         as TIFFs for analysis in ImageJ.

                         3. Results
                         3.1. Establishment of the Overlap Intensity Macro
                              Upon completing an in situ uncoating assay experiment, the data analysis requires
                         categorizing and sorting individual viral cores based on labelling. Various combinations of
                         the three fluorescent labels allow for each virus to be identified as either unfused, fused
                         with detectable capsid signal, or fused with no detectable capsid signal (Figure 1). Virus is
                         identified based on GFP-positive punctate marked by GFP-Vpr. The presence of dTomato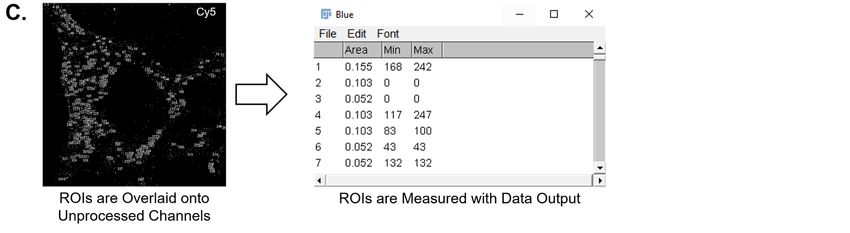
Viruses 2021, 13, x FOR PEER REVIEW 5 of 15
Viruses 2021, 13, 1604 5 of 15
of the three fluorescent labels allow for each virus to be identified as either unfused, fused
with detectable capsid signal, or fused with no detectable capsid signal (Figure 1). Virus
is identified based on GFP-positive punctate marked by GFP-Vpr. The presence of
dTomato signal indicates
signal indicates unfused
unfused virus thatvirus thatassociated
remains remains associated withenvelope.
with the viral the viral Viral
envelope.
cores
Viral coresfused
that have that are
have fused are
identified byidentified
absence ofbytheabsence
dTomatoofmarker.
the dTomato
Virus canmarker. Virus
then be can
assessed
then be assessed
for CA for CAonpresent
present based the Cy5 based
signalon(Figure
the Cy52).signal (Figure of
The sorting 2). viral
The sorting of viral
cores into each
cores into precedes
category each category precedes To
data analysis. data analysis.
properly To properly
assess assess
uncoating, onlyuncoating,
virus thatonly
has virus
fused
that has fused
is included is included
in the in the While
final analysis. final analysis.
countingWhile counting
and sorting canand sorting canmanually,
be completed be com-
pleted manually,
the process proves thetoprocess
be time proves to be Furthermore,
consuming. time consuming. Furthermore,
variability betweenvariability be-
counters and
tween
images counters and images
can introduce errorscan
andintroduce errors and
bias. To expedite bias.
the To expedite
assessment the assessment
of dual-labelled of
virus,
dual-labelled virus, the macro
the Overlap Intensity OverlapwasIntensity
developedmacro was developed
within ImageJ. The within
goal ImageJ. The goal
in designing this
macro
in was to
designing uniformly
this macro was identify viral punctate
to uniformly identifyabove
viral cell background
punctate above cellwhile assessing
background
the intensity
while of the fluorescent
assessing intensity ofsignal across multiple
the fluorescent signalchannels. In this channels.
across multiple way, the Overlap
In this
Intensity
way, macro provides
the Overlap Intensityamacro
basic readout
providesofa overlapping
basic readoutsignal intensity. signal intensity.
of overlapping
Schematicof
Figure1.1.Schematic
Figure ofdual-labelled
dual-labelledHIV-1.
HIV-1.Dual-labelled
Dual-labelledvirus
virusused
usedin
inthe
thein
insitu
situuncoating
uncoatingassay
assay
can
can include
include various
various combinations
combinations of of fluorophore
fluorophore signal.
signal. Pre-fusion
Pre-fusionvirus
virusisis expected
expected toto appear
appear
dTomato-positive.
dTomato-positive.Post-fusion thethe
Post-fusion dTomato
dTomato signal is shed,
signal while
is shed, GFP GFP
while and Cy5
and signal remains.
Cy5 signal Loss
remains.
of capsid
Loss is identified
of capsid basedbased
is identified on GFP-positive but Cy5-negative
on GFP-positive punctate.
but Cy5-negative ImageImage
punctate. created with with
created Bio-
render.com.
Biorender.com.
The
TheOverlap
OverlapIntensity
Intensitymacromacrofunctions
functionsthrough
throughautomating
automatingGFP GFPdetection
detectionand andquan-
quan-
tification
tificationof ofmultiple
multiplefluorophores.
fluorophores. Data Dataanalysis
analysiscan caninclude
includeall allparameters
parametersfound foundwithin
within
ImageJ’s
ImageJ’ssuitesuiteofofmeasurements
measurementsthat thatpertain
pertain toto ROIs.
ROIs. Prior to use,
Prior thethe
to use, macro must
macro firstfirst
must be
installed by copying the Overlap_Intensity.ijm to the ImageJ Plugin
be installed by copying the Overlap_Intensity.ijm to the ImageJ Plugin folder. The macro folder. The macro will
then be found
will then be foundunderunderthe the
Plugins tab.tab.
Plugins Running
Running thethemacromacro will
willopen
openthe thesettings
settingsmenu.
menu.
Here,
Here,thethechannel
channelfor forparticle
particleanalysis
analysiscancan bebe selected,
selected, size size parameters
parameters set, set, channels
channels for for
measurement
measurementselected,selected,and andan anoptional
optionalprocessing
processingcheck checkcan canbebetoggled.
toggled.Importantly,
Importantly,the the
global
globalscale
scaleof of the
the images
images used used must
must bebe set
set in
in ImageJ
ImageJ for proper particle analysis. The The
macro
macro is is compatible
compatible with RGB RGB and andcomposite
compositeimages.
images.Images Imagescan canbebe analyzed
analyzed individu-
individually,
ally, or multiple
or multiple imagesimages
can becananalyzed
be analyzed at time
at one one timeusing using the batch
the batch process
process option.
option.
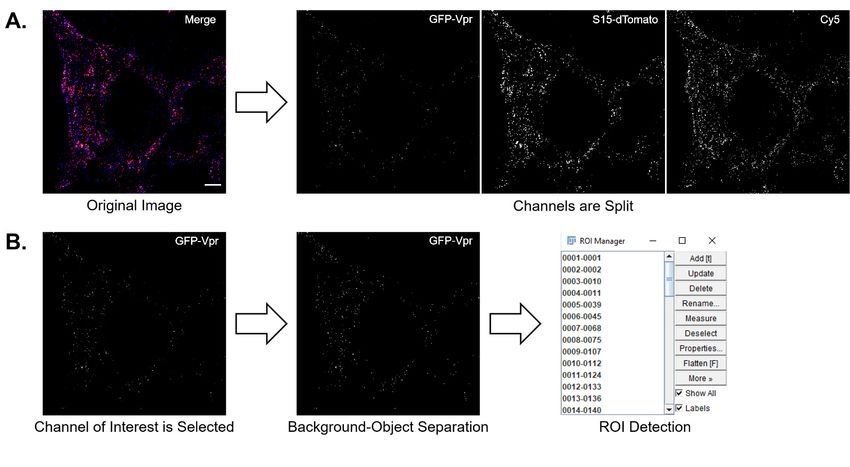
InInthe
themacro
macroworkflow,
workflow, fluorophores
fluorophores are are first
first separated
separated by by splitting
splitting anan image
image intointo
individualchannels
individual channelsthat thatrepresent
representeach eachsignal
signal(Figure
(Figure3A). 3A).WeWehave
haveprovided
providedthe theoption
option
toselect
to selectallallavailable
available channels
channels in in ImageJ,
ImageJ, which
which includes
includes green,
green, red, red,
blue,blue,
gray,gray,
cyan,cyan,
ma-
magenta,
genta, and and yellow.
yellow. Next,Next, a primary
a primary channel
channel is selected
is selected to identify
to identify ROIsundergo
ROIs and and undergo
auto-
auto-thresholding
thresholding in the
in the ROI ROI channel
channel using ausing a thresholding
thresholding algorithm. algorithm.
The macro Theallows
macrothresh-
allows
thresholding settings to be changed to any of the 16 methods
olding settings to be changed to any of the 16 methods included in ImageJ. To ensure included in ImageJ. To ensure
that
that background has been sufficiently removed during thresholding,
background has been sufficiently removed during thresholding, we included a process we included a process
checkoption.
check option.By Byselecting
selectingthe thecheck
checkoption
optionin inthe
thesettings
settingsmenu, menu,the the macro
macro willwill pause
pause
post-thresholding.This
post-thresholding. Thisstep
stepallows
allowsthresholded
thresholdedimages imagesto tobe
be viewed
viewed before
before continuing
continuing
withthe
with theanalysis.
analysis.For Forthetheininsitu
situuncoating
uncoatingassay,
assay,we weselected
selectedthe thegreen
greenchannel
channelfor forGFP-
GFP-
Vpr to identify ROIs (Figure 3B). The green channel then underwent
Vpr to identify ROIs (Figure 3B). The green channel then underwent auto-thresholding to auto-thresholding to
separate objects from background. In the work shown, a max
separate objects from background. In the work shown, a max entropy auto-threshold was entropy auto-threshold was
applied to all images. Successful separation of objects from background is dependent on
the signal difference between the background and punctate. As a result, the use of a max
entropy threshold may not be appropriate for all types of assays. The processed image then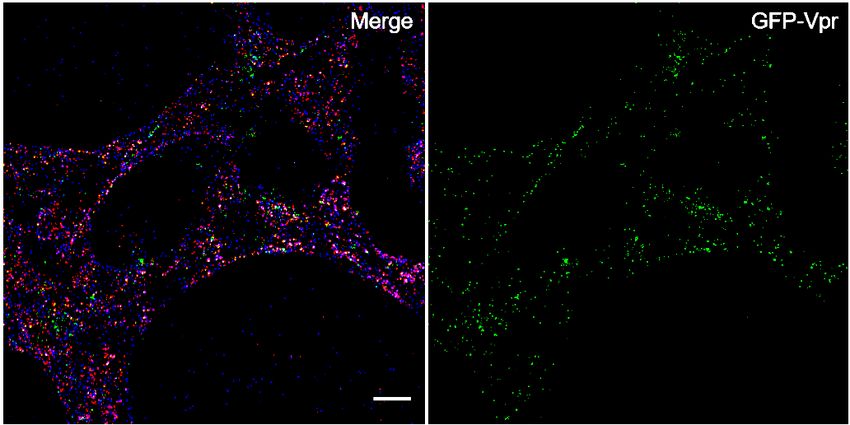
Viruses 2021, 13, x FOR PEER REVIEW 6 of 15
applied to all images. Successful separation of objects from background is dependent on
Viruses 2021, 13, 1604 6 of 15
the signal difference between the background and punctate. As a result, the use of a max
entropy threshold may not be appropriate for all types of assays. The processed image
then undergoes particle analysis with adjustable size parameters. Restrictions can be
placed on particle
undergoes detection limits by
analysis setting
with the maximum
adjustable and minimum
size parameters. size. can
Restrictions Additionally,
be placed on ob-
detection limits can
ject circularity by setting
be usedthe to maximum
gate objects and
in aminimum
range of 0.00size.toAdditionally,
1.00. For theobject
in situcircularity
uncoating
can be used
assay, to gate
particle objects
analysis in aset
was range of 0.00 to
to identify 1.00. For
objects the in 0.00
between situ uncoating
and 2.00 µm assay,
2 to particle
exclude
analysis was setcell to identify objects between 0.00 and 2 to exclude any remaining
any remaining background being identified as an2.00
ROI. µm With near pixel size punctate
cell
for background
all viral cores, being
the identified as an ROI.
object circularity wasWith near
set to pixel
0.00 size punctate
to 1.00. for all viral
The completion cores,
of particle
the objectresults
analysis circularity was set
in saving to 0.00
each to 1.00.
particle TheROI
as an completion
(Figure 3B).of particle analysis
By logging eachresults
ROI, thein
saving
location,each particle
shape, andassizean of
ROI (Figure 3B).
a particle By logging
is available. Thiseach ROI, the
maintains thelocation,
area in shape,
which andGFP
size
wasofdetected,
a particleallowing
is available. This maintains
for overlapping the area
signals in which
in other GFP was
channels detected,
to be allowing
measured. With
for
ROIsoverlapping
recorded, signals
the macro in other
then channels
overlays each to be ROI
measured.
onto the With ROIs recorded,
channels chosen forthe macro
measure-
then
mentoverlays
(Figure each
3C). In ROItheonto the channels
in situ uncoatingchosenassay, for measurement
dTomato signal is(Figure 3C).in
identified Inthe
the red
in
situ uncoating assay, dTomato signal is identified in the red channel
channel as the fusion marker. A pseudocolored Cy5 shown in blue represents capsid pres- as the fusion marker.
Aence.
pseudocolored
Each parameter Cy5 shown
selected inisblue
thenrepresents
measuredcapsid presence.within
and presented Each parameter selected
a results table (Fig-
isure
then measured
3C). Results and presented
for each channel within a results
are listed as table (Figure
the color name3C).toResults for each
differentiate channela
between
are listed as themeasurement.
multichannel color name toIn differentiate
the contextbetweenof the inasitumultichannel
uncoatingmeasurement.
assay, the maximumIn the
context of the in situ uncoating assay, the maximum signal
signal intensity associated with the ROI is quantified. The maximum signal intensityintensity associated with theis
ROI is quantified. The maximum signal intensity is preferred over total
preferred over total or average intensity as this measure is independent of the size of the or average intensity
as thisData
ROI. measure is independent
for each ROI were of thentheexported
size of thetoROI. Data for
Microsoft eachfor
Excel ROI were then exported
calculations based on
to Microsoft Excel for
dTomato and Cy5 intensity. calculations based on dTomato and Cy5 intensity.
Figure 2. Representative image of the in situ uncoating assay. CHME3 cells were infected with dual-
Figure 2. Representative image of the in situ uncoating assay. CHME3 cells were infected with
labelled VSV g HIV-GFP before fixing and imaging. GFP signal is represented in the green channel.
dual-labelled VSV g HIV-GFP before fixing and imaging. GFP signal is represented in the green
The dTomato fusion marker is shown in red. Antibody capsid stain is visible in the blue channel
channel. The dTomato
representing fusion marker
a pseudocolored is shown
Cy5 signal. The in red.scale
white Antibody
bar incapsid stainpanel
the Merge is visible in theImage
is 10µm. blue
channel representing
brightness a pseudocolored
has been enhanced Cy5
for signal signal. The white scale bar in the Merge panel is 10 µm.
visibility.
Image brightness has been enhanced for signal visibility.Viruses 2021,
Viruses 13, x1604
2021, 13, FOR PEER REVIEW 7 7ofof15
15
Figure 3.
Figure Macro workflow.
3. Macro workflow. (A)
(A) A
A background
background adjusted
adjustedmulticolor
multicolorimage
imageisissplit
splitinto
intoindividual
individualchannels,
channels,each
eachrepresenting
represent-
a single
ing fluorescent
a single signal.
fluorescent In this
signal. example,
In this example, green, red,red,
green, andand
blueblue
correspond
correspondto GFP, dTomato,
to GFP, andand
dTomato, Cy5,Cy5,
respectively. The
respectively.
The white
white scalescale barthe
bar in in Merge
the Merge panel
panel is 10isµm.
10 µm. Image
Image brightness
brightness hashas been
been enhanced
enhanced for for signal
signal visibility.
visibility. (B)(B)
TheThe channel
channel for
for particle
particle location
location is selected
is selected andand undergoes
undergoes auto-thresholding.
auto-thresholding. Remaining
Remaining objects
objects are identified
are identified andand stored
stored as ROIs.
as ROIs. (C)
(C) The
The stored
stored ROIsROIs are overlaid
are overlaid ontounadjusted
onto the the unadjusted bluered
blue and and red channels
channels before measuring
before measuring each ROIeach ROI individually.
individually. Data canData
then
can then be exported to a separate software for
be exported to a separate software for further analysis.further analysis.
3.2.
3.2.Validation
Validation
To
To ensure
ensure that
that the
themacro
macro properly
properly identifies
identifies virus
virus based
based on on GFP
GFPsignal,
signal,wewecompared
compared
our
ourmacro
macroagainst
againsttwo twomanual
manualcounters
counters using
usinga dilution
a dilution series of virus.
series Dual-labelled
of virus. Dual-labelledvi-
rus
virus was adhered onto glass coverslips at 1/10th, 1/20th, 1/30th, and 1/40th dilutions in
was adhered onto glass coverslips at 1/10th, 1/20th, 1/30th, and 1/40th dilutions in
media.
media.AllAllcoverslips
coverslipsunderwent
underwentthe thesame
sameinfection
infectionand
andCA CAantibody
antibody staining
staining conditions
conditions
used
used inin the
the in
in situ
situ uncoating
uncoating assay.
assay. Ten
Ten images
images were
were captured
captured per per dilution
dilution toto ensure
ensure aa
sufficient
sufficient amount
amount of of virus
virus for
for counting
counting comparison.
comparison. GFP GFP punctate
punctate was
was then
then manually
manually
counted
countedby by two
two independent
independent counters.
counters. Images
Imageswere were auto-thresholded
auto-thresholdedbefore before ROIs
ROIs were
were
manually
manuallydrawn drawn over
over each
each image
image andand counted.
counted. The The Overlap
Overlap Intensity
Intensity macro
macro waswas then
then
used
used toto quantify
quantifytotal
total number
numberof of GFP
GFP signal
signalandand compared
comparedagainst
againstthe
themanual
manualcounts.
counts.
Total
Total counts
counts perper dilution
dilutionwere
wereplotted
plottedwith
withaaline
lineofofbest
bestfit
fitfor
foreach
eachmethod
method(Figure
(Figure4A).
4A).
We
We found
found manual
manual and and automatic
automatic counting
counting methods
methodswere were inin high
high agreement
agreement with
with aa near
near
identicalcount
identical countatatallall dilutions.
dilutions. Furthermore,
Furthermore, eacheach trendline
trendline closely
closely overlapped
overlapped with with
a neara
near
1.0 R21.0
valueR2 value indicating
indicating the expected
the expected correlation
correlation between between virus dilution
virus dilution and count.
and count. VirusViruses 2021,
Viruses 2021,13,
13,1604
x FOR PEER REVIEW 88 of 15
of 15
on glass experiments typically have a low and uniform level of background, which would
Virus on glass experiments typically have a low and uniform level of background, which
make identifying virus easier. However, in the in situ uncoating assay, virus must be iden-
would make identifying virus easier. However, in the in situ uncoating assay, virus must be
tified on a background of adherent cells. Therefore, we repeated the same validation assay
identified on a background of adherent cells. Therefore, we repeated the same validation
but applied the dilution series of virus to CHME3 cells adhered to glass coverslips. Similar
assay but applied the dilution series of virus to CHME3 cells adhered to glass coverslips.
to the previous validation assay, there was high agreement in virus count at each dilution
Similar to the previous validation assay, there was high agreement in virus count at each
between the manual counters and the Overlap Intensity macro (Figure 4B).
dilution between the manual counters and the Overlap Intensity macro (Figure 4B).
Figure 4. Virus identification comparison between manual counting and the Overlap Intensity macro.
Figure 4. Virus identification comparison between manual counting and the Overlap Intensity
Dual-labelled virus signal at 1/10th, 1/20th, 1/30th, and 1/40th dilutions was adhered to glass (A) or
macro. Dual-labelled virus signal at 1/10th, 1/20th, 1/30th, and 1/40th dilutions was adhered to glass
added to CHME3 cells plated on glass coverslips (B) and imaged for GFP. Ten images were taken per
(A) or added to CHME3 cells plated on glass coverslips (B) and imaged for GFP. Ten images were
dilution.
taken perTwo independent
dilution. counters manually
Two independent countersidentified
manuallyROIs for allROIs
identified dilutions.
for allThe OverlapThe
dilutions. Intensity
Over-
macro was used
lap Intensity to assess
macro eachtodilution.
was used A line-of-best
assess each dilution. Afit was generated
line-of-best fit wasfor the manual
generated for counts and
the manual
compared
counts andtocompared
GFP countsto from the automatic
GFP counts from themethod. Representative
automatic experiments are
method. Representative shown. are
experiments
shown.
3.3. Application
3.3. Application
The in situ uncoating assay is used to assess the progression of HIV-1 uncoating. A
The in situ
requirement uncoating
within the assay assay is used
is the to assess the
dual-labelling progression
of HIV-1 of HIV-1 uncoating.
with S15-dTomato and GFP- A
requirement
Vpr. Suboptimal within the assaylabelling
fluorescent is the dual-labelling
or CA staining of HIV-1 with S15-dTomato
can interfere with resultsand fromGFP- the
Vpr. Suboptimal
assay, so virus is fluorescent
first validated labelling or CA staining
for fluorescent can interfere
labelling. with results levels
To limit background from the of
assay, sovirus
unfused virusthat
is first
couldvalidated
obscurefor fluorescent
results, labelling.
each stock Tomust
of virus limithave
background levels of
80% or higher of
unfused viruscores
GFP-positive that that
couldareobscure
co-labelledresults,
witheach stock of virus
S15-dTomato. must have
Following 80% or
antibody higherfor
staining of
CA, all GFP-positive
GFP-positive cores that cores
aremust show 50%
co-labelled withor S15-dTomato.
higher Cy5 signal. Viral stocks
Following are deemed
antibody staining
unusable
for CA, all if either parameter
GFP-positive cores is not
mustmet. showTo 50%
validate our virus
or higher Cy5stock,
signal.weViral
adhered
stocks virus
are
directly
deemedonto glass.ifSamples
unusable then underwent
either parameter spinoculation
is not met. To validate andour antibody staining
virus stock, weto mimic
adhered
the in directly
virus situ uncoating assay.
onto glass. Imagesthen
Samples wereunderwent
then passed through the and
spinoculation Overlap Intensity
antibody macro
staining to
to determine
mimic labelling
the in situ percentages.
uncoating GFP-positive
assay. Images were then virus was found
passed through to the
have 82.1% dTomato
Overlap Intensity
labelling
macro towith 62.6% positive
determine labellingfor Cy5 (FigureGFP-positive
percentages. 5A). Therefore, thiswas
virus virusfound
stock to
demonstrated
have 82.1%
sufficient
dTomato labelling with 62.6% positive for Cy5 (Figure 5A). Therefore, this virusinstock
labelling for use in the in situ uncoating assay. All experiments shown this
work utilized this verified stock of virus.
demonstrated sufficient labelling for use in the in situ uncoating assay. All experiments
shown In in
developing
this workthe Overlap
utilized thisIntensity
verifiedmacro,
stock ofour goal was to reduce the time of analysis
virus.
in theInindeveloping
situ uncoating assay while
the Overlap maintaining
Intensity macro, our accurate quantification.
goal was to reduce the Totime
ensure that
of anal-
the
ysismacro
in the properly detects GFP
in situ uncoating assay punctate and can measure
while maintaining accurateassociated CA signal,
quantification. in situ
To ensure
uncoating
that the macroassays were carried
properly detectsout GFP [8,19]. CHME3
punctate andcells were infected
can measure with dual-labelled
associated CA signal, in
HIV-1
situ uncoating assays were carried out [8,19]. CHME3 cells were infectedunderwent
and fixed at 0, 1, 2, 3, and 4 h post-infection. Mock infected cells with dual-la- an
identical procedure allowing cell background levels for GFP and dTomato
belled HIV-1 and fixed at 0, 1, 2, 3, and 4 h post-infection. Mock infected cells underwent to be thresholded
post-imaging. A secondary
an identical procedure antibody
allowing only
cell control waslevels
background included allowing
for GFP andCy5 background
dTomato to be
to be detected while ensuring specific antibody staining. To assess
thresholded post-imaging. A secondary antibody only control was included allowing Cy5 dTomato labelling, one
coverslip of cells was infected under constant Bafilomycin A (BafA)
background to be detected while ensuring specific antibody staining. To assess dTomato treatment before fixing
the cells atone
labelling, 4 h coverslip
post-infection. BafA
of cells was is infected
a V-ATPaseunderinhibitor thatBafilomycin
constant prevents endosomal
A (BafA)fusion
treat-
of VSV g HIV-GFP [42,43]. The BafA-infected cells should maintain a high percentage
ment before fixing the cells at 4 h post-infection. BafA is a V-ATPase inhibitor that
of dTomato-positive virus due to inhibited fusion. Similarly, the 0 h condition shouldViruses 2021, 13, x FOR PEER REVIEW 9 of 15
Viruses 2021, 13, 1604 9 of 15
prevents endosomal fusion of VSV g HIV-GFP [42,43]. The BafA-infected cells should
maintain a high percentage of dTomato-positive virus due to inhibited fusion. Similarly,
indicate
the a low level
0 h condition of fusion
should indicatedue to immediate
a low fixation.
level of fusion The
due to BafA andfixation.
immediate 0 h conditions
The BafAare
also0 expected
and to represent
h conditions the maximum
are also expected capsidthe
to represent signal with uncoating
maximum unlikely
capsid signal prior to
with uncoat-
fusion.
ing Following
unlikely imaging
prior to fusion.of the fixed imaging
Following coverslips,
of images were
the fixed analyzedimages
coverslips, with the Overlap
were ana-
Intensity macro. GFP signal was identified as ROIs before measuring red and
lyzed with the Overlap Intensity macro. GFP signal was identified as ROIs before meas- blue channels
for maximum
uring dTomato
red and blue and Cy5
channels signal. ThedTomato
for maximum GFP signal was
and size
Cy5 restricted
signal. to 0.0signal
The GFP µm2
to 2.0 was
in size
size to exclude
restricted to 0.0any remaining
to 2.0 cell background.
um in size
2 to exclude any remaining cell background.
Analysisofofininsitu
Figure5.5.Analysis
Figure situuncoating
uncoatingassay
assaydata.
data.The
Thevalidation
validationofofvirus
viruslabelling
labellingand
andininsitu
situuncoating
uncoatingassay
assaywas
wascarried
carried
out
outand
and analyzed using
usingthe theOverlap
OverlapIntensity
Intensity macro.
macro. (A)(A) Dual-labelled
Dual-labelled virus
virus was was adhered
adhered to and
to glass glassimaged.
and imaged. GFP-
GFP-positive
positive cores
cores were were identified
identified by the macroby the macro
before before measuring
measuring each ROI foreach ROI forand
dTomato dTomato and The
Cy5 signal. Cy5 percentage
signal. Theofpercentage
dTomato andof
dTomato and Cy5-positive cores was calculated based on the total number of GFP-positive cores. (B)
Cy5-positive cores was calculated based on the total number of GFP-positive cores. (B) Total percentage of Cy5-positive Total percentage of
Cy5-positive viral punctate was determined for 0, 1, 2, 3, and 4 h post-infection. Percentage was determined based on the
viral punctate was determined for 0, 1, 2, 3, and 4 h post-infection. Percentage was determined based on the total number of
total number of fused GFP punctate with detectable Cy5 signal compared to total number of fused GFP punctate. Shown
fused GFP punctate with detectable Cy5 signal compared to total number of fused GFP punctate. Shown is an average of
is an average of two independent experiments with error bars denoting standard error. (C) All fused GFP-positive cores
two independent
were quantified forexperiments
Cy5 signal and with error bars
plotted denoting standard
as a scatterplot. error.
Cy5 signal was(C) All fused
assessed andGFP-positive cores
plotted for all were
fused andquantified
unfused
cores for the BafA control and 0 h time point. The red bar represents the mean of the maximum Cy5 intensitycores
for Cy5 signal and plotted as a scatterplot. Cy5 signal was assessed and plotted for all fused and unfused for the
associated
with each viral core. Viral core counts are represented above each column. Data from two independent experiments viral
BafA control and 0 h time point. The red bar represents the mean of the maximum Cy5 intensity associated with each are
core. Viral
shown. core percentage
(D) The counts are represented
of fused cores above
was each column.
calculated Data
based onfrom two independent
the number experimentscores
of dTomato-negative are shown.
divided(D) The
by the
total viral core count. Shown is an average of two independent experiments with error bars denoting
percentage of fused cores was calculated based on the number of dTomato-negative cores divided by the total viral core standard error.
count. Shown is an average of two independent experiments with error bars denoting standard error.
Data from the in situ uncoating assay can be plotted in several ways. When plotting
these Data
data asfrom
thethe in situofuncoating
percent CA-positiveassay canall
virus, be fused
plotted in several
cores ways. When
with detectable Cy5plotting
signal
these
are data as theaspercent
categorized coatedof CA-positive
(Figure virus, allThe
5B; [8,11,19]). fused cores
total withcount
fused detectable
is thenCy5 signal
used are
to de-
categorized
termine whataspercentage
coated (Figure 5B; [8,11,19]).
of virus The total
has detectable fusedatcount
capsid eachistime
then point.
used toThe
determine
BafA-
what percentage
treated cells and 0of
h virus has detectable
time point capsid at
are not expected toeach
havetime point. The
substantial BafA-treated
fusion cells
and therefore
and 0 h time point are not expected to have substantial fusion and therefore
were analyzed for all cores regardless of fusion state. The percentage of coated virus was were analyzed
for allto
found cores regardless
decrease with of fusion
time state.
(Figure The
5B). percentage
The 0 and 1 hoftimepoints
coated virus was foundthe
represented to decrease
highest
with time (Figure 5B). The 0 and 1 h timepoints represented the highest coated percentagesViruses 2021, 13, 1604 10 of 15
at 79.8% and 68.8% (Table 1). Beyond 1 h post-infection, the percentage of coated virus
decreased at 2 h post-infection before leveling off for the remainder of the time course.
A slight increase in coated virus was detected at 4 h post-infection at 31.1%. The loss
of coated particles over time suggests progressive uncoating as expected from previous
studies [8,11,19].
Table 1. In situ uncoating data from two independent experiments.
Time of Fix Average % of Mean Max Cy5 Average % of
Count
Post-Infection (h) CA-Positive Virus Intensity Fusion
BafA 2028 61.6 46.9 16.3
0 770 79.8 60.5 16.3
1 409 68.8 18.4 33.9
2 114 32.8 8.9 18.1
3 67 24.3 3.5 19.1
4 268 31.1 8.5 27.5
Alternatively, the maximum Cy5 signal from each virus can be plotted on a column
scatter plot with a calculated mean (Figure 5C; [14,29]). By accounting for the Cy5 intensity
of each viral core, sensitivity to changes in capsid association are improved. While the
percentage of CA-positive virus provides insight, the use of mean maximum intensity can
identify subtler changes in uncoating. The BafA and 0 h time point were found to have
the highest Cy5 intensities at 46.9 and 60.5, respectively (Figure 5C; Table 1). As infection
progressed, the average Cy5 intensity decreased from 0 to 3 h post-infection (Figure 5C;
Table 1). The decrease in mean maximum intensity suggests that viral cores are uncoating
over time. In addition, the total number of fused cores detected during imaging decreased
with time, which has been previously observed (Figure 5C; Table 1; [8,32]).
Finally, to ensure that variable viral fusion at each time point does not bias these data,
the percentage of viral fusion was calculated as the number of dTomato-negative cores
divided by the total number of GFP -positive signals (Figure 5D; Table 1). For the BafA
and 0 h time point conditions, the extent of viral fusion was 16.3%. We anticipated viral
fusion to be less than 20% for both conditions, which was observed. For the remaining
time points, the fusion percentages spanned from 18.1% to 33.9%, which is consistent with
previous studies (Figure 5D; Table 1; [14,29]).
4. Discussion
The in situ uncoating assay is a well-established assay and has been extensively
used to study HIV-1 uncoating. Unlike other fluorescence microscopy-based uncoating
assays, this assay does not require live cell imaging capabilities. The fixed cell approach
of the assay maintains a high amount of virus for quantification, providing a readout of
capsid state. However, without semi-automated analysis, throughput remains low. Proper
quantification of data first requires identification of ROIs followed by the measurement
of overlapping signal intensities across multiple channels. While previous publications
have utilized semi-automated approaches, these protocols are not freely available or rely
on commercial software [14,29]. Importantly, this analysis is distinct from measuring
colocalization and requires a specific workflow not found in imaging software. Therefore,
we have developed the Overlap Intensity macro for analysis of the in situ uncoating assay
for ImageJ.
During quantification, the primary factor that contributes to the time of analysis is the
detection of each fluorophore above background fluorescence. Manual sorting methods
prove time consuming and are further complicated by weak fluorophore signal. In instances
where dTomato or Cy5 signal is faint, viral cores may be incorrectly categorized as fused
or uncoated by manual inspection. GFP punctate may also be incorrectly excluded due
to low signal intensities. To remove the bias introduced by visual sorting, the Overlap
Intensity macro automates the detection of ROIs and signal intensities. We were able toViruses 2021, 13, 1604 11 of 15
demonstrate the high accuracy of the macro in GFP detection by comparing ROI counts to
a manual approach, both when virus was adhered to glass and bound to cells (Figure 4).
There was more variation in the validation assay conducted on cells, which can be seen in
the wider spread of points between the manual counters and the macro and the lower R2
values (Figure 4B), compared to the assay on glass (Figure 4A). This result is likely due to
the increased and non-uniform background fluorescence associated with cells. At all virus
dilutions, the semi-automated method for GFP detection was highly similar to the manual
counts, indicating comparable accuracy, but by automating the detection process, we have
drastically improved time of analysis.
Next, we utilized the macro to successfully assess the in situ uncoating assay. Over
time, viral cores will uncoat, resulting in a decrease or loss of Cy5 signal. In agreement
with previous work, we found a progressive loss of HIV-1 capsid under two quantifications
(Figure 5B,C; Table 1; [8,11,14,19,29]). When quantifying the percent of CA-positive virus,
a small amount of uncoating was found between the 0 and 1 h timepoints. After 1 h
post-infection, virus rapidly uncoated to less than 40% for the remainder of the time
course (Figure 5B). Analyzing the same data by maximum Cy5 intensity indicated a similar
loss of CA with time (Figure 5C). However, the mean maximum Cy5 intensity decreased
more substantially from 0 to 1 h post-infection. This loss of Cy5 signal indicates that
uncoating was detectable shortly after viral fusion. The early detection of uncoating
shown through Cy5 signal is likely a result of improved sensitivity. By categorizing
virus as simply CA-positive or -negative, differences in CA amounts are lost. In recent
years, quantification of these subtle changes has become increasingly important given
studies showing evidence of biphasic uncoating, uncoating at the nuclear pore, and nuclear
uncoating [6,16,20,23,25,44]. If the imaging system used is appropriately sensitive, the
mean maximum intensity provides a better readout of capsid state. In addition, comparing
the maximum intensity between time points within an experiment minimizes the effect of
suboptimal capsid staining. For this reason, recent studies using the in situ uncoating assay
quantify and compare the maximum intensity over time or among different conditions. For
example, this method has been used to demonstrate the impact of several cellular proteins
involved in cellular trafficking and nuclear import on uncoating [14,29,31–34]. Despite
differences between both methods of analysis, these data demonstrate the Overlap Intensity
macro’s ability to detect uncoating. The CA antibody 241-D was used for these experiments,
which has been previously used in live and fixed cell imaging experiments [24]. While it is
possible that the accessibility of the epitope recognized by this antibody may vary over
time, these results are consistent with previous in situ uncoating assays using different
antibodies to detect CA [8,11,14,19,29,31].
Beyond the loss of Cy5 signal, various controls must be considered. During early
replication, viral fusion precedes uncoating. The in situ uncoating assay typically utilizes
VSV g pseudotyped virus so that viral fusion can be synchronized by spinoculation and
temperature shift. VSV g-mediated viral fusion occurs by endocytosis, which is different
from the canonical entry pathway mediated by HIV-1 Env at the cell membrane. The
kinetics of viral fusion from these two methods have been shown to be different, with
Env-mediated viral fusion having an increased half-life [8]. However, the method of
viral fusion did not impact uncoating kinetics once the different kinetics of viral fusion
were taken into account [8]. In the in situ uncoating assay, viral fusion is measured
by the loss of dTomato signal and only fused virions are assessed for uncoating. To
limit the number of unlabelled virions that could obscure results, dual-labelled virus
stocks must first be verified for dTomato labelling of 80% or more before use. Labelling
verification includes the detergent-based permeabilization step that reduces the native
dTomato labelling during antibody staining. The virus stock used in this work was verified
for proper labelling prior to use (Figure 5A). However, due to the importance of the
dTomato label, reassessment of the BafA and 0 h condition is necessary within each
experiment. The loss of dTomato signal in less than 20% of detectable cores therefore
confirms proper labelling and further strengthens data. Differences in the percentage ofViruses 2021, 13, 1604 12 of 15
fused virus could bias the uncoating data by increasing or decreasing the number of fused
cores. Therefore, fusion was tracked by calculating the percent of dTomato-negative cores
relative to the total count. While incomplete dTomato labelling and low signal above
background contribute to some variation, fusion should remain consistent. We were able to
show an acceptable range for percentage of fused virus. The lowest fusion rate was found
to be 16.3% with peak fusion at 33.9% (Figure 5D; Table 1). The range of fusion over time
was 17.6% with an average of 21.9% fused cores. Previous work has shown fusion with
percentages ranging less than 20% [11,14,19,45]. The low variation of fusion suggests that
these differences do not substantially impact our analysis of uncoating. Within these data,
we also observed that less than 20% of total cores were fused for the 0 h post-infection and
BafA treatment conditions (Figure 5D; Table 1).
Previous use of the in situ uncoating assay has reported a progressive loss of fused
viral cores, distinguished as fewer GFP-positive cores over time [8,32]. Here, we were also
able to observe a decrease in the number of fused viral cores (Figure 5C; Table 1). This
loss may be explained by the dissociation of GFP-Vpr from the viral core during viral
replication. Vpr is shed from coated and uncoated RTCs following fusion, which may
further reduce GFP punctate to background levels [46]. Some studies have found that Vpr
assists in the nuclear import of the pre-integration complex (PIC) and can localize to the
nucleus [47–49]. Once nuclear, Vpr may dissociate from the PIC leading to a decreased
number of GFP labelled viral cores at later time points. In this study, we were unable to
differentiate between cytoplasmic and nuclear GFP labelled viral cores due to the absence
of a nuclear envelope marker. Another explanation for the loss of GFP-positive viral
cores may be proteasomal degradation of exposed RTCs. Prior to uncoating, the capsid
protects the internal RTC from detection and degradation [4,6,50,51]. Uncoated cores
are then susceptible to host restriction factors or cell degradation pathways, resulting in
the decreased number of fused viral cores at later time points. An alternative to GFP-
Vpr is GFP-tagged integrase (IN-GFP), which remains with the PIC following nuclear
import [6,26]. However, loss of GFP signal can occur from proteasomal degradation of
IN-GFP and the integration of the viral genome [6,52]. Despite the cause of decreasing
GFP-Vpr, the Overlap Intensity macro was able to detect this previously reported trend.
While we have shown our macro to be accurate with improved time of analysis, any
automated process has caveats. The macro workflow by default utilizes a max entropy
auto-threshold to segment images. The use of a max entropy threshold may not properly
separate objects from the background for all images. Depending on the background and
object intensity, artifacts may be included or objects lost. To accommodate other uses, we
have included the option to select from the 16 included thresholding algorithms in ImageJ.
Furthermore, to detect improper image segmentation, we have included the option to check
an image immediately after thresholding. In doing so, the user can choose to terminate
the process if an image does not appear properly segmented. Another consideration
is that the particle identification relies on the size of the primary fluorophore. If the
secondary fluorophores, dTomato and Cy5, encompass a larger area than GFP, then the
non-overlapping areas are not quantified. This results in some loss of information about
each particle and represents a potential weakness of the macro. However, in maintaining a
stricter ROI, the potential overlap of adjacent virus is excluded. In addition, quantifying
the maximum intensity of Cy5 fluorescence rather than total intensity minimizes the effect
of this weakness. Finally, the macro is capable of quantifying intensity from overlapping
signals but is not capable of colocalization analysis. However, various plugins are available
for use in ImageJ or FIJI to assess colocalization.
In designing this macro, the primary goal was the analysis of the in situ uncoating
assay. However, we have included adjustable settings that allow for use outside of the
uncoating assay. For example, the HIV viral core has been shown to associate with cellular
proteins involved in microtubule trafficking and nuclear import [53]. The Overlap Intensity
macro could be used to assess the amount of a cellular protein associated with the viral
core at different time points or under different cellular conditions. We have shown signalYou can also read