Optimization of a Supply Chain : Christian Dior Couture - Audrey Darmon
←
→
Page content transcription
If your browser does not render page correctly, please read the page content below
Optimization of a Supply Chain :
          Christian Dior Couture

                   Audrey Darmon

                         Degree project in
                                      ICS
                             Master thesis
                   Stockholm, Sweden 2013

                      XR-EE-ICS 2013:019
Abstract
Nowadays, all the enterprises in the fashion industry face the prob-
lem of variability of supply and demand. Working in fashion implies
facing rapid changes, and the success or failure of a company is of-
ten determined by the company's ability to adapt and respond quickly
to these changes. In addition to having to deal with large quantities
of information, the companies must ensure the availability of all their
products, in all the stores worldwide, while optimizing inventory levels.
This research will focus on Christian Dior Couture and more speci
-
cally on the Eyewear.
The immediate objective of this research project is to optimize the in-
ventory while maintaining the sales.
The information on stock out rates crossed with the sales quantity,
the stock and the coverage enables supply chain's managers to make
decisions at a store level and at a reference level to reduce the stock
at its optimal value without compromising the sales' level. In the fu-
ture, further studies could be made to try and optimise the reordered
quantities in addition to optimizing the current stores' stock.
Keywords:
Fashion industry, Variability, Supply and Demand, Inventory Levels,
Christian Dior Couture, Accessories, Eyewear
Abbreviations:
CDC : Christian Dior Couture
SCM : Supply Chain Management
POS : Point of Sales
RTW : Ready-to-Wear
TBR : To-be-received
SKU : Stock-Keeping Unit
1Contents
1 Introduction 3
1.1 Background . . . . . . . . . . . . . . . . . . . . . . . . . 3
1.1.1 What is the purpose of a Supply Chain? . . . . . 3
1.1.2 Why is the SCM necessary ? . . . . . . . . . . . 4
1.1.3 The luxury industry confronted with the demands
of Retail Management. . . . . . . . . . . . . . . . 4
1.1.4 Logistics in the fashion industry : what are the
particularities and the speci
cities? . . . . . . . . 5
1.1.5 What distinguishes the luxury industry from other
fashion industry ? . . . . . . . . . . . . . . . . . 6
1.1.6 Dior : ambassador of French Luxury . . . . . . . 7
1.2 Purpose . . . . . . . . . . . . . . . . . . . . . . . . . . . 7
2 Related work 8
2.1 Supply Chain Management : previous research and theory 8
2.2 Other previous research linked to the SCM . . . . . . . 9
2.2.1 Related work in the
eld of Logistics . . . . . . . 9
2.2.2 Related work on the Fashion Industry . . . . . . 9
3 Method 10
3.1 Case Study . . . . . . . . . . . . . . . . . . . . . . . . . 10
3.2 Analysis method . . . . . . . . . . . . . . . . . . . . . . 12
3.2.1 De
nitions . . . . . . . . . . . . . . . . . . . . . 13
3.2.2 Step 1 . . . . . . . . . . . . . . . . . . . . . . . . 14
3.2.3 Step 2 . . . . . . . . . . . . . . . . . . . . . . . . 15
3.2.4 Step 3 . . . . . . . . . . . . . . . . . . . . . . . . 16
4 Results 18
4.1 Data Collection . . . . . . . . . . . . . . . . . . . . . . . 18
4.1.1 Newness . . . . . . . . . . . . . . . . . . . . . . . 18
4.1.2 Carry Over References . . . . . . . . . . . . . . . 18
4.2 Data Analysis . . . . . . . . . . . . . . . . . . . . . . . . 18
4.2.1 SKU analysis . . . . . . . . . . . . . . . . . . . . 19
4.2.2 Store analysis . . . . . . . . . . . . . . . . . . . . 20
4.2.3 Process . . . . . . . . . . . . . . . . . . . . . . . 21
5 Validity, Reliability 22
5.1 Validity . . . . . . . . . . . . . . . . . . . . . . . . . . . 22
5.1.1 Internal Validity . . . . . . . . . . . . . . . . . . 22
5.1.2 External Validity . . . . . . . . . . . . . . . . . . 22
5.2 Reliability . . . . . . . . . . . . . . . . . . . . . . . . . . 22
6 Discussion 23
7 Conclusion 26
7.1 Conclusions . . . . . . . . . . . . . . . . . . . . . . . . . 26
7.2 Future work . . . . . . . . . . . . . . . . . . . . . . . . . 27
21 Introduction
This section pictures an introduction to the project by presenting the
Supply Chain, logistics in the luxury industry and the company: Chris-
tian Dior Couture. The research questions, purpose and goals behind
the project will also be presented.
1.1 Background
1.1.1 What is the purpose of a Supply Chain?
What is called Supply Chain is the group of people, enterprises and
organization which participate in providing a service or delivering a
product from a supplier to a customer [1].
The Supply Chain Management (SCM) is dierent from pure logistics
in that it is primarily a form of knowledge used to design at the same
time an operational and optimal management. This management in-
cludes the design of both the best sequence of tasks possible (depicted
by the term chain) and the well-functioning of the logistics system,
as set in the speci
cations.
Thus, the supply chain supports the overall management of material
ows (or goods). To do this, it directly manages the concerned activi-
ties, or in any case is likely to ensure close cooperation with stakehold-
ers or relevant third, in order to control / manage
ows and stocks of
nished products, ongoing products, semi-
nished products, raw ma-
terials involved [2] ... but also:
• resources (internal human resources or external service providers:
suppliers, storage, warehousing, transportation, freight, ...).
• the equipment necessary for the realization of logistics services
(warehousing, tools, machines, material handling, clean vehicles,
...).
• supplies (packaging, consumables, energy and fuel sources ...).
• services (planning, warehousing, packaging, handling, transport,
export, customs, billing ...).
• information systems.
In some activities, the pro
ciency of logistics can establish a com-
petitive advantage against the competitors on the market with the key
opportunity to increase sales and/or market share and to improve or
defend the pro
t margin of the company.
When you
rst put in place a Supply Chain department in a com-
pany in which stock is involved, you
nd out that, from the start,
stock has been continuously sent to the dierent point of sales but it
has never been controlled.
During this internship, my main role will be to build a rotation of
the global stocks while maintaining the sales to prevent unsold pieces
to keep piling up and never disappear. At the same time it will be of
the utmost importance to make sure that none of the stores lack any
3of the best seller pieces or any newness while decreasing the stock on
old collections' references.
This double-challenge is the key for a well-oiled Supply Chain in
the fashion industry.
1.1.2 Why is the SCM necessary ?
The SCM is the most essential department of a company since it man-
ages the "operational e
ciency". [25] The Supply Chain Management
can be applied to numerous factors, but it becomes critical when it
comes to the company's success and the customers' satisfaction.
Indeed the SCM helps improving the customer service by ensuring that
the right assortment of products, as well as the right amount of it, are
delivered on time. It must also make sure that these pieces end up in
the right location according to the customers' preferences.
The SCM should also provide a quality after-sale support to the cus-
tomers and a customized approach depending on the product itself. [26]
The Supply Chain's role is to globally apprehend the whereabouts
of the products inside the distribution network. The SCM handles the
ow of products by forecasting the sales and controlling the movements
of stocks. It is basically the essential intermediate between the "up-
hill departments" (design, marketing, production) and the "downhill
department" (the stores) without for all that meddeling in the other
departments' areas of work. [27]
Its main purpose is to make coincide the oer and demand in order to
optimize the sales.
1.1.3 The luxury industry confronted with the demands
of Retail Management.
In terms of image and customer's satisfaction, it is imperative in the
luxury industry to provide an impeccable service. However, due to the
fact that the luxury industry has met a severe mutation in its distri-
bution mode in the past few years, most brands need to update their
supplying methods in order to being able to provide such a service.
In fact, in order to totally control their brand from the idea of
a product to the
nal customer, many companies have deserted the
traditional "indirect approach" (also called Wholesale) to create their
own store network (known as Retail). This type of distribution is the
natural evolution of any strong brand because, with this controlled
network of POS, the marketing side of the company can be fully mas-
tered, the independence of the company is reinforced, complete uni-
verses with guidelines stories can be created within the stores and, last
but not least, the pro
tability increases thanks to the growing margins
of costs. [27]
But to evolve from Wholesale to Retail is not an easy task. From
this point, the company is the only responsible for the product from
4its production until its eective sale. It has to handle the supplying of
the stores while avoiding stock-out situations as well as overstocks, it
has to decide on the most appropriate commercial choices adapting to
each POS and,
nally, with a growing number of stores, it has to take
in charge a genuine international network whose handling requires an
adequate organization.
In the Retail model, the stakes can be quali
ed as follow: "always have
the right product, in the right place and in the right quantities".
Far from being speci
c to the luxury industry, this Supply Chain
problematic is the same in a lot of dierent sectors whose experience
in the domain can be instructive. In particular, it is the case of the
ready-to-wear brands which, despite their dierences with the luxury
industry, present some interesting analogies. Indeed, since they were
confronted earlier to the stakes of Retail Management, they also had to
adapt and develop "Supply Chain guidelines". They actually were the
rst to do so and this is the reason why today they still have prevailing
positions in the market. [27]
1.1.4 Logistics in the fashion industry : what are the
particularities and the speci
cities?
The main challenges for the Supply Chain in the luxury industry are
as follow [5]:
• To adapt the logistics organization to the rapidly growing
internationalization of its activities. The dierent methods
chosen by the luxury companies show themselves more or less
able to handle a large-scale international expansion.
• To face the diversi
cation of products and brands. There
are an increasing number of references and fewer products for
each reference, and the Supply Chain must handle, at competitive
costs, products whose characteristics and marketing constraints
dier.
• To predict the market
uctuations for the sake of fash-
ion. There are 5 dierent collections throughout the year (Cruise,
Spring, Summer, Fall and Winter) so the available products change
all the time. We call this phenomenon the seasonality of the
products.
• To manage the constraints due to the multiplication of
distribution formats. Logistics must be able to handle dif-
ferent volumes of orders depending on the origin of the request
(initial orders, replenishment orders, clients' orders, . . . ).
• To optimize the inventory levels. Inventory management is
not just their systematic reduction but rather their optimization
by avoiding stock-outs, creating value with speculative stocks,
securing stocks and reducing the risk of depreciation.
5• To adapt to the problem of the accelerating time-to-
market (shortening of products' life cycle, frequent introductions
of new models, seasonality issues, . . . ).
• To handle the multiplication of distribution zones: there
are more and more stores in Asia, China and Eastern Europe !
These strategic challenges determine the choices which the logistics
organizations need to make in order to support and secure the devel-
opment of the company [5].
Addressing these challenges, logistics organizations dier greatly. De-
pending on the type of approach which the Supply Chain chooses, three
models of logistics organizations emerge [16]:
• The oensive (or proactive) model, making the Supply Chain a
vector of overall support for the deployment strategies.
• The pragmatic (or reactive) model in which the Supply Chain is
designed as a support function to be optimized. In this case, the
luxury companies recast their logistics to respond to key issues
in the sector.
• The traditional model, in which the Supply Chain process is lim-
ited to the optimization of one or more links in the value chain
without trying to optimize a whole. The approach is primarily a
logical improvement of existing processes.
The analysis of these models and their comparison enable us to
understand the logistics choices followed by luxury companies and to
assess in which way the Supply Chain is a key factor in improving the
performances of the company.
1.1.5 What distinguishes the luxury industry from other
fashion industry ?
Compared to the classical issues apprehended by the fashion industry,
the luxury industry has a few speci
cities of its own [27]:
• It needs to take into account the prospect of "VIP" customers
which inserts exceptions into the products' cycle. The luxury
industry involves custom-made pieces, full deposit sales, book-
ings,... It raises the issue of integrating these exceptions in the
most industrialized way possible in order not to disturb the SCM.
• Often used in the "upscale" industry, for high value products
and shallow depth of stock, the rebalancing consist in transfering
pieces from one store to another for speci
c clients' needs or in
order to secure the sales' trend. This process is quite expensive
and time-consuming but it can be semi-automatized thanks to
the SCM and therefore be integrated in the global management
of
ows.
• The "cleansing" process at the end of a collection often needs
to be furtherly conducted than in classic Retail in order not to
"disrupt" the new collection with former collection's pieces.
6• It should also be considered that luxury brands can adopt a rar-
ity strategy on some key products. In these cases, the stock is
manually dispatched after a thorough analysis of the needs and
sales of the dierent POS.
However, the tools and methods which enables to rationalize and
automatize the supplying process of the stores' network of a luxury
brand do exist since they are identical to the ones used by RTW brands.
They neither question its speci
city nor its creativity. On the contrary,
they enalble the luxury brands to provide an upscale service, the only
service which suits the image of the luxury industry. [27]
1.1.6 Dior : ambassador of French Luxury
Christian Dior SA (commonly called simply Dior) is a French hold-
ing company which was created in 1946 [4]. Legacy of the dress-
maker Christian Dior, the company has also diversi
ed in a major
way towards make-up, skincare, fragrance, fashion accessories, jewel-
ery, leather goods, footwear and timepieces in addition to ready-to-
wear. While the Christian Dior label remains largely for women's of-
ferings, the company also operates the Dior Homme division for men
and the baby Dior label for children's-wear [3].
Belonging to Bernard Arnault's group of which it is the top holding
company controlling LVMH, Christian Dior SA is one of the largest
companies in the world in the luxury industry. As of September 2010,
the company has more than 200 stores worldwide and has a turnover
of more than 20 billions Euros.
1.2 Purpose
The research question of this project will be stated as:
How to improve the sales at CDC, while maintaining the low-
est stock possible in each Point of Sales?
For this purpose, a case study will be conducted on Eyewear and then
the
ndings will be generalized to the other products sold by CDC.
The parameters which will be the most important are the sales quan-
tity (the sales value could have been chosen instead, but since all Eye-
wear are approximately the same price at CDC, both parameters are
quite the same to study), the stock-out rates (which is the percentage
of stores which should have stock but don't) and the coverage (which is
the number of months of stock available). This goal will be considered
achieved if the coverage for Eyewear is under 6 months in volume while
the sales trend remains superior to last year's sales. This will be done
by performing a 6-months internship at Christian Dior Couture and
conducting a case-study on the subject.
72 Related work
In order to
nd out what has been done in the area of optimization
of logistics in luxury companies, this brief section will mention some
of the research that has been done in the area. The
rst section will
describe the research that has been done before on SCM and the ex-
isting theories, the second section will handle previous research in the
eld of logistics and in the Fashion Industry.
2.1 Supply Chain Management : previous research
and theory
The SCM, introduced in the 80s, has been the subject of a special
attention from the companies and has been the center of numerous re-
search topics from the 90s on. The purpose of this section is to present
a synthesis of the works previously written on SCM which show well
the diversity and dynamics of this
eld, but also to emphasize the fact
that none of the current theories on this topic enable to understand
this concept in its whole.
Since the beginning of the 80s, the ever-changing markets led to a
deep questioning of the traditional organizational models (centralized,
hierarchical, wasteful,...) and to the emergence of a new paradigm [32].
The new forms of organizations are built on a customer-oriented and
transverse process of managing [33].
These new structural forms all share common characteristics of
exi-
bility, coordination, adaptability and anticipation [34].
However, the instability of global markets combined to the growing
externalization of many activities (to follow companies' process of refo-
cusing on their core competencies), leads to the quick evolution of the
rules of competition. I seems
t to overcome the intra-organizational
methods to use an inter-organizational method as a new management
paradigm [35].
For more than 25 years, the SCM has been the core subject of an
abundance of work : specialized magazines (Journal of Supply Chain
Management, Supply Chain Management Review,. . . ), thematic pub-
lications in many management papers (la Revue Française de Gestion
in September 2008), numerous books,...
There are not many concepts which have known such a success (over
1000 articles from more than 50 magazines [36]).
The popularity of this concept should however not conceal the re-
maining interrogations : there are three main questions still pending.
First of all, SCM is a largely polysemic term since there are many dif-
ferent de
nitions which encompass a wide variety of
elds [37]. Then,
there exists a desire to account for all forms of organization in the SCM
which aects the complete understanding of the concept [38]. And last,
8the choice of words to describe the SCM doesn't re
ect faithfully busi-
ness practices [39].
These interrogations induce a growing eort to
nd theoretical foun-
dations in order to fully understand the concept, which lead to number
of meta-analysis.
2.2 Other previous research linked to the SCM
2.2.1 Related work in the
eld of Logistics
The basic supply chain approach is to try to forecast the future de-
mand as accurately as possible based on the past demand. This fore-
casting is necessary to make sure to produce enough stock to satisfy
the customers without producing too much stock which would lead to
an inventory too big to be sold out and would cause the company to
lose money [11].
The advantages of this method are that it needs only a small database
and a few manipulations. The remaining unpredictability can be coun-
tered by setting a safety stock level [12].
Then, using the previous forecast, a supply chain plan is put in place
to produce the optimal amount of products at lowest cost (or highest
pro
tability).
The possibility to create and manipulate larger databases and to
do so more quickly has led to new supply chain optimization solutions,
which enable companies to predict the demand for each product, for
each customer for each day. They can then compute the most desirable
inventory level for each product and for each store: this optimized
inventory level is called model stock [13].
2.2.2 Related work on the Fashion Industry
The Fashion Industry has always interested researchers, but what were
usually considered are the sociological and psychological sides of this
particular industry and the processes by which fashions are adopted
by people and populations [6]. Along with this they tried to determine
what we can call cycles in fashion [7].
Most of the earlier work intended to create tools and methods to fore-
cast the demand of fashion products [10], however the reality which
becomes commonly accepted, by both the ones who work in fashion
and the ones who study it, is that fashion can't be forecasted.
Instead, we need to represent fashion markets as complex open systems
with high levels of chaos [10].
Nowadays, researchers tend to focus on the supply chain as a real-time
problem, and try to
nd strategies and methods capable to deal with
this agile supply chain [8] [9].
93 Method
This part of the report will explain what methods will be used during
this internship at CDC. The
rst section will describe how the study
will be conducted and the second section will show how the data which
will be gathered during the internship will be analyzed. For the good
conduct of this report,the exact process to follow must be quite clear
and for that to be possible, it is
rst necessary to understand how the
Supply Chain at CDC currently works.
After describing the method and collecting the data,the results will be
described in paragraph 4. and analyzed in paragraph 5.
3.1 Case Study
According to Dictionary.com, a case study is a study of an individual
unit, as a person, family, or social group, usually emphasizing devel-
opmental issues and relationships with the environment, especially in
order to compare a larger group to the individual unit.
This case study [18] will be organized in dierent phases according
to the general organization of phases that is provided in Single and
Multiple-Case Study Designs [14] as shown in
gure (1).
This section will describe the way the case study should be done. Hope-
fully, all of these steps will be followed as thoroughly as possible; how-
ever, depending on the freedom given during the internship at CDC, a
few of the steps might change along the way.
The
rst step here will be to design a plan on how to gather the
data needed for the analysis and also to answer the following question:
How will these data be connected to the initial research question?
The second step will be to actually collect the data. [24] In the case
of this thesis, it will mostly be documents provided by CDC which
will be used, as well as data which will have been compiled during the
internship.
The sales data which will be needed for the analysis should be both
on a store level and on a reference level. Information on how well the
stores perform (number of sales per month, per year, the seasonality of
sales, . . . ) will also be relevant, as well as information on how well each
reference perform (Is it a best seller ? Is it a real fashion statement?).
The stock data should also be at both a store and reference level and
should be crossed with the size of the backrooms of the dierent stores
and the number of pieces in display in each store.
It is important for all of these documents to be well structured to sim-
plify the analysis which will come afterwards and to make it easier to
give valid references in the next two steps. There are
ve dierent
ways of collecting data: documentation, physical artifacts, direct ob-
servations, interviews and archival records. Each have their pros and
cons. [15]
Documentation, physical artifacts and archival records can be used as
solid references and will be very useful in this analysis, but not before
10being thoroughly examined and analyzed to avoid using out-of-date
data.
Direct observations will be performed on a daily-basis and will provide
answers and valuable information on the organizations of the SCM at
CDC.
The interviews will be replaced by conversations with the internship
manager and will focus on the quantitative means to decrease the cov-
erage while maintaining a low stock-out rates and a high level of sales.
This is the reason why it is very important that all the questions on
the matter sahll be saked. Moreover, through these questions it will
be possible to see the dierences between the direct observations and
how the SCM really works. These conversations will be very helpful in
phase two.
Figure 1: General organization of phases in the case study
Once the data is collected, it is possible to move on to step three.
The data now needs to be sorted and dispatched into two groups: rele-
vant and non-relevant data. To conduct this case study, only the data
which is considered relevant according to the research question will be
used.
113.2 Analysis method
The data which will be collected is mainly information on stock out
rates, sales quantity, stores' stock, buer stock, stock in transit, stock
to be delivered and coverage.
The stock out rates can be calculated at both a store level and a refer-
ence level. At a store level, it is the percentage of references which the
store should have in stock based on its optimal inventory but doesn't
have in stock compared to the number of references in the optimal in-
ventory of the store. At a reference level, it is the percentage of stores
which should have the reference in stock based on th optimal invento-
ries but don't have in stock compared on the number of stores which
have the reference in their optimal inventory.
SORstorelevel = # references#inreferences
the store's optimal inventory which are not in stock
in the store's optimal inventory
SORref erencelevel = # stores#which have the reference in their optimal inventory but not in stock
stores which have the reference in their optimal inventory
There are two dierent problematic stock's situation :
• The stock out situation : in that case, the main issue is to
lose sales due to the lack of stock on a particular reference.
• The overstock situation : it is when we have too many pieces
in stock. In that case, there are two main issues possible. The
rst one is that the overstock pieces in one store might have
greater chances of being sold in another store : we are then miss-
ing sales in that other store which could have taken bene
t from
these overstock pieces. The other main problem which is often
overlooked, is that the backrooms of the stores are often very
small and that these overstock pieces are taking room where some
pieces with greater chances of being sold could have been stored.
The most important question that needs to be answered in order
to analyze the data is how to know if there is just the right amount
of inventory? One way is to compare the value of your current inven-
tory to an ideal inventory investment. [19] Based on the predictable
demand during a speci
c time period (previous sales for example, but
forecasted sales would also work), the inventory coverage can be calcu-
lated. The method here is to choose a target coverage, which is the
time the current stock needs to last until next delivery of new pieces,
and to put in stores the amount of stock which guaranties this target
coverage.
The coverage is basically the number of months of sales that a
given stock covers.To calculate the coverage we use the following equa-
tion [28]:
coverage = N stores' stock + buersales
stock + TBR stock + stock in transit
last N months
There are three main steps in the analysis method:
12• analyze the sales for each store in the world and globally and see
if there are some obvious choice to make to increase the sales.
• analyze the monthly sales and stock of each store and establish a
classi
cation of stores (Does this store sales mostly fashion items?
Does it have a high tra
c ?).
• analyze the stock out rates, the coverage and monthly sales and
decide of actions to be done to optimize both coverage and stock
out rates.
3.2.1 De
nitions
Before describing the three steps of this analysis, let's explain some of
the vocabulary which will be used.
• Zone: At CDC, the world is divided in 5 zones: Europe, China,
Japan, the rest of Asia (which will be called Asia in the rest of
this document) and the US.
• SKU ("Stock-Keeping Unit"): It is the reference of a prod-
uct. [20]
• Core: It is an assortment of Best Seller references which are
present in all the stores in important quantities. [21]
• Growth: The growth is calculated by using the following equa-
tion:
growth = this year's sales
last year's sales − 1
• Depth: When there is a large quantity of a particular SKU, we
say that there is depth on that SKU.
• Asian Fitting Eyewear: It is a king of Eyewear specially
adapted to Asian faces. [22] Since Asian people tend to have
a smaller nose and less prominent cheeks, these Eyewear will
t
them better than the International Fitting ones.
• Seasonality: It corresponds to the cyclic variation of sales.
• High-Season stores: These are stores which are opened during
only part of the year.
• To push: To place large quantity of some SKUs in chosen stores
in order to force the sales.
• Target (or Model Stock): To optimize stock levels, we calcu-
late the most desirable inventory level for each product and for
each store: this optimized inventory level is called Target or
Model Stock.
• Buer Stock: It is the stock which is already available in central
stock to be sent in stores.
• Retail Stock: Stock in stores.
13• TBR Stock: Stock to-be-received. It has been ordered but
has not been delivered to central stock yet.
• Year-to-date (YTD): It is the period of time between the be-
ginning of the year and today's date. Also the month-to-date
(MTD) is the period of time between the beginning of the month
and today's date and the week-to-date (WTD) is the period of
time between the beginning of the week and today's date.
• Sell-Through Rate: It is the ratio of the quantity of pieces
which has been sold of one particular reference versus the quan-
tity ordered. [23]
3.2.2 Step 1
In this
rst step, a global analysis will be conducted at a zone level
and at a store level. This analysis is meant to show global trends such
as:
• which zone sells more Eyewear?
• are the zones' growth positive?
• what kind of Eyewear does each zone sell most ? (Asian Fitting,
Colored, Fashion, . . . )
• does the zone sell a lot of Core references?
• what is the seasonality of the zone?
and more localized trends such as:
• which store has the best growth?
• is there a real gap between the best month and the worst month?
The goal of this analysis is to see if there is an obvious parameter
to change in order to sell more pieces.
For example, it might become clear that the best stores sell more than
50% of Asian Fitting pieces; therefore it could be a good idea to push
some Asian Fitting pieces in the worst stores in order to improve their
sales.
The data will be organized in tables and charts as shown in
gure
(2),
gure (3) and
gure (4).
Figure 2: Zone Analysis
14Figure 3: Seasonality
Figure 4: Store Analysis
3.2.3 Step 2
The goal of the second step will be to establish a classi
cation of stores.
Seven types of stores could be de
ned:
• Flagships: They are the biggest stores and are in tremendous
growth both in quantity and in value. These stores have a large
assortment of SKUs and there is depth on these SKUs. They are
delivered almost every day.
• Luxury Stores: These stores sell less pieces but more expensive
ones. They have a pricier assortment (and a lot of special edition
SKUs) but there is no depth on these SKUs.
• Stores In Growth: They are smaller than the Flagships but
we are willing to help them improve their growth, which is why
we tend to push a lot of SKUs in these stores. Their main goal
is to become Flagships.
• Stores In Decay: Their main goal is to be in growth, which is
why we tend to give them a lot of Core references to help them
get back on their feet.
• Cheap Stores: These stores have an average sale price which is
very low. They are mostly high-season stores.
15• TooManySKUs Stores: These are stores which mostly sell
Core references and almost exclusively to tourists. Their goal is
to reduce the sales on Core SKUS and to increase the sales on
other references.
• Other Stores: These stores are mostly stores which are well
positioned in prestigious places where a lot of people pass by and
see them. They need to have stock for display but hardly sell
anything.
This step is meant to give us a clearer picture of the stores, their
capacities and their goals.
3.2.4 Step 3
Step 3 will try to de
ne which actions should be taken to optimize
both coverage and stock out rates.
This analyze will be performed on two levels for each zone: a SKU
level and a store level.
Firstly, for each zone and for each each SKU the following informa-
tion should be gathered:
• last 2 months' sales
• the number of targets for this SKU in the entire zone
• last 5 weeks' stock out rates
• the number of pieces in buer stock
• the number of pieces in transit (between central stock and stores)
• the total stock in the zone (retail stock + buer stock + stock in
transit)
• the stock to-be-received (TBR)
In a second step, for each store in the zone, the following informa-
tion will be extracted from the database:
• last 5 weeks' stock out rates
• the number of SKUs which are in stock-out
• last 2 months' sales
• the number of pieces in display in the store
• the available stock and the stock in transit
• the number of targets in this store
From this information, the coverage for each store can be calculated.
This step is giving us essential information for this analysis.
The data will be organized in tables as shown in
gure (5) and
gure (6).
16Figure 5: Zone Analysis
Figure 6: Zone Analysis
174 Results
4.1 Data Collection
From the data collected, it appears obvious that there are two types
of products that need to be analyzed dierently : Newness and Carry
Over References.
• What is called Newness are the items from the new collection.
• After a month in stores, these Newness can either be reordered,
in which case they become Carry Over References, or not, in
which case we just want to optimize the Sell-Through Rate.
4.1.1 Newness
There are two dierent ways to handle the Newness. [29]
• The
rst way consists of putting these new references in every
POS at
rst. Then, after about 3 weeks in the stores, transfers
are completed to re-balance the stock in the stores which have
shown the greatest sales' potential for these SKUs. This way
every store gets a chance at selling these Newness and it also en-
ables the smallest stores to renew their assortments even though
they might not sell a lot.
• The second way consists of putting the Newness only in Flagship
stores. After about 10 days, if the references have shown po-
tential, the SCM chooses to expand the perimeter to other POS
being limited only by the initial orders quantities.
4.1.2 Carry Over References
After that, the Newness which is reordered will become Carry Over
references and they can be part of this analysis. Based on the data
collected in step 3, two types of analysis will be conducted: a SKU
analysis for each zone and a store analysis.
First, let's explain a few guidelines:
• The goal is to keep a retail coverage inferior to 4 months of stock.
• It is important to maintain a Stock-Out Rate inferior to 10%
for each SKU and for each store, and inferior to 5% for Core
references.
The parameters initially chosen where 3 months of stock and 15%
of stock out rates. But they were iteratively adjusted during the study
until these more optimal parameters became a general guideline.
4.2 Data Analysis
Once all the data has been collected and analyzed, each store belongs
to a category and has a speci
c goal. Based on that goal and on the
data collected in step 3 of this method, it will be possible to minimize
the stock in each POS while making sure that no sale is compromised.
184.2.1 SKU analysis
There are 4 scenarios in which the guidelines explained in 4.1.2 are not
respected as shown in
gure (7).
Figure 7: SKU Analysis: dierent scenarios
• In the
rst scenario, the Retail Coverage is within boundaries
but the Stock-Out Rate is too high while there is some buer
stock. In that case, the targets need to be reviewed because if
they were optimal, the buer stock would have been sent to the
stores before it was in Stock-Out.
• In the second scenario, the Retail Coverage is still within bound-
aries, the Stock-Out Rate is too high but there is no buer stock.
In that case, some stock must be put back on the buer stock.
The solutions usually are to ask the producer for some pieces in
priority on the order to-be-delivered or to transfer some stock
from the buer stock of another zone which needs it less at the
moment.
• In the third scenario, the Stock-Out Rate is too high, there is no
buer stock but the Retail Coverage is too high. In that case, the
19stock must be re-balanced from slow-selling stores to best-selling
stores in order to optimize the position of the stock in regard to
the sales.
• In the last scenario, the Stock-Out Rate is within boundaries,
there is no buer stock but the Retail Coverage is too high. In
that case, the targets need to be decreased, because if they were
optimal, the Retail Coverage would be under 4 months of stock.
These 4 scenarios are the only problematic scenarios which can be
encountered since, for all the parameters, the only concern is whether
they are above or under a certain level.
4.2.2 Store analysis
There are 3 scenarios in which the guidelines stated in 4.1.2 are not
respected as shown in
gure (8).
Figure 8: SKU Analysis: dierent scenarios
• In the
rst scenario, the Retail Coverage is within boundaries but
the Stock-Out Rate is too high. In that case, the targets need to
be increased for the SKUs which are in Stock-Out.
• In the second scenario, the Retail Coverage is too high while the
Stock-Out Rate is correct. In that case, the targets need to be
decreased for the SKUs which the store doesn't sell.
• In the third scenario, both the Stock-Out Rate and the Retail
Coverage are too high. In that case,all the targets must be re-
viewed (increasing the targets for the SKUs which are in Stock-
Out and decreasing the targets for the SKUs which the store
doesn't sell) and the stores should also try to re-balance the stock
from slow-selling stores to best-selling stores in order to optimize
the position of the stock in regard to the sales.
In the same way as for the SKU analysis, these 3 scenarios are the
only problematic scenarios which can be encountered.
204.2.3 Process
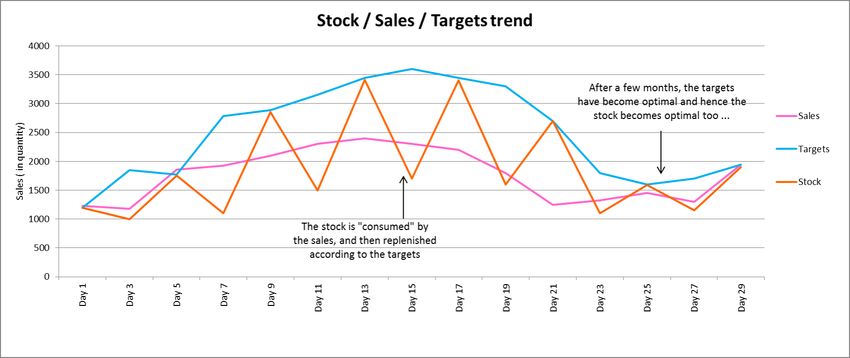
With this analysis, the targets are adjusted every week. [30]After a
month or so, the targets should be optimal and hence the stock will
become optimal too in time, following the targets' trend.
Figure 9: Stock's trend following the targets' trend and becoming optimal
We can very clearly see the stock's trend following the targets' trend
in
gure (9) and becoming "optimal" in the end since it matches the
sales exactly.
Of course, since the references are renewed all the time, this analysis
should be done regularly in order to keep optimal targets for all the
references, adapting the targets to the various events of the year.
215 Validity, Reliability
5.1 Validity
In this study, both internal and external validity will be of concern.
5.1.1 Internal Validity
It is concerned with the degree of certainty that observed eects in
an experiment are actually the result of the experimental treatment,
rather than intervening or confounding variables. [17]
The study lasted 6 months, and during all that time there was no
shortage of production, so it can be assesed that the availability of
stock did not have a role to play in the change of the results during
that time.
Also, since 6 months is a long time, it is most likely that the changes
observed were not induced by the seasonality of sales. Indeed, since
the seasonality of sales on Eyewear is quite simple to de
ne (high in
the Summer and low in the Winter) as seen in
gure (3), we can study
only half of the year and still experience every bit of the seasonality
(either from low to high or from high to low with a smooth transition
in between).
5.1.2 External Validity
It is concerned with the degree to which research
ndings can be
applied to the real world, beyond the controlled setting of the research.
[17] The wonder is whether the study and the results can be generalized
to any company in the fashion industry and to any type of product.
Since the only hypothesis which were made on the product is that
any reference has somehow the same price range, it is immediate to
assume that this study can be generalized to any type of product were
the variation of price is of small amplitude.
5.2 Reliability
We can assess that this study is reliable since :
• This report used reliable references to support the hypothesis
throughout the dierent steps.
• All research material was saved on an external hard drive and
used as both back-up and version control.
• Since very few hypothesis were made and the references which
were used are easily
ndable on the Internet, a similar case study
could use this method and those references.
226 Discussion
After this analysis, we expect the global coverage of Eyewear at CDC
to be decreased since the stock will, hopefully, tend toward the sales
and considering how the coverage is calculated (as a reminder [28]
coverage = N stores' stock + buersales
stock + TBR stock + stock in transit
last N months
And as expected, the analysis carried out previously reveals an im-
provement of the global coverage compared to the initial number of
months of stock in each zone. With no change in the product perime-
ter, the general estimation is that the coverage can go down to 2 months
of stock in each POS without losing any sales (providing that there is
the right assortment of products in the store, it doesn't need to have
more than 2 months coverage on references which have a high rotation
rate).
Even if this improvement can seem huge, its possible realization in
real condition is not ensured (one could even say nearly impossible
given that new products are introduced constantly in the study while
some other are removed once their season is over). This way, dierent
constraints will prevent the optimized sequence to be reached in real
conditions.
However, this analysis will enable to tend toward the optimized
sequence as much as possible. Even though the improvement will not
be perfect, it will be as perfect as it can be considering the real life
conditions and it will be a noticeable improvement nonetheless.
In the case of Eyewear at CDC, the coverage managed to drop from
10 to 4 months of stock globally between January 2012 and May 2013.
However, each time a new collection (end therefore a new group of
SKUs) has been introduced in the POS, it tended to be delivered all
at the same time and therefore the coverage rose again at once until
the sales could compensate this sudden increase of stock.
With a constant product perimeter, which are the references which
were present in the oer at the beginning of the internship, the cover-
age dropped from 10 months of stock to 3 months of stock.
On a larger scale, the coverage has largely improved since this study
was put in place despite the ups-and-downs due to the launch of new
products.
In this study, we know all the actual delivery lead time data for every
store. However, the assumption that every store has the same delivery
lead time is pretty accurate since we calculate the coverage for each
geographical zone and since the stores of the same country have ap-
proximately the same delivery lead time give or take 2 days (which is
a very small variation in the case of this study).
In fact, since the new collections are introduced with all the pieces
being sent to the POS at the same time, these "ups-and-downs" can't
be avoided in any way.
23In order to apply this optimization to any product, a few dierent
hypotheses could have been chosen at the beginning of the study.
First of all, the optimization assumes that all products have the
same price range. This allows the handling of quantities instead of
costs which is far more intuitive when stocks are at stakes, but it also
allows some straight forward optimization which would be di
cultly
applicable to products where the price changes are of large amplitude
from one product to another since the customer's choice is always de-
pendant of the price of the product.
The theories discussed in this paper are tightly related to Game's The-
ory in the sense that it is an ensemble of tools designed to analyze
situations in which the optimal action to be realized by one "agent"
depends on anticipations of what one or many other "agents" will do.
The objective of Game's Theory is to
nd how to come up with the
optimal situation just as it is the SCM's objective to optimize the as-
sortment of product made available to each customer throughout the
world.
In order to incorporate this side of the problem to the analysis, it would
have been necessary either to work on stock's value instead of stock's
quantity from the beginning and then to descend back to a volume
level, or to
nd the average price of the products and then ponderate
each quantity with its price compared to the average.
This would have greatly complicated the calculations by adding a price
ratio in front of every quantity used in the analysis. It could nonethe-
less be the subject of another study entirely since it would be an im-
portant improvement on this method.
This optimization also assumes that all stores have the same de-
livery lead time when in fact it is not the case. In order to take this
parameter into account, it should be taken for granted that some stores
which can be delivered in 1 day can have a lower coverage than stores
which are delivered in a minimum of 10 days and still not miss any
chance to sell the products.
From that could be calculated an optimal coverage for each store
based on their own delivery lead time.
In this study, the goal coverage can in fact be considered as an average
of these optimal calculated coverages.
In order to have a more thorough analysis, there are a few ground
rules to be observed:
• One should be careful with targets increases when the category of
products has already a high coverage: the optimal choice in that
case is to try to make the store sell what it already has in stock
before sending some more pieces. If a slow-selling store sells a
particular product and has a target of 1, the right choice is often
to leave a target of 1 even though the store will have to wait a few
days until it receives the new piece after the sale. If you increase
the target to 2, then you will probably never be out of stock on
24this reference but you also might overstock your store, which is
unnecessary.
• One should be careful with targets decreases when the global
coverage is high: if the sales are not good, then it is important
not to miss any sale at all. The optimal choice in that case is to
make sure that the store is never out of stock on references which
it sales.
• One should be careful with targets decreases when the category
of products has already a low coverage: the store still needs stock
in order to sell, and decreasing the coverage might lead to missed
sales. The optimal choice in that case is to respect a minimum
coverage of 1,5 month of stock.
• One should be careful with targets increases when the stock out
rates are high. If the store is missing stock, then it can mean
either of two things: the targets are not high enough and this is
why the store has no stock while it should never be out of stock
as long as the replenishment process is working, or (and this is
the subtlety here) there is no more stock in buer and therefore
it is normal for the store not to be replenished correctly. In the
second case, the target is probably well adjusted and shouldn't
be increased before there is stock again on the buer.
All of these "rules" were used in the case of this analysis. Actually,
they were even elaborated little by little as the study went because
they were found necessary for the method to keep improving itself.
This analysis, if used permanently on all categories of products will
globally reduce the initial stock orders by optimizing the number of
pieces sent to the stores while maintaining the sales (or even raising
the sales, since a lot of sales will not be missed anymore due to a lack
of stock in some stores).
What will come from this stock optimization is a better sell-through
and therefore an increase of the company's turnover.
257 Conclusion
7.1 Conclusions
Considering the variability of supply and demand in the fashion indus-
try, it has been seen through this analysis how to monitor the availabil-
ity of the products in POS worldwide while optimizing the inventory
levels. This analysis has put a focus on Christian Dior Couture (where
the 6-months internship was performed) and on a particular type of
product within the oer : Eyewear.
I had the opportunity to be part of Christian Dior Couture's Supply
Chain and to participate to the heavy task of managing the overall
ow
of Eyewear from supplier to customer. In order to do that, the present
analysis was heavily used to set the optimal Model Stock for all Eye-
wear of the current collections and then challenged those targets every
week to adapt them to the events worldwide (Christmas,Chinese New
Year,...). It was also primordial to make sure that some re-balancing
were completed when and where needed to optimize the sell-through
and the sales.
After designing this research plan, the necessary data was collected
and organized in tables to make easier it's analysis. The collected data
was mainly information on stock out rates, sales quantity, stores' stock,
buer stock, stock in transit, stock to be delivered and coverage.
First, the sales were thoroughly analyzed to see if there were some
obvious choices to make in order to increase the sales.
Then it was the monthly sales and stock of each store which were
studied to establish a classi
cation of stores and set goals for each
category of stores.
And
nally, the stock out rates, coverage and monthly sales were
calculated for each SKU and for each store, and actions to perform
were chosen to optimize both coverage and stock out rates.
Once this analysis is done, the targets should be adjusted every
week and after a month or so, they will converge to an optimal Model
Stock and hence the stock should become optimal too in time, follow-
ing the targets' trend.
This analysis lasted 6 months (which is a period long enough to
assume that seasonality didn't in
uence my data) and during these 6
months, there was no shortage of stock whatsoever. From this it can
be assessed that this analysis is internally valid. Moreover, since very
few hypothesis were made in the beginning of my research, it can also
be assessed that this research is externally valid. On the other hand,
the reliability of the research was proven in the previous paragraph
due to the reliability of both references and research material.
267.2 Future work
There are some aspects of the Supply Chain problem in the Fashion
Industry which were not treated in this analysis and which could be
interesting to look at. A few examples can be found below:
• One of the hypothesis which was chosen for this analysis, was
that all the products (Eyewear in this study) have approximately
the same price. It could be interesting to try to include the price
range in the analysis to be able to generalize this study to any
product. It would mean de
ning price ranges (for example "low-
range", "mid-range", "mid/high-range" and "high-range") and
repeat this analysis for each price range, giving stores dierent
goals depending of the price range of the product in question.
• This optimal Model Stock which was created in this analysis
could also be used to predict the perfect amount of pieces to
produce for each product based on the sales and Model Stock of
a similar product in term of fashion in previous collections.
27References
[1] Andreas Wieland, Carl Marcus Wallenburg (2011): Supply-
Chain-Management in stürmischen Zeiten, Berlin (in german)
[2] Cedillo M.G., Pérez A. (2010): Hybrid supply chains in emerging
markets: the case of the Mexican auto industry, South African
Journal of Industrial Engineering, May, Vol. 21, No.1, pp. 193-
206
[3] "LVMH Companies and Brands" on the LVMH website
[4] Interactive timelines of Couture houses :
http://www.vam.ac.uk/vastatic/microsites/1486_couture/
media/explore/index.php
[5] Nicolas Boulanger (2005) : Les Stratégies Logistiques de Maisons
de Luxe (in french)
[6] Wills G., Midgley D. (1973): Fashion Marketing, Allen & Unwin:
London
[7] Carman J. (1966): The Fate of Fashion Cycles in our Modern
Society, Science, Technology and Society, American Marketing
Association, Chicago, USA
[8] Harrison A., Christopher M., van Hoek R. (1999): Creating the
Agile Supply Chain, Institute of Logistics & Transport, UK
[9] Christopher M., Towill D. (2001): An Integrated Model for the
Design of Agile Supply Chains, International Journal of Physical
Distribution & Logistics Management, Vol. 13, No. 4, pp 235-246
[10] Christopher M., Lowson R., Peck H.: Creating Agile Supply
Chains in the Fashion Industry
[11] Murray M.: Forecasting in the Supply Chain
[12] Bozarth C.: Safety Stock Analysis: Inventory Management Mod-
els, The Supply Chain Resource Cooperative
[13] Graves S. C., Willems S. P.: Optimizing Strategic Safety Stock
Placement in Supply Chains
[14] South East European Doctoral Student Conference: Single and
Multiple-Case Study Designs
[15] The Ohio State University: https://engineering.purdue.edu/
watersheds/resources/Academy/Evalution_Handbook_Water_
Projects.pdf
[16] Debasis Daspal: Apparel supply chain and its variants
[17] University of the West of Engalnd: Validity and Reliability
[18] Gerard V., Ph.D.: Steps in Writing a Science Thesis or Disserta-
tion
[19] Sangam V. (2010): Inventory Optimization
[20] TechTerms.com : De
nition of SKU
[21] VendorNet: Assortment Planning and Merchandising for the
Omni-Channel Shopper
28[22] http://www.tifosioptics.com/technology/asian-
t/
[23] Accelerated Analytics: Calculating Sell-Thru
[24] Yin R. (1994): Case study research - Design and Methods
[25] University Alliance: What is the Importance of Supply Chain
Management?
[26] Saccania N., Johansson P.; Perona M. (2007): Con
guring the
after-sales service supply chain: A multiple case study
[27] SUPPLY CHAIN MAGAZINE No32 (2009): Comment intégrer
la Supply Chain du luxe de bout en bout ?
[28] Dior (2010): How To - Rapports de couvertures et tableaux de
stocks (internal report)
[29] Dior (2012): How To - Gestion des nouveautés (internal report)
[30] Dior (2011): How To - Gestion des réassorts (internal report)
[31] Dior (2011): How To - Rapports de rupture (internal report)
[32] Desreumaux A. (1996): Nouvelles formes d'organisation et évolu-
tion de l'entreprise (in french)
[33] Louart P. (1996): L'apparente révolution des formes organisation-
nelles (in french)
[34] Tarondeau J.C., Wright R.W. (1995): La transversalité dans les
organisations ou le contrôle par les processus (in french)
[35] Håkanson H., Snehota I. (1990): No business is an island : the
network concept of business strategy
[36] Charvet F.F., Cooper M.C., Gardner J.T. (2008): The intellectual
structure of supply chain management: a bibliometric approach
[37] Mentzer J.T., DeWitt W., Keebler J.S., Min S., Nix N.W., Smith
C.D., Zacharia Z.G. (2001): De
ning supply chain management
[38] Romelaer P. (2000): Rencontres et organisation (in french)
[39] Fawcett S.E., Magnan G.N. (2002): The rhetoric and reality of
supply chain integration
29You can also read