UCLA UCLA Electronic Theses and Dissertations - eScholarship
←
→
Page content transcription
If your browser does not render page correctly, please read the page content below
UCLA
UCLA Electronic Theses and Dissertations

Title
An application of sentiment analysis with transformer models on online news articles
covering the Covid-19 pandemic

Permalink
https://escholarship.org/uc/item/83v9r1np

Author
Asthana, Prakul

Publication Date
2021

Peer reviewed|Thesis/dissertation

 eScholarship.org                                 Powered by the California Digital Library
                                                                  University of California
UNIVERSITY OF CALIFORNIA
              Los Angeles

  An application of sentiment analysis
with transformer models on online news
articles covering the Covid-19 pandemic

A thesis submitted in partial satisfaction
   of the requirements for the degree
     Master of Applied in Statistics

                   by

            Prakul Asthana

                  2021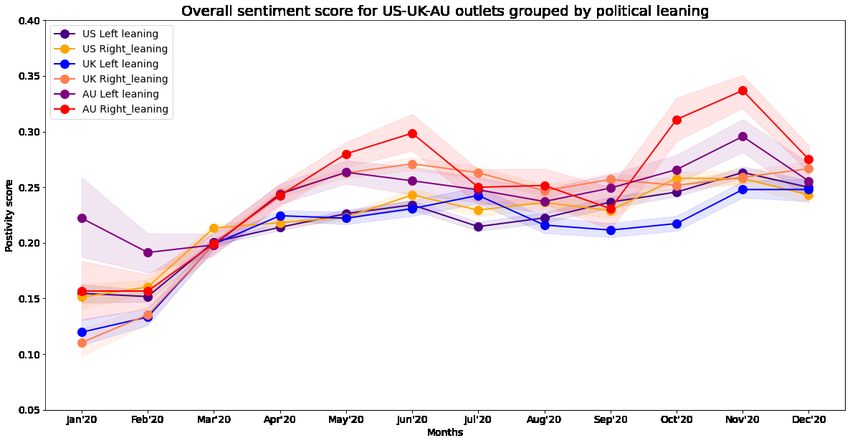
© Copyright by
Prakul Asthana
     2021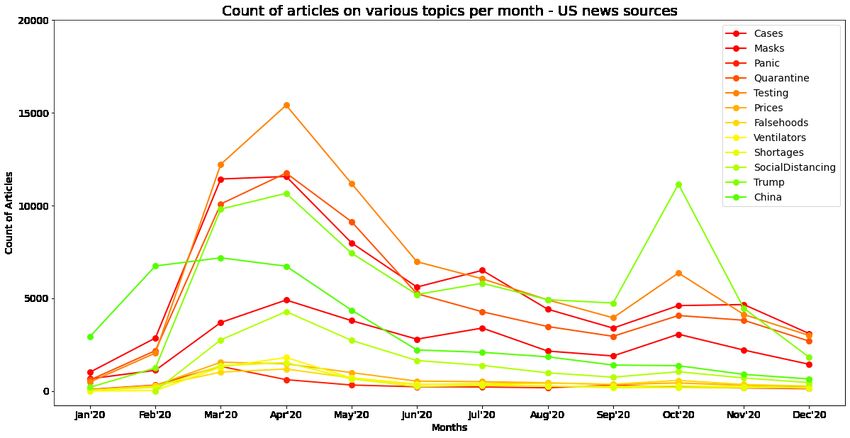
ABSTRACT OF THE THESIS

                            An application of sentiment analysis
                          with transformer models on online news
                          articles covering the Covid-19 pandemic

                                              by

                                       Prakul Asthana
                               Master of Applied in Statistics
                         University of California, Los Angeles, 2021
                               Professor Yingnian Wu, Chair

The Covid-19 pandemic has had a devastating impact on lives across the world, with tremen-
dous human socio-economic costs, while exposing and exacerbating several fault lines in our
society. It has also caused a rapid rise in misinformation and erosion of trust in established
news outlets amid allegations of political bias and censorship. In this paper we use the pro-
cesses of sentiment analysis to study the coverage of the Covid-19 pandemic in news outlets.
By comparing the coverage from news sources with opposing political leanings, we quan-
titatively establish political bias. We also repeat this process on news articles mentioning
specific topics like Masks, Social Distancing etc., to check for any bias present in the senti-
ment towards them. Lastly, we compare sentiment in Covid-19 news coverage in the United
States, the United Kingdom and Australia to contrast the political bias in news articles on
the pandemic in these three countries.

                                              ii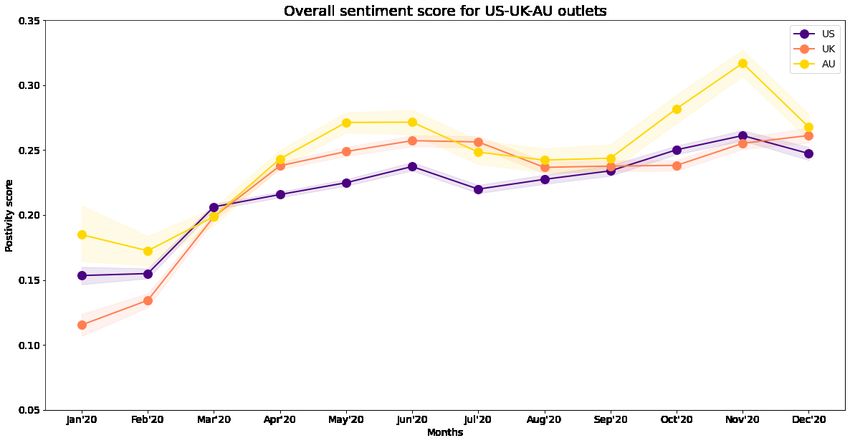
The thesis of Prakul Asthana is approved.

                                     Hongquan Xu

                                 Rick Paik Schoenberg

                            Yingnian Wu, Committee Chair

                          University of California, Los Angeles

                                            2021

                                             iii
TABLE OF CONTENTS
1 Introduction . . . . . . . . . . . . . . . . . . . . . . . . . . . . . . . . . . . . . . 1
2 Transformer models . . . . . . . . . . . . . . . . . . . . . . . . . . . . . . . . . 4
2.1 Early models in Natural Language Processing . . . . . . . . . . . . . . . . . 4
2.2 Attention process . . . . . . . . . . . . . . . . . . . . . . . . . . . . . . . . . 5
2.3 BERT . . . . . . . . . . . . . . . . . . . . . . . . . . . . . . . . . . . . . . . 6
2.4 DistilBERT . . . . . . . . . . . . . . . . . . . . . . . . . . . . . . . . . . . . 8
3 Sentiment Analysis . . . . . . . . . . . . . . . . . . . . . . . . . . . . . . . . . 11
3.1 Types of sentiment analysis . . . . . . . . . . . . . . . . . . . . . . . . . . . 11
3.2 Sentiment analysis with Transformers . . . . . . . . . . . . . . . . . . . . . . 13
4 Experiments . . . . . . . . . . . . . . . . . . . . . . . . . . . . . . . . . . . . . . 14
4.1 Covid-19 news dataset . . . . . . . . . . . . . . . . . . . . . . . . . . . . . . 14
4.2 Exploratory analysis . . . . . . . . . . . . . . . . . . . . . . . . . . . . . . . 15
4.3 Overall sentiment analysis . . . . . . . . . . . . . . . . . . . . . . . . . . . . 18
4.4 Sentiment analysis in articles on various sub-topics . . . . . . . . . . . . . . 20
4.4.1 Sub-topic : Masks . . . . . . . . . . . . . . . . . . . . . . . . . . . . . 21
4.4.2 Sub-topic : Social Distancing . . . . . . . . . . . . . . . . . . . . . . 22
4.4.3 Sub-topic : Trump . . . . . . . . . . . . . . . . . . . . . . . . . . . . 23
4.4.4 Sub-topic : China . . . . . . . . . . . . . . . . . . . . . . . . . . . . . 25
4.5 International Sentiment . . . . . . . . . . . . . . . . . . . . . . . . . . . . . . 27
4.5.1 Overall Sentiment - US vs UK vs Australia . . . . . . . . . . . . . . . 28
iv4.5.2 Sentiment grouped by political leaning . . . . . . . . . . . . . . . . . 29
5 Conclusion . . . . . . . . . . . . . . . . . . . . . . . . . . . . . . . . . . . . . . . 30
5.1 Future Work . . . . . . . . . . . . . . . . . . . . . . . . . . . . . . . . . . . . 33
References . . . . . . . . . . . . . . . . . . . . . . . . . . . . . . . . . . . . . . . . . 34
vLIST OF FIGURES
2.1 Attention matrix showing the relative weights or importance given to words in a
sentence during machine translation task from English to French . . . . . . . . . 6
2.2 The process of calculation of self attention represented by the z vector) in matrix
form. Here, dk represents the dimension of the key vector used. . . . . . . . . . 7
2.3 Training BERT as a language model to predict masked words. During the training
process, 15% of words are masked randomly. . . . . . . . . . . . . . . . . . . . . 8
2.4 Training BERT to predict if the second sentence of the given sentence pairs is
the next subsequent sentence or not. . . . . . . . . . . . . . . . . . . . . . . . . 9
3.1 Various types of sentiment analysis based upon machine learning or lexicon based
approaches. In this paper, we will be using supervised machine learning approach
using a neural network classifier which is fed by a transformer model. . . . . . . 12
3.2 Sentiment analysis setup used in this paper. We have a pre-trained DistilBERT
model, on which we attached a classifier which has been fine tuned on the SST-2
dataset. This model achieves 92.7% accuracy on the SST-2 dataset and is well
suited to serve as a general purpose binary sentiment classifier in an unsupervised
setting. . . . . . . . . . . . . . . . . . . . . . . . . . . . . . . . . . . . . . . . . 13
4.1 Count of articles covering the Covid-19 pandemic from our selected 10 sources,
during the period 1st January 2020 to 31st December 2020 . . . . . . . . . . . . 16
4.2 Monthly count of articles covering the Covid-19 pandemic in left leaning and right
leaning news outlets . . . . . . . . . . . . . . . . . . . . . . . . . . . . . . . . . 16
4.3 Monthly count of articles covering various sub-topics within the Covid-19 pandemic 17
vi4.4 Overall sentiment in Covid-19 news coverage over time, as measured by the
monthly average of ’Positivity score’ or the monthly average probability of the
text being classified as positive by our model. . . . . . . . . . . . . . . . . . . . 19
4.5 Overall sentiment in Covid-19 news coverage over time grouped by political lean-
ing of the news sources. . . . . . . . . . . . . . . . . . . . . . . . . . . . . . . . 19
4.6 Overall sentiment in Covid-19 news coverage over time - New York Times vs Fox
News. . . . . . . . . . . . . . . . . . . . . . . . . . . . . . . . . . . . . . . . . . 20
4.7 Sentiment analysis for articles covering the sub-topic of masks. . . . . . . . . . . 21
4.8 Sentiment analysis for articles covering the sub-topic of social distancing . . . . 23
4.9 Sentiment analysis for articles covering the sub-topic of Trump . . . . . . . . . . 24
4.10 Sentiment analysis for articles covering the sub-topic of China . . . . . . . . . . 26
4.11 Overall sentiment in Covid-19 news coverage over time - comparison between US,
UK and Australia. . . . . . . . . . . . . . . . . . . . . . . . . . . . . . . . . . . 28
4.12 Sentiment grouped by political leaning in Covid-19 news coverage over time,
comparison between US, UK and Australia . . . . . . . . . . . . . . . . . . . . . 29
viiLIST OF TABLES
2.1 Comparing the size, inference time and relevant performance metrics of BERT
and DistilBERT with previous SoTA benchmark. . . . . . . . . . . . . . . . . . 10
4.1 Comprehensive view of the dataset under consideration with category wise article
count for each news source selected for the analysis . . . . . . . . . . . . . . . . 18
4.2 News sources from Australia and United Kingdom selected for comparison with
the ones from United States. . . . . . . . . . . . . . . . . . . . . . . . . . . . . . 27
viiiCHAPTER 1
Introduction
The Covid-19 pandemic has been an unforeseen and unprecedented catastrophe across the
globe. Along with the dramatic loss of human life, it has posed tremendous challenges to the
public health, food security and people’s livelihoods. The economic and social implications of
the pandemic are devastating with tens of millions of people at the risk of falling into extreme
poverty and an additional 132 million possibly falling into the undernourished category. [1]
Within this tumultuous and unprecedented crisis, we have also witnessed a rapid rise in
misinformation, false reporting and hate speech through the internet. While suspicions of
bias and partisanship have long been raised against various small or big news agencies, the
Covid-19 pandemic has greatly exacerbated all such claims, sending the trust and credibility
of established media outlets at an all time low among people belonging to both sides of the
political spectrum.[2, 3] This void created from the traditional media outlets was filled in
by a hodgepodge of small players, amplifying their reach through social media, and often
further fueling conspiracy theories about the origin of the virus or pseudo-scientific claims
about the severity of the Covid-19 disease. Furthermore, in the United States, the 2020
elections have served to exacerbate the issue in a highly charged and polarized environment.
The net effect of this has been a general disbelief among large sections of the society about
the grave nature of the pandemic and reduced confidence in preventive measures like masks,
social distancing or vaccinations.[4, 5]
Sentiment analysis is a fundamental task in the fields of natural language processing, text
mining and computational linguistics. It aims to systematically identify, extract, quantify,
1and study affective states and subjective information in free form text. Fundamentally, this
involves detecting and quantifying positive or negative sentiment in text. It’s often used
by businesses to detect sentiment in social data, gauge brand reputation, and understand
the voice of customers. Over the years, sentiment analysis has moved from rule based rigid
methods to modern machine learning based classification methods. These machine learning
methods either classify sentiment into discrete categories ranging from strongly negative to
strongly positive, or give a continuous metric representing positive sentiment in the text.
[6, 7]
In recent years, transformer based natural language models have established themselves
as the front-runners in all natural language processing tasks. Driven by an attention based
architecture at their core, large scale transformer models have revolutionized all language
related tasks including translation, text generation, next word prediction, natural language
inference, question answering and of course sentiment based classification. The Bidirectional
Encoder Representations from Transformers model, colloquially known as BERT, was the
first major transformer model, which became popular due to its state of the art performance
on various natural language tasks. It consolidated the various advancements made in the self-
attention process for long short-term and recurrent models, while laying out the groundwork
for all future refinements of transformer models.[8, 9] Distilled BERT or DistilBERT is
another such refinement which focuses on reducing the size of the BERT transformer to
allow for faster inference and training, while retaining nearly identical performance in all
key benchmark tasks. This is achieved through the process of knowledge distillation, where
a smaller model is trained to reproduce the behaviour of a larger model or an ensemble.[10]
Thus, this paper aims to use this DistilBERT model to perform sentiment analysis on
the Covid-19 news coverage, to compare and contrast the positivity seen in articles covering
the Covid-19 pandemic across major media outlets. Using a dataset being compiled and
maintained by the Global Database of Events, Language, and Tone or the (GDELT project),
we aim to quantify the varying levels of positivity seen in right leaning and left leaning media
2outlets, about the Covid-19 pandemic since the start of the year 2020. Further, as previously
discussed the massive amount of misinformation prevalent among the public regarding the
Covid-19 disease can be traced back to some source on the internet. Hence, we will also look
specifically at the sentiment around mentions of masks, social distancing and other facets
of the pandemic to quantify the differences if any. Lastly, we will also have a look at the
media coverage in few other countries like the United Kingdom and Australia to see whether
the trends observed in media coverage in the United States corroborate with those observed
across the world.
The remainder of this thesis is organized as follows. Section 2 deals with establishing
the background into working of transformers, and then shares some salient features of the
DistilBERT model used for analysis here. Section 3 gives a brief overview of the sentiment
analysis process and how the transformer model was fine-tuned to perform this task. Section
4 covers an exploratory analysis of the online news article dataset, and reports some of the
most interesting results observed during the sentiment analysis of this dataset. Finally,
section 5 discusses these results in detail and section 6 concludes the work and outlines
possible future improvements.
3CHAPTER 2
Transformer models
2.1 Early models in Natural Language Processing
The earliest Natural Language Processing (NLP) systems followed a rule based rigid IF
THEN architecture. With the progress of computing power and
increasing availability of large text corpus, statistical NLP models started coming to the fore
in the 1990’s - 2000’s period. Powered by rich feature sets constructed from document-term
matrices, these models are regarded as the beginning of the machine learning era in text
processing. Some of the early models in this era like Decision Trees, produced systems of
large and complex if-then rules, which were similar to previous era of hand written rule
based models. However, these models were capable of making soft, probabilistic decisions.
Hidden Markov models were introduced from part of speech tagging around the same time
period while Latent Dirichlet Allocation was introduced as a probabilistic generative model
for collections of discrete data such as text corpora.[11, 12]
In the late 1990’s, work on using neural network based models for NLP tasks also started
to pick up steam. Due to the sequential nature of unstructured text, recurrent neural net-
works (RNN) had the most success in language tasks, compared to other neural network
architectures. The long short-term memory model (LSTM) was also introduced around the
same time, as an upgraded version of the vanilla RNN model with better ability to predict se-
quences of longer durations thanks to better handling of the vanishing gradient problem.[13]
In 2001, the first neural “language” model was proposed, using a feed-forward neural net-
4work and later improved in 2003 giving the first neural probabilistic language model which
improved the benchmarks set by n-gram models while utilizing a novel distributed learning
approach to tackle the curse of dimensionality. By mid 2010’s, there was a wide variety
of such natural language models most of which used powerful word embeddings at their
core and were geared towards specific tasks like sequence to sequence model for machine
translation, which utilizes an encoder - decoder based structure, and used either LSTM or
gated recurrent units (GRU’s) as a building block to avoid the vanishing gradient problem
associated with RNNs.[14]
2.2 Attention process
To Further improve the performance of these models, a novel “attention” mechanism was
proposed.[15] Attention allowed the model to focus on the relevant parts of the input sequence
as needed. As a result, instead of mindlessly aligning the first word at the output with the
first word from the input, the model actually learns from the training phase how to align
words in that language pair. Soon afterwards, a new architecture based on these encoder
decoder blocks, but without any RNN/LSTM/GRU units was proposed.[16] This new so-
called Transformer model, was able to achieve state of the art performance on language
translation tasks and provided lots of flexibility for future growth and easy parallelization
for scaling up in size. One of the keys to the success of the Transformer model was its self-
attention mechanism in which makes the encoder look at other words in the input sentence
as it encodes a specific word. This bakes in the “understanding” of other relevant words into
the one we’re currently processing.
This is achieved by using three vectors for each word in the input - a Query vector (Q),
a Key vector (K), and a Value vector (V). A score is calculated by taking the dot product
of Key and Query vectors and determines how much focus to place on other parts of the
input sentence as we encode a word at a certain position. Scores are then divided by 8 to
5Figure 2.1: Attention matrix showing the relative weights or importance given to words in
a sentence during machine translation task from English to French
stabilize gradients and passed through a softmax operation to make sure they’re all positive
and add up to 1. This softmax score determines how much each word will be expressed at
this position. Finally, each value vector is multiplied by the softmax score, to keep intact the
values of the word(s) we want to focus on, drowning-out irrelevant words and weighted value
vectors are summed up together to give the output of the self attention layer. Transformers
usually contain “multi headed” attention which expands the model’s ability to focus on
different positions and gives the attention layer multiple “representation sub-spaces”.
2.3 BERT
Bidirectional Encoder Representations from Transformers or BERT as its widely known was
a model released in 2018 which builds on several clever ideas from the NLP community and
6Figure 2.2: The process of calculation of self attention represented by the z vector) in matrix
form. Here, dk represents the dimension of the key vector used.
centered around the Transformer architecture which we have just discussed. BERT kick
started the era of transfer learning in NLP as the model could be fine-tuned with just one
additional output layer to create state-of-the-art models for a wide range of tasks, such as
question answering and language inference, without substantial task specific architecture
modifications.[8] In terms of model size, BERT was much bigger than a plain transformer
with a large number of encoder layers, larger feedforward-networks and more attention heads.
It also uses contextual word embeddings instead of fixed embeddings like Glove or word2vec
used earlier. As a result of these, and several other improvements made in BERT, it achieved
new state-of-the-art results on eleven natural language processing tasks, including pushing
the GLUE score to 80.5% (7.7% point absolute improvement).
BERT was trained using two key tasks - Masked Language Model (MLM) and Next
Sentence Prediction (NSP). In a MLM task, 15% of words in text are replaced with the
[MASK] token, and the model is made to predict these missing words. The loss function
only considers predictions for these masked words, and as such the model converges slower
than directional models, however it gains through an increased context awareness. In NSP
the model is given a pair of sentences, and is made to predict if the second sentence is the
next subsequent sentence of the first sentence. 50% of training data is a pair of subsequent
sentences from the corpus while the other half is randomly chosen non-subsequent sentences.
7Figure 2.3: Training BERT as a language model to predict masked words. During the
training process, 15% of words are masked randomly.
This task helps the model understand the relationship between sentences.
2.4 DistilBERT
DistilBERT is a smaller version of BERT developed and open sourced by the team at the
company HuggingFace. It’s a lighter and faster version of BERT that roughly matches its
performance.[10] Knowledge distillation, also referred to as teacher-student learning, is a
compression technique in which a small model is trained to reproduce the behavior of a
larger model. It uses the so-called “dark knowledge” of the model or the uncertainty which
exists when models have non-zero probabilities for incorrect classes in classification problems.
This uncertainty is a measure of the generalizability of the model.
Thus, in such teacher-student training, a student model is trained to mimic the full output
distribution of the teacher network, i.e. its knowledge. Instead of conventional training
8Figure 2.4: Training BERT to predict if the second sentence of the given sentence pairs is
the next subsequent sentence or not.
through cross-entropy over hard targets (one-hot encoded gold class), it is trained through
cross-entropy over soft targets (probabilities of teacher model). This allows for a richer loss
as a single training example enforces much more constraint than a single hard target.[17, 18]
Thus, the training loss can be given by the equation below, where ti are the logits from the
teacher model and si are the logits from the student model, with L representing the training
loss.
L = −Σi (ti ∗ log(si ))
Another parameter, called softmax-temperature was also introduced to expose the mass
of distribution over classes. When T → 0, the distribution becomes a Kronecker and is
equivalent to the one-hot target vector. Whereas, when T → +∞, it becomes a uniform
distribution. The same temperature parameter is applied both to the student and the teacher
at training time, giving more signals for each training example. During inference, T is set to
91 and recover the standard softmax. Thus the modified softmax function can be represented
as shown below, with T being the softmax-temperature, and zi , zj being the activation’s of
the final layer. This gives us the probability distribution among classes as represented by pi .
exp(zi /T )
pi =
Σj (exp(zj /T ))
Distillation loss is computed using the Kullback-Leibler loss since the optimizations are
equivalent. The KL loss is used as a measure of how one probability distribution is different
from the other, and can be calculated using the equation below. Here p and q represent two
probability distributions, between which we are trying to calculate the divergence.
p
KL(p k q) = Ep (log( )) = Σi (pi ∗ log(pi )) − Σi (pi ∗ log(qi ))
q
The overall training loss is a linear combination of the distillation loss (KL loss) and the
masked language modeling loss as seen earlier in training process of BERT.
As shown in the table, DistilBERT’s performances compare favorably with the baseline
(BERT and pre-BERT state of the art models) while having respectively about half and one
third the number of parameters. In terms of inference time, DistilBERT is more than 60%
faster and smaller than BERT and 120% faster and smaller than ELMo+BiLSTM.
No. of parameters Inference time SST-2
Models
(millions) (s) (acc)
Baseline - ELMo + BiLSTM 180 895 91.5
BERT 110 668 92.1
DistilBERT 66 410 92.7
Table 2.1: Comparing the size, inference time and relevant performance metrics of BERT
and DistilBERT with previous SoTA benchmark.
10CHAPTER 3
Sentiment Analysis
Sentiment Analysis, also called Opinion Mining, is one of the most recent research topics
within the field of Information Processing. Facts have an objective component; however,
there are other textual elements which express subjective characteristics. These elements
are mainly opinions, sentiments, appraisals, attitudes, and emotions, which are the focus of
sentiment analysis.
3.1 Types of sentiment analysis
Broadly speaking, sentiment analysis methods can be divided into two main categories -
machine learning approaches and lexicon-based approaches. Machine learning approaches
depend on the selection and extraction of the appropriate set of features used to detect
sentiment. Some of the most important features used are for example: (1) terms (words or
n-grams) and their frequency; (2) part of speech information; (3) negations can change the
meaning of any sentence; and (4) syntactic dependencies (tree parsing). On the other hand,
lexicon-based approaches mainly rely on a sentiment lexicon, i.e., a collection of known and
precompiled sentiment terms, phrases and even idioms, developed for traditional genres of
communication. Two subcategories can be found here: Dictionary-based and Corpus-based
approaches. The former is usually based on the use of an initial set of terms (seeds) that are
usually collected and annotated in a manual way. While, the corpus-based techniques arise
with the objective of providing dictionaries related to a specific domain. These dictionaries
are generated from a set of seed opinion terms that grows through the search of related words
11by means of the use of either statistical or semantic techniques.[6] Depending on whether
the target of study is a whole text or document, one or several linked sentences, or one or
several entities or aspects of those entities, different NLP and sentiment analysis tasks can
be performed. Thus there are three distinct types of sentiment analysis: (i) document level,
(ii) sentence level and (iii) entity/aspect level. Document level considers that a document is
an opinion on an entity or aspect of it. However, if a document presents several sentences
dealing with different aspects or entities, then the sentence level is more suitable. Finally,
when more precise information is necessary, then the entity/aspect level arises. It is the
finest-grained level, it considers a target on which the opinion holder expresses a positive or
negative opinion.[6]
Figure 3.1: Various types of sentiment analysis based upon machine learning or lexicon based
approaches. In this paper, we will be using supervised machine learning approach using a
neural network classifier which is fed by a transformer model.
123.2 Sentiment analysis with Transformers
As mentioned previously, one of the defining features of transformer models is their unique
adaptability towards a variety of NLP tasks, utilizing their vast language model knowledge
through transfer learning. We can add a two layer classifier over the usual transformer
architecture and then train those two layers on a labelled sentiment dataset. One such data
set is the Stanford Sentiment Treebank (SST), which consists of 11,855 single sentences
extracted from movie reviews. These were parsed by the Stanford parser and used to create
a total of 215,154 unique phrases from those parse trees. These phrases were annotated
by 3 human judges into categories. In SST-5 or SST fine-grained, these categories are
positive, somewhat positive, neutral, somewhat negative and negative. While, the binary
SST-2 dataset contains just two categories - (positive and somewhat positive vs negative and
somewhat negative, with neutral phrases discarded).[19]
This dataset has become a benchmark for measuring the performance of language mod-
els on classification tasks and is one of the tasks in the comprehensive General Language
Understanding Evaluation (GLUE) benchmark.[9] Given the generalized nature of the SST
dataset, a model pre-trained on SST can be used directly as a sentiment classifier without
much performance impact. The DistilBERT model is able to achieve approximately 92.7%
accuracy on the SST-2 dataset while BERT achieves 92.1% accuracy on the same dataset.[10]
Figure 3.2: Sentiment analysis setup used in this paper. We have a pre-trained DistilBERT
model, on which we attached a classifier which has been fine tuned on the SST-2 dataset.
This model achieves 92.7% accuracy on the SST-2 dataset and is well suited to serve as a
general purpose binary sentiment classifier in an unsupervised setting.
13CHAPTER 4
Experiments
As discussed above, we used a pre-trained DistilBERT model, with a classifier fine tuned
on the binary SST-2 dataset to classify the sentiment of a given piece of text. The model
output was the probabilities of given text being positive and negative. For our analysis, we
have renamed the probability of the given text having positive sentiment as the “Positivity
score”.
4.1 Covid-19 news dataset
We will use a comprehensive dataset created and maintained by the Global Database of
Events, Language, and Tone (GDELT) project, founded by Kalev Leetaru and Georgetown
University. This daily updated dataset contains over 53.19.77 Mn articles as of Jan 26 2021,
pertaining to Covid-19 coverage in online news media and is accessible publicly through
a Google BigQuery engine. For the purposes of this analysis, we will be looking at 10
newspapers and news portals in the United States to dissect the sentiment in news articles
covering the Covid-19 pandemic from the period starting 1 January 2020 to 31 December
2020. These selected sources are -
• CNN
• New York Times
• Washington Post
14• Los Angeles Times
• National Public Radio
• Fox News
• Breitbart
• New York Post
• Wall Street Journal
• USA Today
These news sources can also be roughly grouped into two categories based on if they lean
politically towards right wing or left wing, as seen in the figure below. Given the vastness
of the political spectrum and the fact that often news organizations try to include articles,
from commentators on both sides of the political divide, this binary classification of political
leaning can be considered an oversimplification. However, as 2020 was a key election year
in the country, the coverage of Covid-19 pandemic was also heavily influenced by political
considerations. By studying and contrasting the sentiment of articles covering the pandemic,
we will be able to better estimate and understand the political bias if any in Covid-19 news
coverage.
4.2 Exploratory analysis
We can start by looking at some of the key features of the dataset we have selected that is
Covid-19 news articles of the aforementioned ten sources for the year 2020.
As we can see in Figure 4.1, some news outlets are way more prolific than others in
sheer volume of articles covering the pandemic. This can be assumed to be the function of
organization size, resources and revenue capacities, all of which may impact the coverage.
15Figure 4.1: Count of articles covering the Covid-19 pandemic from our selected 10 sources,
during the period 1st January 2020 to 31st December 2020
Further, New York Times and Washington Post clearly have the most number of articles
covering the pandemic, while Wall Street Journal has the lowest. This can also be attributed
to the editorial outlook at Wall Street Journal which is more business-focused.
Figure 4.2: Monthly count of articles covering the Covid-19 pandemic in left leaning and
right leaning news outlets
Again, we can see in Figure 4.2 that left leaning news outlets are more prolific. We can
16also see that both right leaning and left leaning media followed the same trend in coverage
throughout the year, as evidenced by their almost parallel lines. The Covid-19 coverage in
the media peaked around April 2020, which was the peak of initial panic and mass hysteria
caused by disease. Also, interestingly the coverage of Covid-19 went up in both right and
left leaning media in October 2020, just before the presidential elections, and has been in
decline since then even as the US faced a record number of cases per day in December.
Figure 4.3: Monthly count of articles covering various sub-topics within the Covid-19 pan-
demic
In the dataset, we also get tags on articles indicating various sub-topics being covered in
the given article. It’s important to note that a given article can cover multiple sub-topics
and thus have multiple tags. In Figure 4.3 we are looking at the count of articles covering
various sub-topics. We can see that articles covering Testing, Prices, Shortages peaked in
April 2020 and have been in decline ever since. However, articles covering Cases show a
double humped curve as has been seen in the actual progression of the Covid-19 pandemic
where an initial summer peak was followed by a stronger fall-winter second wave. Further,
articles covering former President Trump get a spike before the election in October 2020,
around the same time when he himself had contracted the disease.
17News Sources CNN NYT WP LaTimes NPR Fox Breitbart NyPost WSJ UsaToday
Topic tags Left Left Left Left Left Right Right Right Right Right
Cases 6657 13309 12392 6345 6058 7800 4126 2555 2502 5431
China 3364 8219 6683 1717 2030 4758 5731 1943 2109 1905
Covid19 15760 38574 37765 17919 16643 27890 18665 11152 14219 19595
Falsehoods 595 1002 1332 383 330 614 855 207 93 630
Masks 3433 4992 5750 3148 2762 3615 2034 1128 934 3370
Panic 416 669 871 348 256 452 346 224 107 481
Prices 535 1730 1486 501 381 450 375 259 844 678
Quarantine 5823 11403 10372 5388 4365 7254 4885 2791 2673 5343
Shortages 569 928 1177 444 388 504 318 251 230 586
SocialDistancing 2012 2135 2950 1772 1383 2288 1059 648 339 2186
Testing 6919 12469 12848 7024 5795 14546 4768 2948 2678 6756
Trump 6410 9700 16013 3771 4655 10333 7096 1786 2024 5703
Ventilators 672 1044 1178 505 474 656 317 263 165 539
Table 4.1: Comprehensive view of the dataset under consideration with category wise article
count for each news source selected for the analysis
Finally, in Table 4.1 we can look at the comprehensive summary of the dataset, in terms
of the number of articles per individual news source and sub-topic tags. The dataset overall
appears to be somewhat well balanced, with some sub-topics being more popular with certain
news sources than others.
4.3 Overall sentiment analysis
As we can see the overall sentiment around Covid-19 news coverage has been steadily im-
proving, i.e. turning more positive. We are using bootstrap methodology to construct 95%
confidence intervals around the monthly average of sentiment calculated from the data. For
the bootstrap calculation, we are using 1000 iterations and using the 2.5th percentile and
97.5th percentile values to construct the confidence intervals.
As we can see in Figure 4.5, in March, July and August 2020, we can say with 95%
confidence that the coverage of the Covid-19 pandemic was more positive in right leaning
media outlets than in the left leaning media outlets. Overall, we can see that the average
sentiment around Covid-19 coverage has always been more positive in right leaning news
18Figure 4.4: Overall sentiment in Covid-19 news coverage over time, as measured by the
monthly average of ’Positivity score’ or the monthly average probability of the text being
classified as positive by our model.
Figure 4.5: Overall sentiment in Covid-19 news coverage over time grouped by political
leaning of the news sources.
sources, until November 2020, where the trend flipped. This reversal may be related to the
2020 Presidential elections which took place on 4th November 2020.
To further validate the right wing - left wing trend observed before, we look at the most
19Figure 4.6: Overall sentiment in Covid-19 news coverage over time - New York Times vs Fox
News.
prominent right leaning and left leaning news outlets, i.e. New York Times and Fox News.
Due to the non-overlapping confidence intervals, we can conclude with statistical significance
that the coverage of the pandemic by Fox News was much better than the same in New York
TImes in the months of March, April, June, July, August and October 2020. Overall, we
observe that Fox news has consistently had much more positive coverage of the Covid-19
pandemic than the New York Times, and that this trend flipped after the November 2020
elections.
4.4 Sentiment analysis in articles on various sub-topics
We can also look at the sentiment in articles focused on certain sub-topics covered in our
dataset.
204.4.1 Sub-topic : Masks
Throughout the pandemic, we have seen a growing anti-masks movement, especially among
people who politically lean towards the right wing. We can look at the sentiment around
Masks, in Covid-19 news articles to validate this theory with statistical evidence.
(a) Overall sentiment score for articles covering the sub-topic of Masks
(b) Sentiment score for articles covering the sub-topic of Masks, grouped by political leaning of the
news source
Figure 4.7: Sentiment analysis for articles covering the sub-topic of masks.
21As we can see in Figure 4.7 (a), overall, the sentiment around Masks, has been increasing
in Covid-19 related news articles. While the initial rapid rise can be attributed to usage
of masks being encouraged by CDC guidelines, and the after June 2020 the positivity score
appears to have plateaued. In Figure 4.7 (b), we see that only in the month of September
2020, we can conclude that sentiment around masks was significantly better in left leaning
news media as compared to right leaning news media, as evidenced by non-overlapping
confidence intervals. Overall, the general trend has been that average positivity score around
Masks is better left leaning news outlets, though not by statistically significant margins.
4.4.2 Sub-topic : Social Distancing
Another key preventive measure in the fight against Covid-19 has been social distancing.
However, unlike masks the attitudes towards social distancing have not become a point of
contention across political lines.
Figure 4.8 confirms our beliefs that in terms of preventive measures to counter the spread
of Covid-19, social distancing was far less divisive politically than masks. In Figure 4.7 (a)
we can see that overall sentiment around social distancing has remained almost constant
throughout the year. When grouped by political leaning, Figure 4.7 (b), we see that there
is no month where a statistically significant difference in sentiment is present between left
leaning and right leaning news outlets. Lastly, in Figure 4.7 © we are looking at the most
prolific right leaning and left leaning news outlets, Fox News and New York Times, we
again see that for most of the year the average sentiment around social distancing has been
pretty much the same, except for October 2020. This may have been related again with the
presidential elections, where one candidate held socially distanced car based events while the
other held traditional in-person events.
22(a) Overall sentiment score for articles covering the sub-topic of Masks
(b) Sentiment score for articles covering the sub-topic of social distancing, grouped by political
leaning of the news source
(c) Sentiment score for articles covering the sub-topic of social distancing, Fox News vs New York
Times
Figure 4.8: Sentiment analysis for articles covering the sub-topic of social distancing
4.4.3 Sub-topic : Trump
One of the most hotly debated topics during the year 2020 was, whether the federal govern-
ment led by President Trump was able to adequately handle the Covid-19 pandemic. Given
23the highly political nature of this topic, we expect to see significant differences in sentiment
around the sub-topic of Trump, in news articles covering the Covid-19 pandemic from various
sources.
(a) Overall sentiment score for articles covering the sub-topic of Trump
(b) Sentiment score for articles covering the sub-topic of Trump, grouped by political leaning of
the news source
(c) Sentiment score for articles covering the sub-topic of Trump, Fox News vs New York Times
Figure 4.9: Sentiment analysis for articles covering the sub-topic of Trump
As we can see in Figure 4.9, our initial hypothesis of significant divergence in sentiment of
24articles mentioning former President Trump has been sufficiently met. In Figure 4.9 (b) we
can see that the right leaning news media has consistently had much more positive sentiment
than the left leaning news media, in its coverage of President Trump. This difference was
statistically significant during the months of January, March, July and October 2020, at a
95% confidence level. Further, in Figure 4.9 (c ) on comparing the most prominent news
outlets on both sides of the political divide, we again observe that the coverage around Pres-
ident Trump was significantly more positive in Fox News than New York Times. Again, we
observe a statistically significant difference, as evidenced by the non-overlapping confidence
intervals was present during the months of March, June and October 2020.
4.4.4 Sub-topic : China
Another bone of contention during the year 2020, has been the attitude towards China. Its
widely documented that the pandemic began in China, with the first major outbreak being
reported in the city of Wuhan. However, it’s believed that after some initial subterfuge
regarding the extent of the outbreak, China was able to successfully control and stem the
spread of the pandemic within its borders. In the United States media, the general sentiment
towards China suffered greatly especially early on in the pandemic, but has been recovering
since then.
As we can see in Figure 4.10 (a), the sentiment in articles mentioning China has been
steadily recovering in the online news articles, from the harm suffered early on in the pan-
demic. The widening confidence intervals towards the later half of the year suggest that the
number of articles containing China have been declining leading to a greater variance in the
monthly average positivity scores. Looking at the news sources, grouped by political leaning
we observe that sentiment towards China has undergone multiple shifts. While early on
in the pandemic right leaning media was more negative on China, it became more positive
around the months of July and August, and went back to being more negative in September.
A similar crisscross trend is also observed when directly comparing sentiment in articles from
25(a) Overall sentiment score for articles covering the sub-topic of China
(b) Sentiment score for articles covering the sub-topic of China, grouped by political leaning of the
news source
(c) Sentiment score for articles covering the sub-topic of China, Fox News vs New York Times
Figure 4.10: Sentiment analysis for articles covering the sub-topic of China
Fox News and New York Times. Overall we can conclude that the sentiment towards China
shows no sustained significant differences between right leaning and left leaning news outlets.
264.5 International Sentiment
We can also look at the sentiment in news outlets from other English speaking countries and
compare the same to that observed in news outlets from the US. For our analysis we will be
considering two other English speaking countries which are culturally and socio-economically
very close to the United States - United Kingdom and Australia. Within these countries
we have selected the following news outlets for comparison against the 10 news outlets from
United States -
News Outlet Country Political Leaning
The Guardian United Kingdom Left
The Independent United Kingdom Left
Daily Mail United Kingdom Right
Sydney Morning Herald Australia Left
Daily Telegraph Australia Right
The Australian Australia Right
Table 4.2: News sources from Australia and United Kingdom selected for comparison with
the ones from United States.
Another important factor aiding in the selection of Australia and the United Kingdom
is that both these countries like the United States had a right wing government in charge
for the whole of 2020, with Boris Johnson in UK and Scott Morrison in Australia being
the respective heads of state. However unlike the US, UK and Australia did not have any
elections during 2020. Still, we can expect right leaning media to be more accommodating
of governments efforts to control the Covid-19 pandemic in both the United Kingdom and
Australia, just like the US.
274.5.1 Overall Sentiment - US vs UK vs Australia
We can start by comparing the overall sentiment in Covid-19 news coverage in the UK and
Australia as against what we have observed in the US.
Figure 4.11: Overall sentiment in Covid-19 news coverage over time - comparison between
US, UK and Australia.
As we can see above, overall the sentiment in Covid-19 news coverage has been much
more positive in Australia as compared to the United Kingdom and the United States. This
reflects the fact that Australia also has been much more successful in stemming the spread
of the disease, than the US and UK. For the United Kingdom, the sentiment was much more
positive during the initial spread of the disease during Summer of 2020, and decreased during
the second wave of the pandemic in Fall - Winter of 2020. This makes sense as the second
wave of the pandemic has proven to be more deadly than the initial outbreak in summer,
especially with the appearance of mutant, more infectious strains in the UK. On the other
hand, in the US the sentiment has steadily improved through the year 2020, even though
like the UK, the second wave of the pandemic was much more deadlier.
28Figure 4.12: Sentiment grouped by political leaning in Covid-19 news coverage over time,
comparison between US, UK and Australia
4.5.2 Sentiment grouped by political leaning
In Figure 4.12, we can observe that overall, Australia’s both right and left leaning news
media outlets have been more positive in their coverage of the Covid-19 pandemic than
their counterparts in the US and UK, especially in the last couple of months of 2020. This
corroborates well with our earlier observation on Australia being much more successful in
dealing with the pandemic than most other countries of the world. In the UK, we also
observe that the right leaning news media has had a much more positive sentiment in the
Covid-19 news coverage than the left leaning news outlets. This is similar to the behavior
we had witnessed earlier in our analysis of the United States.
29CHAPTER 5
Conclusion
The objective of this paper is to use the tools of sentiment analysis to objectively analyze
the coverage of the Covid-19 news articles in news outlets. We started with analyzing the
sentiment of all articles related to Covid-19 appearing in the selected 10 US news outlets
from the period of 1st January 2020 to 31 December 2020. We found that the sentiment as
measured by the positivity score, has steadily been increasing in the news coverage in spite
of the rapid rise in cases observed during the last few months of the year during the second
wave of the pandemic. This improving sentiment can be linked to the rapid progress made in
the process of vaccine development, along with a general atmosphere of indifference towards
the pandemic due to the so-called pandemic fatigue. Next, we looked at these same articles
but grouped them based on whether the news source is considered to be a “right leaning”
news organization or a “left leaning” news organization. Looking at the monthly average
positivity score in these two groups, we concluded that right leaning news outlets had more
positive sentiment in covering the Covid-19 pandemic than left leaning news outlets. This
difference was statistically significant in the months of March, July, August and October
2020 at 95% confidence level. On comparing the most prominent right leaning and left
leaning news outlets, we observe a similar trend where the coverage of the pandemic was
more positive in Fox News than in the New York Times. This difference was also statistically
significant at the 95% level in the months of March, April, June, July, August and October
2020. Thus, we can conclude that there has been significant bias in reporting around the
Covid-19 pandemic where right leaning news outlets have reported on the pandemic with
more positive sentiment than their left leaning counterparts. Given that the pandemic in
302020 took hold under the administration of a Republican president and during an election
year, this bias in reporting is along expected lines.
Next, we looked to analyze the sentiment around various topics associated with the Covid-
19 pandemic. These include preventive measures like masks and social distancing, whose
use has unfortunately been politicised in the US, along with more contentious and divisive
topics like former President Trump and China. These sub-topic based sentiment analysis
were used to analyze and quantify any possible bias in news reports around the Covid-19
pandemic, which mention these sub-topics. We started with news articles mentioning masks,
and observed that the overall sentiment in news articles mentioning masks has been steadily
increasing. Looking at news outlets grouped by their political leanings, we observe that
only for October 2020, we can conclude that sentiment around masks was more positive
in left leaning news outlets than right leaning news outlets by a statistically significant
margin. For the rest of the year, while average monthly sentiment on masks remained more
positive in left leaning outlets than their right leaning counterparts, the difference was not
large enough to be statistically significant. Unlike the previous case, this analysis does not
provide enough evidence to help conclusively prove the theory that right leaning news outlets
have consistently against use of masks as we have statistically significant results in only one
month.
Similarly, we looked at the sentiment in articles mentioning social distancing. Here we
found that the sentiment has been almost constant throughout the year, and shows no
noticeable difference between the left leaning and right leaning news outlets or even between
Fox News and New York Times. We only noticed a sudden spike in sentiment around
social distancing in the New York Times in October 2020, which may be attributed to
the Presidential elections where political events and polling processes were generating some
minor debate around the issue. Next we looked at the more divisive issue of sentiment in
articles mentioning former President Trump. Here we observed that overall, after an initial
dip, sentiment in articles mentioning Trump had been steadily becoming more positive.
31Furthermore, on grouping news outlets by political leanings, we observed that right leaning
news media had more positive sentiment in articles mentioning Trump than left leaning news
media. This difference was statistically significant in January, March, July and October 2020
at 95% confidence level. On repeating the same experiment with just Fox News and New
York Times, we notice that a statistically significant difference in sentiment is observed in
March, June and October 2020. Thus, we can conclude through our analysis that right
leaning media has had more positive sentiment in their Covid-19 news coverage when they
mention President Trump, as compared to left leaning media. This confirms our intuitive
hypothesis where we would expect President Trump to get favourable coverage in right
leaning news outlets due to his political affiliation to the Republican party.
Lastly, we also looked at sentiment in news articles in the United Kingdom and Australia,
in order to compare them with those observed here in the United States. Apart from being
English speaking western high-income democracies, both the UK and Australia were also
under the leadership of right wing governments during 2020. This not only allowed us to
compare sentiment in coverage of Covid-19 pandemic in three similar countries, but also
provided us an opportunity to compare the relative political bias in news reporting in these
three countries. We observed that overall, the sentiment in Australia was much more positive
than the UK or the US, which makes sense as Australia has done much better than the other
two countries in stemming the spread of the pandemic within its borders. Peculiarly, in the
UK the sentiment became more negative as the second wave of the pandemic took hold in
the country in winter of 2020. This is in sharp contrast to the US where overall sentiment
around Covid-19 kept becoming more positive throughout the year even as the second/third
wave of the pandemic proved to be much more deadly. This indicates that the news coverage
of the pandemic in the UK was more closely correlated with the cases count and deaths from
the pandemic, when compared with the US. Similarly, looking at the sentiment grouped
by political leaning of news outlets in these three countries we see similar trends where
the right leaning media is much more positive in its coverage of the pandemic than their
32left leaning counterparts. This result is expected, since as we have previously explained,
all three countries were under the leadership of right wing governments throughout 2020.
Furthermore, the difference in sentiment between right leaning and left leaning news outlets
is statistically significant in all three countries, confirming the presence of political bias in
news reporting in each of them.
5.1 Future Work
In this work we have been able to confirm the presence of political bias in coverage of the
Covid-19 pandemic. The next step in this process will be to detect the presence of other
kinds of bias in news articles. Using the powerful language modelling capabilities of latest
transformer models, we can build machine learning systems which can detect discrimination
based on upon race/sex/religion etc. Such applications of machine learning systems can
make the world more equitable to people from diverse backgrounds while raising the quality
of discussions in public life. We can also expand this current work to include more news
outlets and countries in the analysis, while keeping the analysis up to date and publicly
available to ensure that the general public is always aware of any hidden biases present in
the news content they are consuming.
33REFERENCES
[1] ILO, FAO, IFAD, and WHO. Impact of covid-19 on people’s livelihoods, their health and
our food systems. www.who.int/news/item/13-10-2020-impact-of-covid-19-on-people’s-
livelihoods-their-health-and-our-food-systems, 10 2020.
[2] Mark Jurkowitz, Amy Mitchell, Elisa Shearer, and Mason Walker. U.s. media polariza-
tion and the 2020 election: A nation divided. Pew Research Center, 01 2020.
[3] Joanna Piacenza. News media credibility rating falls to a new low.
https://morningconsult.com/2020/04/22/media-credibility-cable-news-poll/, 04 2020.
[4] Kim HK, Ahn J, Atkinson L, and Kahlor LA. Effects of covid-19 misinformation on
information seeking, avoidance, and processing: A multicountry comparative study.
Science Communication, 09 2020.
[5] Matt Motta1, Dominik Stecula, and Christina Farhart. How right-leaning media cov-
erage of covid-19 facilitated the spread of misinformation in the early stages of the
pandemic in the u.s. Canadian Journal of Political Science, 05 2020.
[6] Jesus Serrano-Guerrero, Jose A. Olivas, Francisco P. Romero, and Enrique Herrera-
Viedma. Sentiment analysis: A review and comparative analysis of web services. In-
formation Sciences, 08 2015.
[7] Xing Fang and Justin Zhan. Sentiment analysis using product review data. Journal of
Big Data, 06 2015.
[8] Jacob Devlin, Ming-Wei Chang, Kenton Lee, and Kristina Toutanova. Bert: Pre-
training of deep bidirectional transformers for language understanding, 2019.
[9] Alex Wang1, Amanpreet Singh, et al. Glue: A multi-task benchmark and analysis
platform for natural language understanding. ICLR 2019, 06 2019.
[10] Victor Sanh, Lysandre Debut, Julien Chaumond, and Thomas Wolf. Distilbert, a dis-
tilled version of bert: smaller, faster, cheaper and lighter, 2020.
[11] David M. Blei, Andrew Y. Ng, and Michael I. Jordan. Latent dirichlet allocation.
Journal of Machine Learning Research, 03 2003.
[12] Yoshua Bengio, Réjean Ducharme, Pascal Vincent, and Christian Jauvin. A neural
probabilistic language model. Journal of Machine Learning Research, 03 2003.
[13] Sepp Hochreiter and Jiirgen Schmidhuber. Lstm can solve hard long time lag problems.
NIPS 1996, 06 1996.
34[14] Kyunghyun Cho, Bart van Merrienboer, Caglar Gulcehre, Dzmitry Bahdanau, Fethi
Bougares, Holger Schwenk, and Yoshua Bengio. Learning phrase representations using
rnn encoder-decoder for statistical machine translation, 2014.
[15] Dzmitry Bahdanau, Kyunghyun Cho, and Yoshua Bengio. Neural machine translation
by jointly learning to align and translate, 2016.
[16] Ashish Vaswani, Noam Shazeer, Niki Parmar, Jakob Uszkoreit, Llion Jones, Aidan N.
Gomez, Lukasz Kaiser, and Illia Polosukhin. Attention is all you need, 2017.
[17] Geoffrey Hinton, Oriol Vinyals, and Jeff Dean. Distilling the knowledge in a neural
network, 2015.
[18] Cristian Bucila, Rich Caruana, and Alexandru Niculescu-Mizil. Model compression.
In Tina Eliassi-Rad, Lyle H. Ungar, Mark Craven, and Dimitrios Gunopulos, editors,
Proceedings of the Twelfth ACM SIGKDD International Conference on Knowledge Dis-
covery and Data Mining, Philadelphia, PA, USA, August 20-23, 2006, pages 535–541.
ACM, 2006.
[19] Richard Socher, A. Perelygin, J.Y. Wu, J. Chuang, C.D. Manning, A.Y. Ng, and
C. Potts. Recursive deep models for semantic compositionality over a sentiment tree-
bank. EMNLP, 1631:1631–1642, 01 2013.
35You can also read