CRUCIAL ENERGY CHOICES IN BELGIUM - AN INVESTIGATION OF THE OPTIONS - OUR ENERGY FUTURE - Squarespace
←
→
Page content transcription
If your browser does not render page correctly, please read the page content below
CRUCIAL ENERGY CHOICES IN BELGIUM -
AN INVESTIGATION OF THE OPTIONS
OUR ENERGY FUTURE
CRUCIAL ENERGY CHOICES IN BELGIUM - AN
                        INVESTIGATION OF THE OPTIONS
                        OUR ENERGY FUTURE

                        Client:                         Greenpeace, BBL, WWF

                        Contact Person:                 Jan Vande Putte, Sara Van Dyck, Jan Vandermosten

                        3E Reference:                   PR107308

                        3E Contact Person:              Jan De Decker, Antoon Soete, Aurore Flament

                        Date:                           25/06/2014

                        Version:                        Final version

                        Classification:                 Confidential

                           Under the General Terms and Conditions of 3E, the client receives the non-exclusive, non-
                           transferable right to use the results reported to him by 3E for internal use only. Unless otherwise
                           explicitly agreed upon, 3E cannot be held responsible or liable for consequences of the use by the
                           client of the results, reports, recommendations or other data supplied by 3E in the frame of any
                           project or order executed by 3E.

info@3E.eu   3E nv/sa                     T +32 2 217 58 68       Fortis Bank 230-0028290-83   RPR Brussels
www.3E.eu    Rue du Canal 61              F +32 2 219 79 89       IBAN: BE14 2300 0282 9083    VAT BE 0465 755 594
             B-1000 Brussels                                      SWIFT/BIC: GEBABEBB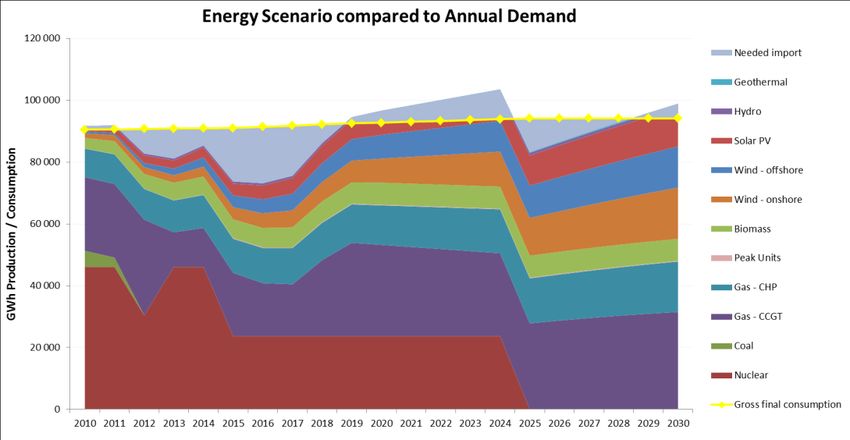
TABLE OF CONTENTS

                               Table of contents                                                                 3

                               1     Introduction and Objectives                                                 4
                                     1.1 Context                                                                  4

                                     1.2 What this study adds to the debate                                       4

                                     1.3 Target questions to be answered                                          5

                                     1.4 Limits of this study                                                     5

                               2     Methodology and Assumptions                                                 7
                                     2.1 Explanation of the models used                                           7

                                       2.1.1     General methodology                                              7
                                       2.1.2     The accounting model for the electricity sector                  8
                                       2.1.3     The investment analysis model                                    8

                                     2.2 Scenarios                                                               11

                                       2.2.1     The Reference scenario                                          11
                                       2.2.2     The Alternative scenario                                        12

                                     2.3 Other important assumptions                                             16

                                       2.3.1     Energy price scenarios                                          16
                                       2.3.2     Investment parameters                                           18

                               3     Results and Sensitivity Analysis                                            20
                                     3.1 The power of time                                                       21

                                       3.1.1     The period up to 2030                                           21
                                       3.1.2     The next five years                                             30

                                     3.2 The power of Energy Efficiency                                          31

                                     3.3 The power of technology                                                 33

                               4     Conclusions and Recommendations                                             38

info@3E.eu   3E nv/sa              T +32 2 217 58 68       Fortis Bank 230-0028290-83      RPR Brussels
www.3E.eu    Rue du Canal 61       F +32 2 219 79 89       IBAN: BE14 2300 0282 9083       VAT BE 0465 755 594
             B-1000 Brussels                               SWIFT/BIC: GEBABEBB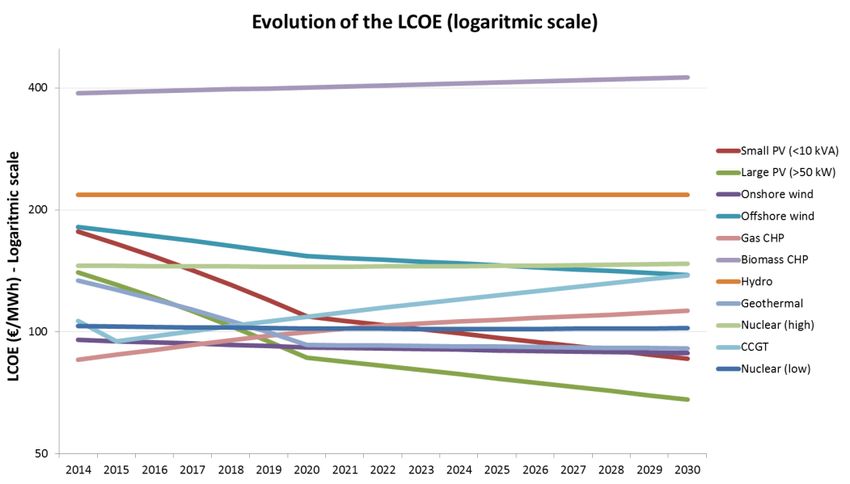
1        INTRODUCTION AND OBJECTIVES

                          1.1        CONTEXT

                          Belgium is at a critical turning point in its energy history. Our country is indeed facing several
                          challenges that are creating issues of security of supply, sustainability, costs and risks. With the
                          nuclear safety issue and the phase-out plan, and with the anticipated decreasing generation adequacy
                          margin, it is now time to make some crucial energy choices.

                          Greenpeace, BBL and WWF want to make sure that these choices are future-oriented. They therefore
                          commissioned 3E to analyse possible energy scenarios for the future with a special focus on the
                          electricity sector and energy efficiency, and see what is needed to develop a safe, secure, affordable
                          and sustainable energy future. This study is also meant to initiate the important discussion on
                          Belgium’s energy choices for the future.

                          This report presents the work on the electricity sector. The other parts will be published in a later
                          phase.

                          1.2        WHAT THIS STUDY ADDS TO THE DEBATE

                          3E has developed a detailed model of the Belgian electricity sector. Starting point is the investor's point
                          of view. For each technology - renewable as well as conventional technologies - a business model has
                          been worked out that incorporates a broad spectrum of technical, financial and economic parameters
                          (see Chapter 2 for a detailed description of the model). As a consequence this model is very flexible
                          when it comes to impact assessment and sensitivity analysis of one or more parameters.

                          One of the important outputs of the 3E model is an estimation of the Levelised Cost of Electricity
                          (LCOE) for the different generating technologies. Since the electricity price is also explicitly integrated
                          in the model, it furthermore allows for assessing the volume of subsidies that is required to realise
                          these investments. Moreover the model also takes into account the distribution cost of solar PV
                          systems.

                          Combining all these elements together enables policy makers to assess the impact of different
                          parameters on the required subsidy levels. Examples of what this means are given in the next section.

                          Furthermore the model has included some important checks to make sure that the outcomes of the
                          model make sense. The two most obvious examples are in what extent the energy system is able to
                          meet the peak demand and the annual energy demand (also taking into account the comparison
                          between the required electricity imports and the available interconnection capacity at transmission
                          level).

                          To summarize the 3E model will provide consistent outcomes both at micro as well as at macro-level.
                          There are of course other models available and some studies have been published in recent years (eg.
                          “Prospectieve studie” from FOD Economy & Planbureau1, Climact/Vito2 and work from Itinera3). These

                          1
                              Studie over de perspectieven van elektriciteitsbevoorrading tegen 2030, FOD Economy & Planbureau, August 2013,
                          Available online
                          http://economie.fgov.be/nl/ondernemingen/energie/elektriciteit/Prospectieve_studie_elektriciteit/#.U6l2cv5j3Eg

Crucial Energy Choices in Belgium - An Investigation of the Options                                FINAL VERSION                 4 / 42
Our Energy Future                                                                                  CONFIDENTIAL
PR107308 – 25/06/2014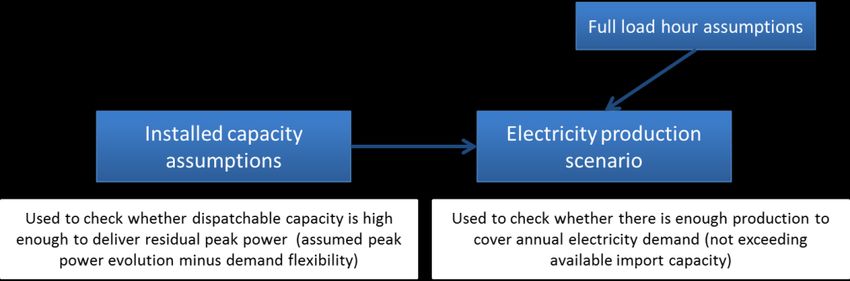
models all address specific aspects of the Belgian electricity system but none incorporates all
functionalities that are described above. Compared to more sophisticated models like e.g. TIMES and
PRIMES, the 3E model allows for direct assessments of specific measures whereas for these cost
optimizing models it is not always clear how to evaluate the outcome of these models. Where possible
and relevant, assumptions and other inputs have been based on these studies to ensure maximum
coherence and allow for comparisons.
Finally, the 3E model is as up to date as possible, including for example the outages of Doel 3 and
Tihange 2.
1.3 TARGET QUESTIONS TO BE ANSWERED
As mentioned above, the flexibility of the model allows for multiple sensitivity analyses, in order to
come up with robust recommendations. With this model, Greenpeace, BBL, WWF and others can track
concrete realisations over the next years and can quickly react to market changes or upcoming policy
questions.
The model is built to help answering the following type of questions:
What impact will higher fuel or CO2 prices have on the total required subsidies for renewables?
In how far can a stable policy and supporting framework (i.e. lower WACC for a certain
technology) reduce the total costs for the consumer?
How will renewable energy in Belgium reduce the dependency on fossil fuels and the risk of fuel
price increases?
What are the most cost-efficient technologies, and how does the LCOE of the different
technologies relate to each other?
How do the LCOE values change over time?
Is it more interesting to delay large-scale investments in some technologies with a few years until
they are cheaper?
What is the impact of net metering for PV systems (‘terugdraaiende teller’) on investment
decisions and required subsidies?
How much biomass can be used in the electricity system in a sustainable way?
This final report discusses and elaborates these questions based on the modelling results. This is
accompanied by some calculations where needed, in order to develop a set of sound
recommendations to support the Belgian policy makers in making well-founded future-oriented
decisions.
1.4 LIMITS OF THIS STUDY
The present study uses an accounting model for the electricity sector. It is not an optimisation model
that arranges the available installations in the merit-order curve and calculates for each hour which
2
D. Devogelaer, J. Duerinck et al. Towards 100% Renewable Energy in Belgium by 2050, April 2013
M. Cornet, J. Duerinck et al., Scenarios for a Low Carbon Belgium by 2050, November 2013
3
Johan Albrecht, 2014-2019: Diagnose en prioriteiten: Energy Security First!, Itinera Institute Verkiezingsreeks 2014,
March 2014, Available online
Crucial Energy Choices in Belgium - An Investigation of the Options FINAL VERSION 5 / 42
Our Energy Future CONFIDENTIAL
PR107308 – 25/06/2014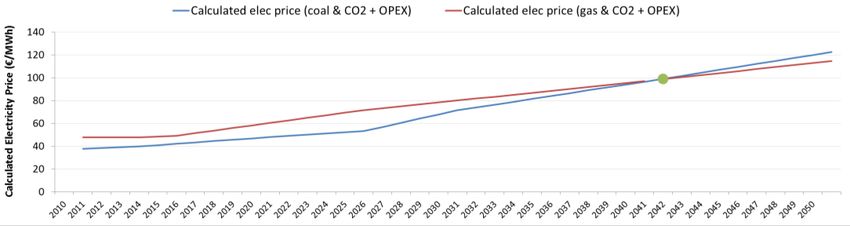
installations need to deliver how much energy. This is on the one hand good because it is more clear
                          what the impact of each parameter is and it is not a black box model where the results are hard to
                          analyse and understand. On the other hand, this means that the input data is more rough (yearly
                          resolution) and assumptions need to be made about e.g. full load hours and electricity prices. These
                          assumptions are not directly linked to the inputs of fuel prices, as they would be in an optimization
                          model.

                          In general, this is a good method for the period up to 2030 since the important things are the trends
                          and evolutions, and furthermore the internal sanity checks of the model (see further) are adequate for
                          analysing this time period. Moreover, the impact of the assumptions is assessed with sensitivity
                          analysis in order to make more robust conclusions.

                          When checking possible issues in the electricity system for the next five years, this method is not
                          sufficient. The yearly resolution and a lack of detailed public information make it impossible to
                          accurately do this. However, even though the model was not built for that reason, it can already give
                          some rough indications and useful insights.

Crucial Energy Choices in Belgium - An Investigation of the Options                         FINAL VERSION              6 / 42
Our Energy Future                                                                           CONFIDENTIAL
PR107308 – 25/06/2014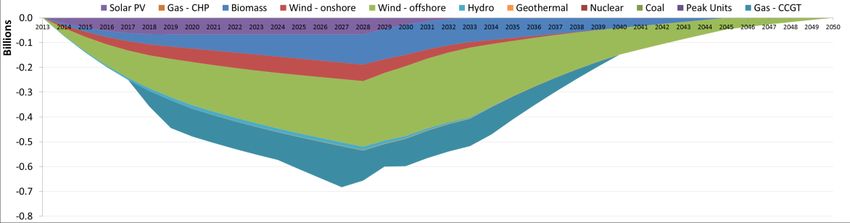
2       METHODOLOGY AND ASSUMPTIONS

                          2.1        EXPLANATION OF THE MODELS USED

                          2.1.1        General methodology
                          For the purpose of this study, 3E developed an accounting model of the Belgian energy system
                          coupled with an investment analysis model. An energy efficiency analysis has also been performed.
                          The focus is on renewable energy in the electricity sector and energy efficiency in the built
                          environment. Both a micro- and a macro-economic approach are used.

                          The combination of the accounting model and the investment analysis model leads to absolute
                          estimates about the total energy consumption, the related costs, the CO 2 emissions, the required
                          investments and subsidies, etc. In addition, and more importantly, this leads to important insights from
                          the relative comparison of the scenarios, showing the impact of possible policy choices in terms of
                          costs and benefits, RE and EE targets, CO2 emissions, jobs, etc.

                          The above mentioned models have been developed starting from the research done by 3E in several
                          previous studies like e.g. the assessment of the required subsidies for renewable energy in the Walloon
                          and Flemish regions4, and several studies on energy efficiency. Furthermore, they have been built
                          using data and results of other studies investigating Belgium energy scenarios; in particular the Energy

                          4
                              Steunmechanismen voor de productie van groene stroom en WKK, analyse, aanpassingsvoorstellen en
                          beleidsaanbevelingen, 3E for VEA, July 2011, http://www.energiesparen.be/evaluatie_steunmechanismen

                          Report for the Walloon Government (SPW DG04), 2013, not published yet.

Crucial Energy Choices in Belgium - An Investigation of the Options                            FINAL VERSION               7 / 42
Our Energy Future                                                                              CONFIDENTIAL
PR107308 – 25/06/2014
Roadmap 2050 (2011)5, the Vito/ICEDD/Federaal Planbureau study (2013)6 , the study of the FOD
Economy and the Federal Planning Bureau (2014)7 and the Climact study (2013)8.
The present report only covers the results of the electricity sector. The rest of the work will be published
later.
2.1.2 The accounting model for the electricity sector
The accounting model is the general model used in this study for the overall energy balance (to be
published later). The accounting model for the electricity sector is part of this, and simulates the
evolution of the Belgian electricity system. The model uses assumptions for installed capacity, full load
hour and electricity and fuel prices. Based on the installed capacity and the annual full load hour
assumptions, an electricity production scenario is calculated (Figure 1). By allowing the selection of
different source scenarios, analysis of the future electricity system can be performed.
The benefit of the accounting model is that it allows checking the internal coherence of the energy
system, comparing the energy demand with the required import, and the installed dispatchable capacity
with the residual peak demand (after flexibility is used but with reserve margin). Since it is meant
primarily to investigate options for the future (period up to 2030), it works with an annual resolution.
Figure 1: Key methodology of the accounting model: The electricity production scenario is
developed based on assumptions of installed capacity and annual full load hours per
technology. Checking peak power and total energy demand provision ensures that the results
make sense.
All parameters, assumptions and scenarios in the accounting model can be changed and tested very
easily, allowing for flexible and quick analysis possibilities.
2.1.3 The investment analysis model
The investment model that is used in combination with the accounting model is building on research
done by 3E for the Flemish Energy Agency and the Walloon Government9 . For all electricity production
5
European Commission, Energy Roadmap 2050, Impact Assessment, December 2011
6
Vito, ICEDD, Federaal Planbureau, Towards 100% renewable energy in Belgium by 2050, April 2013.
7
FOD Economie, Federaal Planbureau, Studie over de perspectieven van elektriciteitsbevoorrading tegen 2030, 2014
8
Climact,Vito, Scenarios for a Low Carbon Belgium by 2050, November 2013
Crucial Energy Choices in Belgium - An Investigation of the Options FINAL VERSION 8 / 42
Our Energy Future CONFIDENTIAL
PR107308 – 25/06/2014technologies analysed in this study, a business model is developed taking into account all relevant
financial parameters (CAPEX, OPEX, WACC, tax regime, construction length etc.). Also these
parameters can be adapted easily in the model to allow for quick and detailed sensitivity analysis. The
exercise is done for both renewable and conventional technologies. Learning curves for CAPEX are
implemented, as are efficiency improvements over the years. The model enables to determine for
example how much subsidies are required in order to allow developers to get an adequate return on
investment.
Parameters taken into account
For each technology, the following elements have been taken into account in the profitability analyses:
Investment costs (CAPEX), in nominal terms
Operating revenues composed of:
the grey electricity revenues coming from the auto-consumption of electricity generated on
site
the revenues coming from the injection of residual electricity produced on the grid
the revenues from heat sold for the technology if applied (e.g. CHP)
Operating costs:
O&M (operational and maintenance) costs, obtained applying a percentage of the
investment costs, in nominal terms
Grid injection costs, in nominal terms
Fuel costs, in nominal terms
CO2 emission costs, in nominal terms: the CO2 emission factor considered for natural gas
is of 0.202 tCO2/MW produced.
EBITDA (Earnings before Interest, Taxes, Depreciation, and Depreciation): computed as the
operating revenues minus the operating costs.
Depreciation: based on the linear depreciation principle, with a depreciation period equal to the
operation length of the technology.
EBIT (earnings before interest): calculated as the EBITDA minus the depreciation.
Ratio Financial expenses / revenues: cash flows are discounted based on a discount rate that
takes into account the cost of debt and cost of equity; the ratio of financial expenses/revenues is
not calculated explicitly.
Profit before tax: corresponds to the EBIT minus the financial expenses / revenues ratio.
Tax: a tax rate of 33.99 % is considered. The tax base is calculated as the earnings before tax
less the deduction for investment, less the notional interests’ deduction, less the tax burden that
can be carried forward in time.
Profit before tax: corresponds to the EBIT minus the financial expenses / revenues.
Deduction for investment: computed according to the applicable rate of deduction for
investment (15.5 % of the eligible investments).
9
Steunmechanismen voor de productie van groene stroom en WKK, analyse, aanpassingsvoorstellen en
beleidsaanbevelingen, 3E for VEA, July 2011, http://www.energiesparen.be/evaluatie_steunmechanismen
Report for the Walloon Government (SPW DG04), 2013, not published yet.
Crucial Energy Choices in Belgium - An Investigation of the Options FINAL VERSION 9 / 42
Our Energy Future CONFIDENTIAL
PR107308 – 25/06/2014 Notional interests’ deduction: because the notional interest deduction is not directly linked to
investments in renewable energy, the financial calculation does not take it into account (only
costs and revenues generated directly by the project are considered).
The deferred tax liabilities: if for a given year the tax base does not cover the depreciation of
the investment, the tax benefit is deferred to the following year.
Profit after tax: calculated as earnings before taxes minus the taxes.
Operational cash flows: computed as profit before tax plus the total depreciation (which are not
cash).
Free cash flows: computed as the cash flows minus the CAPEX (investment costs). The CAPEX
is spread over the construction length of the technology, starting in year 0, and the operational
cash flows in the years that follow (1 to n).
Discount rate: equals to the WACC (in nominal terms) of each technology.
Discounted cash flows: equal to the free cash flows corrected by the discount rate.
Measuring costs and required subsidies: LCOE and NPV
The profitability of each technology is in this project measured with the following two main indicators:
NPV (Net Present Value): sum of the cash flows of the technology discounted on an annual
basis. The net present value is the value of an investment, given the cash flows of the project:
NPV = Σ CFt / (1 + WACC)^t
Where NPV is the net present value, CFt the annual cash flows, WACC the weighted average
cost of capital suggested, t (from 0 to n), where n is the last year of operation of the installation.
A positive NPV indicates that the technology generates added value, above the required return to
compensate for the financing costs. A negative NPV means that the project requires subsidies in
order to get the required return on investment.
LCOE (Levelized Costs of Electricity): is a metrics calculating the cost of electricity produced by a
generator, or said differently, the price at which electricity should be sold to break even over the
lifetime of the technology. The following expression for the computation of the LCOE is used,
given by [IEA/NEA 2010] (p.34)10:
The factors influencing the LCOE apart from the different costs are the discount rate and the load
factor (which determines the amount of electricity produced per year).
10
IEA and OECD/NEA, Projected Costs of Generating Electricity: 2010 Edition, 2010, Paris
Crucial Energy Choices in Belgium - An Investigation of the Options FINAL VERSION 10 / 42
Our Energy Future CONFIDENTIAL
PR107308 – 25/06/20142.2 SCENARIOS
For this study of the Belgian electricity sector, two main scenarios have been developed. As mentioned
above, the analysis of these scenarios is then complemented by several sensitivity analyses.
To be as coherent as possible with other studies, all parameters and assumptions are based as much
as possible on data found in other literature.
2.2.1 The Reference scenario
A reference scenario is determined to start with. This scenario is not intended to predict the most
probable or best evolution of the energy system, but to serve as a reference to evaluate different
options for the future.
In order to allow for comparisons, the Reference scenario has been based on the Reference scenario
Nuc-1800 in the 2014 Prospective Study11. The installed capacities assumed in this scenario are
shown in Table 1. The full load hour assumptions used for this study have been calculated based as
much as possible on the information about electricity production and installed capacity in the
Prospective Study. For some technologies, the full load hours have been changed slightly in order to
meet the requirements for peak power and annual energy demand and make sure the system can work
in a stable way.
Table 1: Installed capacities in the Reference scenario
Electricity Demand scenario 2010 2020 2030
Gross Final Consumption 90 400 97 510 105 180 GWh
Peak demand 13 845 14 860 15 730 MW
Capacity scenario 2010 2020 2030
Nuclear 5 943 4 098 0 MW
Coal 1 071 0 0 MW
Peak Units 491 768 128 MW
Gas - CCGT 4 085 7 197 10 310 MW
Gas - CHP 1 848 2 557 3 265 MW
Biomass 935 1 430 1 924 MW
Wind - onshore 691 2 400 3 458 MW
Wind - offshore 195 2 200 2 860 MW
Solar PV 1 055 2 808 2 808 MW
Hydro 119 100 130 MW
Geothermal 0 0 0 MW
Pumped Hydro Storage 1 307 1 307 1 307 MW
Import 3 500 6 500 6 500 MW
Demand Flexibility 504 541 573 MW
The following details are worth mentioning about the Reference scenario:
The earlier than expected unforeseen outages of the nuclear plants Doel 3 and Tihange 2 are not
integrated in the Reference scenario based on the 2014 Prospective Study. Since the Reference
scenario is mainly used to compare and analyse results on the longer-term (period up to 2030),
this is thus not a big issue for the analysis meant in this study.
11
Studie over de perspectieven van elektriciteitsbevoorrading tegen 2030, FOD Economy & Planbureau, August
2013, Available online
http://economie.fgov.be/nl/ondernemingen/energie/elektriciteit/Prospectieve_studie_elektriciteit/#.U6l2cv5j3Eg
Crucial Energy Choices in Belgium - An Investigation of the Options FINAL VERSION 11 / 42
Our Energy Future CONFIDENTIAL
PR107308 – 25/06/2014 The Prospective Study of the FOD Economy and the Federal Planning bureau was partly
developed in 2010 already, before the big boom in solar PV in Belgium. The Nuc-1800 scenario
on which the Reference scenario is based, assumes an installed capacity for PV of 1700 MW in
2020 and 1924 MW in 2030. Today, installed capacity of solar PV already surpassed these
figures by far, amounting to a total installed capacity of about 2800 MW.
To be in line with the Prospective Study as much as possible, the Reference scenario assumes
no further growth for PV above this 2800 MW.
The renewable energy scenarios in the Prospective Study all assume a large role for biomass.
However, as will be discussed further in this study, the assumptions presented in the Prospective
Study exceed the available amount of sustainable biomass, and thus don’t comply with
sustainability criteria.
Electricity interconnection capacity plays a large role in any scenario for Belgium. Currently there
is about 3500 MW of interconnection available to support the Belgian power system. For the
future, the plans and scheduling by Elia has been followed in the scenario: 1000 MW on the
Northern boundary by 2016, 1000 MW for the Nemo cable to Great Britain by 2018, and 1000
MW for the Allegro line to Germany by 2019.
Based on discussions with Elia, it has been assumed that the full capacity of these new
interconnections will be available to support the system.
Electricity demand and peak power assumptions have been based on Synergrid and Elia data
(for the historical values), and on the evolutions assumed in the Prospective Study for the future
(0.76% growth of final consumption for period 2010-2030, and peak power of respectively 14 860
MW, 15 140 MW and 15 730 MW for the years 2020, 2025 and 2030).
For the available amount of flexibility in the system, no information is given in the Prospective
Study. The flexibility that is in our power system today has been estimated to be roughly 4% of
peak power in Belgium, based on a survey by Febeliec, Elia and Energyville 12. It has been
assumed for the Reference scenario that demand flexibility does not further increase compared
to today (stays at about 4% of the peak power).
2.2.2 The Alternative scenario
This study proposes an Alternative scenario to analyse the possibilities for the Belgium power system.
Apart from giving estimations of absolute indicators such as the amount of investments and subsidies
required, the Alternative scenario is mainly meant to show what is possible in Belgium, how this
solution would compare to the Reference scenario, and what the benefits are of increased investments
in renewables and energy efficiency to the Belgian power system.
Table 2 provides an overview of the installed capacities per technology in the Alternative scenario. The
main differences with the Reference scenario are the following:
12
Febeliec, Elia & EnergyVille, Summary Results Demand Response Survey, 2013, Available online
http://www.febeliec.be/data/1385111565Elia%20Febeliex%20EnergyVille%20Demand%20Response%20Survey%20r
esults%20-%20public%20version.pdf
Crucial Energy Choices in Belgium - An Investigation of the Options FINAL VERSION 12 / 42
Our Energy Future CONFIDENTIAL
PR107308 – 25/06/2014 The alternative scenario does take the outage of the two nuclear plants (Doel 3 and Tihange 2)
into account. To ensure that the import capacity is not exceeded by the need for energy in
Belgium, the full load hours of gas have been altered to make up partly for the loss of nuclear
power.
As shown in Table 2, the Alternative scenario assumes a more ambitious scenario for solar PV
and onshore wind.
The Alternative scenario respects sustainability criteria for biomass and has therefore a
significantly lower biomass capacity than in the Reference scenario.
A more extensive investment in energy efficiency measures is assumed, which limits the
increase in energy demand significantly.
The amount of flexibility available is increased significantly. For this assumption, a reference of
the European Commission has been used13, where they estimate flexibility to represent 10% of
peak demand in 2020 and a doubling of that by 2030.
Because of the renewable energy scenarios and the flexibility assumptions, less CHPs are
needed.
The following paragraphs explain the assumptions made for renewable energy in more detail.
Table 2: Installed capacities in the Alternative scenario
Electricity Demand scenario 2010 2020 2030
Gross Final Consumption 90 513 92 719 94 142 GWh
Peak demand 13 845 14 860 15 730 MW
Capacity scenario 2010 2020 2030
Nuclear 5 926 3 046 0 MW
Coal 950 0 0 MW
Peak Units 491 1 500 1 500 MW
Gas - CCGT 4 761 5 061 7 000 MW
Gas - CHP 1 848 2 557 3 265 MW
Biomass 618 1 138 1 296 MW
Wind - onshore 691 3 545 7 544 MW
Wind - offshore 195 2 200 3 800 MW
Solar PV 1 055 7 431 13 431 MW
Hydro 112 157 157 MW
Geothermal 0 4 60 MW
Pumped Hydro Storage 1 307 1 307 1 307 MW
Import 3 500 6 500 6 500 MW
Demand Flexibility 504 1 486 3 146 MW
Assumptions for renewable energy in the Alternative scenario
Renewable energy is an important part of the energy future for Belgium, as it is for the world as a
whole. Fossil fuels are a limited resource, make the country dependent on - mostly unstable- countries,
hold risks of price volatility and price increases, and cause money leaking out of the Belgium economy.
Moreover, the emissions from burning them cause climate change and damage people's health.
13
European Commission, ‘Incorporing demand side flexibility, in particular demand response, in electricity markets’,
Commission Staff Working Document, Accompanying the Communication on ‘Delivering the internal electricity market
and making the most of public intervention’, Brussels, 5 November 2013, SWD(2013) 442 final, Available online
http://ec.europa.eu/energy/gas_electricity/doc/com_2013_public_intervention_swd07_en.pdf on page 3 and footnote
number 8.
Crucial Energy Choices in Belgium - An Investigation of the Options FINAL VERSION 13 / 42
Our Energy Future CONFIDENTIAL
PR107308 – 25/06/2014Together with the clients and basing on existing studies and the work of ODE-EDORA, the renewable
energy scenario for electricity as presented in Table 2 and more visually in Figure 2 has been put
forward.
Figure 2: Installed renewable energy capacity scenario for 2020 & 2030 in the Alternative
scenario
For PV, this comes down to an annual installation of 600 MW, which is more than 50% less than
what has been installed in the record year 2011. At this rate the installed capacity would be 7431
MW in 2020 and 13431 MW in 2030. A medium PV scenario is also developed with an
installation of 5031 MW in 2020 and 8031 MW in 2030, equivalent to an installation rate of 300
MW per year. To test the impact of the learning curve of PV, some non-linear scenarios are
evaluated. This study assumes furthermore that 25% of this capacity are large systems, and 75%
are small systems.
For onshore wind the scenario is based on a scenario by ODE-Edora in a report by Deloitte14. It
assumes an annual installation rate of 319 MW until 2020 which increases to 400 MW until 2030.
This would lead to an installed capacity of 3545 MW in 2020 and 7544 MW in 2030. A medium
scenario is also developed with 2700 MW in 2020 and 5000 MW in 2030.
For offshore wind most scenarios in literature15 assume a potential of 3800 MW by 2030. This
potential assumes that a second zone is developed on top of the 2000 MW in the first designated
zone.
The hydro scenario is based on the REPAP 2020 report16 and on a best guess from
Greenpeace, while the geothermal scenario uses a test phase of 4 MW by 2020 as listed in the
NREAP and a development of 60 MW by 2030 based on the REPAP report.
Today, the installed capacity for biomass17 is almost as high as the capacity figures presented
in the scenario in Figure 2. When taking into account sustainability criteria, the total possible
14
Macro-economic Impact of the Wind Energy Sector in Belgium, Deloitte, December 2012
15
E.g. Commission Energy 2030, Belgium Energy Challenges Towards 2030, June 2007
16
REPAP 2020 (Renewable energy policy action paving the way towards 2020) is a project supported by the
European Commission under the Intelligent Energy Europe framework. One of its objectives was to ensure that the
National Renewable Action Plans were ambitious enough.
Crucial Energy Choices in Belgium - An Investigation of the Options FINAL VERSION 14 / 42
Our Energy Future CONFIDENTIAL
PR107308 – 25/06/2014capacity for electricity production from biomass in Belgium is between 1100 and 1500 MW
(depending whether the biomass only comes from Belgium or whether also European import is
used). The following paragraph provides more details about this calculation.
Note that the above explanations mention a base scenario and some sensitivity scenarios. In order to
keep this publication focused and limit it to the essential, not all of the results of the sensitivity analysis
are mentioned and discussed.
Available sustainable biomass for electricity production
Our scenarios started from the availability of sustainable wood and rest streams. Following the strict
scenario in a recent study commissioned by EEB/Birdlife18, the availability of indigenous wood in
Belgium is limited to ~4 million m³. Taking into account an average energy content and density, there is
about 11 TWh of indigenous wood available. The study also mentions that 25% of the available wood
can be used for energy purposes. The rest can be used for industrial applications.
To maximize the useful energy production from biomass, it is best to use these 25% in CHPs since
these are more energetically efficient than a separate production of electricity and heat. By assuming a
CHP with an electrical efficiency of 30% and 5000 full load hours, this leads to an installed capacity of
about 160 MW.
A sensitivity scenario takes European import into account and assumes that the whole European
potential of sustainable wood is divided among the member states based on the electrical
consumption. In this sensitivity scenario, an installed capacity of 590 MW would be possible for woody
biomass CHPs in Belgium.
Next to the wood residue there are also rest streams that can be used to produce energy. Based on
data from OVAM (extrapolated for Belgium assuming Flanders represents 60%) and with the same
assumptions as above, an additional capacity of about 950 MW could be installed. The total capacity
would thus equal about 1110 MW electrical, or about 1540 MW electrical in the European biomass
scenario19 .
The biomass scenario in Table 2 and Figure 2 assumed a medium scenario between Belgian
availability and European import.
17
Including the Max Green plant which recently stopped operation because of uncertainty about the sustainability of
its fuel and its eligibility for support.
18
Forest biomass for energy in the EU: current trends, carbon balance and sustainable potential, IINAS, EFI & JR for
Birdlife, EEB and Transport & Environment, to be published in May 2014
19
Assuming a thermal efficiency of 50%, this represents a thermal capacity of about 1800 MW or 2500 MW in the
European biomass scenario.
Crucial Energy Choices in Belgium - An Investigation of the Options FINAL VERSION 15 / 42
Our Energy Future CONFIDENTIAL
PR107308 – 25/06/20142.3 OTHER IMPORTANT ASSUMPTIONS
2.3.1 Energy price scenarios
Electricity price
The electricity price is a crucial factor. It has the largest influence on required subsidies. For this study,
we analysed many other studies in order to find references for electricity price scenarios but with
limited success. The few scenarios for electricity prices we did find, vary significantly.
Moreover, in order to be coherent, electricity price scenarios need to be linked in some way to fuel
price scenarios since these fuels serve as the input for electricity production.
For these reasons, we have developed two main electricity price scenarios based on the fuel price
scenarios (any other scenario can be easily modelled), starting from respectively the selected gas and
coal price scenarios, the CO2 costs, and an estimation of OPEX costs. In short, these two scenarios
are calculated as follows:
Price gas / efficiency gas plant (55% assumed) + CO2 costs gas + OPEX gas
Price coal / efficiency coal plant (42% assumed) + CO2 costs coal + OPEX coal
Today, in the European context and with the currently low CO2 prices, coal comes before gas in the
merit-order and the electricity price is therefore based on the coal price (2nd scenario). However, in the
future, it is expected that the European system will move more towards gas (1st scenario).
Figure 3: Comparison of the two main electricity price scenarios in €/MWh - Calculation based
on fuel costs + CO2 costs + OPEX
For several reasons20, the 1st scenario has been used as the base assumption in what follows. This
leads to a higher electricity price assumption, in particular for the first years. However, it seems to be
more reasonable for the future. Moreover, it is more in line with scenarios from other studies.
The 2nd scenario is also calculated as a sensitivity analysis in this section.
20
A first important reason is that the earlier than expected forced shutdown of the nuclear plants Doel 3 and Tihange
2, will drive up power prices and lead to more full load hours for gas in Belgium. A second reason is the assumption
that, if Europe is serious about its Climate policy, CO2 prices will need to rise at some point in the coming years in
order to bring gas before coal in the merit-order. Moreover, the future European power system with large amounts of
renewables will work best with a flexible gas-based backup generation rather than with a less-flexible coal-based
generation portfolio.
Crucial Energy Choices in Belgium - An Investigation of the Options FINAL VERSION 16 / 42
Our Energy Future CONFIDENTIAL
PR107308 – 25/06/2014Please note that in the summary table (Table 3), three different scenarios for the electricity price are
mentioned. As will be explained in Section 3.1.1, this is to analyse the impact of the so-called merit-
order effect (i.e. lower price for variable renewables since they have zero-marginal cost).
Fuel and CO2 Prices
The fuel price scenarios used in this study have been based on publications by others. For each vector,
several scenarios have been analysed in the model in sensitivity analysis, but since not all results are
discussed in this report, only the main scenarios are mentioned here.
The following bullet points explain on what the main fuel price scenarios are based for each vector. The
data can be found in Table 3 below for the years 2010, 2020 and 2030).
Gas: The gas price scenario is based on the assumptions from the 2014 Prospective Study
(p.28), converted to €/MWh with the relevant exchange rate21 and corrected for inflation. The
resulting prices are well in line with other scenarios, such as the prices used by VITO in the
100% RE study, the Impact Assessment for the European Energy Roadmap by the European
Commission22 and the scenarios by Fraunhofer ISI23 (which are a bit higher).
Oil: As the gas price, the oil price scenario used is also based on the oil price scenario in the
2014 Prospective Study, converted with the same exchange rate and corrected for inflation. The
chosen scenario is will in line with other scenarios as those from VITO and the European
commission.
Biomass: Since biomass is a quite diverse term with a broad scala of fuels, it is difficult to put a
price on it. In this study, the price for biomass is based on the futures for industrial wood chips as
published by Argus Media24, and a price increase of 1% per year is assumed.
Coal: Also the coal prices are taken from the Prospective Study, but these are merely mentioned
for comparison since they are not used in any of the scenarios.
CO2: The CO2 price scenario has been based on a scenario by the European Commission. The
resulting prices are reasonable (and even on the lower end low) compared to other scenarios by
PointCarbon25 , NEP and Prognos (mentioned in the Fraunhofer ISI study),
21
The study refers to $2008. The average exchange rate for 2008 has been used for the conversion = 0.68 dollar per
euro.
22
European Commission, Energy Roadmap 2050, Impact Assessment, December 2011, Available online
http://ec.europa.eu/energy/energy2020/roadmap/doc/roadmap2050_ia_20120430_en.pdf
23
Fraunhofer ISI, Levelised Cost of Electricity Renewable Energy Technologies, November 2013, Available online
http://www.ise.fraunhofer.de/en/publications/veroeffentlichungen-pdf-dateien-en/studien-und-konzeptpapiere/study-
levelized-cost-of-electricity-renewable-energies.pdf
24
Argus media, Weekly biomass markets news and analysis, Argus Biomass Markets, Issue 14-013 page 3,
Wednesday 2 April 2014, Available online http://media.argusmedia.com/~/media/Files/PDFs/Samples/Argus-
Biomass.pdf
25
http://www.pointcarbon.com/aboutus/pressroom/pressreleases/1.2584441
Crucial Energy Choices in Belgium - An Investigation of the Options FINAL VERSION 17 / 42
Our Energy Future CONFIDENTIAL
PR107308 – 25/06/2014Summary of prices used in the Reference and the Alternative scenarios
To make the comparison relevant, the same energy price scenarios have been used for both
scenarios. They are summarized in Table 3. Sensitivity analyses on these scenarios have been
performed to analyse the impact of variations (see Section 3.1.1).
Table 3: Summary of energy price scenarios for the Reference and Alternative scenario
Price scenario 2010 2020 2030
Electricity (Average) 48 60 80 €/MWh
Electricity (Av. Fluctuating sources) 48 60 80 €/MWh
Electricity (Av. Non-fluctuating sources) 48 60 80 €/MWh
Gas Price 21 27 33 €/MWh
Oil Price 37 42 50 €/MWh
Biomass Price 38 41 45 €/MWh
Coal Price 10 13 14 €/MWh
CO2 Price 5 10 35 €/tonne
2.3.2 Investment parameters
In order to compare on an equal basis, the investment parameters used are the same for the
Reference scenario and the Alternative scenario. They have been defined based on the research done
by 3E in previous studies as mentioned above, complemented with updated info (e.g. CAPEX costs,
OPEX costs, learning effects per technology, efficiency improvements, etc.) from recent studies (e.g.
VITO26, Fraunhofer ISI27, IEA28, Kema & McKinsey29, RAP30 & Agora Energiewende31).
The final assumptions made in the framework of this study are shown below:
Table 4 explains what capacity is used per technology for the calculations in the Investment
model.
Table 5 shows the CAPEX assumptions and their evolution over the next years.
Figure 4 shows the WACC and lifetime assumptions.
26
Vito, Towards 100% renewable energy in Belgium by 2050, April 2013
27
Fraunhofer ISI, Levelised Cost of Electricity Renewable Energy Technologies, November 2013, Available online
http://www.ise.fraunhofer.de/en/publications/veroeffentlichungen-pdf-dateien-en/studien-und-konzeptpapiere/study-
levelized-cost-of-electricity-renewable-energies.pdf
28
IEA and OECD/NEA, Projected Costs of Generating Electricity: 2010 Edition, 2010, Paris
29
ECF Roadmap 2050, Available online http://www.roadmap2050.eu/project/roadmap-2050
30
RAP, Power Perspectives 2030 – On the Road to a Decarbonised Power Sector, March 2011
31
Marco Wunsch et al. Positive Effekte von Energieeffizienz auf den deutschen Stromsektor, Study for Agora
Energiewende, March 2014
Crucial Energy Choices in Belgium - An Investigation of the Options FINAL VERSION 18 / 42
Our Energy Future CONFIDENTIAL
PR107308 – 25/06/2014Table 4: Assumed capacity of each unit as input for the investment model in MW
Installation size used MW
PV < 10kVA 0.01
PV > 50 kWc 0.25
Onshore wind 2.3
Offshore wind 300
CHP Gas 0.75
CHP Biomass 12.5
Hydro 0.05
Geothermal 5
Nuclear 1 008
CCGT 400
Table 5: Overview of CAPEX assumptions in €2014/MW
CAPEX scenario 2013 2020 2030
PV < 10kVA 1 640 000 1 092 240 967 600 €/MW
PV > 50 kWc 1 300 000 865 800 767 000 €/MW 7 000 000
6 000 000
Wind P > 1 MW 1 500 000 1 438 500 1 390 500 €/MW
5 000 000
Offshore Wind 3 800 000 3 214 800 2 888 000 €/MW
4 000 000
CHP gas 500 < 1000 kW 1 000 000 1 000 000 1 000 000 €/MW
3 000 000
CHP Bio.sol > 5000 kW 3 900 000 3 900 000 3 900 000 €/MW 2 000 000
Hydro 10kW 5000 kW 12% 20 6% 5%
20
Hydro 10kW3 RESULTS AND SENSITIVITY ANALYSIS
The results from the model have been structured in three key topics as shown in Figure 5.
The Power of
Time
The Power The Power
of of Energy
Technology Efficiency
Figure 5: Three key topics of the study
These three topics comprise the key results of the study as well as the key conclusions. They can be
explained as follows:
The Power of Time:
Time is crucial in the transition of an energy system. The alternative scenario developed in this
study can work perfectly for the period up to 2030, meeting peak power and demand criteria
while also reaching the renewable energy targets. However, short-term issues may arise due to a
number of reasons, and appropriate measures need to be taken.
The Power of Energy Efficiency:
Energy efficiency is the first most important resource. The old building stock is an asset because
there is still a large potential to improve efficiency. Moreover, there are ample other benefits.
Energy efficiency is crucial but will not be sufficient to meet the challenges faced by the electricity
sector in the next five years. Specific programs for measures with peak power reduction
potential, such as relighting, need to be developed. Energy efficiency in buildings has been
analysed in detail, but this work will be the subject of a later publication.
The Power of Technology:
With the current low electricity prices on the European electricity markets, no technology is cost-
beneficial if the investment is included. However, renewable energies mature and a lot is
expected to change in the coming years. Investment costs for renewable technologies are further
decreasing, while fuel prices and electricity prices are expected to increase in the future. Wind
will become the cheapest technology by 2017 and PV is expected to take over from 2019
onwards. All of this has a major influence on the optimal choices for Belgium, and will
significantly impact the costs and required subsidies.
Crucial Energy Choices in Belgium - An Investigation of the Options FINAL VERSION 20 / 42
Our Energy Future CONFIDENTIAL
PR107308 – 25/06/20143.1 THE POWER OF TIME
As will be shown below, a first look at the results of the completed model clearly shows the importance
of time. Most of the possible measures to reduce energy demand, reduce emissions and increase the
use of renewable energy need time before they have an impact. However, this long time lag also
means that – in order to have the desired impact – a clear vision and goals need to be defined as soon
as possible.
In the electricity sector, the importance of time is also very clear. While for the period up to 2030 a lot is
possible and the development of an ambitious scenario seems reasonable and realistic, in the next five
years Belgium will face a more stringent challenge in terms of peak capacity and energy delivery.
Both periods pose different challenges that must be solved:
For the period up to 2030, these concern the energy mix, the contribution of renewables,
the total investment costs and the amount of subsidies required to make it happen32. Other
important challenges are total consumption and the associated emissions.
For the next five years, these concern how peak consumption can be delivered, what can
be done to ensure enough capacity and energy, how Belgium can react to the unplanned
outages of two nuclear plants, etc.
3.1.1 The period up to 2030
The main task of this project was to look at scenarios for Belgium’s energy future towards 2030. As
mentioned above, there is enough time between now and 2030 to reach the targets and transform the
Belgian electricity system. However, in order for this to happen, it is crucial that several important steps
and decisions are taken today.
This section is therefore also the main section of this report. It explains the main results of modelling for
the period up to 2030. It deals with the contribution of renewable energy, gives an indication of the type
of installations that will deliver the peak power and energy demand, lists which new installations would
be required to make this happen and provides estimations of the total investment costs and required
subsidies. Moreover, sensitivity analyses will show how sensitive these results are to the impact of e.g.
electricity prices, and will also go into more detail on the impact of net metering.
Renewable Contribution
Figure 6 shows the contribution of renewable energy in the electricity sector for both scenarios. The
Reference scenario only sees modest renewable energy development in the future, and results in a
contribution of 23% of the electricity production in 2020 and 28% in 2030. Please note that with this
scenario, it will be difficult to reach the European renewable energy target for Belgium (13% of final
energy consumption in 2020) if sustainability criteria for biomass are respected.
The Alternative scenario makes it possible to reach the target and even significantly exceed it. The
percentage of renewable energy in electricity production is expected to reach 32.8% in 2020 and 54%
32
In this study, the words ‘required subsidies’ mean for some technologies the sum of two things: First of all, and for
all technologies, it means the normal operational subsidies that are provided per produced MWh on top of the
electricity value. Secondly, for some technologies (in 2030, despite a much lower contribution from biomass which is compensated by more wind power
and solar PV.
Figure 6: Contribution of renewable energy in the electricity sector for the Reference scenario
and the Alternative scenario
The electricity system – peak contribution and energy provision
This section looks at how the Belgian electricity system can deliver peak power and fulfil energy
demand. An overview of the Alternative scenario is provided in Figure 7 and
Figure 8. Since these figures may appear complex, the following paragraphs provide some explanation:
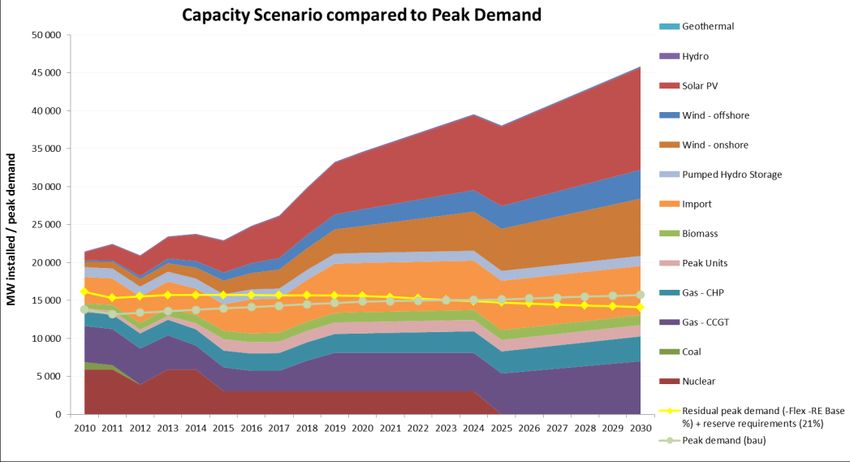
Figure 7 gives an overview of the installed capacity per technology and compares this to peak
demand and the required dispatchable capacity. The objective of this graph is to quickly show
whether there is enough capacity to meet peak demand in Belgium.
The grey line is peak demand (when there would be no additional capacity), as described
in Chapter 2. It rises steadily and is based on assumptions made in the 2014 Prospective
Study33.
The yellow line represents the ‘residual peak demand’ that needs to be met by
dispatchable capacity, i.e. the peak demand that is left after:
All available flexibility is used
The capacity credit34 of variable renewable energy sources has been subtracted
21% reserve margin has been added35
33
Studie over de perspectieven van elektriciteitsbevoorrading tegen 2030, FOD Economy & Planbureau, Draft,
August 2013, Available online
http://economie.fgov.be/nl/ondernemingen/energie/elektriciteit/Prospectieve_studie_elektriciteit/#.U6l2cv5j3Eg
34
The capacity credit is the amount of firm capacity that can be replaced by variable renewable energy sources. The
idea is that no backup capacity is needed for this percentage of the renewable energy capacity when integrated in the
grid. The capacity credit decreases with the overall penetration of renewables in the grid.
In this project, a low and conservative capacity credit of 5% is taken into account. More research is needed on the
Belgian case to improve this initial assumption and detail it further.
35
This assumption is taken from the 2014 Prospective Study in which the ‘system reserve margin’ is defined as the
ratio between the ‘guaranteed available capacity’ and peak demand. The FOD assumes that a factor of at least 1.21
is needed to guarantee the reliability of the system.
Crucial Energy Choices in Belgium - An Investigation of the Options FINAL VERSION 22 / 42
Our Energy Future CONFIDENTIAL
PR107308 – 25/06/2014 The installed capacities of all different technologies have been listed starting with the
‘dispatchable capacities’: Conventional technologies (i.e. nuclear, coal, gas CCGT, gas
CHP and peak units), biomass, electricity import capacity and pumped hydro storage.
The variable renewable energy technologies come on top of these.
As long as the yellow line does not go above the grey area for pumped hydro storage, the
system is assumed to be able to cope with peak demand.
Figure 7: Capacity scenario for the Belgian energy system, compared to peak demand (without
flexibility) (grey line) and required dispatchable capacity (yellow line). The areas above the grey
area for pumped hydro storage show the renewable capacity from variable sources. The yellow
line for required dispatchable capacity should thus stay below the top of the grey area to avoid
issues with peak demand provision.
Figure 8 gives an overview of the energy production by each technology, along with a
comparison to annual energy demand. The objective of this graph is to quickly show whether
there is enough energy production in order to meet the annual total electricity demand in
Belgium.
The yellow line represents the annual electricity demand, as described in Chapter 2.
The contribution in electricity production of each technology is shown with the coloured
areas for the different years up to 2030.
The difference between the sum of electricity production of all technologies and annual
demand is assumed to be covered by electricity import/export. A control formula in the
model ensures that the amount of import/export stays within the boundaries of available
interconnection capacity.
Crucial Energy Choices in Belgium - An Investigation of the Options FINAL VERSION 23 / 42
Our Energy Future CONFIDENTIAL
PR107308 – 25/06/2014Figure 8: Energy scenario for the Belgian electricity system, compared to total annual demand
(yellow line). The grey area just above or below the yellow line is the required import/export of
electricity to meet annual demand.
Both Figure 7 and Figure 8 show that the Alternative scenario meets the criteria of reaching peak
demand and delivering annual electricity demand provision. There is enough firm capacity (and
flexibility) to meet peak demand even when wind and solar energy production are minimal, and there is
enough energy production (and possibility to import if needed) to meet the total electricity demand.
As explained above, peak demand without flexibility continues to rise. Increasing flexibility in demand
(assumptions based on work by the European Commission36) and increasing interconnection result in a
significant reduction of the required backup capacity.
The figures also show that it is perfectly possible in the Alternative scenario to replace nuclear energy
in Belgium during the period up to 2030. Renewable energy sources are able to add significantly to
energy supply, and additional CCGT plants can help when there is too little wind and sun. Compared to
the Reference scenario based on the Prospective Study (~10 GW CCGT), the Alternative scenario
indicates that it should be possible to have a working system with a total capacity of about 7 GW of
CCGT units instead of more than 10 GW.
The energy mix for 2020 and 2030 is shown in Figure 9. In 2020, nuclear energy still provides about
25% of total electricity produced in Belgium, even with Doel 3 and Tihange 2 closed. By 2025 nuclear
energy is phased out completely and by 2030 it is replaced in particular by more wind energy, more
solar energy, and more CHPs.
36
European Commission, ‘Incorporing demand side flexibility, in particular demand response, in electricity markets’,
Commission Staff Working Document, Accompanying the Communication on ‘Delivering the internal electricity market
and making the most of public intervention’, Brussels, 5 November 2013, SWD(2013) 442 final, Available online
http://ec.europa.eu/energy/gas_electricity/doc/com_2013_public_intervention_swd07_en.pdf on page 3 and footnote
number 8.
Crucial Energy Choices in Belgium - An Investigation of the Options FINAL VERSION 24 / 42
Our Energy Future CONFIDENTIAL
PR107308 – 25/06/2014Figure 9: Installed capacity mix in the Alternative Scenario (% of installed capacity)
New installations and related costs
This section looks at the additional capacity per technology that needs to be installed in the Alternative
scenario for the period up to 2030. An overview is given in Table 6.
The renewable energy scenarios have already been described in detail in Chapter 2. More details can
be found in that section.
Taking into account published plans for shutdowns and mothballing in the next few years, there is an
additional need for 4.3 GW from new CCGT plants and about 1.2 GW from new CHPs. Nuclear shut-
down proceeds as planned and no new coal plants are built. 3 GW of new interconnection capacity is
needed (based on Elia’s plans and scheduling)37.
Taking into account published plans for shutdowns of peak power plants, there will be about 500 MW of
peak power plants available in 2015. In order to meet peak demand in the next few years an additional
1 GW of peak power plants has been added to the scenario38. More about this can be found in Section
3.1.2.
37
Note that there are often discussions on the real available amount of import capacity vs the published maximum
capacity of the planned interconnection cables. Based on discussions with Elia on this topic, it is assumed that
interconnection is very important to Elia and that substantial efforts will be made to ensure maximum capacity is
available at all times.
38
Peak plants have not been modelled in the investment model and the costs are therefore not integrated in tables
appearing later in the report. As will be discussed later and in Section 4.1.2, there are other possibilities for this
additional 1 GW.
Crucial Energy Choices in Belgium - An Investigation of the Options FINAL VERSION 25 / 42
Our Energy Future CONFIDENTIAL
PR107308 – 25/06/2014Table 6: Installed capacity per technology for 2030 in the Alternative scenario
Installed capacity 2030 (MW) To be built still (MW) Comments
Biomass 1 296 269 Assuming Max Green is still there
Wind - onshore 7 544 6 446
Wind - offshore 3 800 3 175
Solar PV 13 431 10 623
Hydro 157 45
Geothermal 60 60
Nuclear 0 0
Coal 0 0
Peak Units 1 500 1 009 Assuming shutdowns as published
Gas - CCGT 7 000 4 309 Assuming shutdowns as published
Gas - CHP 3 265 1 204
Import 6 500 3 000 According to Elia Schedule
To develop this scenario an investment of about 43.85 bn € would be needed (Figure 10 and Figure
11). The bulk of this investment is for solar PV, offshore wind and onshore wind.
In terms of subsidies, about 12.16 bn € is needed to make the scenario happen. The largest portion of
this goes to offshore wind. Note that the required subsidies for PV are relatively low, even without
taking net metering into account. With net metering, small PV plants are already profitable today. This
is further explored in a sensitivity analysis below. Subsidies for larger PV are only needed in the first
years.
Please note that the table in Figure 10 also mentions ‘subsidies’ for CCGTs. With the current gas &
electricity prices and the low full load hours, CCGTs are not profitable39. The model treats them in the
same way as renewables and calculates the missing money to guarantee the required return on
investment.
Costs (M€)
InvestmentsSubsidies
Nuclear 0 0
Coal 0 0
Gas - CCGT -4 098 -2 221
Gas - CHP -1 417 0
Biomass -1 235 -2 063
Wind - onshore -10 915 -1 003
Wind - offshore -11 951 -5 632
Solar PV -13 637 -1 006
Hydro -287 -207
Geothermal -311 -26
Total -43 850 -12 158
Figure 10: Calculated investment costs and subsidies for the Alternative scenario
39
Note that it is out of the scope of this study to analyse whether this issue is to be solved and which policy measure
can be used to do this (e.g. capacity mechanism, subsidies, CO2 price increases etc.)
Crucial Energy Choices in Belgium - An Investigation of the Options FINAL VERSION 26 / 42
Our Energy Future CONFIDENTIAL
PR107308 – 25/06/2014You can also read


