A NEW VENTURE BUSINESS PLAN - ONLINE AGRICULTURE PRODUCT SALES IN TAIWAN - Core
←
→
Page content transcription
If your browser does not render page correctly, please read the page content below
AY2012

  ONLINE AGRICULTURE PRODUCT SALES IN TAIWAN
         - A NEW VENTURE BUSINESS PLAN

                      LAI CHUN YING
                          35102334-4

                Major in Business Administration

            GRADUATE SCHOOL OF COMMERCE

                 WASEDA UNIVERSITY

                                          PROF. HIDEO HOHGI
C.E   PROF. SEIICHI FUJITA         D.E.
                                          PROF. SHIGERU NISHIYAMA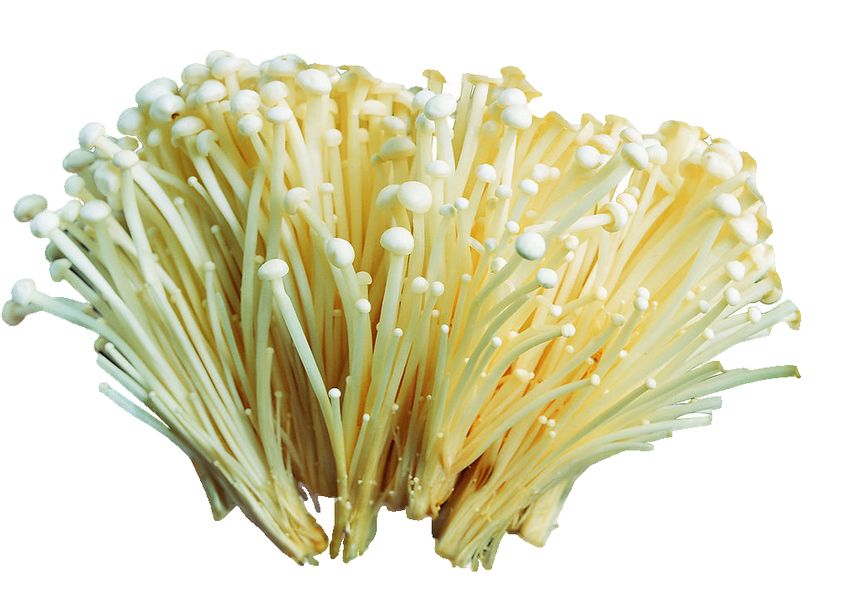
TABLE OF CONTENT

LIST OF FIGURES ....................................................................................................................................... ii

LIST OF TABLES .......................................................................................................................................iii

ACKNOWLEDGEMENTS ......................................................................................................................... iv

CHAPTER 1. RESEARCH BACKGROUND ........................................................................................... 1
    1.1          Main Objective and Research Description .................................................................................. 1
    1.2          Research Motivation ................................................................................................................... 2
    1.3          Research Methodology and Data analysis .................................................................................. 5
    1.4          The Structure of Thesis ............................................................................................................... 6

CHAPTER 2. STATUS and MARKET REVIEW ..................................................................................... 7
    2.1          Taiwan E-commerce status review ............................................................................................. 7
    2.2          Taiwan Vegetable Market Status Review and Analysis ............................................................. 9

CHAPTER 3. BUSINESS MODEL ......................................................................................................... 15
    3.1          Summary of Business ................................................................................................................ 15
    3.2          General Company Description .................................................................................................. 16
    3.3          Products and Service ................................................................................................................. 16
    3.4          Target Customers ...................................................................................................................... 19
    3.5          Supply Chain Analysis .............................................................................................................. 19
    3.6          Competition Analysis ................................................................................................................ 24
    3.7          Potential customers marketing survey ...................................................................................... 27
    3.8          Operation plan ........................................................................................................................... 31
    3.9          Financial plan ............................................................................................................................ 36
    3.10         Opportunities and risks ............................................................................................................. 41

CHAPTER 4. CONCLUSION .................................................................................................................. 43
    4.1          Objectives and Recommendations ............................................................................................ 43
    4.2          Competitive Advantage ............................................................................................................. 44
    4.3          Research Suggestion ................................................................................................................. 46

APPENDIX I: Taiwan Family Vegetable Consuming Behavior and Shopping Behavior Survey Form ... 48

APPENDIX II: Taiwan Family Vegetable Consuming Behavior and Shopping Behavior Survey Results

..................................................................................................................................................................... 52

REFERENCES ............................................................................................................................................ 56


                                                                                   i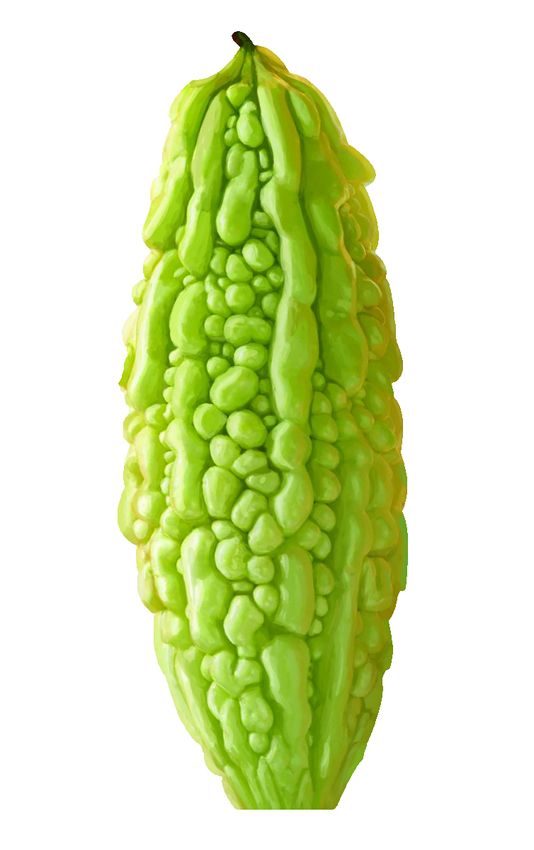
LIST OF FIGURES
Figure 1.1 Taiwanese Daily Meal Behavior Surveys .............................................................................. 2
Figure 1.2 Reasons Survey for Eating out ............................................................................................... 3
Figure 1.3 Male and Female Working Percentage from 2001 to 2011 ................................................... 4
Figure 1.4 Taiwanese Mistrust Attitude Surveys to Market Organic Vegetables ................................... 5
Figure 2.1 Taiwan E-commerce Scale and Growth Rate ........................................................................ 7
Figure 2.2 Taiwan E-commerce Top10 Popular Category ...................................................................... 8
Figure 2.3 Price (NTD/Kg) Comparison for Top 9 Vegetable in Taiwan ............................................. 13
Figure 2.4 Volume comparison for Top 8 vegetables in Taiwan .......................................................... 13
Figure 2.5 Price comparison between Leaf and Mushroom vegetables ................................................ 14
Figure 3.1 Four kinds of agriculture products in Taiwan ...................................................................... 17
Figure 3.2 Taiwan Agriculture Supply Chain System and TVO Positioning........................................ 21
Figure 3.3 Price Difference between One Level and Three Level Supply Chain ................................. 24
Figure 3.4 Age, Marriage and Gender Distribution of Respondents ..................................................... 27
Figure 3.5 Number of Times Shopping in One Week ........................................................................... 28
Figure 3.6 Money Spending in One Time Food Shopping .................................................................... 29
Figure 3.7 Preference Shopping Location Distribution ......................................................................... 30
Figure 3.8 Bothers of Current Shopping Location ................................................................................ 30
Figure 3.9 The Most Concern while shopping Food ............................................................................. 31
Figure 3.10 Operational Flow from Order to Ship ................................................................................ 32
Figure 3.11 Daily Operation .................................................................................................................. 33
Figure 3.12 Pesticide Checking Schedule ............................................................................................. 34
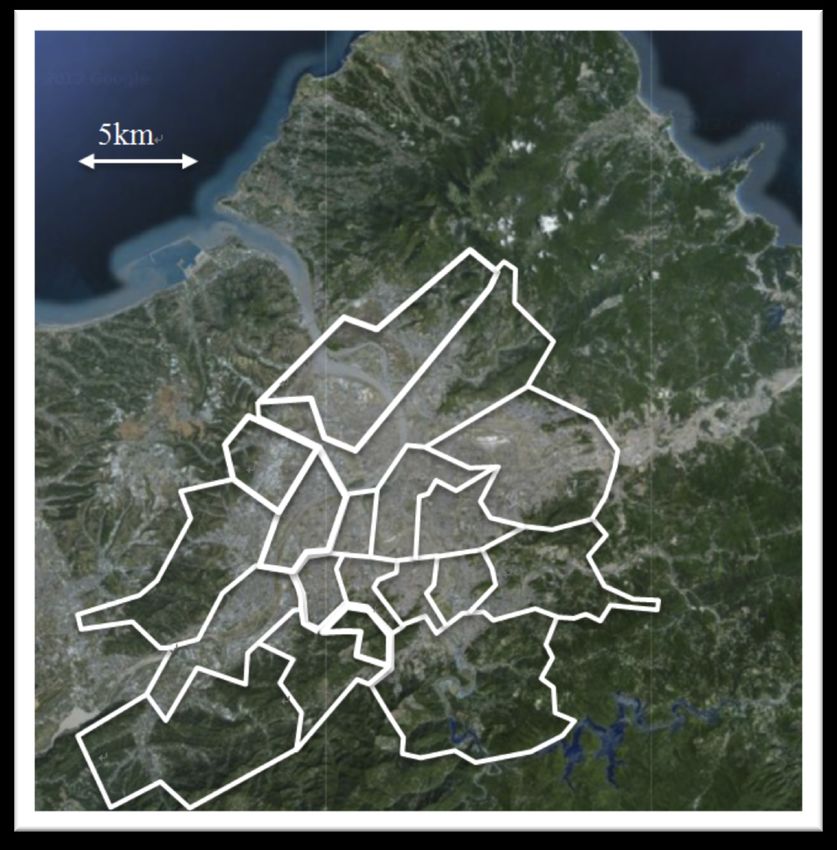
Figure 3.13 Population Density of the Top 20 Crowdest City in the World ......................................... 35
Figure 3.14 Big Taipei City Geographic Map ....................................................................................... 35
Figure 3.15 Sales Forecast of Vegetable within first 5 years ................................................................ 38
Figure 3.16 Sales Forecast of Fruits within first 5 years ....................................................................... 39
Figure 4.1 TVO Product Line Brand Strategy ....................................................................................... 45
Figure A.1 Taiwan Family Vegetable Consuming Behavior and Shopping Behavior Survey Form…48
ii
LIST OF TABLES

Table 2.1   Taiwan E-commerce Age and Gender Distribution ................................................................... 9

Table 2.2   Supply Statistics of Top 9 Common Vegetable from 2007~2011 ........................................... 11

Table 3.1   Customer Value Analysis through Buying Process Compared to Traditional Way ................ 18

Table 3.2   Vegetable Shipping Cost Structure through Different Distribution Path ................................. 22

Table 3.3   Competition Analysis for Taiwan Agriculture Market ............................................................ 26

Table 3.4   Spending Each Time on Different Food Category ................................................................... 29

Table 3.5   Starting Balance Sheet ............................................................................................................. 37

Table 3.6   Vegetables and Fruits Sales Figure in Big Taipei City in 2011 ............................................... 38

Table 3.7   Total Target Sales Amount of TVO in 5 Years........................................................................ 39

Table 3.8   Depreciation Table ................................................................................................................... 40

Table 3.9   Estimated Income Statement .................................................................................................... 41
Table A.1   Taiwan Family Vegetable Consuming Behavior and Shopping Behavior Survey Results..... 52


                                                                       iii
ACKNOWLEDGEMENTS

     The success of this thesis depends largely on the inspiration and guidelines of many others. I take

this opportunity to express my gratitude to people who have been instrumental in the successful

completion of this thesis. I would like to show my greatest appreciation to Prof. Fujita Seiichi. I can't say

thank you enough for his great support and help. I feel motivated and encouraged every time I attended

his meeting. Without his encouragement and guidance this project would not have materialized.

     I also want to give my special thanks to my wife Chang Juyin and young daughter Lai Chenli. They

have supported me without any reservations.

                                                      iv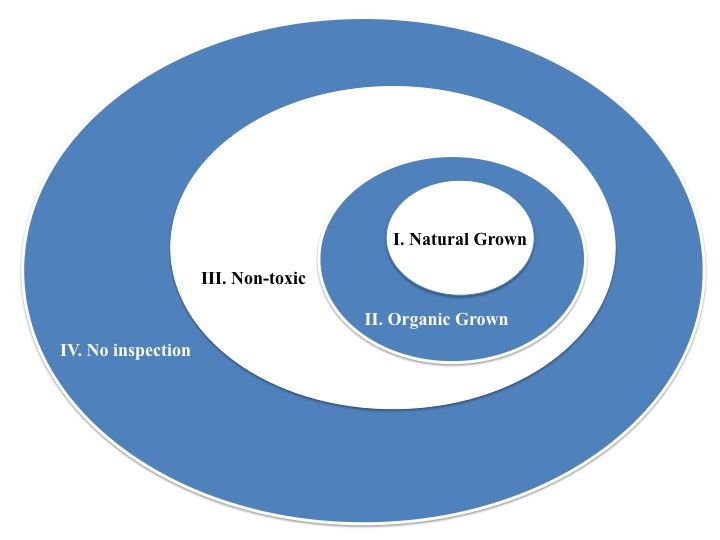
CHAPTER 1.                  RESEARCH BACKGROUND

     Chapter 1 provides a whole picture about the background of this thesis. Research objectives are

given in section 1.1, including the short term and long-term objectives. In section 1.2, the research

motivations will be described. People in modern society have several problems while buying vegetable.

Research methodology and data source will be described in the last section.

1.1 Main Objective and Research Description

     The main objective of this thesis is to create a profitable business model for online vegetables sales.

As the economic growth, food security problems attract more attention in today’s society. People like to

know the quality of daily food and the place to purchase high quality agriculture product. Also people

want to save grocery-shopping time. Online vegetables sales can perfectly solve all above problems at

same time. Compared to traditional market, online vegetables sales have several advantages, including

     a.)   providing complete certification and verification report about the product,

     b.)   providing purchasing history record,

     c.)   providing door-to-door delivery service.

     This research starts from the investigation of today’s Taiwan vegetable market and consumer

behavior, hence defining the product and season strategy. On the other hand, this research analyzes the

status of current vegetable online market, identifying the existing competitors and customers. By

analyzing pros and cons of existing companies, author suggests several features for website and proposes

a complete whole business model. The features include

     a.)   Extremely high-speed shipping time,

     b.)   Self-owned inventory,

     c.)   Complete certification and verification report,

     d.)   Continuously promote special high quality agriculture product,

                                                      1
e.)    Complete purchase history record.

1.2 Research Motivation

    Either in western or eastern countries, more and more women start to work after marriage. Busy

lives condense the time for household affair, especially for preparing meal.8 The author’s family is

dual-earner household. Cooking meal every day is quite difficult and troublesome, especially for grocery

shopping. Figure 1.1 shows the Taiwanese traditional behavior statistics for their daily meal.10 Most of

Taiwanese prefer to go to restaurant in the middle of day but back home having dinner with family.

                                                                  4.3%

           100%

                          17.8%

            90%
                                                 20.9%

            80%
                               57.9%

            70%

            60%

                                                                                        Others
            50%
                                                                       Eat outside
                          82.2%
               40.4%

            40%
                                                 74.8%

                                                                                        Eat at home
            30%

            20%

                                                31.0%

            10%

              0%

                       Breakfast           Lunch                Dinner

                          Figure 1.1   Taiwanese Daily Meal Behavior Surveys
                           (Source: Taiwan Institute Economic Research 2007)

    Two important observations can be found in Figure 1.1. First, for most family, buying vegetable is to

prepare dinner. The observation gives a strong support that the online vegetable selling business should

focus on the demand for cooking dinner. On the other hand, over 20% people still choose to eat out and

this behavior is getting popular is the few years. Time consuming is the main reason for people who don’t

want to cook at home. From grocery shopping to dish washing, preparing dinner costs at least 1.5 hour.

Author was working in Taipei IT Company for 3 years. Grocery shopping was usually the most

                                                            2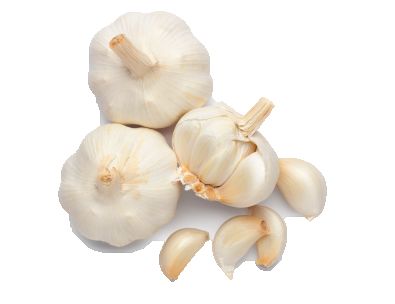
troublesome process for cooking in the crowded Taipei City. After work, people have to drive during rush

hour heading to supermarket. After parking the car, people push the shopping cart to circle the store. The

total process takes at least 30 minutes to one hour. Among the all common cooking materials, vegetable,

compared to meat, is most vulnerable and difficult to preserve. People who want to cook by themselves

inevitably have to shop vegetable frequently. The inconvenience triggers the idea about online vegetables

sales. People can shop at their home or office and have the door-to-door delivery service. Figure 1.2 gives

explanations for people to prefer eat out. Figure 1.2 shows that time limitation is the main reason for

modern people preferring eat out.13 Especially more and more women go to work in today’s society,

further shrinking the time for household. Figure 1.3 shows Taiwan working male and female percentage

change during this decade.6 Women get out from the house to work becomes a trend of future

                                         6.4%

                                                                                Time
  saving


                                                                                Facility
  problem


                                                                                MulBple
  choice


                           42.1%
                           56.2%


  Figure 1.2   Reasons Survey for Eating out (Source: Forward-Looking Magazine Opinion Poll 2007)

                                                    3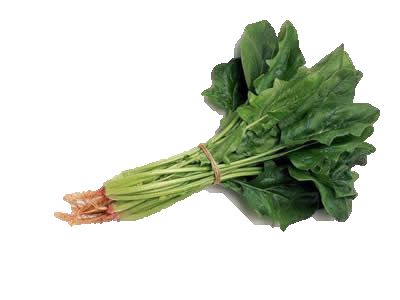
70.00%


                                        68.47%
  68.22%

                           65.00%
                       67.69%
  67.78%
  67.62%
  67.35%
  67.24%
  67.09%

                                                                                                                    66.40%
  66.51%
  66.00%


                           60.00%

   Working
  Percentage

                           55.00%

                                                                                                                                                     Male

                                                                                            49.44%
  49.67%
  49.62%
  49.88%
  50.00%

                                                                                    48.68%

                                                                            48.12%
                                                                 Female

                           50.00%
                       47.14%
  47.71%

                                        46.10%
  46.59%


                           45.00%


                           40.00%

                                        2001
   2002
   2003
   2004
   2005
   2006
   2007
   2008
   2009
   2010
   2011
   Year

                                        Figure 1.3          Male and Female Working Percentage from 2001 to 2011
  (Source: Directorate-General of Budget, Accounting and Statistics, Executive Yuan, R.O.C (Taiwan))

                  Another motivation is the public suspicion in the quality of vegetable. The distrust is not only for the

vegetables sold in traditional market, but also for those in supermarket and department store. Because of

information asymmetry, lots of customers have doubts in the vegetable sold in the market, even those

vegetables that have been official certified by government. Lots of negative news is disclosed, further

eroding the confidence of Taiwan consumer. According to a survey in 2008, Taiwanese still highly

doubted the quality of organic vegetable verified by government.14 Figure 1.4 shows the general public

attitude toward the organic product. For each question, over 50% people have doubts about the products

they bought and don’t trust the verification system. This negative attitude is originated from the distrust of

government and supplier. From early days, people usually purchase vegetable in traditional market or

supermarket. Both shopping location didn’t provide verification reports or certificate of product origin.

The quality of the vegetable is a black box, depending on seller’s self-discipline and conscience. However,

nowadays more and more news disclosed pesticide remains on the vegetables and fake certification report.

Consumers are much cautious about these green products.

                                                                                               4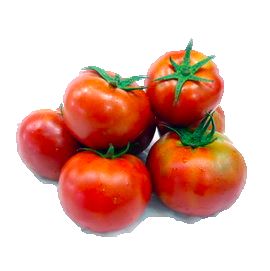
200
                                                                                              187

                                  180

                                  160

                                  140
                                                                       131

    Number
  of
  respondents

                                  120
                                106

                                  100
                                                                                                                              highly
  agree

                                                                  78

                                    80
                 70
                                            69

                                                                                                                                           59
                      agree

                                    60
                                     48
               46
                  50

                                                                                                                                43

                                                                                                                                                                     no
  comment

                                    40
                                                                                                            20

                                                 8
                                   14
                                                                          disagree

                                    20
                                                                                                                     1

                                      0
                                                                                                                            highly
  disagree

                                              Compared to imported Mistrust domestic                                           I doubted that I ever
                                                product, domestic  organic verification                                           buy unqualified
                                                organic product is  process and mark                                            organic agricuture
                                                  more reliable          system                                                      product

                                         Figure 1.4                Taiwanese Mistrust Attitude Surveys to Market Organic Vegetables
                                                                                 (Source: Chang-Ju Huang-Tzeng, 2005)

           Online vegetables sales provide a perfect alternative to solve this question. Internet is the best place

to deliver abundant information. People can read thousands of product description online but can not read

the same thing in traditional market or supermarket. Through providing detail certification report and

purchase record, customers can compare different product and trace their purchasing easily. Complete

information description can lower the cautious toward product. Through continually buying, customers

can gradually build up the trust to organic vegetables.

1.3 Research Methodology and Data analysis

           The information used in this thesis was derived through multiple sources. The Internet user behavior

statistics and analysis is mainly from INSTITUE of INFORMATION INDUSTRY, a Non-Governmental

Organization (NGO) through the joint efforts of public and private sectors, supporting the

development/applications of the information industry as well as the information society in Taiwan. The

data about agriculture products is from AGRICULTURE AND FOOD AGENCY, COUCIL OF

AGRICULTURE, EXECUTIVE YUAN, which in charge of trace and supervise the price variation of
                                                                                                                  5
agriculture products in the wholesale market.
1.4 The Structure of Thesis
Chapter 1 describes the background of this thesis, including objectives, motivations and current status.
In Chapter 2, Taiwan current situation of E-commerce and agriculture will be discussed. Based on the
discussion, some suggestions have been proposed. Chapter 3 represents the main frame of this new
venture business plan, including company structure, operation model and supply chain management. In
the final chapter, conclusion will be given. Also business chances and risks will be discussed.
6CHAPTER 2. STATUS and MARKET REVIEW
Chapter 2 describes the status of Taiwan E-commerce market and consumer behavior, giving a
reference background for business planning. In Section 2.2, the present activities of Taiwan
agriculture market will be discussed. By analyzing the price and volume information of popular
vegetable in five years, the research finds out several precious viewpoints for future business
development. In general, Chapter 2 gives directions and recommendations for online vegetables
sale by reviewing E-commerce market and agriculture market.
2.1 Taiwan E-commerce status review
Compared to single digital growth rate of retail market, Taiwan E-commerce market still have
at least 20% growth rate in 2011. According to Taiwan Institute for information industry, the
economic size of Taiwan E-commerce market reached 14.53 billion USD in 2011.7 Figure 2.1
shows the sales amount and growth rate in recent years. Another observation is that E-commerce
market already passed the fastest growing period. The market is still growing but the growth rate
decrease. Right now online sellers try to provide new service or differentiated products for
surviving in today’s competitive market.
16
14.53
70.0%
14
12.11
60.0%
57.3%
12
9.97
50.0%
46.5%
10
8.07
Amount (billion
37.6%
40.0%
Growth rate
Billion USD
8
USD)
6.23
30.0%
6
4.53
29.7%
3.09
23.5%
20.0%
Growth rate
4
21.5%
20.0%
2
10.0%
0
0.0%
2005
2006
2007
2008
2009
2010
2011
Year
Figure 2.1 Taiwan E-commerce Scale and Growth Rate
(Source: Taiwan Institute for information industry, 2010.10)
7Among all the merchandises sold on the internet. Food category already takes the 2nd position
in Taiwan online market. In the early stage, 3C products, including computer, communication and
consumer, are the most popular products for online sales. Nowadays customers already get used to
buy foods online. Artificial foods, such as cake, canned food or dessert, account for 90% of food
category while fresh vegetables and fruits only account for tiny share. Figure 2.2 shows the top 10
categories in Taiwan E-commerce market. Another interesting point is that the most active
customers on the net is from 30~49 years old. Table 2.1 shows the age and gender distributions of
online shoppers. The left two columns represent the age and the right two columns represent the
gender. According to Table 2.1, 83.1% of the online stores target their customers as 30~39 years
old, the main buying power on the Internet.
Home
gadgets
15.4%
Foods
14.7%
CosmeBcs
13.9%
Women
clothes
10.4%
Kids
10.4%
PC
&
accessory
8.6%
Home
appliance
8.6%
Men
clothes
and
accessory
7.8%
Healthy
foods
7.6%
Books
&
Magazine
5.3%
Figure 2.2 Taiwan E-commerce Top10 Popular Category
(Source: Taiwan Institute for information industry, 2010.10)
8Table 2.1 Taiwan E-commerce Age and Gender Distribution
(Source: Taiwan Institute for information industry, 2010.10)
Age Percentage Gender distribution for each store Percentage
Under 20 6.3% 80% above female 20.5%
20~29 55.6% 60~80% female 22.7%
30~39 83.1% 50~60% female 12.4%
40~49 44.2% 50-50 28.3%
50~59 7.3% 50~60% male 5.3%
Above 60 0.0% 60~80% male 6.8%
80% above male 4.0%
2.2 Taiwan Vegetable Market Status Review and Analysis
Taiwan, located in tropical and subtropical area, is suitable for vegetable production in the
whole year. Taiwan produces warm-season vegetables in summer, from May to September and
produce cool-season vegetables in winter, such as cabbage and spinach. About 180 kinds of
vegetable species now grow in Taiwan. 100 of 180 vegetables are most common species.
Vegetables in summer (from May to September) are vulnerable to typhoon damage, resulting in
shortages and high price in summer time. The cold weather in winter makes high production of
vegetables, easily causing oversupply and low price. In 1998, vegetable cultivation area reached
160,003 thousand hectares. Total weight approached 2.65 million tons, a value of about 1.17 billion
USD.11 Vegetables production accounts for 10 percent of all agricultural output. Nowadays five
kinds of vegetables are growing in Taiwan, including
a.) roots vegetables, including potato, carrot, and etc.,
b.) cauliflower vegetables, like broccoli,
c.) fruit vegetables, like tomato,
d.) leaf vegetables, like cabbage, spinach,
e.) mushroom vegetables, like golden mushroom.
Table 2.2 shows the data analysis for most popular 9 vegetables in the market. The second column
9shows the average price for the product. The third column is the standard deviation of price divided
by price average. This index mainly shows the fluctuation of price. Higher index means a bigger
price variation. The fourth column presents the similar index in volume, indicating the fluctuation
of volume. The fifth column gives the correlation coefficient between price and volume. In general,
the price and volume relationship shows a negative correlation. The correlation coefficient shows
the non-substitutability of the vegetables. Perfect negative correlation means customers are willing
to pay any price even while supply is extremely low. The last column of the table shows the
preserve period of the vegetable. The range is from several days to several weeks.
10Table 2.2 Supply Statistics of Top 9 Common Vegetable from 2007~2011
(Source: Created by Author)
Aver. Correlatio
Stdev/Avg Stdev/Avg Preserve
Category Price n
price volume period
(NTD/kg) (P & V)
Bitter Gourd
34.35 47% 45.5% -0.7 1w
Garlic
57.05 44.9% 86.2% -0.69 1m
Beefsteak
Tomato 31.10 61.1% 33.4% -0.75 1w
Potato
14.87 34.1% 24.8% -0.75 2w
Onion
15.25 26.5% 37.9% -0.5 1w
Golden
Mushroo
44.63 25.6% 29.2% 0.22 2~3d
m
Cabbage
13.71 75.5% 45% -0.83 2~3d
Spinach
27.66 55.6% 102.4% -0.60 2~3d
Broccoli
30.49 47.1% 69% -0.66 4~5d
11Leaf vegetable is the lowest price category among all kinds of vegetables, due to its quick
grown time. On the other hand, mushroom has much value than the other vegetable under the same
weight. Considering the stability of the price, leaf vegetable is usually the highest variation
category, due to leaf vegetable vulnerable to the natural disaster in the summer. For example,
cabbage’s Stdev/Avg price is 75.5%, which shows the highest price fluctuation vegetable in this
table. Stdev/Avg volume indicates the stability of the production. Spinach has the highest
Stdev/Aver because of limited season production (In Taiwan, spinach only grows in winter). On the
other side, Mushroom and root vegetable are much stable compared with leaf vegetables. The
correlation between price and volume indicates the irreplaceability and the fondness of the public.
From the table, we can see Cabbage is the loveliest vegetable for Taiwanese people. Due to hot and
humid weather, vegetable planting is much harder in summer time. Figure 2.3 shows the monthly
price comparison from 2007 to 2011. The shaded section in the figure means summer time of each
year. Obviously vegetable is much more expensive in summer than in winter. The supply of
vegetables also has similar phenomena. The vegetable supply in winter is almost double or triple
than supply in summer. Supply shortage directly caused the high price. Figure 2.4 shows the supply
volume change for top 8 vegetables in Taiwan. The shaded section represents the winter period
from 2007-2011. Another interesting finding in Figure 2.4 is that mushroom vegetable supply is
much more stable than the others because of greenhouse cultivation. This kind of information gives
important references about supply chain management.
12140.0
120.0
100.0
80.0
Price
60.0
40.0
20.0
0.0
01-‐07
04-‐07
07-‐07
10-‐07
01-‐08
04-‐08
07-‐08
10-‐08
01-‐09
04-‐09
07-‐09
10-‐09
01-‐10
04-‐10
07-‐10
10-‐10
01-‐11
04-‐11
07-‐11
10-‐11
Date
biQer
gourd
price
garlic
price
beefsteak
tomato
price
potato
price
onion
price
golden
mushroom
price
cabagge
price
spinach
price
broccoli
price
Figure 2.3 Price (NTD/Kg) Comparison for Top 9 Vegetable in Taiwan
(Source: Created by Author)
800,000
700,000
600,000
500,000
Ton
400,000
300,000
200,000
100,000
0
01-‐07
04-‐07
07-‐07
10-‐07
01-‐08
04-‐08
07-‐08
10-‐08
01-‐09
04-‐09
07-‐09
10-‐09
01-‐11
04-‐11
07-‐11
10-‐11
01-‐10
04-‐10
07-‐10
10-‐10
Date
biQer
gourd
garlic
beefsteak
tomato
potato
onion
golden
mushroom
spinach
broccoli
Figure 2.4 Volume comparison for Top 8 vegetables in Taiwan (Source: Created by Author)
13The value of products is also an important concern for supply management. Some products are
much more valuable than other, contributing much higher profit margin to company. The best
example of vegetables is mushroom and cabbage. The price of mushroom is almost sixth times of
the price of cabbage under the same weight. Figure 2.5 shows the price difference of mushroom
and leaf vegetables. The mushroom data is derived from average price of three different
mushrooms. The Leaf data is the average of 4 different leaf vegetables. Considering the shipping
cost and preserve cost, mushroom becomes much more profitable than leaf vegetables.
180
160
140 LEAF (4 kinds
of leaf
Price (USD/Kg)
120
vegetables)
100
80 MUSHROOM
60 (3 kinds of
mushroom)
40
20
0
01-07
05-07
09-07
01-08
05-08
09-08
01-09
05-09
09-09
01-10
05-10
09-10
01-11
05-11
09-11
Date
Figure 2.5 Price comparison between Leaf and Mushroom vegetables
(Source: Created by Author)
14CHAPTER 3. BUSINESS MODEL
Chapter 3 provides a whole picture about the business activities, including the service and
products, marketing analysis, competitive advantage and financial forecast.
3.1 Summary of Business
TVO, an agriculture products e-commerce company located in Taiwan, mainly sell vegetable
and fruit in big city. The mission of TVO is to offer clean, healthy and high quality products. All
products are sold in the company website. Before shipping, all products have to pass pesticide
remain test. All testing reports can be found on the website and traced in customer personal account.
Besides food security, another characteristic is the fast deliver service. TVO will have self-owned
inventory to speed up the delivery as fast as possible. Under certain condition, TVO even can
provide same day door-to-door delivery service. TVO will have two product lines. One is common
vegetable, and another is special high quality vegetable. At the beginning, TVO only sell vegetables
and then gradually increase the type of product, like fruits, meat, sauce, and etc. Based on the
products positioning, TVO’s target customers are housewives who have job but also take care of
family. They look for healthy food but no time to shop. The products that TVO provide would be
the best solution for the high quality secure foods with deliver service. TVO will try to build up a
new distribution channel by condense the supply chain. Through bypassing intermediate trader, the
saving cost can be transferred to additional shipping service to customers. The initial capital will be
200,000 USD. Half of the initial capital will be used for measurement instrument and office and
warehouse furniture. The rest will be used for daily operation. TVO plans to take 5% vegetable
market share with sales amount reached 25 Million USD within 5 years.
153.2 General Company Description
Taiwan-Vegetable Online Company (Further TVO) will be an E-commerce company located
in Taiwan, offering online vegetable shopping and door-to-door delivery service in the downtown
area. The core values of TVO’s products are secure, affordable and fast. Through precise
instrument checking, TVO ensures all products are secure. Through condense the supply chain,
TVO make price of vegetable affordable. The last characteristic is extremely fast delivery speed,
offering same day delivery under certain condition. TVO will be the first company worldwide
providing vegetable online shopping with same day delivery service.
The mission of TVO is to offer healthy and reliable agriculture products with reasonable price
and introduce high quality agriculture products from individual farmer to general public. The Goal
of TVO is to be a healthy, successful company leading in agriculture products online seller and to
have loyal and health-care customers. The short-term 5 year objectives will be supply over 5%
vegetable market in every major city in Taiwan with high customer satisfaction. Food security is
the first priority to TVO Company. Customers trust the quality of the agriculture products that TVO
sell. All products information are disclosed, including farmer information, vegetable introduction,
produce origin, and no pesticide remains certification.
TVO’s target customers are office ladies aged from 30 to 50. Women in the age usually have
family with several kids under 18, meanwhile also have full time job. TVO’s customers will be a
group of people who care about the food security and pay attention to health but have limited time
to shop.
3.3 Products and Service
From the security aspect, vegetable and fruit can be divided into 4 categories. The first
category is natural grown agriculture product. Vegetables grow naturally without fertilizer and
pesticide. The second category is organic grown agriculture product. Farmers use organic fertilizer
but no pesticide. The third category is non-toxic agriculture product. Farmers carefully use
16chemical fertilizer and pesticide to plant vegetables. The pesticide remain of vegetables is under
government regulation. The latest category is no inspection vegetables. Lots of Taiwan farmer
abused pesticide and fertilizer to their products. This kind of vegetable is usually sold in the
traditional market.
Figure 3.1 Four kinds of agriculture products in Taiwan (Source: Created by Author)
TVO offers two different kinds of products, including common daily used vegetables and
special high quality agriculture product. Two different product lines of TVO are demanded by
different criteria. Common daily used vegetables belong to Non-Toxic category with cheaper price.
TVO will sell the most common 30 vegetables depend on the season. Non-Toxic report will be
attached on the product page that customers can ensure the product safety and security. The
common daily agriculture product is the base of our product offering. This kind of product meets
the basic requirement for general housewife. The price of common daily vegetable will match or a
little higher than the market price but with the delivery service. On the other hand, TVO will
17introduce one or two high quality and special care agriculture product once per week. The high
quality product belongs to organic grown or natural grown category in Figure 3.1. Unlike common
vegetables, high quality product needs special promotion and marketing strategy. TVO will also
introduce the story of every high quality vegetables, including farmer’s struggle history, planting
method and philosophy. The high quality product will be TVO’s star product to attract attention,
incur discussion and keep customer interesting. High quality product will have better profit margin.
The characteristic of TVO is offers online vegetable shopping with same day delivery service
downtown area in Taiwan city. According to TAIWAN CONSUMER PROTECTION LAW, TVO
has return and refund policy in one week for any dissatisfaction.3 TVO will has company-owned
website and direct sell agriculture products to end customer. In the website, every customer will
have personal account. Account owner can trace their purchase history record and buying behavior
analysis. The website will be created and maintained by TVO but the logistics will be outsourced to
transportation companies at the early stage. TVO will have the vegetable inventory to ensure the
food quality and delivery speed. Compared to traditional vegetable shopping behavior, online
shopping can provide lots of benefits during different shopping stage. By analyzing pre-buy,
during-buy and post-buy process, Table 3.1 lists benefits of TVO’s service and product, compared
to the traditional way shopping in supermarket or traditional market.4 The star mark in Table 3.1
means the advantage of online vegetables sales in cartage stage.
Table 3.1 Customer Value Analysis through Buying Process Compared to Traditional Way
(Source: Created by Author)
The advantage of online vegetables sales Pre-Buy During-Buy Post-Buy
1. Save Customer Time ★ ★
2. Provide More Information To Customer ★ ★ ★
3. Food Security ★
4. Introduce High Quality Agriculture Product ★
185. Purchase History Record ★ ★
6. Return and refund service ★
By analyzing the buying process, different benefits can be recognized in the different stages.
The star marks in the Table 3.1 show the additional benefits TVO can provide to customers in the
certain stage. Online vegetables sales can provide more information than physical stores. In the
pre-buy stage, TVO can offer verification report and more information while customers surfing the
website. In the during-buy stage, TVO can provide shipping number for customers to trace their
orders. In the post-buy stage, TVO can provide some add-on feature, such as cooking recipes and
suggestion. Also online vegetables sales can give great confidence to consumer in the food security
aspect. People can check all verification and certification report before purchasing but can’t so
while shopping in traditional market or supermarket.
3.4 Target Customers
The target customers are women who have full time job and family. TVO’s customers care
about the food security and are affordable to purchase high quality agriculture product, however
they usually do not have enough time to shop in the supermarket. Also TVO’s target customers are
familiar with computer and already get used to shop online. These kinds of housewives are often
white-collar workers living in the city area. The income level of customer’s family is high due to
dual income source. Therefore, target customers should be white-collar office lady between age of
30 and 50. They live in downtown with higher income.
3.5 Supply Chain Analysis
Agriculture supply chain is a highly localization industry varies from one country to another.
Agriculture marketing system is heavily influenced by country’s culture, production type and life
behavior. In general, Taiwan agriculture products have several ways from individual farmers flow
19to end customer. The majority is that shippers collect products from individual famers then sell in
the farmers market. The wholesalers bring the products to the wholesale market, located in the big
city. Local supermarket, retailers or restaurant owner auction vegetables in the wholesale market
then bring to traditional market. Finally the products are sold to end customers in traditional market.
The percentage index in the figure 3.1 represents the ratio through each channel. The distribution
structure is developed bases on Taiwanese agriculture situation. Because most of Taiwan farmers
are small-scale producer, shippers are needed to collect enough products from different producer to
save the shipping cost. On the other side, most of people buy vegetables in the traditional market.
The scale of seller in the traditional market is too small to auction in the wholesale market (a seller
in traditional market only trades 200kg vegetable per day). Brokers are needed to auction
vegetables then distribute to several sellers.9 This multilevel supply chain cause unnecessary waste
both in money and time. Figure 3.2 shows the Taiwan agriculture system.
20Individual Farmers
Farmers' Shippers
Association,
Cooperative Farm
Association Suppliers
Market
Wholesalers
Buyers
TVO
Brokers Wholesales
Market
Buyers
87%
Retailers, Traditional
Supermarkets, Market
Hypermarkets
92%
Big Contract
Consumers
Clients
8% 92%
Figure 3.2 Taiwan Agriculture Supply Chain System and TVO Positioning
(Source: Xu, Wen-Fu, 1997)
21Table 3.2 shows the shipping Costs structure through different distribution path. Only two
paths in Figure 3.2 are listed.
a.) One level supply chain, only one middleman between producer and end customers (The
left hand side path in Figure 3.2):
Individual farmersàFarmers’ associationàBig contract clients (School, Army...)
b.) Three level supply chain, three middleman between producer and end customers (The
right hand side path in Figure 3.2):
Individual FarmersàFarm marketàWholesale marketàTraditional marketàEnd
customers
Three common vegetables are taken as examples in each path, including cabbage, carrot and
broccoli.
Table 3.2 Vegetable Shipping Cost Structure through Different Distribution Path
(Source: Xu, Wen-Fu, 1997)
USD/100Kg
One Level Supply Chain Three Level Supply Chain
Stages Cabbage Radish Broccoli Cabbage Radish Broccoli
I
Price in production origin 17.8 42% 15.7 45% 23.9 49% 17.2 26% 14.2 26% 22.8 29%
Shipping Cost 1.9 4% 2.2 6% 1.5 3% 5.9 9% 6.9 13% 6.6 8%
Package Cost 1.4 3% 1.2 4% 1.9 4% 2.8 4% 4.0 7% 4.3 5%
Shipping
Damage 3.4 8% 1.6 5% 7.5 15% 7.3 11% 2.5 5% 11.3 14%
Distribution
Labor Cost 2.2 5% 1.8 5% 1.7 3% 1.0 2% 0.4 1% 3.4 4%
CostII
SG&A 2.4 6% 2.1 6% 2.4 5% 3.1 5% 0.3 0.5% 4.1 5%
ProfitIII 12.9 31% 9.9 29% 10.4 21% 28.1 43% 25.9 48% 25.9 33%
Distribution
Total Expense 24.2 58% 18.9 55% 25.4 51% 48.3 74% 39.9 74% 55.6 71%
Retail Price
(Origin Price + Distribution
Total Expense) 42.0 100% 34.5 100% 49.3 100% 65.5 100% 54.1 100% 78.5 100%
22By analyzing the cost structure in Table 3.2, some observations are worthy to mention. First,
Farmers earning ratio (Price in production origin/Retail price) is around 25% to 50% depends on
different distribution channel. The index is quite low compared to US, Canada or Argentina.
Because most of Taiwan farmers are small-scale producer, this type of production can’t take
advantage of the economic scale. Secondly, The distribution cost in agriculture product is
extremely high. In any channel, the distribution costs are higher than production cost. Therefore,
supply chain simplification has significant influence in retail price reduction. Thirdly, the row of
profit of shipping is not as high as the number shown in the table. Because the wholesalers or
shipper are often family or individual company, the wage of themselves is usually not counted in
the labor cost. Last, the percentage of one level supply chain is still much smaller than three level
supply chain.
As an E-commerce company, TVO have self-own distribution channel through company
website to approach the end customer. TVO would like to create a totally new one-level
distribution path, bypassing the wholesale market and traditional market and directly dealing with
individual farmer or Farmer’s association (Shown in Figure 3.2, the left hand side path outside the
box). Eliminating intermediate trader can further reduce the cost. The saving cost will compensate
the door-to-door delivery cost and repay to customer. Taking carrots as example, Figure 3.3 shows
the price difference between one-level and three-level supply chain. The price difference is 36%, an
unusual high percentage. This difference is the margin that TVO used to provide additional service
to general public.
2360.0
50.0 Price difference, 19.5
40.0 Distribution total
expense, 39.9
Price 30.0 Distribution total
expense, 18.9
20.0
Price in production Price in production
10.0 origin, 15.7 origin, 14.2
0.0
One Level Supply Chain Three Level Supply Chain
Carrot
Figure 3.3 Price Difference between One Level and Three Level Supply Chain
(Source: Created by Author)
3.6 Competition Analysis
As a new comer in the agriculture retailer industry, analysis of competitors is very critical.12
TVO has two major competitors, individual sellers in the traditional markets and supermarkets.
Compared to the traditional way of shopping vegetables, TVO brings new shopping experience to
customers as well as new advantages and disadvantages. Most of advantages already discussed in
the Section 3.2. Section 3.6 only focuses on the disadvantage. The first disadvantage is the price.
Due to the shipping cost, the price of TVO’s products will be a little bit higher than competitors.
Secondly, the selection of product combination is fewer than traditional market and supermarket. In
the traditional market, lots of individual sellers provide abundant of choices, for instance, any kinds
of vegetables, meat and grocery. Supermarkets or hypermarkets provide even more merchandise
covering all aspects of life. These two competitors provide any basic need for housewives. Except
for these two disadvantages, the other disadvantages are originated from business model or small
size of company. For example, the appearance and transaction security are the mutual weaknesses
24for E-commerce. Disadvantage of supply stability, company reputation and advertising are also the
common difficulties for start-up of small company because of lacking resource and credit. Table
3.3 shows the competition analysis for these two main competitors: traditional market and
supermarket. The first column of Table 3.3 is the factors that customers may care. The last column
is the importance to customers for that factor. 1 means most important and 5 means least important.
Table 3.3 is created base on author’s observation.
25Table 3.3 Competition Analysis for Taiwan Agriculture Market (Source: Created by Author)
Importance
Traditional
FACTOR TVO Strength Weakness Supermarket to
Market
Customer
Common and Only Only
Products High Quality ★ Common Common 3
Vegetables Vegetables Vegetables
Price High ★ Low Middle 1
Quality High ★ Low Low 1
Selection Low ★ High High 3
Door-to-door
Service ★ No No 2
delivery
Supply
Middle ★ Low High 3
Stability
Company
Low ★ Low High 3
Reputation
Location Anywhere ★ Many Many 3
Can’t see
Appearance ★ No problem No problem 2
while buying
Sales Online
★ Direct sale Direct sale 4
Method shopping
Online
Transaction
transaction ★ No problem No problem 2
Security
security issue
Advertising No ★ No Yes 4
Image No ★ Low High 3
263.7 Potential customers marketing survey
Even best business plan can’t be recognized without detailed market research. In section 1.2
Research Motivation, E-commerce and Vegetable market status were already discussed. Section 3.7
focuses on TVO’s target customer survey. The author makes a questionaries’ survey to the future
potential customers who have family and usually cook at home. The survey has 18 questions and
was conducted via Mysurvey.com. Most of the respondents are women who are between 25 and 35
years old and women who have families. At the beginning, respondents are asked to fill basic
personal information, such as gender, age, occupation and family status. Then several multiple
choices questions are followed to check respondent’s daily cooking and buying behavior. At the
end of questionaries’ survey, the respondents are asked the expense of buying grocery, as well as
the time spending in preparing food.
The survey was conducted through Internet and telephone. The number of effective sample
was 236. Majority of the respondents are female, consisting of 61.02%. 55.08% of respondents
were ages 25-34, followed by 15-24 with 32.63%. The detailed questions and results are shown in
Appendix. The basic information of respondent is shown on Figure 3.4.
100%
45-54, 7
35-44, 19 Married(having
90%
Kids), 32
80% Married(no child),
15-24, 77 35 Male, 92
70%
60%
50%
40%
30% Single, 169
25-34, 130
20% Female, 144
10%
0%
Age
Marriage
Gender
Figure 3.4 Age, Marriage and Gender Distribution of Respondents (Source: Created by Author)
27To determine the market demand, the questionnaires ask the number of times for grocery
shopping in one week as well as amounts spend in one time. In Figure 3.5, 46% respondents shop
for cooking 1-2 times in weekday with another 15% shopped only in weekend. The combined two
indexes showed that over a half of respondents shopped once to twice in one week.
Everyday
6%
Only weekend
15%
1-2 times
46%
3-4 times
33%
Figure 3.5 Number of Times Shopping in One Week (Source: Created by Author)
To determine our minimum order for free shipping, understanding the spending amount is
very important. Table 3.4 shows the spending statistics of different category. Common sense was
that people spend much more in buying meat than vegetables. But from the statistics, the spending
difference between vegetable (including fruits and vegetables) and meat (including fish and meat)
is quite small. The minimum order for free shipping could be a little bit higher than respondents’
average spending amount, pushing customers to buy a little more to meet the free shipping criteria.
Figure 3.6 shows the spending distribution of each category, giving a positive sign to TVO’s
business. Due to healthy consideration, modern people now are willing to spend more in the
28vegetables.
Table 3.4 Spending Each Time on Different Food Category (Source: Created by Author)
USD/Times
Under 3.3USD 3.3-6.6USD 6.6-10USD 10-13.3USD Above 13.3USD Average
Vegetables 21.37% 38.03% 21.37% 10.68% 8.55% 6.57
Fruits 20.09% 37.18% 20.51% 12.39% 9.83% 6.82
Fish 25.64% 26.50% 21.37% 19.23% 7.26% 6.87
Meat 11.97% 30.34% 29.06% 19.66% 8.97% 7.78
90
80
70
60
Under
3.3
USD
Number of respondents
50
3.3-‐6.6
USD
40
6.6-‐10
USD
30
10-‐13.3
USD
20
Above
13.3
USD
10
0
Vegetables
Fruits
Fish
Meat
Kinds
of
products
Figure 3.6 Money Spending in One Time Food Shopping (Source: Created by Author)
The survey also covers preference for shopping location and the current bother and drawback
while shopping in preference location. 50% of respondents shop grocery in the traditional market.
Chain supermarket takes the 2nd place, attracting 25% respondents. Figure 3.7 shows the
distribution of each category.
29department
store
other
2%
2%
hypermarket
21%
tradiBonal
market
50%
chain
supermarket
25%
Figure 3.7 Preference Shopping Location Distribution (Source: Created by Author)
The bothers of current preference shopping location are asked in this survey. The purpose is to
find out the discontent of potential customers, and to use those discontents improving TVO’s
solution. In Figure 3.8 all bothers of the physical store are advantages of online store, except the
issue “No other grocery”. Some respondents feedback that hypermarket could be a one stop shop
offering any kinds of products including clothes, toys or bicycle. This is a critical feature why some
people love hypermarket more than the others. At the beginning stage TVO’s website is hard to
offer all life necessaries, partly because the logistics system for fresh products is totally different
from the other products and partly because of the size of company.
No
clear
product
descripBon
Parking
problem
Few
items,
can't
shop
in
one
place
Time
waste
No
other
grocery
Store
is
too
far
away
Uncompfortable
shopping
environment
Other
Number
of recipients
0
20
40
60
80
100
Figure 3.8 Bothers of Current Shopping Location (Source: Created by Author)
30Another important question is the shopping consideration. Respondents are asked about the
most concern while shopping food. 29.84% people take food security as first priority. Followed by
price concern, 29.32% respondents take price as an important factor for decision-making. Figure
3.9 shows the complete result. In short, the survey gives a strong support to TVO business. Food
security is the first priority of TVO’s business.
Food security
Price
Outlook and quality
Easily to preserve
Other
Number of
0 10 20 30 40 50 60 70 80 respondents
Figure 3.9 The Most Concern while shopping Food (Source: Created by Author)
3.8 Operation plan
Purchasing Flow of TVO is simple and efficient. While customers make orders on the website,
the information will pass to the warehouse directly and the item list will be printed out. The staffs
take the list and collect all items from the shelf, putting times in one basket. By using conveyer belt,
the basket is transferred to another room for package and delivery. After checking the list, the staffs
will package the products and transfer to a logistics company. The whole process from order to
logistic company only takes 20 minutes at most. Figure 3.10 shows the operational flow of each
transaction.
31Customer make order online
Order list is printed in the
warehouse
Staff collect all the items show
on the list and put in one
basket, then transfer the basket
to shipping division through
conveyer belt
Workers check the list and
package vegetables, then ship
Product to end customer
Figure 3.10 Operational Flow from Order to Ship (Source: Created by Author)
The office hour starts from 8:00 AM to 6:00 PM. In the midnight, vegetables are delivered
from countryside every night based on the sales forecast. In the morning, staffs will check the
inventory status and update information in the system. Order will be processing and delivery to
customers during office hour 8AM to 6PM. All orders after 6PM will be delivered next day. Figure
3.11 shows the daily operation flow.
321. Vegetable shipping from country
side to warehouse in the midnight Order after 6:00 PM will be
2. Daily supply volume will be real deliver by tomorrow
time updated in the website
8:00 AM 6:00 PM
Off Office Hour Off
Figure 3.11 Daily Operation (Source: Created by Author)
Pesticide checking is also an important section in TVO’s daily operation. Three days before
seles, TVO will check the pesticide remain in produce origin by Gas Chromatograph Mass
Spectrometer. Gas chromatography–mass spectrometry (GC-MS) is a method that combines the
features of gas-liquid chromatography and mass spectrometry to identify different substances
within a test sample. The technology is broadly used in pesticide and fertilizer detection. The
drawback of GC-MS method is a long time of the examination. In general, the method takes few
days to get the result. However, GC-MS has been widely heralded as a "gold standard" for forensic
substance identification because it is used to perform a specific test. A specific test positively
identifies the actual presence of a particular substance in a given sample. There are some
compounds for which GC-MS is not sufficiently sensitive, including certain pesticides and
herbicides, but for most organic analysis of environmental samples, including many major classes
of pesticides, GC-MS is very sensitive and effective. If no pesticide detection, vegetables can be
sold on TVO’s website. Meanwhile, random sample check will be done while vegetable shipping to
warehouse to make sure no pesticides or herbicides have been used within 3 days. Food security is
the first priority and the differentiation advantage of TVO. On the product page, the measurement
result will be posted with every vegetable. The meticulous pesticide checking flow reflects the core
value of TVO’s business. Figure 3.12 shows the pesticide checking flow of TVO.
33You can also read