DERA Economic and Risk Outlook - S.P. KOTHARI Director and Chief Economist and DERA Research Staff - SEC.gov
←
→
Page content transcription
If your browser does not render page correctly, please read the page content below

U.S. SECURITIES AND EXCHANGE COMMISSION
             Division of Economic and Risk Analysis

    DERA
 Economic
  and Risk
   Outlook
                                   S.P. KOTHARI
                    Director and Chief Economist
                                                      and
                                DERA Research Staff
APRIL 23
 2020
Table of Contents
Key Highlights...................................................................................................................................1
   The Proliferation of Coronavirus Cases............................................................................1
   Financial Market Stress and Fed Response....................................................................1
   The Coronavirus Unemployment Spike and Fiscal Stimulus..................................2
   The Coronavirus Impact Varies Markedly by Sector..................................................3

Macro-Financial Overview...........................................................................................................5
   Economic Fundamentals and Growth.............................................................................5
   Monetary Policy and Interest Rates..................................................................................7
   Financial Market Signals.....................................................................................................10

Market Segments.......................................................................................................................... 17
   Markets...................................................................................................................................... 17
   Money Market, Mutual Fund, and ETF Investors........................................................ 18
   Borrowers, Securities Issuers, and Capital Formation............................................. 21

About the Division of Economic and Risk Analysis (DERA): As the agency’s “think tank,” DERA’s analysis draws
on multidisciplinary quantitative and qualitative approaches and leverages its knowledge of market institutions
and industry practices to help the Commission address complex matters. DERA assists in the Commission’s
efforts to identify, analyze, and respond to risks and trends, including those associated with new financial products
and strategies. DERA engages in activities across the entire range of the SEC, including policy-making, rule-
making, enforcement, compliance, and examination. In addition, DERA economists participate in and produce
high-quality research. Specifically, DERA economists publish regularly in top peer-reviewed journals, including the
Journal of Financial Economics, the Journal of Labor Economics, and the Review of Financial Studies.

DERA Research Staff: Chandler Lutz (Lead Economist), Igor Kozhanov, Maciej Szefler, Kelvin Liu,
Giulio Girardi, Daniel Hiltgen, Vladimir Ivanov, and Pamela Urban.

OPA Design Team: Chris Gamboa-Onrubia, Zehra Sikandar, and Jennifer White.

Disclaimer: The SEC disclaims responsibility for any private publication or statement of any SEC employee or
Commissioner. This article expresses the authors’ views and does not necessarily reflect those of the Commission,
the Commissioners, or members of the staff. This report contains a non-exhaustive aggregation of information
and is one of several elements of the SEC’s risk and market monitoring efforts.

sec.gov/dera

Key Highlights as of April 15, 2020
Economic Activity in the United States and Globally is on Pause to Battle the Coronavirus
(COVID-19) Pandemic: To combat the coronavirus pandemic, policymakers have enacted
stay-at-home orders for nonessential workers and encouraged citizens to practice social
distancing. These actions, while necessary for public health, prevent many consumers and
firms from engaging in their typical, day-to-day economic activities. In anticipation of a sharp
slowdown in economic activity, during mid-March U.S. equity indices declined, firm default
probabilities spiked, and financial market volatility surged as investors expected starkly
lower corporate profits and revenues. In addition to reducing profits, lower revenues also
render debt service less certain, leading to increased interest rates for lower rated debt and
widening credit spreads that have persisted through mid-April. As the coronavirus-induced
economic downturn unfolded, initial unemployment claims, often a leading economic
indicator, spiked. In response to the crisis, both the Federal Government and the Federal
Reserve (Fed) have implemented unprecedented economic and monetary stimulus.

The Proliferation of Coronavirus Cases
Increases in U.S. Coronavirus Cases: The number of
coronavirus cases climbed in March 2020 and subsequently
totaled over 600,000 by April 15 with 25,000 deaths
(Figure 1.1). Dr. Anthony S. Fauci, the Director of the
National Institute of Allergy and Infectious Diseases
(NIAID), expects U.S. coronavirus deaths to rise from the
last levels seen in Figure 1.1.

Financial Market Stress and Fed Response
The Coronavirus-Induced Economic Slowdown Quickly
Rippled through Corporate Equity and Debt Markets: In
response to a rapid rise in the number of confirmed coronavirus
cases in the United States in early March 2020, authorities
announced stay-at-home orders for workers in many industries
and encouraged social distancing policies for the entire
population. A widespread slowdown in economic activity
ensued, a spike in unemployment became likely, and a large
decline in corporate revenue and profits followed. Equity
prices declined sharply and corporate debt became riskier. In
addition, during mid-March, uncertainty rose dramatically as
witnessed in a historically large rise in the VIX index (Figure
1.2). The market volatility is related to varying estimates of

                                                 DERA ECONOMIC AND RISK OUTLOOK | 1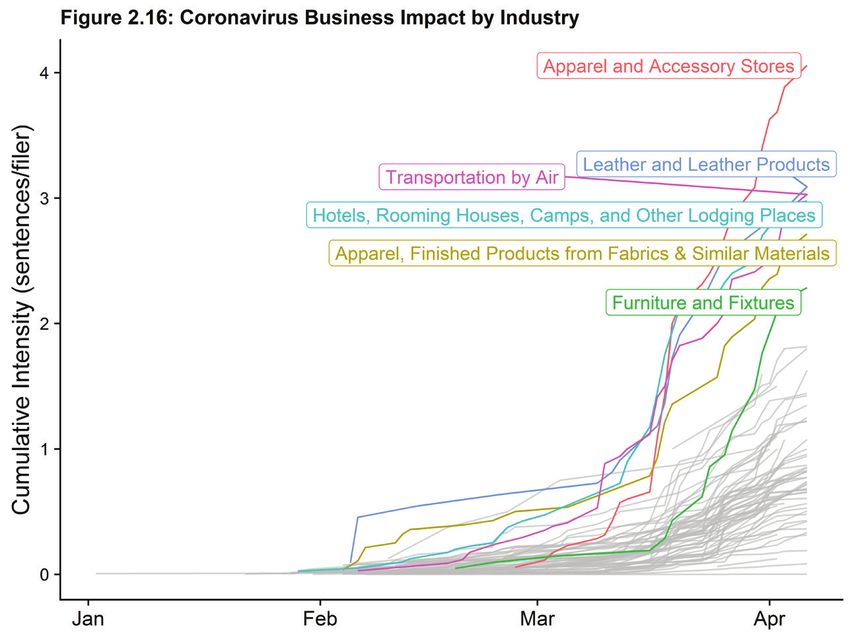
the severity and length of the impact of the coronavirus on the economy as well as the nature of
policymakers’ response to the crisis. These changing dynamics corresponded with widening credit
spreads that reflect increased default probabilities and deteriorating expectations of firms’ ability
to service debt (Figure 1.3).

As the Coronavirus Pandemic Intensified, Firms and Investors
Increasingly Demanded Dollars as Prospects of Future
Revenue Declined: Coincident with lower expectations of
economic output and corporate profits, many firms, investors,
and households rushed to strengthen their cash balances
to better cope with the adversity that they expected. Firms
initiated asset sales and began to draw on their credit lines.
This large-scale shift likely contributed to the decline in asset
values and the surge in volatility documented above, but it also led to a marked increase in the
value of the dollar. Figure 1.4 shows that between February 10 and March 23, coinciding with
the rise of coronavirus-related market uncertainty and volatility, a trade-weighted dollar index
increased by over 8%.

Declining Economic Output, Market Illiquidity, and Financial
Market Stress Prompted the Fed to Pursue Crisis-Era Policies
and Increase the Size of Its Balance Sheet: In response to the
significant stresses in financial markets, beginning in mid-
March 2020 the Fed initiated a wide array of crisis-era policies
under pressing circumstances to provide exceptional monetary
stimulus and market liquidity. These actions included large-
scale asset purchases of U.S. Treasuries and agency mortgage-
backed securities (MBS) as well as various liquidity facilities and dollar swap lines. Altogether
with these actions, as of April 15, the Fed’s balance sheet has grown by about $2 trillion since
mid-February (Figure 1.5).

The Coronavirus Unemployment
Spike and Fiscal Stimulus
To Counter the Sharp Coronavirus-Induced Increase in
Unemployment, the Federal Government Implemented
Unprecedented Economic Stimulus: Because of the coronavirus
economic slowdown, weekly initial unemployment claims
increased by more than a factor of 10 to over 6 million in late
March and early April (Figure 1.6). To combat the far-reaching
economic stoppage, the Federal Government implemented
fiscal stimulus of $2 trillion through the CARES Act. This law
allocates $560 billion for individuals with stimulus checks

2 | U.S. SECURITIES AND EXCHANGE COMMISSION
of up to $1,200 per person for those earning less than $75,000 and provides for the expansion and
extension of unemployment benefits. In addition, the bill allocated large amounts for loans, loan
guarantees, and other investments, including $500 billion for large corporations; $377 billion for
small businesses; $340 billion for state and local governments; and $153.5 billion for public health.
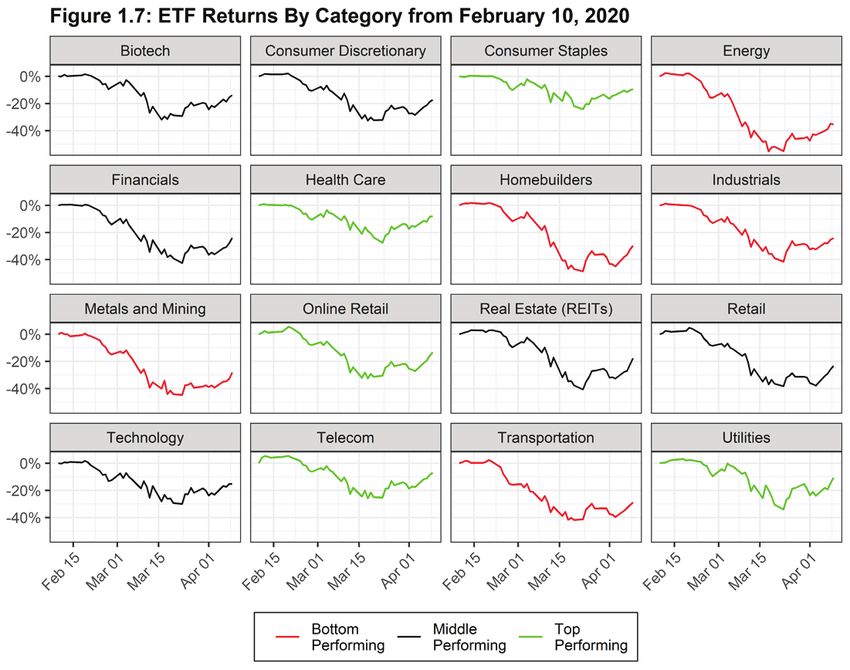
The Coronavirus Impact Varies Markedly by Sector
The Coronavirus Economic Fallout has
had an Outsized Negative Effect on the
Energy, Industrial, Transportation, and
Homebuilding Sectors: Figure 1.7 proxies
the coronavirus impact by sector using
exchange-traded fund (ETF) returns
from February 10 to April 10, 2020.
The hardest-hit sectors (red lines) include
the energy, homebuilder, industrial,
metals and mining, and transportation
sectors. The energy, industrial, and metals
and mining sectors face large demand
declines in the aftermath of the pandemic,
where oil firms are further impacted by
increased price and supply competition.
Figure Notes: Red lines are the 5 industries with the lowest (most negative)
Homebuilders are suffering from the
total price change from February 10 to April 10, 2020. Green lines are the
broad economic decline, potential mortgage top performing industries in terms of total price change from February 10
to April 10, 2020.
market dislocations attributable to turmoil
in the non-bank sector, and the impact of social distancing on the showing of homes. Likewise,
coronavirus-induced social distancing is directly reducing travel and transportation across the country.
CARES Act: https://www.congress.gov/bill/116th-congress/house-bill/748/text
NPR CARES Act Summary: https://www.npr.org/2020/03/26/821457551/whats-inside-the-senate-s-2-trillion-coronavirus-aid-package
Figure Notes: Blue bars are NBER recessions.
Data Sources: Figure 1.1: The New York Times, based on reports from state and local health agencies (available at https://github.
com/nytimes/covid-19-data); and Johns Hopkins University CSSE (available at https://github.com/CSSEGISandData/COVID-19).
Figure 1.2: Chicago Board Options Exchange, retrieved from The Federal Reserve Economic Database (FRED) (ID: VIXCLS).
Figure 1.3: Moody’s, retrieved from Wharton Research Data Services (WRDS). Figure 1.4: Fed Board, retrieved from FRED (ID:
DTWEXBGS). Figure 1.5: Fed Board, retrieved from FRED (ID: WALCL). Figure 1.6: U.S. Employment and Training Administration,
retrieved from FRED (ID: ICSA). Figure 1.7: Datastream.
DERA ECONOMIC AND RISK OUTLOOK | 3
Macro-Financial Overview
The macro-financial environment is encapsulated in three key aggregate drivers of financial
decisions: (1) economic fundamentals and growth; (2) monetary policy and the path of
interest rates; and (3) financial market signals and credit conditions.

Economic Fundamentals and Growth
  Key Takeaway: In the wake of the coronavirus pandemic, U.S. economic output is
  predicted to fall substantially, initial unemployment claims increased to a rate of more
  than 6 million per week, and 701,000 jobs were lost during the month ending
  March 12, 2020. Economic growth is forecasted to turn positive again by 2020Q3.

U.S. coronavirus cases increased in March and April 2020,
with more than 600,000 confirmed cases and over 25,000 deaths
as of April 15, 2020 (Figure 2.1). Dr. Anthony S. Fauci, the
director of the NIAID and a leading infectious disease expert,
expects U.S. deaths due to the coronavirus to rise from the last
levels seen in Figure 2.1.

To fight this pandemic, local and federal U.S. policymakers issued
stay-at-home guidelines for nonessential workers and encouraged
citizens to practice social distancing. Although health experts
deemed such actions as necessary for public health, they severely
limit consumers and firms from participating in their usual,
everyday economic activities. Figure 2.2 plots real quarterly gross
domestic product (GDP) dating back to the Great Recession, as
well as forecasted GDP for 2020Q1-Q3. While the U.S. economy
was consistently expanding at a 2–3% annual rate prior to the
coronavirus outbreak, forecasters currently predict a 6% GDP drop in just two quarters from
its peak in 2019Q4 (median forecast tabulated by MarketWatch). Assuming that the economy
would have otherwise grown at 2%, the lost economic output due to the coronavirus outbreak
just through 2020Q2 will be nearly $400 billion. In historical terms, a two-quarter GDP drop
of this magnitude is unprecedented. During the Great Recession of 2008-09, GDP from peak to
trough fell only 4%, as seen in Figure 2.2.

                                                  DERA ECONOMIC AND RISK OUTLOOK | 5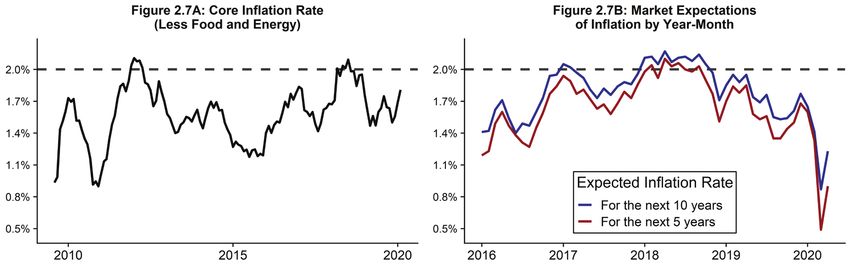
Going forward, the severity of the coronavirus economic damage will hinge on the pandemic’s
duration and how quickly the United States and its principal trading partners can resume normal
economic activity in whole or in part. Many factors will determine the time for recovery, including
frictions in labor market search and matching, firm failures, housing and mortgage market activity,
as well as consumer confidence and spending. Indeed, the resumption of economic activity will
require a recommencement of both supply and demand. Thus, even if firms restart production,
households may be hesitant to venture out to enjoy the available potential output. Such hesitancy
may be a direct consequence of the pandemic. For example, when restaurants reopen, unless
customers walk in to dine in those establishments in the same numbers or with the same frequency
as before the slowdown, economic activity will not match pre-coronavirus levels. Households
may also not quickly return to their normal pre-coronavirus consumption patterns because of the
economic fallout of the pandemic. If severely affected consumers only slowly regain employment
or if their savings dwindled as the economy contracted, they may forego some purchases
immediately after the crisis. Nonetheless, forecasts as of mid-April collected by MarketWatch (see
Figure 2.2) expect the United States to register robust economic growth at an annual rate of 7% in
2020Q3, but with output below its pre-coronavirus levels.

The sudden and unprecedented impact of the coronavirus shock
is also apparent in the swift rise in initial unemployment claims,
which reached over 6 million per week in late March and early
April (Figure 2.3). The jobless claims will likely morph into a
higher unemployment rate.

Figure 2.4 shows several
other economic series that
are already experiencing
coronavirus-induced
economic weakness.
Figure 2.4A documents
that after a year of
increasing employment,
the economy lost 701,000
jobs in the month ending
March 12, 2020. The
leisure and hospitality
sector accounted for the
bulk of the job losses
where employment fell by              Key Figure Takeaway: The coronavirus pandemic has taken
459,000.                              a large toll on employment and consumption.

                                      Figure Data Sources: Figure 2.4A: The Bureau of Labor Statistics (BLS), retrieved from FRED
                                      (ID: PAYEMS). Figure 2.4B: BLS, retrieved from FRED (ID: UNRATE). Figure 2.4C: Bureau of
                                      Economic Analysis (BEA), retrieved from FRED (ID: TOTALSA). Figure 2.4D: Datastream.

6 | U.S. SECURITIES AND EXCHANGE COMMISSION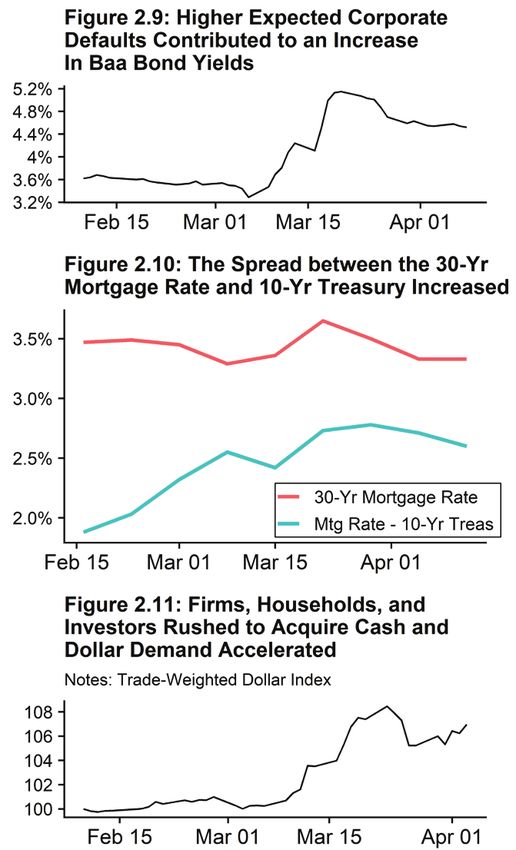
The jump in the unemployment rate for the United States overall was 0.9 percentage points to
4.4%. The 20+ million unemployment claims filed in late March and early April, as noted above,
will likely translate into an unemployment rate that will be markedly higher in upcoming months.

Altogether, the economic outlook is bleak in the near term, whereas longer term economic
prospects depend on the swiftness of virus containment and the restarting of the U.S. economy.
Indeed, while the end date for the pandemic-induced economic pause is not yet known, forecasts
indicate that growth in 2020Q3 may be around 7%, but output will be substantially below pre-
coronavirus levels (Figure 2.2).

Monetary Policy and Interest Rates
  Key Takeaway: To counter the coronavirus pandemic, the Federal Reserve Open
  Market Committee (FOMC) lowered the target range for the fed funds rate to 0–0.25%
  and announced unlimited purchases of Treasury securities and agency MBS. In addition,
  the Fed, in conjunction with the U.S. Treasury, initiated various liquidity and purchas-
  ing facilities targeting corporate bonds, small- and medium-sized businesses, municipal
  securities, asset-backed securities (ABS), dollar swaps, commercial paper, and repo
  markets, among others, to provide further monetary stimulus and battle market illiqui-
  dity. As of April 15, 2020, the size of the Fed’s balance sheet had already surpassed
  $6 trillion. Yet yields on a variety of lower rated debt instruments rose as default prob-
  abilities increased and market liquidity fell. The yield curve suggests a low risk-free
  rate moving forward, but wide credit spreads persist as of mid-April 2020.

As the coronavirus pandemic unfolded, the FOMC
lowered the fed funds rate first by 50 basis points to a
target range of 1–1.25% on March 3 and then to a target
range of 0–0.25% on March 15. Figure 2.5 plots the recent
path of the fed funds rate, along with the expected fed
funds rate as implied in futures markets’ prices. Futures
traders expect the fed funds rate to stay at its zero lower
bound; hence, the Fed’s monetary stance is expected to             Note: More information and term sheets
remain accommodative as the economy recovers from the              associated with the Fed’s extraordinary monetary
                                                                   policy actions can be found at https://www.
coronavirus crisis.                                                federalreserve.gov/newsevents/pressreleases/
                                                                   monetary20200323b.htm. For the most recent Fed
                                                                   press releases, see https://www.federalreserve.gov/
                                                                   newsevents/pressreleases.htm.

                                                 DERA ECONOMIC AND RISK OUTLOOK | 7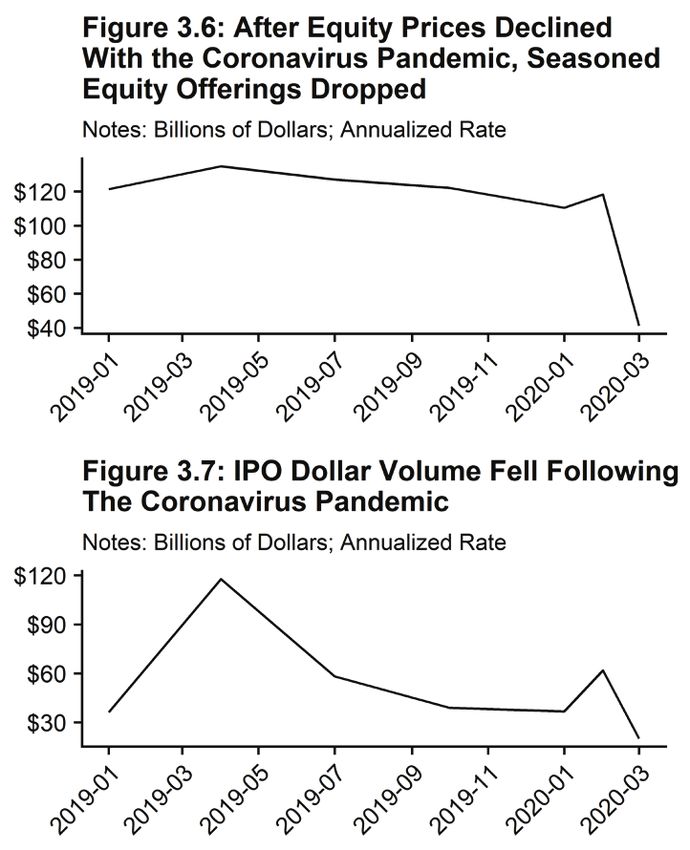
To support market liquidity, the Fed also announced unlimited purchases of Treasuries and
agency MBS (both commercial and residential). These large-scale asset purchases coincided with
the formation of numerous facilities to provide liquidity and further monetary stimulus in credit
markets. The Fed programs include facilities to support liquidity in various markets and target
corporate bonds and ETFs in the primary and secondary markets (rated BBB-/Baa3 or higher
as of March 22, 2020, and BB-/Ba3 at the time of purchase); AAA-rated ABS backed by certain
loans, including student loans, auto loans, credit card loans, loans guaranteed by the Small
Business Administration (SBA), commercial mortgages, (leveraged) corporate loans through
collateralized loan obligations (CLOs), or related securities; money market funds; municipalities;
and loans to small- and medium-sized businesses. Fed measures also consist of dollar liquidity
swap lines with foreign central banks and lowering the primary credit rate by 150 basis points to
encourage banks to borrow from the discount window.

Altogether, the Fed’s balance sheet has increased from about $4.1 trillion to over $6 trillion in
response to the crisis (Figure 2.6). The purchase of Treasury securities accounts for the majority
of this change.

While the recent asset
purchases are sizable, Figure
2.6 also places the data in
historical perspective by
showing data back to the
Great Recession. In response
to the Great Recession, Fed
assets grew from just under
$1 trillion to approximately
$4.5 trillion, an addition of
$3.5 trillion, which is larger
both in absolute and relative               Figure Data Source: Fed Board, retrieved from FRED (IDs: WALCL, TREAST,
                                            WSHOMCB, WORAL).
terms than the Fed’s recent
actions. Yet as the economic effects of the coronavirus crisis linger, the Fed might further increase
asset purchases, and thus the size of its balance sheet in the coming months.

8 | U.S. SECURITIES AND EXCHANGE COMMISSION
Despite the recent Fed stimulus, the coronavirus crisis has caused inflation expectations to plummet.
To provide historical context, Figure 2.7A shows that the core inflation rate rarely reached the Fed’s
symmetric 2% inflation target over the last decade. Figure 2.7B plots inflation expectations over the
next 5 and 10 years from a given point in time computed from Treasury nominal and inflation protected
securities. The graph documents that prior to the crisis the expected inflation rate typically fluctuated
between 1.3% and 2.1%. With the onset of the pandemic, inflation expectations sank; as of April 15, 2020,
market participants expect an average annual rate below 1% over the next 5 years.
Key Figure Takeaway: Following the coronavirus outbreak, inflation expectations have
declined sharply.
Figure Data Source and Notes: U.S. Treasury, retrieved from FRED (IDs: PCEPILFE, T5YIE, T10YIE). Breakeven inflation rates are
computed from Treasury Inflation-Protected Securities (TIPS) and Nominal Treasury Securities.
The dramatic decline in economic
activity after the coronavirus outbreak,
including a shift away from more
risky assets, the Fed’s large monetary
stimulus, and diminished inflation
expectations collectively presage
exceptionally low U.S. Treasury interest
rates. Figure 2.8 plots the current yield
curve for U.S. Treasury securities (blue
line) versus its average over the past 10
years (red line) by maturity horizon.
Not only are rates historically low at Figure Notes: The blue line is the current Treasury Yield Curve; the red line
represents the past 10-year average, computed by taking the mean by each
the short end of the yield curve (e.g., for maturity date. For more on Term Premia, see newyorkfed.org/research/data_
indicators/term_premia.html.
short-term securities), but they are also
low for longer maturities. Long-term Figure Data Source: U.S. Treasury, retrieved from FRED (IDs: DGS1MO, DGS3MO,
yields comprise the current short-term rate DGS6MO, DGS1, DGS2, DGS3, DGS5, DGS7, DGS10).
plus the sum of market participants’ expectations of future interest rate changes, as well as a term premium
(the additional interest that investors demand in exchange for being locked into a longer-term bond
rather than just continuously investing in short-term bonds). The relatively flat current yield curve
suggests that the term premium and investors’ expectations of future interest rate increases are low.
DERA ECONOMIC AND RISK OUTLOOK | 9Although Treasury yields are near historic lows, interest rates on other assets have not all experienced comparable declines. The likely reason is that credit risk has risen because of diminished economic activity following the slowdown. Figure 2.9 documents that yields on Baa-rated corporate bonds increased beginning in late March, likely because of elevated default probabilities. Likewise, Figure 2.10 plots the average 30-year U.S. mortgage rate and its spread relative to the 10-year Treasury. The 30-year mortgage rate has hovered around 3.5% since mid-February, even as Treasury rates have fallen markedly. Thus, the spread between the average 30-year mortgage rate and the 10-year Treasury yield jumped more than one-half of a percentage point between February 15 and April 1. The increase in the spread between the mortgage rate and the Treasury yield is due in part to a glut of mortgage refinance demand immediately after rates declined, greater uncertainty about the employment prospects for many mortgagees, and perhaps MBS market illiquidity. Indeed, a lack of financial market liquidity also likely contributed to higher borrowing costs, at least initially following the pandemic outbreak, across a number of debt instruments, including MBS. Broadly, as households, firms, and investors feared a coronavirus-induced sharp deterioration in income, these entities sought to raise cash and increase their cash balances. Higher demand for dollars from foreign entities manifested as an appreciation of the dollar, as the dollar gained 8% between February 10 and March 23, relative to a trade-weighted basket of foreign currencies (Figure 2.11). Thus, the extensive crisis-era actions described above followed significant concerns regarding liquidity and functioning of the markets. The most recent data in Figures 2.9 to 2.11 suggest that the combination of Fed actions, along with a decline in overall market volatility, have somewhat eased stress in credit markets. Financial Market Signals Key Takeaway: In mid-March 2020, at the peak of coronavirus financial market distress, the VIX equity market volatility and uncertainty index reached levels last seen during the Great Recession of 2008-09. The VIX has retreated somewhat since then, but remains at elevated levels. Similarly, the corporate default spread (Baa - Aaa yields), a broad credit market risk proxy, rose notably with no signs of abatement through early April. Higher interest rates for lower rated bonds reflect higher expected default probabilities from the perspective of bond market investors, but also perhaps reflect market illiquidity. Indeed, credit ratings downgrades increased substantially in March 2020. Last, during the early stages of the pandemic, many public companies highlighted coronavirus risks in their disclosures on SEC Forms 8-K and 6-K. 10 | U.S. SECURITIES AND EXCHANGE COMMISSION
The impact of the coronavirus
pandemic on financial
markets is apparent in the
path of the VIX volatility
index. During the height of
coronavirus-induced financial
market stress in mid-March,
the VIX reached values
around 80, corresponding                Key Figure Takeaway: The VIX Index reached levels last
to historical highs last seen           seen during the Great Recession, suggesting high levels of
during the Great Recession              uncertainty over expected economic output and firm profits,
(Figure 2.12A). These peak              but recently it has retreated somewhat.
VIX realizations signaled
                                        Figure Data Source: Chicago Board Options Exchange, retrieved from
extreme investor uncertainty            FRED (ID: VIXCLS).
about firms’ future profits and
economic output because of the economic slowdown. Recently, uncertainty proxied by the VIX
index has retreated somewhat (Figure 2.12B), owing to fiscal and monetary stimulus, as well as
hopes that the total duration of the coronavirus pandemic might not be too long.

Figure 2.13 plots the
corporate default spread,
Baa - Aaa corporate bond
yields, an aggregate proxy of
credit risk in the corporate
bond market. After the onset
of the coronavirus crisis,
corporate default spreads
rose sharply in March,                  Key Figure Takeaway: The corporate default spread (Baa -
meaning that yields on lower            Aaa corporate bond yields) has increased recently, but it has
rated corporate debt increased          not reached levels last seen during the Great Recession.
relative to those on higher rated
                                        Figure Data Source: Moody’s, retrieved from WRDS.
bonds. This widening credit spread
is due largely to increased default probabilities on lower rated corporate debt. Specifically, as
economic activity falters with the coronavirus slowdown, investors may fear that various income
streams might decline and firms might find it difficult to refinance their other debt obligations.
These factors make debt service difficult and costly, boosting the likelihood that a borrower may
miss a payment and subsequently default.

Figure 2.13A also shows that while the recent rise in the corporate default spread is notable,
current values remain well below those seen during the Great Recession and perhaps suggest
credit markets are less strained than in 2008-09.

                                                  DERA ECONOMIC AND RISK OUTLOOK | 11
Next, Figure 2.13B plots the recent path of the corporate default spread. Unlike the VIX index
(Figure 2.12B), the corporate default spread has not fallen as of mid-April, suggesting that
financial stress persists in corporate credit markets in that investors expect lower rated corporate
borrowers to struggle to service and repay debt in the upcoming months, relative to higher rated
borrowers, as the economic fallout from the coronavirus slowdown unfolds.
Credit Ratings Outlook
The already realized and potential economic impact of the coronavirus pandemic has
dramatically changed the credit outlook of U.S. borrowers. The economic downturn has affected
not only short-term market indicators, but also credit ratings that reflect long-term views on
the credit quality of fixed income instruments (rating through the cycle). Credit rating agencies,
which are important intermediaries in providing information in securities markets, started to
change their views in March 2020, in response to rapidly changing economic conditions.
As recently as February 2020,
rating agencies anticipated
a modest slowdown with
a low recession likelihood.
However, the events of
March 2020 have changed
their views. As shown in
Figure 2.14A, rating agencies
lowered U.S. corporate debt
issuers’ ratings at a faster pace
than in previous episodes of Figure Notes: Net rating changes of S&P credit ratings, i.e., number of upgrades minus
global or localized economic number of downgrades, weekly. Figure 2.14A: Long-term (LT) ratings of corporate issuers.
Figure 2.14B: Structured finance deals with at least one tranche rating action. Data source:
crises. For example, in each Refinitiv DataScope.
of the last 2 weeks in March
2020, S&P downgraded more corporate issuers than in any week during the Great Recession
of 2008-09 or during the drop in commodity prices that affected a large number of oil and
mining companies in late 2015 through early 2016. Moreover, rating agencies are responding
more rapidly and aggressively than during the Great Recession, when the bulk of issuers’ rating
downgrades took place in early 2009, several weeks after the worst point of the crisis in the fall
of 2008. During the coronavirus pandemic, the rating agencies are reacting much more quickly.
12 | U.S. SECURITIES AND EXCHANGE COMMISSIONRating activity is relatively tempered in the structured finance (SF) space, even though the
coronavirus pandemic also affects many SF ratings. Structured products’ cash flows emanate
from the borrowers in the underlying loans paying on their obligations, and the borrowers are
sensitive to economic conditions. So far, there is little action in the SF credit ratings space, even in
potentially the most affected commercial mortgage-backed securities (CMBS) and CLO segments.
To compare SF rating downgrade activity during the Great Recession to that activity now,
see Figure 2.14B.
In the corporate space, the March 2020 rating downgrade activity is tilted to non-investment
grade debt issuers and to industries that the ratings agencies believe are most affected by the
pandemic. Non-investment grade issuers generally are more levered and have weaker financial
positions than investment grade issuers, and, thus, are more affected by negative economic
shocks. Issuers that have been subject to the most rating downgrades are in industries directly
exposed to the pandemic, namely, recreation, tourism, and travel (Table 2.1); commodities
because of historic drops in oil prices; and discretionary retail spending.
Table 2.1: Industries with Largest No. of Issuers with at Least One Bond Downgrade
SIC 2 Standard Industrial Classification (SIC) 2 Description Down Total %
67 Holding and Other Investment Offices 76 708 11%
13 Oil and Gas Extraction 43 108 40%
79 Amusement and Recreation Services 16 23 70%
28 Chemicals and Allied Products 11 103 11%
49 Electric, Gas, and Sanitary Services 10 287 3%
70 Hotels and Other Lodging Places 10 22 45%
45 Transportation by Air 9 14 64%
58 Eating and Drinking Places 8 19 42%
61 Non-Depository Credit Institutions 8 53 15%
48 Automotive Dealers and Gasoline Service Stations 8 105 8%
37 Transportation Equipment 7 44 16%
56 Apparel and Accessory Stores 6 8 75%
53 General Merchandise Stores 5 17 29%
Table Notes: Industries (by primary SIC2 code) with the largest number of issuers that have at least one bond downgraded by one of the
three largest Nationally Recognized Statistical Ratings Organizations (NRSROs) in March 2020. Data source: Refinitiv DataScope.
DERA ECONOMIC AND RISK OUTLOOK | 13Ratings are often reactive to information about the issuers’ changing financial fortunes and
ratings often follow (not lead) securities markets in reflecting that information. However, changes
in ratings, especially downgrades, have some incremental effect on corporate credit spreads
(e.g., see BIS, 2006, or ECB, 2004, for a review of evidence). Thus, the current economic
downturn and widespread downgrades affect issuers’ cost of capital not only through increased
prices of credit risk for individual rating categories (see Figure 2.13) but also through a mass
transition of issuers to lower credit rating groups.
Investment mandates or capital requirements that stipulate minimum credit ratings for
investments represent another channel through which credit ratings might influence issuers’ cost
of capital. Such requirements may be soft (elevated capital charge for lower rated investments)
or hard (requirement to avoid investing in lower rated categories and to disinvest a downgraded
security). Thus, rating downgrades might trigger “fire sales” of affected bonds. (See, e.g., Ellul et
al., Journal of Financial Economics, 2011.) From this perspective, downgrades of issuers and
securities from an investment grade category (BBB- or Baa3 and above) to a non-investment
grade or high-yield category (BB+ or Ba1 and below), so called “fallen angels,” could be
especially concerning now. In the last week of March, the three largest NRSROs issued such
downgrades to a larger number of bonds than in any week since 2014.
The Fed actions to expand the scope
of the Primary and Secondary
Market Corporate Credit Facilities
(PMCCF and SMCCF) to fallen
angels that were rated investment
grade before March 23, 2020, will
partially alleviate the negative effects
from the rapidly increasing number
of fallen angels. The purchases via
PMCCF and SMCCF are designed
to soften the impact of the cost of Figure Notes: The number of corporate issuers that have at least one bond
downgraded by one of the three largest NRSROs. NRSROs from investment
capital channel directly and to reduce grade to non-investment grade (fallen angels), weekly. Data source:
the price impact of fire sales potentially Refinitiv DataScope.
triggered by the regulatory requirements.
14 | U.S. SECURITIES AND EXCHANGE COMMISSIONCoronavirus Impact in
SEC Disclosures
Using a textual analysis of
public companies’ 8-K and
6-K disclosures, Figure 2.16
plots the number of sentences
per filer in a given industry
relating to the business
impact of the coronavirus
(i.e., the “frequency” of
business impact discussion).
Specifically, the algorithm
extracts all paragraphs in
8-K and 6-K filings that
mention “coronavirus” or its
variants and categorizes each
sentence in these paragraphs
into one of three categories as identified through cluster analysis: “business impact” discussion,
“forward-looking statements,” and discussion of the Securities Act and regulations. Overall, the
results are telling: while discussion of the coronavirus-induced business impact initially originated
in apparel and leather-goods firms (whose supply chains were disrupted early in the outbreak),
by mid-March the effect of the pandemic was discussed more often among the lodging and air
transportation firms.
Data Sources not previously mentioned: Figure 2.2: BEA, retrieved from FRED (ID: GDPC1), and “Marketwatch Economic
Calendar” available at https://www.marketwatch.com/tools/calendars/economic. Figure 2.5: Fed Board, retrieved from FRED
(ID: DFF), and Datastream. Figure 2.10: Freddie Mac, retrieved from FRED (ID: MORTGAGE30US); and Moody’s, retrieved
from WRDS.
DERA ECONOMIC AND RISK OUTLOOK | 15Market Segments
The U.S. Securities and Exchange Commission’s mission is to protect investors, maintain
fair, orderly, and efficient markets, and facilitate capital formation. Below we examine the
underpinnings of economic growth through the lens of these three mission areas and study
(1) markets; (2) investors; and (3) borrowers, securities issuers, and other entities that raise
capital. The chart below illustrates the interlinkages between these three segments.
Markets
Key Takeaway: Because of the coronavirus pandemic, key equity indices plunged
between 30-40% from January to mid-March 2020, before recovering somewhat
by early April. Investor expectations of weak corporate earnings following the
coronavirus-induced economic slowdown likely led to this fall in equity prices. In fixed
income markets, AAA-rated corporate securities have outperformed other lower rated
bonds, where the yields on AAA-rated securities are near their pre-pandemic levels.
Yields on non-investment grade debt have climbed substantially, likely reflecting
investor concerns over increased default probabilities.
Asset Values
After a historically long bull market, equity market prices fell
sharply in the immediate wake of the coronavirus-induced
economic slowdown. Figure 3.1 plots equity returns from Janu-
ary 2020 for the S&P500 and the Russell 2000, an equity index
composed of smaller companies. Both the S&P500 and the Russell
2000 fell in late February as investors increasingly anticipated a
decline in economic activity that would ultimately depress corpo-
rate profits. Thus, valuations fell relative to historical earnings,
but they remain higher than they were at the depths of the Great
Recession (Figure 3.2). By mid-March, the S&P500 fell approxi-
mately 30%. In comparison, the Russell 2000 declined nearly
40%, coinciding with the coronavirus’ likely outsized impact on
the often more volatile income and revenue streams of smaller
companies. By early April, equity indices had partially recovered.
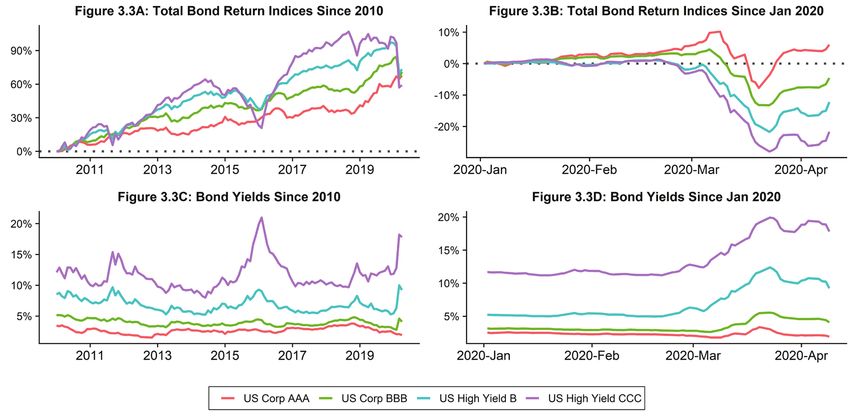
DERA ECONOMIC AND RISK OUTLOOK | 17For fixed income markets, Figure 3.3 displays total bond market returns and yields by credit rating. First, Figure 3.3A shows that bonds across asset classes have appreciated since 2010, where the lower rated B and CCC (or lower) bonds nearly doubled in value before the coronavirus outbreak. However, lower rated bond prices are more volatile, as seen by the large drops in late 2011, 2016, 2018, and, most recently, in 2020. Because of an expected decline in economic activity due to the coronavirus, total returns on the lower rated B and CCC bonds fell between 15% and 25% by mid- March (Figure 3.3B). The low 2020 returns for these securities coincide with a spike in yields (Figures 3.3C and 3.3D) that did not abate by early April 2020. The rise in yields implies investors likely expect a greater incidence of defaults for lower rated debt following the coronavirus, but diminished liquidity may have also impacted interest rates. In contrast, AAA-rated bonds have outperformed and, by April, their yields had returned to their pre-coronavirus levels. Last, while BBB-rated corporate bonds experienced a drop in total returns and an uptick in yields, the changes are relatively smaller than for lower rated debt. Money Market, Mutual Fund, and ETF Investors Key Takeaway: With coronavirus-induced financial market volatility, investors increasingly moved assets away from bond and equity market mutual funds and ETFs and into money market funds backed by U.S. government agency or Treasury securities beginning in March 2020. Yet despite the extreme stress in financial markets and substantial fund redemptions, through April 17 (i) no mutual fund or ETF has suspended redemptions, and (ii) no money market fund has imposed liquidity fees or suspended redemptions. 18 | U.S. SECURITIES AND EXCHANGE COMMISSION
Figure 3.4 presents net fund
flows into select classes of
mutual funds and ETFs
from January to April
2020. Prior to the corona-
virus pandemic, there were
substantial fund inflows
into taxable and municipal
bond funds, outflows from
domestic equity funds, and
slight inflows into commod-
ity funds. Yet as the coro-
navirus pandemic unfolded
and the corresponding
economic slowdown
became imminent, investors           Key Figure Takeaway: Both equity and bond funds experienced
withdrew funds from taxable          outflows following coronavirus-induced financial market stress.
and municipal bonds as well
                                      Figure Data Source: Investment Company Institute (ICI), retrieved from Datastream.
as domestic equities.
                                      Other Notes: ETFs sell creation units to and redeem creation units from authorized
                                      participants, who may transact on their own behalf or act as agent for others, while
Net withdrawals from equity           individual ETF shares trade on the secondary market.

funds following the coronavi-
rus pandemic extended a longer-term trend. Recent outflows likely reflect a diminished outlook
for corporate profits because of the coronavirus-induced economic slowdown.

Taxable bond funds experienced sizable inflows until late February 2020. Then, investors with-
drew approximately $300 billion from taxable bond funds, as default probabilities increased for
lower rated bonds and as investors may have sought to increase their cash positions. A similar
trend occurred in municipal bond funds, although the reversal in cumulative fund flows for this
asset class did not begin in earnest until mid-March. Investors’ preference to move assets away
from this market may result in their selling bonds held directly. Outflows may also indirectly
prompt funds to sell assets in response to redemption requests.

                                                   DERA ECONOMIC AND RISK OUTLOOK | 19
In addition to withdraw-
ing funds from equity and
bond mutual funds and
ETFs, investors have also
reduced their exposure
to prime money market
funds (MMFs) beginning
in March 2020, as seen in
Figure 3.5. Prime MMFs,
which can impose gates
or liquidity fees, invest in
assets, such as commercial
paper, that are not neces-
sarily backed by the U.S.
Government; thus investors
may have elected to allocate Key Figure Takeaway: Investors have increasingly allocated
capital towards other capital into government agency and Treasury money
investments, increase their market funds but have withdrawn money from prime money
cash balances, or reduce market funds.
their exposure to more
Figure Data Source: Crane Data
risky assets as the corona-
virus slowdown ensued. In Other Notes: Government Money Market Funds invest in securities such as agency
debt. Prime money market funds invest in securities not necessarily backed by the U.S.
contrast, investors increas- government, such as commercial paper issued by corporations.
ingly allocated capital into
MMFs that invest in government securities. This shift was mostly driven by institutional investors
who moved $650 billion into institutional government and Treasury MMFs, while withdrawing
$110 billion from prime institutional money market funds (source: Crane Data).
The structure of mutual funds, ETFs, and MMFs is such that sponsors offer investment products
and manage investors’ funds on their behalf. A sponsor itself is a separate legal entity that
provides advisory or other services to an MMF (or a mutual fund or an ETF) according to a
contract. In the case of an MMF, investors expect their capital plus an investment return. MMFs
typically hold very safe and liquid assets (e.g., Treasury securities) and therefore they rarely lose
their capital. In rare instances when an MMF loses its capital, its net asset value (NAV) might
fall below a dollar. In these circumstances, the sponsor might extend “support” to the MMF for
various reasons, including to protect its reputation and brand and to prevent declines in its funds’
market-based NAVs. The sponsor might support an MMF, for example, by injecting capital to
restore the fund’s $1.0000 shadow price, by purchasing illiquid or distressed securities to prevent
20 | U.S. SECURITIES AND EXCHANGE COMMISSIONa fund from dropping below a certain SEC-mandated threshold, and by waiving advisory fees to
prevent a negative yield. In March 2020, two banks affiliated with the funds purchased securities
of three institutional prime funds, while another adviser provided capital support for one of its
tax-exempt funds. In each case, the sponsor purchased securities from the fund. This provided a
cash infusion to funds that were experiencing large redemptions as the stock market plunged and
institutional investors decreased investments in prime MMFs and allocated more capital to safer
government MMFs.
Overall, the coronavirus-induced economic slowdown has created extreme financial market
volatility and distress. At the same time, investors have withdrawn capital from a variety of
funds that invest in different asset classes, perhaps adding further stress on financial markets.
Yet despite these challenging market conditions, through April 17, 2020 (i) no mutual fund or
ETF has suspended redemptions, and (ii) no money market fund has suspended redemptions or
imposed liquidity fees.
Borrowers, Securities Issuers, and Capital Formation
Key Takeaway: Following the coronavirus-induced financial market distress in March
2020, firms raised substantially less capital in public equity markets. At the end of
2019, the building materials and retail sectors had relatively little available cash to
absorb the coronavirus shock.
U.S. Equity Offerings
As the coronavirus pandemic drove down stock prices, firms
raised substantially less capital via equity markets. Figure 3.6
graphs seasoned equity offerings (SEOs, billions of dollars at an
annualized rate). The annual rate raised via SEOs was between
about $100-120 billion in 2019 and the first 2 months of 2020.
Then in March 2020, once coronavirus-induced volatility struck
financial markets, firms raised only an annual rate of $41 billion
via seasoned offerings, as the coronavirus increased risk and
uncertainty in financial markets and dimmed the financial out-
look (and need for capital) for companies.
Similarly, Figure 3.7 plots the annualized dollar volume that
firms raised via initial public offerings (IPOs). While IPO
volumes have been more volatile than SEOs, Figure 3.7 shows
that IPO volume dropped to its lowest level since 2019 with an
annualized rate of just $20 billion.
DERA ECONOMIC AND RISK OUTLOOK | 21Days of Cash on
Hand (Cash Burn) by
Industry
A firm’s need and ability
to raise capital depends
not only on current market
conditions, but also on the
firm’s financial position.
Generally, when a firm has
more available resources, it
is in a better position to
weather an economic shock
or raise capital via debt
markets because of its lower
credit risk. A broad proxy
for available resources dur-
ing a crisis is cash on hand. Cash Burn Definition: 365 * (Cash and short-term investment +
Indeed, firms with larger receivables)/(operating expenses – non-cash items)
relative cash positions
Figure Data Source: WRDS and Compustat.
are more likely to sustain
operations during an economic slowdown, while investors view such firms more favorably, all
else equal. Figure 3.8 plots the median days of cash on hand (cash burn) by industry at the end of
2019. Intuitively, available cash burn signifies how many days a company could operate, without
cutting expenses or laying off workers, with available cash on hand. Hence, available cash burn
broadly measures a firm’s ability to withstand a large economic shock, but also is one dimension
through which investors measure credit risk.
At the end of 2019, the median cash burn across all firms was 138 days, indicating that the
median firm could operate for 138 days without reducing expenses. Figure 3.8 also shows the top
and bottom five industries (SIC2) ranked by available cash burn. The firms with the least available
cash relative to expenses are concentrated in the building materials, retail, and food service indus-
tries, whose cash positions typically would not have covered more than one month’s expenses
using year-end 2019 data. Unfortunately, not only were the building materials, retail, and food
service firms in relatively weaker cash positions, but these firms were also the most directly hit
by the coronavirus-induced social distancing policies. Not surprisingly, those sectors have also
accounted for substantial job losses and increases in unemployment.
Figure Data Sources not previously mentioned: Figure 3.3: Ice Data Indices, LLC, retrieved from FRED (IDs:
BAMLCC0A1AAATRIV, BAMLCC0A3ATRIV, BAMLCC0A4BBBTRIV, BAMLHYH0A1BBTRIV, BAMLHYH0A2BTRIV,
BAMLHYH0A3CMTRIV, BAMLC0A1CAAAEY, BAMLC0A3CAEY, BAMLC0A4CBBBEY, BAMLH0A1HYBBEY, BAMLH0A2HYBEY,
BAMLH0A3HYCEY). Figure 3.6: Thomson Reuters SDC Platinum. Figure 3.7: Thomson Reuters SDC Platinum.
22 | U.S. SECURITIES AND EXCHANGE COMMISSIONU. S . S E C U R I T I E S A N D E XC H A N G E CO M M I SS I O N
You can also read


