Equipment-as-a-Service Market Study 2021
←
→
Page content transcription
If your browser does not render page correctly, please read the page content below
Equipment-as-a-Service
              Market Study 2021
        Prerequisites, barriers and success factors for EaaS –
an international and industry-wide study in the capital goods segment.

     © Prof. Dr.-Ing. Matthias Schlipf
     & Prof. h.c. Dr. Uwe Seebacher (MBA)
                                                        MUNICH UNIVERSITY
     February 2021                          UNIVERSITY OF APPLIED SCIENCES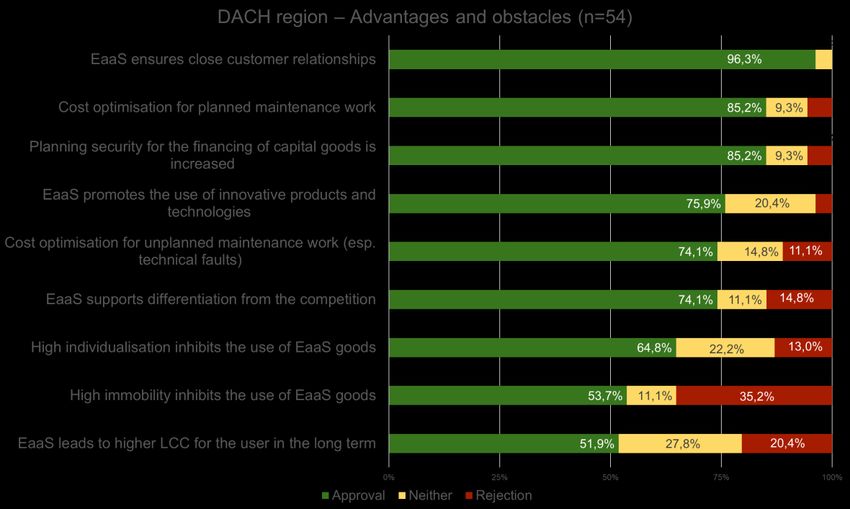
Table of contents

Executive Summary .......................................................................................................................1
Future model Equipment-as-a-Service ..........................................................................................3
1     Research hypotheses and methodology ................................................................................4
  1.1     Hypotheses ....................................................................................................................4
  1.2     Study Design ..................................................................................................................5
  1.3     Sample description .........................................................................................................5
2     Data analysis ....................................................................................................................... 10
  2.1     Terminology and application ....................................................................................... 10
  2.2     Advantages and obstacles with EaaS ......................................................................... 17
  2.3     Influence of age on the attractiveness of EaaS .......................................................... 30
  2.4     Digitization ................................................................................................................... 31
  2.5     Sustainability ............................................................................................................... 37
  2.6     Market and company situation .................................................................................... 40
3     Conclusion ........................................................................................................................... 52
4     Credits ................................................................................................................................. 55
Bibliography ................................................................................................................................. 56

Authors

Prof. Dr.-Ing. Matthias Schlipf                                                Prof. h.c. Dr. Uwe Seebacher (MBA)

Professor for B2B Marketing,                                                   Professor for Methods and Structural
Sales & Technology Management at the                                           Sciences, Author, Marketing and
Faculty of Business Administration,                                            Management Professional,
Munich University of Applied Sciences.                                         Executive Advisor

Contact: matthias.schlipf@hm.edu                                               Contact: info@uweseebacher.org

Contributors from the Master Course Marketing Management M.Sc. 2020/2021

Eden Abraha, Ralf Ettenhuber, Marlon Fricker, Ines Gabler, Vanessa Irion, Jonas Keller, Jenifer
Lecker, Marlene Metschkoll, Moritz Nagel, Julia Rau, Leah Ruppel, Roman Semler.

                    Munich University of Applied Sences (HM), Lothstr. 34, D-80335 Munich, Germany

                                                                                                                                               II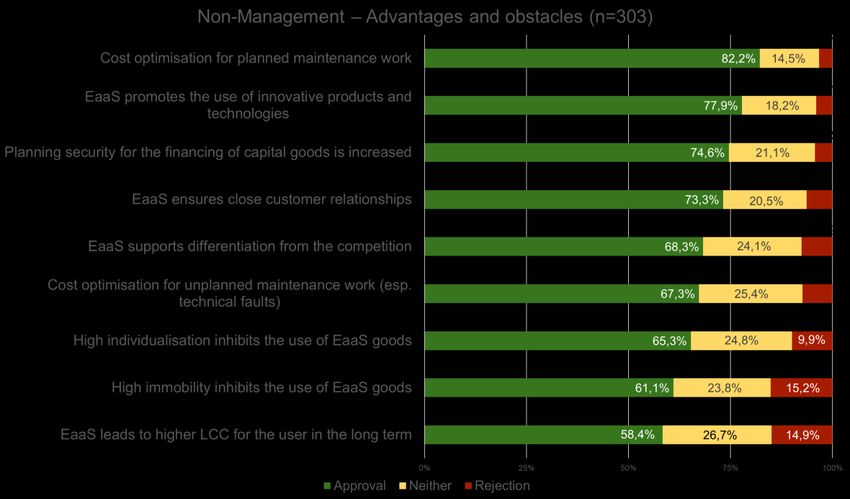
Equipment-as-a-Service Market Study 2021 Directories
List of Figures
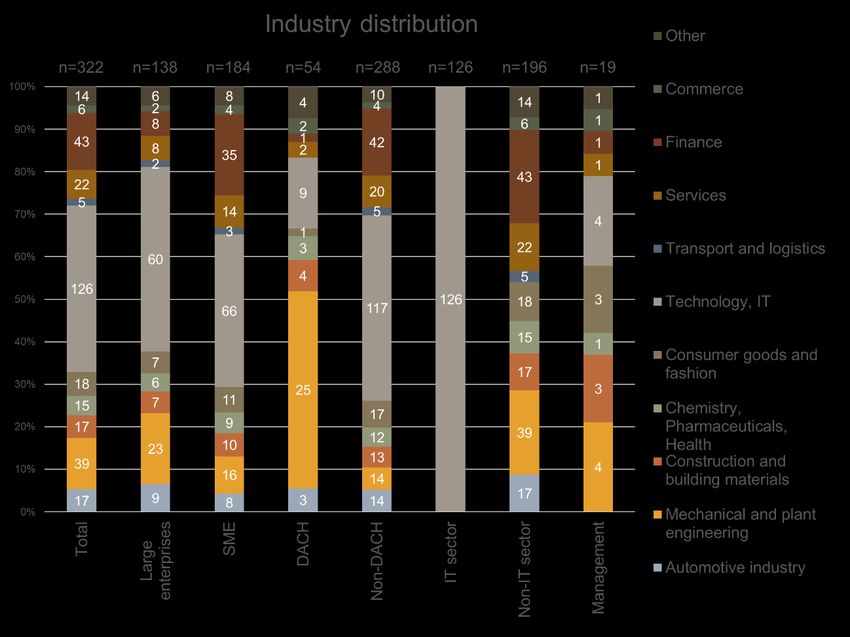
Figure 1: Industry distribution of participants ................................................................................ 6
Figure 2: Country distribution of participants ................................................................................ 7
Figure 3: Number of employees .................................................................................................... 8
Figure 4: Turnover ......................................................................................................................... 9
Figure 5: Understanding about EaaS in companies ................................................................... 10
Figure 6: Understanding about EaaS in industries ..................................................................... 11
Figure 78: Possible confusion of terms EaaS etc. ...................................................................... 12
Figure 9: EaaS user or provider .................................................................................................. 12
Figure 10: Formats of EaaS usage ............................................................................................. 13
Figure 11: Formats of the EaaS offering ..................................................................................... 14
Figure 12: Medium-term use or offer of EaaS ............................................................................. 14
Figure 1314: Total data set Advantages and obstacles .............................................................. 18
Figure 15: DACH region advantages and obstacles ................................................................... 20
Figure 16: Non-DACH region advantages and obstacles ........................................................... 21
Figure 17: IT industry advantages and obstacles ....................................................................... 24
Figure 18: Data set without IT industry advantages and obstacles ............................................ 25
Figure 19: Comparison of large companies and SMEs Advantages and obstacles ................... 26
Figure 20: Comparison of management with the rest Advantages and obstacles ..................... 29
Figure 21: Importance of digitization for EaaS ............................................................................ 32
Figure 22: Boxplot "DACH" / "without DACH" regarding attitude toward digitization .................. 35
Figure 23: Boxplot "DACH" / "without DACH" regarding degree of digitization of companies .... 36
Figure 24: Boxplot "Users/providers" regarding the degree of digitization of companies ........... 37
Figure 25: Sustainability as a result of EaaS .............................................................................. 39
Figure 26: Boxplot of respondents' attitudes toward sustainability as a result of EaaS.............. 40
Figure 27: Digitization in relation to the implementation and offering of EaaS ........................... 41
Figure 28: Replacing fixed purchase with EaaS ......................................................................... 42
Figure 29: Inhibiting factors for EaaS .......................................................................................... 43
Figure 30: Success factors for EaaS ........................................................................................... 47
Figure 31: Added value of EaaS ................................................................................................. 49
List of tables
Table 1: T-test comparison DACH and without-DACH for EaaS benefits. ................................. 23
Table 2: T-test comparison of SMEs and large enterprises for EaaS benefits. .......................... 27
Table 3: T-test comparison of SMEs and large companies for EaaS inhibition factors .............. 28
List of abbreviations
AI Artificial Intelligence
DACH Germany (D), Austria (A), Switzerland (CH)
EaaS Equipment-as-a-Service
IoT Internet of Things
SME Small and Medium Enterprises
PaaS Product-as-a-Service
SaaS Software-as-a-Service
III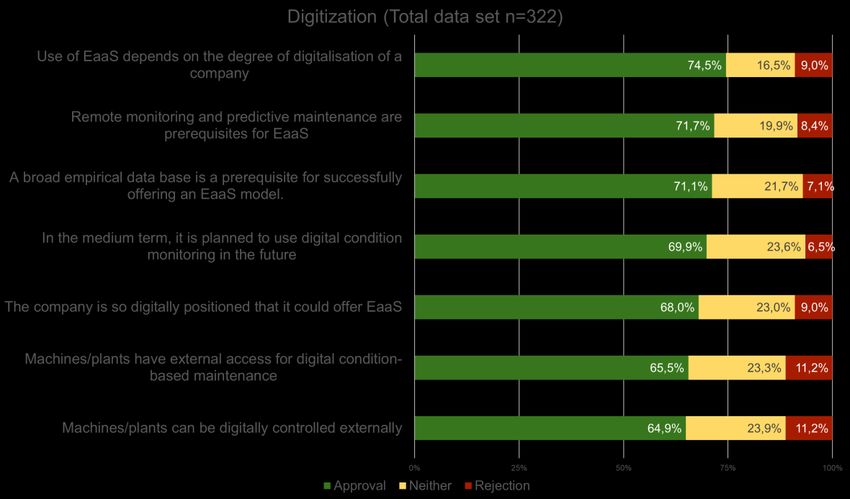
Equipment-as-a-Service Market Study 2021                                  Executive Summary

Executive Summary

This empirical study on the prerequisites, barriers, and success factors of equipment-as-
a-service (EaaS) business models is based on numerous qualitative expert interviews,
primarily from the mechanical and plant engineering sector, and the response to an
online survey of 322 participants from various international companies in the capital
goods segment. In the evaluation and analysis of the results, a distinction was made
according to the factors SME (57.1%) vs. large companies (42.9%), DACH region
(16.8%) vs. non-DACH region (83.2%), management subgroup (5.9%), industries (e.g.,
IT and mechanical/plant engineering) and age of the participants, among others. The
participants in the DACH region are largely from the mechanical and plant engineering
sector (46.3%), whereas the participants in the non-DACH region (primarily the USA) are
largely from the IT sector (43.7%).

80.1% of the participants estimate that the use and offering of EaaS models will
increase in their companies in the next 2-3 years. The core benefits (> 75% agreement)
of EaaS business models are cost optimization of maintenance, promotion of
innovative products and technologies (e.g. IoT, remote services), and planning
security in the financing of capital goods. Closer customer ties through EaaS are
the greatest advantage among participants in the DACH region (96.3% agreement) and
the management subgroup (agreement of 94.7%). In contrast, there are no significant
differences between large enterprises and SMEs in knowledge or understanding of EaaS
or its benefits and barriers. Furthermore, there are no significant differences regarding
the age of the participants and their assessments of the success of EaaS business
models.

84.5% of participants believe that digitization will further accelerate the application and
success of EaaS business models. The management subgroup agrees with this
statement almost unreservedly at 94.7%. However, the survey results show that among
participants from the DACH region, digitization with the possibilities for remote monitoring
& service as well as predictive maintenance (Seebacher 2021) is seen less strongly as
a driver of EaaS business models than in the non-DACH region. It is also evident that
participants from companies that already offer EaaS models rate the current level of
digitization in their company as "better" than participants from companies that do not yet
use EaaS models.

                                                                                          1
Equipment-as-a-Service Market Study 2021                              Executive Summary

Over 70% of participants believe that EaaS promotes environmental sustainability
through the efficient use of maintenance and service (73%) and the longer life cycle of
machines and equipment (71.1%). EaaS business models are thus also crucial in order
to realize measures such as the EU Green Deal.

Resulting from the various advantages, 75% of the participants from the non-DACH
region predict that EaaS will replace the model of fixed purchase of a capital good to
a large extent. In the DACH region, on the other hand, only 46.3% of participants agree
with this statement.

The core success factors for EaaS business models cited by participants are more
information, references, and education (1), more industry-specific providers and
offerings (2), and more know-how and technologies around predictive maintenance and
remote services (3). Within the DACH region, the desire for exit options from EaaS
contracts in case of dissatisfaction is the most important success factor with 88.9%
agreement. Core barriers to EaaS business models cited by participants include
concern about data security (1), lack of knowledge about EaaS application and
implementation (2), and lack of EaaS offerings and vendors (3). In contrast, possible
system or product-related requirements or barriers such as high complexity and
immobility of products and systems are less highly prioritized.

Accordingly, there is a great desire and thus great potential for more offerings and
providers of EaaS services. In summary, the present results show that EaaS is a
promising and important business model across companies and industries - especially
regarding digitization and environmental sustainability - and that its importance will
continue to grow.

                                                                                     2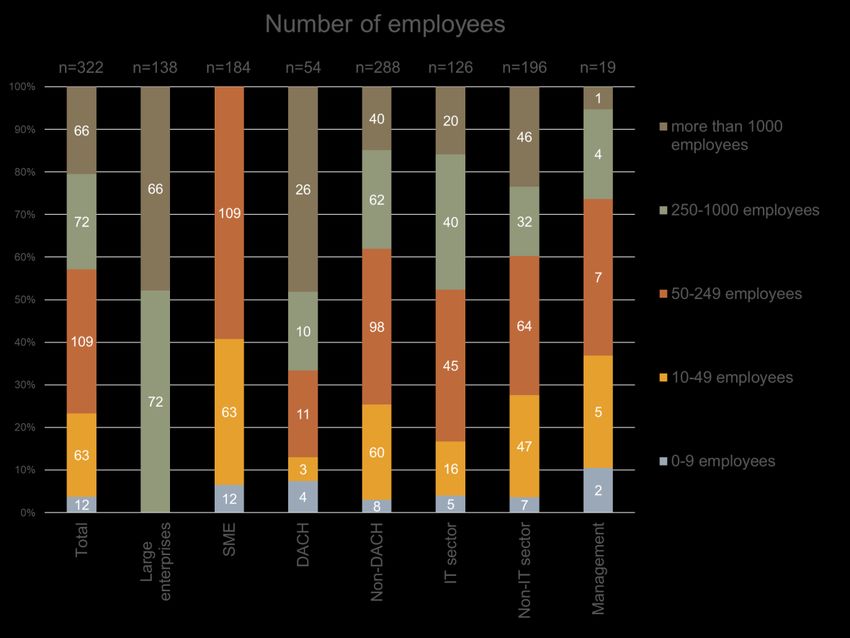
Equipment-as-a-Service Market Report 2021                Future model Equipment-as-a-Service

Future model Equipment-as-a-Service

Renting, leasing, pay-per-use - an economy of use instead of ownership is increasingly
unfolding (Bundesnetzagentur 2017). The music and film industries are successfully
demonstrating this: Here, people subscribe instead of buy - see Spotify and Netflix
(Arnold & Schneider 2019). Software companies such as Adobe, which made the switch
from perpetual licenses to subscriptions, also experienced a sharp increase in their
market value (Westdeutsche Zeitung 2012). These examples show that consumers do
not necessarily want to own, but that the results achieved with them are important. This
is also true in B2B (Schlipf et al. 2019; Leismann et al. 2012) - due to the rational
purchase decision process, the focus should not be on owning, but on the effective and
efficient use of the investment good. The equipment-as-a-service (EaaS) business
model has the characteristics mentioned and is expected to offer new opportunities for
both manufacturers and customers (Wopata 2020).

In contrast to a classic sale, in the EaaS model the manufacturing company provides the
user with a machine for a fee, for example. The manufacturer is responsible for
maintenance, service, consumables, and spare parts. In addition, the availability and
output of the machine can be guaranteed. The user saves the high one-off capital
expenditure and passes on some of the operational risk to the manufacturing company
(Wopata 2020). Both the output and the usage fee can be defined individually, for
example with monthly billing or according to the pay-per-use model, i.e., only according
to the actual number of units produced (Fraunhofer-Gesellschaft 2020).

According to the Market Report of the IOT Analytics Institute, the global EaaS market is
expected to show a growth rate of 35% by 2025. In the machinery and plant engineering
sector alone, an increase of 54% is expected by 2025 (Fraunhofer-Gesellschaft 2020).

Due to the increasing relevance of EaaS, the present study uses an international and
industry-wide empirical survey to take a closer look at the drivers and barriers of the
EaaS business model, to capture the sentiment in the capital goods market, and to
identify a possible consensus regarding prerequisites, success factors, and potentials in
its implementation.

                                                                                          3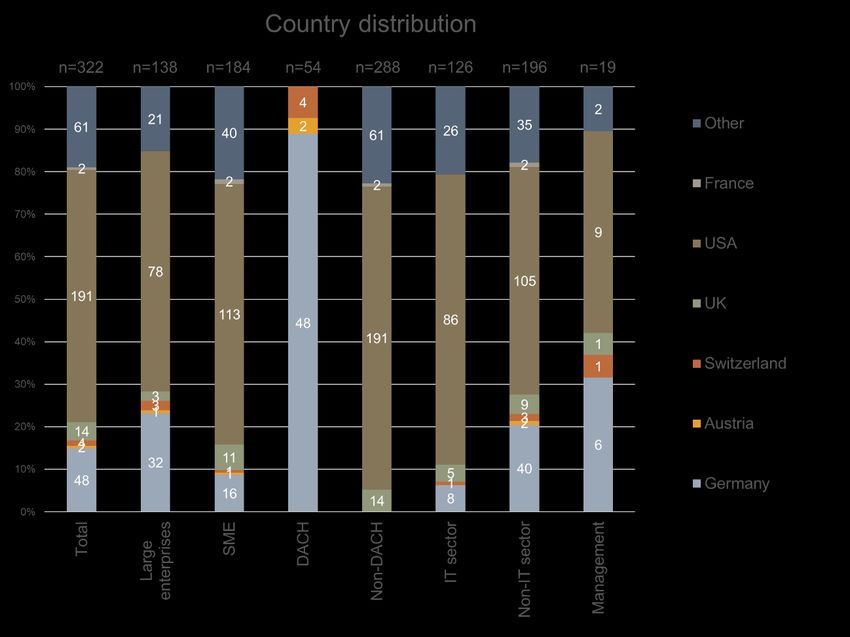
Equipment-as-a-Service Market Report 2021               Research hypotheses and methodology

1 Research hypotheses and methodology

In the run-up to the empirical study, a comprehensive literature review, benchmark
analyses and numerous expert interviews were conducted primarily with representatives
from companies in the mechanical and plant engineering sector, some of which already
offer or use the EaaS model. On this basis, both the hypotheses to be tested were
formulated and the quantitative questionnaire on which this study is based was
developed. The hypotheses, the research design and the sample of the study are
presented and explained below.

1.1     Hypotheses

Derived from the preliminary investigations, ten hypotheses were formed which are to be
used in the present study to obtain an overview of the market situation of EaaS. The
hypotheses described will be analyzed and tested in the further course of the study using
suitable methods.

H1      There is no single definition or understanding of as-a-service business models
        in the industry.

H2      As company size decreases, so does knowledge and awareness of as-a-
        service business models.

H3      Participants from countries outside the DACH region are more likely to agree
        with the benefits of EaaS than participants from the DACH region.

H4      Large enterprises are more likely to agree with the benefits of EaaS than SMEs.

H5      SMEs are more likely to agree with the inhibitors of EaaS than large
        enterprises.

H6      The older the decision-makers in the companies, the less attractive Equipment-
        as-a-Service appears.

H7      Digitization enables the holistic realization of EaaS business models.

H8      Equipment-as-a-service business models favor the environmentally sustainable
        use and service of the respective machinery and equipment.

H9      Lack of knowledge is a major barrier to a positive as-a-service purchase
        decision.

H10     A major challenge of EaaS lies in the clarification about storage and use of
        machine data and thus internal company data.

                                                                                         4
Equipment-as-a-Service Market Study 2021 Research hypotheses and methodology
1.2 Study Design
To test the hypotheses, data was collected from December 07, 2020 to January 07, 2021
using a fully standardized questionnaire. This was prepared as an online/mobile survey
via the SoSci Survey tool and could be completed electronically. The questionnaire was
divided into the following areas
• demographic and company characterizing factors,
• Conceptualization and application of EaaS,
• Benefits and barriers of EaaS deployment,
• Digitalization and Environmental Sustainability in Relation to EaaS
• as well as market, company situation and future of EaaS business models.
on. Except for the demographic and company characterization factors, the statements
were predominantly examined using a 5-point Likert scale from "strongly disagree" to
"strongly agree" (see appendix).
1.3 Sample description
A total of 322 persons or valid cases were evaluated, which were divided into seven
groups for more detailed analysis. The DACH region (n=54) and the countries outside
the DACH region (n=268) were considered separately. Likewise, the IT industry (n=126)
- due to its size - was examined separately from the other industries (n=196). In addition
to the distinction between SMEs (n=184) and large companies (n=138), the management
subgroup (n=19) was also considered separately.
47.2% of participants hold executive or management positions. The remaining 52.8%
are evenly divided between executives and clerks/officers. Accordingly, 74.5% of the
participants perform a managerial function, whose opinion is particularly important in the
topic of EaaS and its implementation.
5Equipment-as-a-Service Market Study 2021 Research hypotheses and methodology
Most of the participants in the survey work in the areas of IT (26.3%) and finance (17.1%)
in their company. These results can be observed in the IT industry groups,
excluding the DACH region, and among SMEs and large companies. In the DACH
region, the sales division is also comparatively well represented at 24.1%.
Looking at the industries, as in the corporate sector, the IT industry (39.1%) is particularly
well represented, followed by the financial sector (13.4%) and mechanical and plant
engineering (12.1%). The other industries are evenly distributed. In the DACH region,
mechanical and plant engineering takes up a high proportion of the data at 46.3% (see
Figure 1).
Figure 1: Industry distribution of participants
In the overall view, 71.7% of participants are under 39 years of age. Exclusively in the
management group and the DACH region are more than half of the participants over 39
years old, which in the case of the latter is due to the high proportion of participants in
6Equipment-as-a-Service Market Study 2021 Research hypotheses and methodology
management functions. Conversely, the IT sector and SMEs have the highest number
of young participants (34.9% and 32.1% respectively)
The country distribution of the participants can be seen in Figure 2. The most frequently
represented country is the USA (59.3%). 88.9% of the participants from the DACH region
come from Germany. Also, in the group of the management 31.6%, as well as in the
consideration without the IT industry 53.6% of the participants come from Germany.
Figure 2: Country distribution of participants
The number of employees was categorized according to the EU Commission's
classification of company size (IfM Bonn 2005). Accordingly, all companies with up to
249 employees are considered SMEs, while companies with 250 or more employees are
defined as large enterprises.
In all groups except the DACH region, more SMEs can consequently be observed than
large companies, as can be seen in Figure 3example, 73.7% of the managing
7Equipment-as-a-Service Market Study 2021 Research hypotheses and methodology
participants are from SMEs. In the DACH region, on the other hand, 66.7% are large
companies. In the overall view, the distribution between SMEs and large companies is
balanced.
Figure 3: Number of employees
The distribution of the size of the companies is also reflected in the revenue figures (see
Figure 4). In the IT sector (92.1%) and in the group outside the DACH region (94.8%),
almost all companies surveyed generated sales of less than €50 million. By contrast, in
the sample of the DACH region - in which a high number of large companies are
represented - only 27.8% of the companies generated sales of less than €50 million.
8Equipment-as-a-Service Market Study 2021 Research hypotheses and methodology
Figure 4: Turnover
In summary, it can be said that the sociodemographic data of the various groups is
basically in line with the overall sample and that there are no major discrepancies. In the
following, we will focus primarily on possible anomalies in the DACH region compared
with the rest of the sample.
9Equipment-as-a-Service Market Report 2021 Data analysis
2 Data analysis
The hypotheses derived from the qualitative interviews were examined both descriptively
and inferentially using the survey results. The results are presented below.
2.1 Terminology and application
The questions in as-a-service terminology and application deal on the one hand with
statements about the understanding of the equipment-as-a-service (EaaS) business
model and possible confusion of terms in this area, and on the other hand with the
classification of the respondents as users or providers of EaaS, their formats of use and
offerings, and their assessment of their medium-term use of EaaS.
2.1.1 Overall view of terminology and application of EaaS
Figure 5 shows whether there is a uniform understanding of the EaaS business model
in the respondents' companies. It should be noted here that most respondents (54.7%)
tend to agree with this statement. Only a small proportion of respondents (3.7%) are of
the opposite opinion and do not agree with the statement at all. It can be concluded from
this that there is a uniform understanding of EaaS within the companies.
Figure 5: Understanding about EaaS in companies
10Equipment-as-a-Service Market Study 2021 Data analysis
Figure 6 shows the extent to which there is a uniform understanding of the equipment-
as-a-service business model in the respondents' industries. Here it can be seen that
most respondents (37.9%) tend to agree with the statement and only a few (3.4%) do
not agree at all. Compared to the previous question, however, the results differ because,
among other things, agreement is not as strong here. Overall, this means that the
understanding of EaaS is more uniform within the individual companies than within the
industry.
Figure 6: Understanding about EaaS in industries
Figure 7 shows whether there is often confusion of terms EaaS etc. in conversations
inside or outside the respondents' companies. Here we can see that most respondents
(41.9%) tend to agree with this statement. Only a small number of respondents (3.1%)
disagree at all. The present results are remarkable, because although according to the
previous questions there is a uniform understanding of EaaS, the respondents are of the
opinion that individual terms around the topic EaaS are defined and used differently.
11Equipment-as-a-Service Market Study 2021 Data analysis
Figure 78: Possible confusion of terms EaaS etc.
Figure 9 shows what percentage of respondents are EaaS users or providers. The
results are very close here: 29.5% of participants are users, 28.6% providers and 28.0%
both users and providers. Only 14.0% of respondents say they are neither providers nor
users of EaaS.
Figure 9: EaaS user or provider
Figure 10 illustrates whether respondents use EaaS directly from the manufacturer or
via an external partner. Most participants (35.5%) state that they use EaaS directly from
the manufacturer. This is followed immediately using EaaS with a bank or financial
12Equipment-as-a-Service Market Study 2021 Data analysis
services provider (31.1%). Not strongly represented, on the other hand, are the selection
options via a subsidiary of the manufacturer with 20.3% and via an independent third
party with 12.0%. 1.2% of respondents made no statement in this regard. The results
show that, from the user's point of view, EaaS is preferably used directly by the
manufacturing company.
Figure 10: Formats of EaaS usage
Figure 11 shows whether the respondents offer EaaS themselves or with an external
partner. Most respondents (42.6%) indicated here that they offer EaaS themselves, but
the option with a bank or financial services provider was also frequently selected
(35.3%). Rarely, on the other hand, were the formats via a subsidiary (14.9%) and EaaS
is carried out entirely by an independent third party (7.2%), selected. If the forms of use
or supply of EaaS are compared, it is noticeable that EaaS is rarely completely
outsourced.
13Equipment-as-a-Service Market Study 2021 Data analysis
Figure 11: Formats of the EaaS offering
Figure 11 shows how the respondents assess the medium-term use or offering of EaaS
services for their companies. A clear majority of 58.7% expect a slight increase in the
next two to three years. Only 2.8% of respondents expect a slight decrease and 0.9% a
strong decrease.
Figure 12: Medium-term use or offer of EaaS
14Equipment-as-a-Service Market Study 2021 Data analysis
2.1.2 Group comparison of terminology and understanding of EaaS
In the following, the different results of the individual survey groups (DACH vs. non-
DACH region, management view) are compared in as-a-service terminology and
application.
Differences regarding the understanding of EaaS both in the company and in the industry
are evident between the DACH data set and the non-DACH data set. A uniform
understanding of EaaS in the company and in the industry is less agreed upon in the
DACH region (company: 40.7% and industry: 35.2%) than in the non-DACH region
(company: 75.0% and industry: 70.2%). It can be concluded from this that the EaaS
business model is less well known in the DACH region or that there is less understanding
there than in the non-DACH region.
In addition, the results differ in management or the entire data set regarding the question
of term confusion within or outside the companies. The agreement of the management
to the existence of term confusions is larger with a height of 79.0% than with all
participants with 64.0%. It is noteworthy that among the management there is no
disagreement at all regarding this question - but among all respondents there is a
disagreement of 16.5%. Therefore, it can be assumed that in top management, confusion
of terms is more frequently addressed than generally among all participants.
Both hypothesis 1 and hypothesis 2, which will be analyzed in the following, fall into the
area of conceptualization and application.
Hypothesis 1: There is no uniform definition and understanding of as-a-service business
models in the industry.
As already listed in the presentation of the results of the entire data set, most participants
(64.3%) agreed with the statement that there is a uniform understanding of the EaaS
business model in the respective industry. Furthermore, to be able to finally verify or
falsify the hypothesis, the uniform understanding in the companies and the existence of
term confusion were considered. Also, from the viewpoint of the enterprise’s agreement
exists with most of the asked persons (69,3%) over a uniform understanding of EaaS.
Despite a uniform understanding, however, there is still
15Equipment-as-a-Service Market Study 2021 Data analysis
confusion of terms for leasing, rental, installment plan, EaaS, PaaS, SaaS, etc. in
discussions within or outside the respective company (agreement by 63.9%).
This leads to the assumption that there is a conviction both in the respective companies
and in the industry that the understanding of EaaS is uniform. However, confusion still
occurs regarding terms around EaaS. For this reason, hypothesis 1 cannot be
conclusively verified, despite agreement on the existence of a uniform understanding of
EaaS.
Hypothesis 1 cannot be conclusively verified despite agreement on the existence of
a common understanding of EaaS.
Hypothesis 2: As company size decreases, so does knowledge and awareness of as-a-
service business models.
Hypothesis 2 tests a positive relationship between company size and knowledge and
awareness of as-a-service business models.
First, a possible correlation between the number of employees and the knowledge of
EaaS within the company was investigated. Here, the number of employees is the
independent variable, while the dependent variable is the uniform understanding of EaaS
within the company. The analysis of the significance shows that there is no correlation
between the two variables. At the defined significance level of 1% or less, the result is
not significant at p = .049. In the scatter diagram considered for this purpose, no
correlation was discernible either. If the significance level is extended to 5%, the result
R2 of
is significant, which is why the the hypothesis test was considered for further
investigation. This is .012, which makes it clear that knowledge of EaaS within the
company cannot be explained by the size of the company.
In addition, it was analyzed whether there is a correlation between the independent
variable number of employees and the uniform understanding of EaaS within the industry
as the dependent variable. With a significance level of 1%, this is a significant result,
which means that a correlation between the independent and dependent variables can
be concluded. In the following, it is necessary to check whether the correlation is positive,
16Equipment-as-a-Service Market Study 2021 Data analysis
as assumed in the hypothesis. The regression equation is y(x) = 4.186 - 0.138x, which
means that the lower the number of employees in the company, the higher the
agreement with the statement "In our industry, there is a uniform understanding of
Equipment-as-a-Service (EaaS)". In this respect, there is a negative correlation. From
the point of view of knowledge and awareness of as-a-service business models within
the industry, hypothesis 2 must be rejected, as it suggests a positive correlation between
company size and knowledge of EaaS.
As a final step in the investigations of hypothesis 2, a possible correlation between the
size of the company and the presence of term confusion of EaaS was examined. Here,
too, the independent variable is the number of employees, and the occurrence of term
confusion forms the dependent variable. As in the first step of the study, there is no
significant result (p > .01). It can be concluded from this that there is no correlation
between the size of the company and the presence of term confusion of EaaS.
Hypothesis 2 is falsified.
Based on the previous research, it can be concluded that there is no positive correlation
between company size and knowledge and awareness of as-a-service business models.
2.2 Advantages and obstacles with EaaS
Equipment-as-a-Service (EaaS) brings numerous advantages and yet some companies
are holding back on implementation. In addition to closer customer relationships between
the user and provider sides of as-a-service services, planning security is created in many
cases for the financing of capital goods. As a result, new, innovative products and
technologies can be promoted with less risk, creating an opportunity for many companies
to differentiate themselves from competitors (Brunner & Waschbusch 2018). The list of
potential benefits of EaaS is long, but what about in practice? Are these supposed
benefits recognized as such by companies? What are the barriers to EaaS deployment?
Are the benefits offset by more difficult application due to a high degree of customization,
increased complexity, and immobility of goods?
17Equipment-as-a-Service Market Study 2021 Data analysis
To evaluate hypotheses 3-5 regarding the benefits and barriers to EaaS deployment, the
following procedure was followed: The items corresponding to the advantages of EaaS
were combined into one construct by calculating the mean value. An equivalent
procedure took place for the construct formation of the statements corresponding to the
inhibiting factors of an EaaS business model. The prerequisites for construct formation
were statistically tested and confirmed using a reliability analysis procedure. Hypotheses
3-5 are each evaluated by performing a T-test on independent samples. This test
procedure is particularly suitable because significant mean differences can be detected
(Janssen & Laatz 2005). Before performing the tests, the corresponding samples were
tested for normal distribution. These results were visualized in the form of histograms
and statistically evaluated using the Shapiro-Wilk test.
2.2.1 Overall view of advantages and obstacles with EaaS
The results of the evaluation of the entire data set can be seen in figureFigure 13. Here,
the proportion of agreement, a neutral attitude and rejection can be read.
Figure 1314: Total data set Advantages and obstacles
18Equipment-as-a-Service Market Study 2021 Data analysis
The highest level of agreement is found in the statement: "The use of EaaS can optimize
costs and efforts for planned maintenance work on EaaS-relevant machines," with a
mean value of 2.78. The higher the mean value, the higher the level of agreement (Min
= 1; Max = 3). The 2nd statement: "The use of EaaS supports differentiation from the
competition." was agreed to by 68.6% of respondents.
The statement "By using EaaS, costs and efforts for unplanned maintenance work and,
above all, downtimes due to technical faults on EaaS-relevant machines can be
optimized or eliminated" received 68.0% agreement from the 322 respondents.
More than three quarters of respondents also agree with the statement "The use of EaaS
promotes the use of innovative products and technologies" and "Increased planning
security for the financing of capital goods". The latter can be explained based on monthly
or annual constant leasing rates (pay per use).
The next statement deals with the closer customer relationship between user and
provider using EaaS services. Here, 74.5% of respondents agreed, 19.6% selected
"neither" and 5.9% rejected the statement. Thus, the mean value of 2.69 was the third
highest value. EaaS thus supports differentiation from the competition.
Cost optimization is based on real-time service information such as operational data and
predictive maintenance; this information can be used to predict potential failures as well
as repair expenses.
The statement "A high degree of individualization and a high complexity of the EaaS
good (= e.g., the machines and systems) inhibits the use of EaaS goods." shows a mean
value of 2.55. Here, the agreement amounted to 65.5%, the "neither" statements to
24.2% and the rejection to 10.2%.
The statement "The immobility of goods/machinery/equipment (e.g., high weight,
installation in the user's production system) inhibits the use of EaaS goods." was rejected
by most with a share of 15.2%. However, it was also accepted and agreed to by 61.8%.
This results in a mean value of 2.47.
19Equipment-as-a-Service Market Study 2021 Data analysis
The lowest mean value of 2.43 is identified for "The use of EaaS leads to higher lifecycle
costs for the user of the EaaS services in the long term than in the status quo." This was
the least agreed upon within the entire sample. A good half (58.4%) of the respondents
agreed with this statement, while 14.8% disagreed.
2.2.2 Group comparisons Advantages and obstacles with EaaS
In this subchapter, relevant insights regarding the perception of benefits and barriers of
EaaS are obtained by comparing different extractions from the data set. In doing so, the
values of the DACH region, without DACH region, large enterprises and SMEs are
analyzed in detail for testing the hypotheses.
Comparison of DACH and non-DACH regions
Figure 15shows the approval ratings for the advantages and obstacles in the countries
Germany, Austria, and Switzerland.
Figure 15: DACH region advantages and obstacles
20Equipment-as-a-Service Market Study 2021 Data analysis
In general, there are high approval ratings in the DACH region, especially for the benefits
of EaaS. It is striking that with 96.3% almost all respondents agree that EaaS leads to a
closer customer relationship. 85.2% find that cost optimization for planned maintenance
can be optimized through EaaS. Similarly, most see EaaS as providing an opportunity to
better plan the financing of capital equipment. The largest areas of rejection are found in
the last three statements, which relate to possible inhibiting factors of EaaS. Only about
half of all respondents in the DACH region see a high immobility of EaaS goods as an
inhibiting factor. In addition, 35.2% do not agree with the thesis that high individualization
inhibits the use of EaaS goods. In contrast, Figure 16shows the assessments of
companies from the rest of the world.
Figure 16: Non-DACH region advantages and obstacles
It is striking that the approval ratings tend to be similar. The disapproval range is almost
always lower than in the DACH region. The proportion of "neither" ratings is always
between 14% and 26% and is therefore high. As in the DACH region, the statements on
cost optimization of planned maintenance work and better plannability of financing
receive high approval ratings. In contrast to the German-speaking region, however,
78.7% agree that using EaaS promotes the use of innovative products and technologies.
21Equipment-as-a-Service Market Study 2021 Data analysis
The lowest level of agreement, at just 59.7%, is given to the statement that the use of
EaaS leads to higher lifecycle costs for the user of the services in the long term than in
the status quo. In the rest of the world, 36.6% also do not agree that the immobility of
goods or assets contradicts a deployment of EaaS models. Even high complexity of the
EaaS asset is not an inhibiting factor for many.
It can be assumed that both regions have a high level of confidence in EaaS. This is
illustrated by the consistently high approval ratings and the relatively low ratings of
inhibiting factors. Very striking is the difference in agreement with the statement that the
use of EaaS ensures a closer customer relationship between user and provider. While
almost 100% agree in the DACH region, the statement only receives 70.1% agreement
in the other regions. The high value in the DACH region can be explained by the fact that
46.4% of the participants from the DACH region come from the "machinery and
equipment" industry. This industry is characterized by high complexity and immobility of
goods. This often results in a close customer relationship, which is further strengthened
by EaaS in particular. If the machinery and equipment industry is considered in the entire
data set (n = 39), 89.7% agree with the statement that the use of EaaS ensures a closer
customer relationship, too.
From the low agreement values for the inhibiting factors, it can be concluded that the
companies do not consider the use of EaaS to be significantly impaired by the high
complexity of the goods. Whether there are statistically significant assessment
differences between the participants from the DACH region and those from countries
outside the DACH region is evaluated by means of the following hypothesis.
Hypothesis 3: Participants from countries outside the DACH region are more likely to agree
with the benefits of EaaS than participants from the DACH region.
In the following table, the results of the independent-samples T-test relevant to the
evaluation of the hypothesis can be traced.
22Equipment-as-a-Service Market Study 2021 Data analysis
Variance homogeneity T-test for independent samples
Significance T-value one-sided significance Mean value
DACH 4.0679
0.635 2.225 0.0135
without-DACH 3.8899
Table 1: T-test comparison DACH and without-DACH for EaaS benefits.
Since variance homogeneity (p = . 635) is given for the analysis at a significance level of
5%, the results of the T-test are considered at equal variances (Janssen & Laatz 2005).
When comparing the means, it is noticeable that - contrary to expectations - participants
from the DACH region are more likely to agree with the benefits of EaaS (M = 4.07) than
participants from the non-DACH region (M = 3.89). While the one-sided significance of p
= . 014 narrowly does not indicate a statistically significant mean difference at a
significance level of 1%. If the significance level is increased to 2%, the research
hypothesis can consequently be rejected and furthermore the statement can be made
that participants from the DACH region rate the statements regarding the benefits of
EaaS significantly better than the participants from the non-DACH region.
This result can be explained primarily by the fact that almost all participants from the
DACH region see a major advantage regarding a closer customer relationship between
user and provider of EaaS goods. The evaluation of this statement represents a kind of
outlier, which means that although the other statements were evaluated similarly in the
region comparison, a significant evaluation difference could be found regarding the
advantages of EaaS.
Hypothesis 3 is falsified.
Agreement of participants from the DACH region is significantly higher.
23Equipment-as-a-Service Market Study 2021 Data analysis
Comparison of IT industry with rest of data set without IT industry
Since 39.1% of the companies surveyed are based in the information technology sector,
it is worth extracting them below to examine the data sets with and without an IT sector
in more detail. Figure 17 shows the responses from companies operating in the IT sector.
Analogous to the responses from the entire data set, particularly high levels of agreement
and almost no disagreement can be recorded for the statement "Cost optimization for
planned maintenance work". The advantage of EaaS in terms of promoting innovation
was recognized almost as frequently, although this is comparably the case for all survey
groups. A minor barrier is the immobility of as-a-service goods for IT companies. This
may be since products in the information technology sector rarely have high weight or
other expansive characteristics and thus the business area is little affected.
Figure 17: IT industry advantages and obstacles
Figure 18 reflects the agreement and disagreement values of the non-IT industry data
sets. While the pattern of responses is similar, subtle differences between the two
extractions are nevertheless apparent. The average mean values of the statements show
little variation in the benefits, but IT companies are less likely to see the potential barriers
to EaaS as problematic. It should be noted here, however, that the statement already
mentioned regarding the immobility of goods carries a lot of weight.
24Equipment-as-a-Service Market Study 2021 Data analysis
The companies surveyed, apart from IT, see a difficulty in the lifecycle costs for the user
of equipment-as-a-service and value the promotion of innovative products. The item
"EaaS supports differentiation from the competition" seems to be much more polarizing,
except for the information technology sector. Instead of a selection proportion of just
under a third "Neither" among participants from the computer and software industry,
respondents from various sectors tend to clearly agree or clearly disagree with the
statement. The trend here is toward agreement with 71.4%.
Figure 18: Data set without IT industry advantages and obstacles
25Equipment-as-a-Service Market Study 2021 Data analysis
Comparison of large companies and SMEs
The following bar chart (Figure 19) compares the information provided by respondents
from large enterprises with that from SMEs.
Figure 19: Comparison of large companies and SMEs Advantages and obstacles
26Equipment-as-a-Service Market Study 2021 Data analysis
Hypothesis 4: Large enterprises are more likely to agree with the benefits of EaaS than
SMEs.
The following table presents the independent-sample T-test results relevant to the
evaluation of the hypothesis.
Variance
homogeneity T-test for independent samples
T- one-sided Mean
Significance value significance value
SME 3.8877
0.378 -1.233 0.109
Large
enterprises 3.9626
Table 2: T-test comparison of SMEs and large enterprises for EaaS benefits.
Variance homogeneity is given due to the significance of p = . 378, which is why the
results of the T-test with equal variances are considered. The comparison of the mean
values indicates no significant evaluation differences between the SMEs and large
companies (∆ M = . 07). It can be observed that, as expected, large enterprises (M =
3.96) are more likely to agree with the benefits of EaaS than SMEs (M = 3.89). However,
the mean difference is only marginal. Regarding the one-sided significance of p = . 109,
the observation that emerged from the descriptive evaluation can be statistically
consolidated. At a significance level of 1%, the hypothesis is rejected.
Hypothesis 4 is falsified.
27Equipment-as-a-Service Market Study 2021 Data analysis
Hypothesis 5: SMEs are more likely to agree with the inhibiting factors of EaaS than large
enterprises.
The following table shows the results of the independent samples T-test.
Variance homogeneity T-test for independent samples
Significance T-value one-sided significance Mean value
SME 3.7065
0.627 1.119 0.132
Large enterprises 3.6087
Table 3: T-test comparison of SMEs and large companies for EaaS inhibition factors
The test for variance homogeneity has a high significance of p = . 627. Thus, the results
of the T-test with equal variances are used for the analysis. Mean differences are minimal
(∆ M = .10), with SMEs (M = 3.71) more likely to agree with EaaS inhibitors than large
firms (M = 3.61), as hypothesized. Due to the one-sided significance of p = . 132, with
an error probability of 1% to be tested, the mean difference is not statistically significant,
which is why hypothesis 5 is also rejected.
Hypothesis 5 is falsified.
28Equipment-as-a-Service Market Study 2021 Data analysis
Comparison of management with entire data set
The following two bar charts (Figure 20) compare the information provided by
management respondents with the entire data set.
Figure 20: Comparison of management with the rest Advantages and obstacles
29Equipment-as-a-Service Market Study 2021 Data analysis
First, the limited significance of the results of the management evaluation must be
mentioned, as only a small number of 19 managers participated. The evaluation of the
statements is carried out chronologically, in which no significant differences between the
bar charts are discussed in more detail.
The statement "By using EaaS, costs and efforts for planned maintenance work on
EaaS-relevant machines can be optimized" receives significantly lower agreement from
the managing directors (∆ M = . 20). In contrast, the statement "By using EaaS, costs
and efforts for unplanned maintenance work and, above all, downtime due to technical
faults on EaaS-relevant machines can be optimized or eliminated" receives higher
approval (∆ M = . 18). Here the responsible persons of the management possibly see
the advantages of the better data evaluation as for example with the help of Predictive
Maintenance.
In addition, differences can be seen in the statement "The use of EaaS increases the
planning security of the financing of capital goods - especially in times of economic
crisis." (∆ M = . 13). The higher agreement of the management with 89.5% can possibly
be explained by the fact that the management is more concerned with the planning of
capital goods than their employees and thus perceive the advantage more strongly.
The statement "The use of EaaS provides a closer customer relationship between the
user and the provider of EaaS goods" receives the highest level of agreement from
management." (∆ M = . 26). This is also where the greatest discrepancy between the
CEOs and all respondents can be seen.
In some cases, there are major differences between the two survey groups. In addition,
it is evident that the advantages of EaaS are largely more highly rated by the managing
directors. This may be since the responsible managers have a better overview of the
company and therefore value the problems that EaaS solves more.
2.3 Influence of age on the attractiveness of EaaS
In the qualitative interviews, the assumption emerged that younger decision-makers in
companies approach the equipment-as-a-service business model more positively than
older ones. The following hypothesis was derived from this assumption.
30Equipment-as-a-Service Market Study 2021 Data analysis
Hypothesis 6: The older the decision-makers in the companies, the less attractive
Equipment-as-a-Service appears.
To test this hypothesis, the construct of barriers was first used, and a sub-hypothesis
was made:
H 6.1: The older the decision-makers in the companies, the more likely they are to
see obstacles to the implementation of EaaS.
This relationship between age and inhibitions was examined in all groups using the
Spearman correlation. No positive correlation was found in any group. In the case of
large companies, a weak negative correlation was even found, which means that older
persons in large companies rate barriers to EaaS less strongly than younger persons (r
= -.22; p = .009).
The advantages construct from section 2.2was also examined for the influence of age2.2
The sub-hypothesis is as follows:
H 6.2: The younger the decision-makers in the companies, the more likely they are
to see advantages in implementing EaaS.
Spearman correlation was again examined in all groups, but no correlation was found
between age and ratings of the benefits of EaaS.
It can be concluded from this that the attractiveness of EaaS does not depend on the
age of the decision-makers.
Hypothesis 6 is falsified.
In the large companies, barriers are rated less strongly by older employees.
2.4 Digitization
Digitization can enable more efficient implementation of EaaS offerings through remote
monitoring, remote service, and predictive maintenance. The extent to which digitization
is therefore perceived as a prerequisite for the holistic realization of Equipment-as-a-
31Equipment-as-a-Service Market Study 2021 Data analysis
Service, the extent to which digitization has progressed in the companies and how this
view differs in the various subgroups is examined in this chapter. To see to what extent
the offering or use of EaaS depends on digitization, a new sub-group of users/providers
(this includes users, providers and those companies that are both users and providers)
and non-users/non-providers of the EaaS model was analyzed for this study. In addition,
the providers, and users of EaaS were considered separately. Looking at the overall data
set (see Figure 21), 74.5% of respondents agree with the statement that "the use of
EaaS depends on the level of digitization of the respective company." It is striking that in
the DACH region only 61.1% of the participants agree with this statement. In the sub-
group of management in, on the other hand, the vast majority (89.5%) agree with the
statement that EaaS is dependent on digitization. Among the companies that have
already implemented EaaS in their company, 75.5% also agreed with the statement - but
only 68.9% of the rest.
Figure 21: Importance of digitization for EaaS
Digitization enables the functions already mentioned, such as remote monitoring and
predictive maintenance. Remote monitoring enables the remote monitoring of devices in
all industries and application areas, such as machines or servers. Predictive
maintenance, on the other hand, refers to a maintenance process that is based on the
32Equipment-as-a-Service Market Study 2021 Data analysis
evaluation of process and machine data from the past, their analysis and, based on this,
their continuation regarding the best timing for optimized resource, risk and performance
management.
71.7% of the participants agree that remote monitoring and predictive maintenance are
further prerequisites for the use of EaaS in addition to the general level of digitization.
Only 8.4% disagree and 19.9% abstain. With only 61.1% agreeing and 27.8%
disagreeing, the DACH region again differs strongly from the other groups. The other
groups do not show any significant differences compared with the overall data set.
For the successful use of these monitoring and maintenance services and consequently
for the use of EaaS, the provider of the model needs an empirical data basis on the
operation of the EaaS asset. While only 7.1% reject this statement, 71.1% see this
necessity. What is striking about this statement is the strong differences when looking at
providers and users. On the provider side, 77.2% of the participants agree with this
statement, whereas only 64.2% of the users are also of this opinion and 26.3% have no
tendency. This could possibly be due to users' uncertainties about the security of their
data. In the management group, there is the highest level of agreement in this regard
and no participant who considers the empirical data basis to be unnecessary.
The other questions in the digitization section then related to the current state of the
companies themselves. First, the participants were asked whether their companies are
fundamentally digitally positioned in such a way that they can offer EaaS. This was
agreed to by only 44.4% of the participants who have not yet implemented the model in
their company. Only 40% of the companies that do not use the EaaS model have external
access for digital, condition-based maintenance of machines. The situation is similar for
the option of controlling the machines externally (42.4% of non-users have such an
option). For all three questions, however, there is also a high proportion (min. 31%) of
participants who expressed a neutral opinion. Also, conspicuously low values are again
shown here by the DACH region, where likewise only 57.4% have a possibility of external
access for digital condition-based maintenance and 46.3% have external control of the
machines. The reason for this could be the 35.2% of this group who do not yet offer or
use EaaS in their company.
33Equipment-as-a-Service Market Study 2021 Data analysis
Finally, the participants were asked whether they plan to use digital condition monitoring
(more) in the medium term. 69.9% of the total participants agree with this question and
only 6.5% disagree. In particular, the DACH region with 75.9% and EaaS providers with
79.3% plan to use machine monitoring more in the medium term. This contrasts with the
participants who do not yet use EaaS. In the group of non-users, half plan to expand
digital condition monitoring.
When evaluating digitization as a prerequisite for EaaS, the descriptive view shows that
the various groups in digitization are in fundamental agreement with the overall view and
therefore have a positive attitude toward the topic of digitization. The exception is the
fundamentally weaker tendency toward approval of digitization in the DACH region.
Hypothesis 7: Digitization enables the holistic realization of equipment-as-a-
service business models.
Based on the descriptive results, to test hypothesis 8, a sub-hypothesis was first
formulated to significantly test the impression that there is no difference in the groups.
The sub-hypothesis 8.1 is:
H7.1: The perception of digitization as a prerequisite for the holistic realization of
Equipment-as-a-Service does not differ among the subgroups.
To test this hypothesis, a digitization index was formed from the three statements on the
assessment of digitization as a prerequisite for EaaS models (see question 14 of the
questionnaire in the appendix) using the mean values (Cronbach's alpha = .59; weak
internal consistency). Since the digitization index is not normally distributed, the Mann-
Whitney U test was used to examine the differences in the various groups (Shapiro-Wilk
test: p < .05). Only in the group comparison of the DACH and non-DACH regions was
there a small significant difference in the medians (Kolmogorov-Smirnov p = .106) in the
perception of digitization as a prerequisite for the holistic realization of EaaS (U = 5807.5,
Z = -2.325, p = 0.02, r = -.13) when the significance level was extended to 5%. In the
DACH region (Mdn = 3.67), digitization is seen as less important as a prerequisite for
implementing the EaaS business model compared with the other countries (Mdn = 4.00)
(see Figure 22). Accordingly, the hypothesis must be rejected here - it is accepted in the
34You can also read