Mental health in South Australia - Monitoring access and outcomes July 2020
←
→
Page content transcription
If your browser does not render page correctly, please read the page content below
Mental health in South Australia
       Monitoring access and outcomes

                              July 2020
Mental health in South Australia, monitoring access and outcomes, July 2020

© Government of South Australia, 2020

Except for the Health Performance Council branding and the Government of South Australia branding and piping
shrike emblem, this document is licensed under the Creative Commons Attribution 4.0 International License. To
view a copy of this licence, visit https://creativecommons.org/licenses/by/4.0/ or send a letter to Creative
Commons, PO Box 1866, Mountain View, CA 94042, USA.

Disclaimer
Views and opinions expressed in this document do not necessarily reflect those of its authors or of the Health
Performance Council, SA Health or the Government of South Australia.

Recommended citation
Health Performance Council. (2020). Mental health in South Australia, monitoring access and outcomes, July 2020.
Adelaide: Government of South Australia.

SA Health information asset classification
Public – I1 – A1

Contact
Health Performance Council Secretariat
Contact officer: Nicholas Cugley
PO Box 3246
RUNDLE MALL SA 5000
Australia

Telephone: +61 8 8226 3188
E-mail: HealthHealthPerformanceCouncil@sa.gov.au

This report may be provided in large print or other formats on request.
Acknowledgment of the Aboriginal peoples of South Australia
The Health Performance Council acknowledges the Aboriginal peoples of South Australia and their ongoing
contributions to and participation in the life of South Australia. We acknowledge and respect their spiritual
relationship with their respective countries.
We also acknowledge the diversity of Aboriginal people in South Australia. Our Australian continent is known to
have been inhabited for at least 55,000 years. The first inhabitants comprised over 270 different Aboriginal
language/cultural groups across Australia, with 40 independent groups living in South Australia. Each group occupied
its own territory and had its own unique culture, beliefs, laws, language, stories, ceremonies and art (Reconciliation
SA, 2017). Aboriginal peoples in their diversity have demonstrated resilience and have made significant
contributions to South Australia despite the ongoing effects of colonisation and dispossession.
Executive summary
The Health Performance Council commissioned this report to fill a gap in resources and provide findings to serve as a
catalyst for action. It has four goals:
   1. To inform the Minister for Health and Wellbeing on the extent of the state’s mental health workforce,
      facilities, resources; service models and strategies.
   2. To provide public monitoring and quantitative reporting of select health outcome measures for South
      Australians with mental health issues.
   3. To provide a statistical resource that can be re-used by others as a template for future regular and publicly
      available monitoring and reporting.
   4. To identify gaps, shortcomings and opportunities for improvement in relevant data collections.
This report monitors mental health access and outcomes by selecting Report on Government Services 2020 mental
health indicators—supplemented with other data sources—arranged into broad topic areas.
Key stakeholder organisations were consulted and assisted the Council make sense of mental health access and
outcomes performance indicators. Stakeholder organisations included local health network governing boards,
organisations representing Aboriginal health, veterans’ health, culturally and linguistically diverse communities and
people with lived experience as service users. Valued feedback was used to finalise advice, narrative and context.
Feedback from this consultation was clear—there are gaps and shortfalls in the monitoring and reporting of the
performance of the South Australian mental health system that must be addressed in areas of:
   • Timeliness, availability, completeness and accuracy of data
   • Collaboration and data sharing between government agencies and departments, the private sector and non-
     government organisations
   • Consistent definitions of mental health and psychosocial needs when accessing services and, related to that,
     identification of levels of unmet need.
Importantly, it would be remiss of the Council not to highlight here that, during our consultation, we heard that
stakeholder organisations who advocate for specific and vulnerable communities feel that the government is slow to
respond in translating recommendations into policies and practices. Stakeholder organisations that engage willingly
and in good faith want to see advice provided to government have an impact on improving outcomes.
OPPORTUNITIES FOR IMPROVEMENT

The Health Performance Council finds that monitoring and reporting of mental health access and outcomes in
South Australia could be improved. Priority attention is required in three important areas:
1. There is an inability to report multilayered, timely data for: (i) high-needs geographic areas; (ii) specific and
   vulnerable population groups; and (iii) distribution of workforce in a cohesive way. Data gaps in these areas
   need urgent attention before monitoring and reporting can claim to be representative of the population.
2. Consumer experience of mental health treatment and rehabilitation services is a critical gap in the state’s
   monitoring and reporting of mental health outcomes. The Council could make no assessment of South
   Australia’s performance in relation to consumer experience of mental health care in this state due to no data
   made available by the public health system.
3. Mental health outcomes would be improved with better collaboration and data sharing between government
   agencies and departments, the private sector and non-government organisations. This is hampered, in part,
   by data systems that are outdated and not compatible with other technological infrastructure.

In relation to mental health access and outcomes in South Australia, the Council heard that:
• there are gaps in cultural competency training
• there is a greater need for mental health education awareness in the community to minimise stigma
• more should be done to enable partnerships between family, carers and service providers
• service models for special needs groups are lacking
• services are minimal and fragmented
• there is unmet need for appropriately accredited interpreters.

                                                           i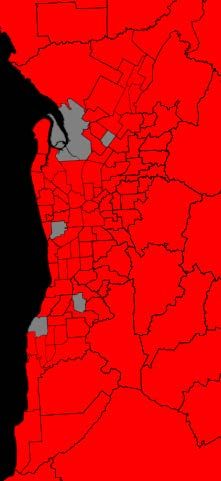
Contents
Executive summary ................................................................................................................................................... i

Contents .................................................................................................................................................................. ii

    List of tables ....................................................................................................................................................... iii

    List of figures ...................................................................................................................................................... iv

Introduction ............................................................................................................................................................ 1

What we heard from our consultation ................................................................................................................... 2

    What do you want from a report that monitors indicators of mental health in South Australia?............................ 2

    What mental health indicators should SA Health local health network governing boards monitor on a monthly
    basis? .................................................................................................................................................................. 3

    What are the biggest gaps or shortfalls in the state government's monitoring of mental health in South Australia?
    ............................................................................................................................................................................ 4

What we found in the data....................................................................................................................................... 5

    Data gaps ............................................................................................................................................................ 6

SOUTH AUSTRALIAN POPULATION MENTAL HEALTH AND WELLBEING ................................................................ 7

RISK AND RESILIENCE FACTORS ............................................................................................................................ 10

SERVICES ACTIVITY................................................................................................................................................ 12

PATIENT OUTCOMES ............................................................................................................................................ 14

WORKFORCE AND CARERS ................................................................................................................................... 15

CAPACITY AND UTILISATION ................................................................................................................................. 17

SAFETY, QUALITY AND CONSUMER EXPERIENCE ................................................................................................. 21

COSTS .................................................................................................................................................................... 23

Consultation questions and list of organisations invited to provide feedback .................................................... 24

How to interpret tables in this report .................................................................................................................. 25

Definitions ............................................................................................................................................................ 26

Data sources ......................................................................................................................................................... 27

Data quality .......................................................................................................................................................... 29

References ............................................................................................................................................................ 30

                                                                                       ii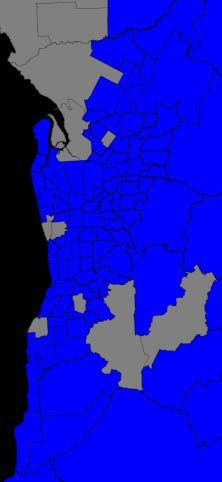
List of tables

Table 1: Psychological distress (anxiety and depression) and suicide deaths in South Australia and Australia..... 7

Table 2: High or very high levels of psychological distress (anxiety and depression) (ages 18+ years) by local
health network, 2018 ............................................................................................................................................. 8

Table 3: Doctor-diagnosed mental health condition (ages 18+ years) by local health network, 2018 .................. 9

Table 4: Health risk factors and mental illness status, South Australia compared to Australia ........................... 10

Table 5: Employment status, face-to-face contact with family and friends, and experience of discrimination,
South Australia compared to Australia ................................................................................................................. 11

Table 6: People receiving clinical mental health services, South Australia compared to Australia ..................... 12

Table 7: Mental health care specific MBS items and clients, South Australia compared to Australia ................. 13

Table 8: People who received mental health care services and who significantly improved, South Australia
compared to Australia .......................................................................................................................................... 14

Table 9: Mental health services workforce–staff, consumer workers, and paid carers, South Australia compared
to Australia ........................................................................................................................................................... 15

Table 10: Employed mental health workforce, South Australia compared to Australia ...................................... 16

Table 11: Mental health available hospital beds, hospital patient days and length of hospital stay, South
Australia compared to Australia ........................................................................................................................... 17

Table 12: Public hospital hospitalisations (inpatient separations) coded as mental diseases and disorders by
local health network, 2018-19 .............................................................................................................................. 18

Table 13: Public hospital hospitalisations (inpatient separations) coded as mental diseases and disorders by
specific population group, 2018-19 ...................................................................................................................... 18

Table 14: Public hospital emergency department presentations for psychosocial reasons by local health
network, 2018-19 ................................................................................................................................................. 19

Table 15: Public hospital emergency department presentations for psychosocial reasons by specific population
group, 2018-19 ..................................................................................................................................................... 19

Table 16: Emergency department presentations seen on time, seclusion events, readmissions, and community
follow-up, South Australia compared to Australia ............................................................................................... 21

Table 17: Consumer experience of service, and consumer outcomes measures, South Australia compared to
Australia ................................................................................................................................................................ 22

Table 18: Expenditure and costs, mental health services, South Australia compared to Australia ..................... 23

                                                                                     iii
List of figures
Figure 1: High or very high levels of psychological distress (anxiety and depression) (ages 18+ years) by age and
sex, 2018 ................................................................................................................................................................. 8
Figure 2: High or very high levels of psychological distress (anxiety and depression) (ages 18+ years) by
socioeconomic status, 2018 ................................................................................................................................... 8
Figure 3: Doctor-diagnosed mental health condition (ages 18+ years) by age and sex, 2018 ............................... 9
Figure 4: Doctor-diagnosed mental health condition (ages 18+ years) by socioeconomic status, 2018 ............... 9
Figure 5: Public hospital hospitalisations (inpatient separations) coded as mental diseases and disorders, 2015-
16 to 2018-19 ....................................................................................................................................................... 18
Figure 6: Public hospital emergency department presentations for psychosocial reasons, 2015-16 to 2018-19 19
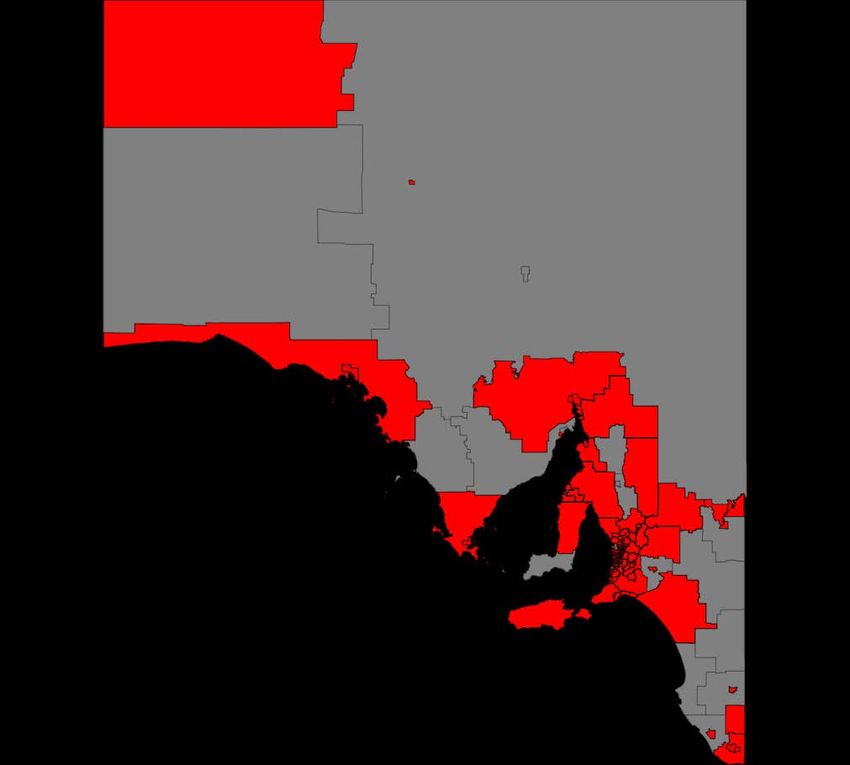
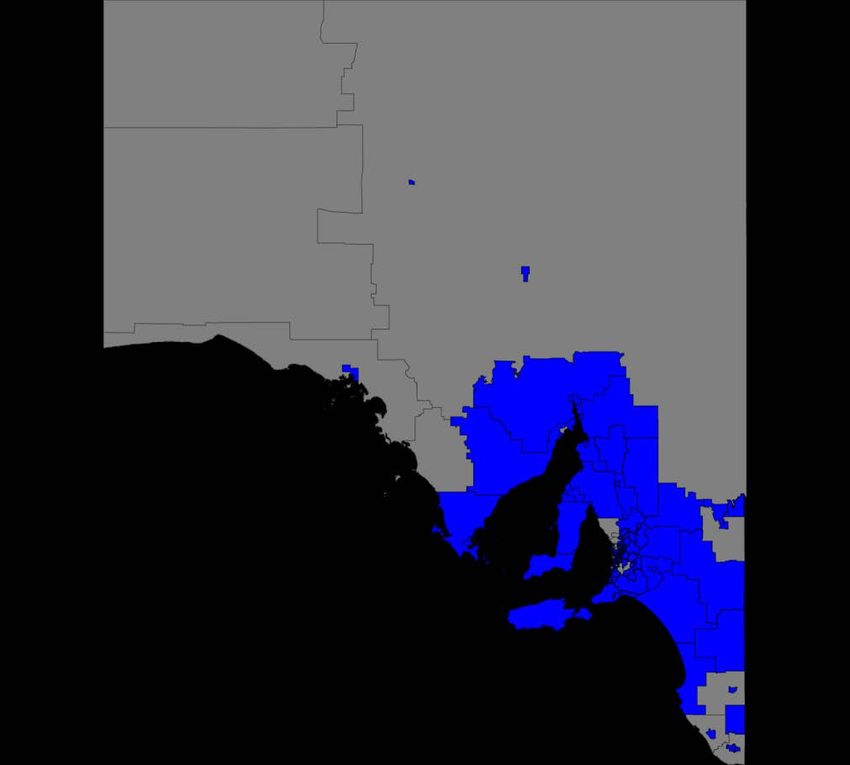
Figure 7: Map of public hospital hospitalisations (inpatient separations) coded as mental diseases and
disorders by SA2, 2018-19 .................................................................................................................................... 20
Figure 8: Map of public hospital emergency department presentations for psychosocial reasons by SA2, 2018-
19 .......................................................................................................................................................................... 20
ivIntroduction
Australia responds to the mental health care needs of the general population through a mental health system
comprising three broad sectors: (1) public and private emergency, inpatient, and outpatient specialist mental health
services; (2) primary health care services; and (3) general community services, including school-based services.
At present there is no known publicly available, comprehensive, regular monitoring and reporting of access and
outcomes in relation to the South Australian mental health system. Performance monitoring and reporting of
Australian, state and territory governments’ management of mental health and mental illnesses is currently done by
national bodies such as the Australian Government’s Productivity Commission.
In this report, the Health Performance Council monitors mental health access and outcomes by selecting Report on
Government Services 2020 mental health indicators that can be compared between states and territories and
arranges them into broad topic areas. Report on Government Services 2020 data is supplemented with other sources
such as the Australian Institute of Health and Welfare, Australian Health Practitioner Regulation Agency, and
SA Health where indicated.
This report also summarises what the Council heard from a consultation process with key stakeholder organisations.
Purpose of this monitoring report
This report fills a gap in available resources and its advice should be a call to action. Its purpose is four-fold:
• To inform the Minister for Health and Wellbeing on the extent of the state’s mental health: (1) workforce;
(2) facilities and resources; and (3) service models and strategies.
• To provide public monitoring and quantitative reporting of select health outcome measures for South
Australians with mental health issues. Outcome measures will be timely, relevant and high-quality. Outcome
measures will be compared by specific population groups and geography.
• To provide a statistical resource that can be re-used by SA Health, the primary health networks, the SA Mental
Health Commission and other stakeholders as a template for future regular and publicly available monitoring
and reporting.
• To identify gaps, shortcomings and opportunities for improvement in relevant data collections.
Consultation process
This monitoring report was released initially as a consultation draft with emerging findings from the populated
indicators, seeking feedback from key stakeholders to finalise advice, narrative and context. The Health Performance
Council wants to use this report to build and leverage synergies from joint interests of other professional bodies and
advisory groups in co-operation with the South Australian Mental Health Commission.
The consultation process asked key stakeholder organisations to provide guidance on 3-5 measures they consider—
from a consumer point-of-view—local health network governing boards should prioritise for monitoring and
reporting on a regular basis. Organisations invited to provide feedback are listed as an appendix of this report. A
summary of what we heard from the consultation process is provided at the front of this report.
Background
Towards the end of its 2015-2018 reporting period, the Health Performance Council completed—as one of its
priority reviews for that period—an initial scoping of an approach to monitor health outcomes for people with
mental health issues in South Australia. In 2019, the Council agreed to produce a short report of populated
indicators along with relevant commentary, concentrating not just on outcomes but also on issues of access, quality
and recommended improvements. Every year the Council publishes on its website a short statistical summary of
select health indicators from the Productivity Commission’s Report on Government Services, comparing South
Australia to Australia. In March 2019, the Council included mental health indicators in that summary.
This report continues to build on the Council’s monitoring of access and outcomes for people living with mental
health issues such as our 2013 report, Mental Health in Rural and Remote South Australian Communities (HPC
2013). The Council recognises the important strategic frameworks of the SA Mental Health Commission’s Strategic
Plan 2017-2022 (SAMHC 2017) and the SA Mental Health Services Plan 2020-2025 (SA Health 2019a). This report will
support the ongoing implementation, monitoring and reporting of those plans, but that was not the primary intent
for commissioning this project.
1What we heard from our consultation
This monitoring report was released initially as a consultation draft with emerging findings from the populated
indicators, seeking feedback from key stakeholder organisations to finalise advice, narrative and context. The
consultation process focussed on asking specific stakeholder organisations three key questions to help prioritise
mental health monitoring and reporting of access and outcomes:
1. What do you want from a report that monitors indicators of mental health in South Australia?
2. What mental health indicators should SA Health local health network governing boards monitor on a monthly
basis?
3. What are the biggest gaps or shortfalls in the state government's monitoring and reporting of mental health in
South Australia?
What do you want from a report that monitors indicators of mental health in South Australia?
Respondents told us of a need for greater accountability and visibility in monitoring and reporting of mental health
outcomes in South Australia. They want a reporting regime that has flexibility and scope to monitor services on a
regional and timely basis to quickly target improvements across the mental health systems (primary, hospital, and
community), and drill down to high-needs geographic areas and specific and vulnerable population groups.
Population groups at increased risk of a range of social, behavioural, and mental health problems resulting from
various intersecting stressful experiences include:
• Aboriginal persons
• Aged persons
• Lesbian, gay, bisexual, transgender, intersex and queer persons
• Persons from culturally and linguistically diverse backgrounds (including refugees and new migrants)
• Persons in custody
• Persons living with disability and co-morbidities
• Persons who reside in rural and remote areas of the state
• Persons who reside in socioeconomically disadvantaged areas of the state
• Veterans
• Young people with developmental disability.
People from these groups—in the words of one stakeholder organisations the Health Performance Council
consulted with—“can be victims of inequality, often missing out on available resources, and often receiving services
and treatment outcomes that are inferior in quality”.
When identifying status of people from culturally and linguistically diverse backgrounds, respondents told us that
data collection should include: (1) preferred language; and (2) need for and use of appropriately accredited
interpreters. Further in relation to reporting by specific and vulnerable population groups, respondents told us that
datasets should comply with national standards such as Australian Bureau of Statistics’ definitions and data
collection methods to ensure consistency in monitoring and reporting of comparisons and trends.
Respondents want monitoring and reporting that is a “single version of the truth” useful as a tool in engaging with
various stakeholders—including the media—as evidence of the real state of play in mental health injury and
treatment. Respondents want a statistical resource for policy setting, resource allocation, planning services,
performance monitoring, tendering, and developing and operating integrated models of care. Current disparate
sources of activity data often do not coalesce nor adequately reflect real time consumer activity, diagnosis, risk, or
mental state. A single source of mental health data (e.g. inpatient, community, rehabilitation, recovery and health
status) would vastly improve the capacity of the service to efficiently provide services to those most in need. Service
efficiency gains would be significant and consequent health outcomes for consumers enhanced.
Indicators should include a balance of multifactorial causation/correlation measures (e.g. population health),
outcomes (e.g. recovery), process (e.g. care plans), and structure (e.g. workforce).
2What mental health indicators should SA Health local health network governing boards monitor on a monthly basis?
We heard clearly from our consultation that consumer experience of mental health treatment and rehabilitation
services is THE most important factor to be monitoring and reporting if local health network governing boards want
to see exactly what is working and what isn't. Linking health outcomes to consumer-reported experience of service
provision gives the system capacity to adapt to increasing health and psychosocial community need and complexity.
Other indicators identified as important by consulted organisations for priority monitoring and reporting of mental
health by SA Health LHN governing boards (listed alphabetically):
• Ambulatory indicators focusing on the specific domains of access, outcomes and quality of life. Proposed
ambulatory indicators are: (1) Care Plan compliance; (2) Closed cases re-referred within 6 months;
1
(3) Average length of case (days); (4) Average treatment days; (5) Average HoNOS at case start;
2
(6) YES survey completion; (7) Average change in clinically significant HoNOS items; (8) Re-admission rates
into inpatient and community mental health services.
• Intersection indicators looking at the links between mental health, specific populations and co-morbidities.
For example, arthritis is often associated with chronic pain and disability often leading to long term
emotional distress. Other intersection indicators include risk and resilience factors in the broader
population, utilising wellbeing measures that provides predictive data on population health.
• Medicare Benefits Scheme data on mental health assessments and plans, counselling and provision of
specific therapeutic interventions and strategies for psychological distress.
• Planned capacity versus actual utilisation by people needing mental health services at different levels—
including hospital (emergency, inpatient, ICU and outpatient mental health services), primary mental
health care services, and mental health community services, as well as by different diagnostic groups and
treating needs (e.g. psychosis, borderline personality disorder, self-harm).
• Prevalence of diagnosed mental health conditions, disorders and problems.
• Suicide rates and attempted suicides.
• Tracking indicators monitoring outcomes at service interfaces and over the whole patient journey,
including repeat and return visits. E.g. Tracking of re-admission rates into inpatient and community mental
health services, transfers of children and young people to adult mental health services, tracking of health
outcomes and ensuring service provision has capacity to adapt to increasing health and psychosocial
community need and complexity.
• Utilisation rates of mental health services, including public and private hospital emergency, inpatient and
outpatient specialist mental health services, primary health care services, and general community services
(including school-based services).
1
HoNOS (Health of the Nation Outcomes Scalesis a measure of the health and social functioning of people with severe mental
illness. The scales contain 12 items measuring behaviour, impairment, symptoms and social functioning. The scales are
completed after routine clinical assessments in any setting.
2
Your Experience of Service
3What are the biggest gaps or shortfalls in the state government's monitoring of mental health in South Australia?
We heard clearly from key stakeholder organisations consulted that one very big gap is the failure to capture and
publicly report consumer experience of service information. There is virtually none to draw on. Very little is known
about consumer experience, service satisfaction and even less about service efficacy, particularly as it pertains to
specific and vulnerable population groups. Until this is addressed no decision maker can make an informed choice .
When there is an increase in a particular cohort presenting with a mental illness, the system needs to find out why
this is happening. If there is an increase in a particular area it needs to be looked at with a wide lens.
In terms of government monitoring and reporting of mental health in South Australia, respondents identified gaps
and shortfalls in:
• Awareness, education and understanding amongst specific and vulnerable population groups to reduce
stigma and improve access and equity.
• Collaboration and data sharing between government agencies and departments, the private sector and
non-government organisations. Interfacing capacity between health data systems would provide real time
collateral and corroborating health information that can assist with diagnosis care and discharge planning.
• Completeness and accuracy of data.
• Consistent definitions of mental health and psychosocial needs when accessing services and, related to
that, identification of levels of unmet need.
• Outcomes of care and service integration for people with complex mental health needs. As one consulted
organisation put it, “This cohort of consumers are heavy users of state funded health, social and justice
services and yet we know almost nothing regarding the effectiveness of these services.”
On data collection, storage and usability, stakeholders told us that current collection of activity data is hampered by
mental health data systems no longer fit for purpose. Some systems are outdated and not compatible with other
technological infrastructure. Consumer and organisational activity data collected by some systems do not always
accurately reflect consumer health status or outcomes, service use, workforce activity or health condition. Usability
is also problematic for many users, and this is reflected in the often poor accuracy of collected data and reports.
Data systems must be person-focussed. Respondents told us that specific and vulnerable communities need to be
better represented in government datasets generally. Not all consumers choose to identify themselves or their
loved ones every time they interact with government mental health services, often for fear of discrimination. And
mental health service providers may fail to ask the status of consumers from specific population groups, even where
collection of this status field is mandatory. Issues of service access cannot be adequately addressed without the
collection of accurate and informative data about the status of service users. Inadequate data collection systems
continue to impede inclusive mental health service planning and development across the country.
Also, we heard that:
• there are gaps in cultural competency training
• there is a greater need for mental health education awareness in the community to minimise stigma
• more should be done to enable partnerships between family, carers and service providers
• service models for special needs groups are lacking
• services are minimal and fragmented
• there is unmet need for appropriately accredited interpreters.
4What we found in the data
As at 30 June 2018 there were over 1.7m people in South Australia, representing 7.0% of Australia’s total population
of 24.8m. Around one in seven adults in South Australia is living with high or very high levels of psychological stress
(anxiety and depression). Prevalence is much higher amongst persons who live in the lowest socio-economic status
areas of the state (23.5%), persons living with a disability (33.1%), and Aboriginal persons (37.6%). Suicide deaths in
South Australia account for 12.0 deaths per 100,000 population, or over 200 deaths per year in absolute numbers.
In this report, the Health Performance Council has summarised data available in the mental health management
data tables of the Report on Government Services 2020—supplemented with data from other sources—and
compares South Australia to the other states and territories and national averages across the domains of: risk and
resilience factors; services activity; patient outcomes; workforce and carers; capacity and utilisation; safety, quality
and consumer experience; and costs.
In summary, the Health Performance Council finds:
Risk factors
RANKED HIGHEST South Australia ranks first out of the states and territories for people with mental or behavioural
problems living with arthritis.
RANKED LOWEST South Australia ranks eighth out of the states and territories for people with mental or behavioural
problems at risk of long-term harm from alcohol.
TRENDS There has been an increase in the South Australian proportion of people with mental or behavioural
problems living with arthritis.
Resilience factors
RANKED HIGHEST South Australia ranks first out of the states and territories for people with a mental illness who
had recent (within the last week) face-to-face contact with family or friends living outside the household.
RANKED LOWEST South Australia ranks seventh out of the states and territories for people aged 16-64 years with
mental or behavioural problems who are employed.
TRENDS could not be determined.
Services activity
RANKED HIGHEST South Australia ranks first out of the states and territories for rural and remote residents receiving
clinical mental health services in the public system.
RANKED LOWEST South Australia ranks seventh out of the states and territories for mental health care specific
Medicare Benefit Scheme (MBS) items processed for non-clinical psychologist services. South Australia also ranks
seventh for new clients of MBS-subsidised mental health services.
TRENDS have been relatively steady.
Patient outcomes
RANKED HIGHEST South Australia ranks third out of the states and territories for people aged 0-17 years and 18-64
years who received mental health care provided by community care services and who significantly improved.
RANKED LOWEST South Australia ranks seventh out of the states and territories for people aged 18-64 years who
received mental health care provided in hospital and who significantly improved.
TRENDS There has been an increase in the percentage of people aged 0-17 years who received mental health care
provided in ongoing community care who significantly improved.
5Workforce and carers
RANKED HIGHEST South Australia ranks second out of the states and territories for staff employed in direct care
specialised mental health services.
RANKED LOWEST South Australia ranks eighth out of the states and territories for other allied health practitioners
aged 65 years and over employed in the mental health sector as a percentage.
TRENDS have been relatively steady.
Capacity and utilisation
RANKED HIGHEST South Australia ranks second out of the states and territories for available beds in psychiatric
hospitals .
RANKED LOWEST South Australia ranks seventh out of the states and territories for available beds in acute hospitals
with psychiatric units or wards. South Australia also ranks seventh for length of stay in public hospital acute units–
general mental health services.
TRENDS There has been a decrease in patient days recorded for admitted patients in non-acute units. Conversely,
there has been an increase in length of stay for older persons mental health services in public hospital acute units.
Safety and quality
RANKED HIGHEST South Australia ranks first out of the states and territories for persons aged 75 years and over
readmitted to hospital within 28 days of discharge.
RANKED LOWEST South Australia ranks eighth out of the states and territories for community follow-up within the
first seven days of discharge from a psychiatric admission.
TRENDS have been relatively steady.
Costs
RANKED HIGHEST South Australia ranks first out of the states and territories for costs per inpatient bed day (average
recurrent) for psychiatric hospitals–acute units, older persons mental health services and non-24 hour staffed units
in community residential services.
RANKED LOWEST South Australia ranks sixth out of the states and territories for cost per treatment day of
ambulatory mental health care.
TRENDS There has been an increase in costs per inpatient bed day for older persons’ non-acute mental health
services.
Data gaps
In reviewing the mental health management data tables of the Report on Government Services 2020 for this report,
the Health Performance Council finds that reporting for mental health could be improved with attention to making
data more widely available in two important areas:
• Specific and vulnerable population groups—Some population groups are not well represented in government
datasets. These groups can face particular mental health challenges and require tailored responses: Aboriginal
persons, persons from culturally and linguistically diverse backgrounds, persons living with other disabilities and
co-morbidities, carers, veterans, lesbian, gay, bisexual, transgender, intersex and queer persons, persons in
custody, aged persons, persons who reside in socioeconomically disadvantaged areas of the state, persons who
reside in rural and remote areas of the state. The Council recognises that persons from vulnerable communities
may choose not to identify themselves or their loved ones every time they interact with government services.
• The Health Performance Council could make no assessment of South Australia’s performance in relation to
consumer experience of mental health care in this state due to no data made available by the public health
system.
6SOUTH AUSTRALIAN POPULATION MENTAL HEALTH AND WELLBEING
As at 30 June 2018—the time period when the majority of indicators in this indicator report applies—there were over 1.7m people in South Australia, representing 7.0% of
Australia’s total population of 24.8m. Population growth in this state (0.9% per annum) is around half the national average (1.6% per annum) (RoGS 2020).
Around one in seven (or 13.6%, age standardised) adults in South Australia is living with high or very high levels of psychological stress (anxiety and depression). Psychological
distress is defined here using the Kessler 10 Item (K10) Psychological Distress Questionnaire—a checklist that measures to what extent a person has been affected by anxiety and
depression during the previous 30 days. The South Australian rate (13.6%) is comparable to the Australian average (13.0%). However, prevalence is much higher amongst persons
who live in the lowest socio-economic status areas of the state (23.5%), persons living with a disability (33.1%), and Aboriginal persons (37.6%). The South Australia rate of adults
with high or very high levels of psychological stress for Aboriginal persons is ranked first of the states and territories (RoGS 2020).
Suicide deaths in South Australia account for 12.0 deaths per 100,000 population, or over 200 deaths per year in absolute numbers. The South Australian rate is comparable to the
national average (12.1 deaths per 100,000 population). There is a disparity between the rates for metropolitan Adelaide (11.5) versus the rest of state (13.4). The rate of suicide
deaths amongst Aboriginal persons, at 21.2 deaths per 100,000 population, is around double the overall rate in South Australia (RoGS 2020).
Table 1: Psychological distress (anxiety and depression) and suicide deaths in South Australia and Australia
SA rank Reporting SOUTH SA change from
Selected Report on Government Services mental health management indicator Unit of measurement Australia
(out of 8) period AUSTRALIA previous period
3 Adults with high or very high levels of psychological distress 13.6 13.0 * 13.7
1 Residents of lowest socio-economic status geographical areas 2017-18 Percentage of population 23.5 20.5 * 23.6
6 Persons living with a disability or restrictive long-term health condition (age-standardised) 33.1 35.6 ↓ 39.1
1 Aboriginal persons 2017-19 37.6 31.2 * 34.3
5 Suicide deaths 12.0 12.1 ↓ 12.8
5 Greater capital city 2018 11.5 10.3 — 11.5
6 Rest of state/territory Deaths per 100,000 population 13.4 15.9 ↓ 18.3
4 Aboriginal persons 21.2 23.7 n.a. n.a.
2014-2018
6 Persons aged 5-17 years 2.0 2.4 ↑ 1.8
Source: RoGS 2020, Tables 13A.46, 48, 52-55. See the ‘How to interpret tables in this report’ appendix for information about headings, symbols and acronyms used.
7SA Health population health data on psychological distress (anxiety and depression)
SA Health collects its own data on psychological distress (anxiety and depression) in the community via the South Australian Population Health Survey (SAPHS). As with data
reported in the Report on Government Services (RoGS), SAPHS also uses the Kessler 10 Item (K10) Psychological Distress Questionnaire to measure the extent a person has been
affected by anxiety and depression during the previous 30 days. However, the SAPHS and RoGS figures are not directly comparable (RoGS data has been age standardised). SAPHS
data is presented here to show differences between SA Health regions (local health networks), age and sex, and socio-economic status.
High or very high levels of psychological distress (anxiety and depression) is more prevalent amongst metropolitan Adelaide residents (20.3%) than their Country SA counterparts
(13.9%), and highest in the Northern Adelaide Local Health Network (27.6%). More than half (57.9%) of women aged 18 to 24 years have recently experienced high or very high
levels of psychological distress. As with the RoGS data, SAPHS data reports higher prevalence amongst persons who live in the lowest socio-economic areas of South Australia
(27.4%) (SA Health 2019b).
Table 2: High or very high levels of psychological distress (anxiety and Figure 1: High or very high levels of psychological distress (anxiety and
depression) (ages 18+ years) by local health network, 2018 depression) (ages 18+ years) by age and sex, 2018
Local Health Network Prevalence (%) 75 years and over
Northern Adelaide 27.6% 65 to 74 years
Central Adelaide 16.6% 55 to 64 years
Southern Adelaide 16.9% 45 to 54 years
Metropolitan Adelaide 20.3% 35 to 44 years
Barossa Hills Fleurieu 9.5% 25 to 34 years
Eyre and Far North 10.1%* 18 to 24 years
Flinders and Upper North 15.2%* 60% 0% 60%
Limestone Coast 21.1% Males Females
Riverland Mallee Coorong 20.2% Source: SA Health 2019b
Yorke and Northern 11.2%
Figure 2: High or very high levels of psychological distress (anxiety and
Country SA 13.9% depression) (ages 18+ years) by socioeconomic status, 2018
SOUTH AUSTRALIA 19.0%
highest quintile
* Relative standard error is between 25% and 50%. Please treat the estimate with caution.
high quintile
Note: Data are weighted which can result in rounding discrepancies.
middle quintile
Source: SA Health 2019b
low quintile
lowest quintile
0% 30%
Source: SA Health 2019b
8SA Health population health data on adults living in the community with a doctor-diagnosed mental health condition
SA Health’s South Australian Population Health Survey (SAPHS) also collects data on adults living in the community with a doctor-diagnosed mental health condition. This is the
prevalence of adults living with doctor-diagnosed anxiety, depression, stress, or any other mental health problem. Around one in three (30.0%) respondents in 2018 said yes to this
question. The prevalence of doctor-diagnosed mental health conditions is statistically significantly higher in metropolitan Adelaide (31.0%) than Country SA (25.8%), and highest in
the Southern Adelaide Local Health Network. More than half (or 50.2%) women aged 25 to 34 years are living with a doctor-diagnosed mental health condition. SAPHS data reports
higher prevalence amongst persons who live in the lowest socio-economic areas of South Australia (35.4%) (SA Health 2019b).
Table 3: Doctor-diagnosed mental health condition (ages 18+ years) by local Figure 3: Doctor-diagnosed mental health condition (ages 18+ years) by age and
health network, 2018 sex, 2018
Local Health Network Prevalence (%) 75 years and over
Northern Adelaide 32.5% 65 to 74 years
Central Adelaide 26.5% 55 to 64 years
Southern Adelaide 34.9% 45 to 54 years
Metropolitan Adelaide 31.0% 35 to 44 years
Barossa Hills Fleurieu 25.8% 25 to 34 years
Eyre and Far North 26.3% 18 to 24 years
Flinders and Upper North 29.8% 50% 0% 50%
Limestone Coast 25.9% Males Females
Riverland Mallee Coorong 29.0% Source: SA Health 2019b
Yorke and Northern 21.4%
Country SA 25.8%
SOUTH AUSTRALIA 30.0% Figure 4: Doctor-diagnosed mental health condition (ages 18+ years) by
Source: SA Health 2019b
socioeconomic status, 2018
Note: Data are weighted which can result in rounding discrepancies. highest quintile
high quintile
middle quintile
low quintile
lowest quintile
0% 40%
Source: SA Health 2019b
9RISK AND RESILIENCE FACTORS
Risk factors
RANKED HIGHEST South Australia ranks first out of the states and territories for people with mental or behavioural problems living with arthritis, at 33.3% (age standardised), above
the roughly one in five (19.2%, age standardised) of all persons in South Australia living with arthritis (RoGS 2020).
RANKED LOWEST South Australia ranks eighth out of the states and territories for people with mental or behavioural problems at risk of long-term harm from alcohol, at 12.6% (age
standardised) of the population, below the roughly one in six (16.2%, age standardised) of all persons in South Australia at risk of long-term harm from alcohol (RoGS 2020).
TRENDS There has been a 7.4 percentage point increase in the South Australian proportion of people with mental or behavioural problems living with arthritis, from around one in
four persons (25.9%, age standardised) in 2016-17 to a third (33.3%, age standardised) of persons in 2017-18 (RoGS 2020).
DATA GAPS Risk factor indicators for specific population groups—such as Aboriginal persons, persons from culturally and linguistically diverse backgrounds, aged persons, rural and
remote residents, and residents of lowest socio-economic areas—are not published in the Report on Government Services 2020 mental health management data tables.
Table 4: Health risk factors and mental illness status, South Australia compared to Australia
SA rank Reporting SOUTH SA change from
Selected Report on Government Services mental health management indicator Unit of measurement Australia
(out of 8) period AUSTRALIA previous period
Health risk factors and mental illness status
Overweight/ob ese
2 People with mental or behavioural problems 71.9 69.0 ↑ 66.2
2 All people 68.9 66.7 ↑ 64.5
Arthritis
1 People with mental or behavioural problems 33.3 25.9 ↑ 25.9
3 All people 19.2 17.7 * 20.2
Asthma
2 People with mental or behavioural problems 23.1 18.4 ↑ 16.9
4 All people 12.0 11.5 * 11.4
Daily smoker
6 People with mental or behavioural problems 19.6 22.2 * 20.0
6 All people 2017-18 Percentage of population (age-standardised) 13.4 14.1 * 13.5
At risk of long term harm from alcohol
8 People with mental or behavioural problems 12.6 16.9 * 15.7
5 All people 16.2 16.1 * 16.7
Diab etes
3 People with mental or behavioural problems 9.1 7.6 * 9.2
2 All people 6.8 5.7 * 6.1
Cardiovascular disease
5 People with mental or behavioural problems 8.0 7.6 ↓ 10.8
3 All people 5.6 5.4 * 5.9
Cancer
3 People with mental or behavioural problems 3.0 3.0 * 3.5
6 All people 1.9 2.1 * 2.1
Source: RoGS 2020, Tables 13A.56-57. See the ‘How to interpret tables in this report’ appendix for information about headings, symbols and acronyms used.
10Resilience factors
RANKED HIGHEST South Australia ranks first out of the states and territories for people with a mental illness who had recent (within the last week) face-to-face contact with family
or friends living outside the household, at 81.7% (crude rate) of the population. However, while this is above the national average for people with a mental illness (76.5%) it is below
the comparative 84.2% all-population rate for South Australia (RoGS 2020).
RANKED LOWEST South Australia ranks seventh out of the states and territories for people aged 16-64 years with mental or behavioural problems who are employed, at 59.1%
(age-standardised) of the population. This is below both the national average for people with mental or behavioural problems (63.9%, age-standardised) and below the 77.3% (age-
standardised) all-population rate for South Australia (RoGS 2020).
TRENDS cannot be determined clearly from the sample or data for the previous reporting period is not published in the Report on Government Service 2020 mental health
management data tables (RoGS 2020).
DATA GAPS Resilience factor indicators for specific population groups—such as Aboriginal persons, persons from culturally and linguistically diverse backgrounds, aged persons,
rural and remote residents, and residents of lowest socio-economic areas—are not published in the Report on Government Services 2020 mental health management data tables.
Table 5: Employment status, face-to-face contact with family and friends, and experience of discrimination, South Australia compared to Australia
SA rank Reporting SOUTH SA change from
Selected Report on Government Services mental health management indicator Unit of measurement Australia
(out of 8) period AUSTRALIA previous period
Employment status: Aged 16–64 years and are employed
7 People with mental or behavioural problems 2017-18 Percentage of population (age-standardised) 59.1 63.9 * 62.9
5 All people 77.3 77.1 * 75.0
Had face-to-face contact with family or friends living outside the household in the
last week
2014 Percentage of population
1 People with a mental illness 81.7 76.5 n.a. n.a.
2 All people 84.2 77.0 n.a. n.a.
Experienced discrimination or been treated unfairly
6 People with a mental illness 2014 Percentage of population 25.0 29.1 n.a. n.a.
6 All people 17.5 18.6 n.a. n.a.
Source: RoGS 2020, Tables 13A.59, 60, 64. See the ‘How to interpret tables in this report’ appendix for information about headings, symbols and acronyms used.
11SERVICES ACTIVITY
RANKED HIGHEST South Australia ranks first out of the states and territories for rural and remote residents receiving clinical mental health services in the public system, at 3.3% (age
standardised) of the population. Note that this is a Health Performance Council estimate from published data. At 7.1% (age-standardised), the South Australian rate for Aboriginal
persons is higher than the Australian average for Aboriginal persons (5.3%) and is up from the 6.8% recorded in the previous period (RoGS 2020).
RANKED LOWEST South Australia ranks seventh out of the states and territories for mental health care specific Medicare Benefit Scheme (MBS) items processed for non-clinical
psychologist services, at 73.8 services per 1,000 population. South Australia also ranks seventh for new clients of MBS-subsidised mental health services, at 29.8% of total clients
(RoGS 2020).
TRENDS between reporting periods for indicators that the Health Performance Council classifies as services activity have been relatively steady (RoGS 2020).
DATA GAPS Proportion of people receiving clinical mental health services in the private system is not published in the Report on Government Services 2020 mental health
management data tables.
Table 6: People receiving clinical mental health services, South Australia compared to Australia
SA rank Reporting SOUTH SA change from
Selected Report on Government Services mental health management indicator Unit of measurement Australia
(out of 8) period AUSTRALIA previous period
Proportion of people receiving clinical mental health services
3 Public services 2.5 1.9 — 2.5
2 Residents of lowest socio-economic status geographical areas 3.2 2.3 ↓ 3.3
2 Aboriginal persons 7.1 5.3 ↑ 6.8
1 Rural and remote residents (est.) 3.3 2.6 ↑ 2.9
n.a. Private services n.p. 0.2 n.a. n.p.
n.a. Residents of lowest socio-economic status geographical areas n.a. 0.1 n.a. n.a.
n.a. Aboriginal persons n.a. n.a. n.a. n.a.
n.a. Rural and remote residents (est.) n.a. 0.1 n.a. n.a.
Percentage of population
5 Total MBS and DVA services 2017-18 10.3 10.6 ↑ 9.9
(age-standardised)
Total MBS and DVA services b y population type
n.a. Residents of lowest socio-economic status geographical areas n.a. 8.5 n.a. n.a.
5 Aboriginal persons 11.8 10.6 — 11.8
5 Rural and remote residents (est.) 9.1 11.0 — 9.1
Total MBS and DVA services b y service type
4 Psychiatrist 1.7 1.7 — 1.7
2 Clinical psychologist 2.9 2.2 ↑ 2.8
5 GP 8.2 8.7 ↑ 7.8
5 Other allied health 2.6 3.3 ↑ 2.4
Source: RoGS 2020, Tables 13A.7, 16, 17. See the ‘How to interpret tables in this report’ appendix for information about headings, symbols and acronyms used.
12Table 7: Mental health care specific MBS items and clients, South Australia compared to Australia
SA rank Reporting SOUTH SA change from
Selected Report on Government Services mental health management indicator Unit of measurement Australia
(out of 8) period AUSTRALIA previous period
Mental health care specific MBS items processed
5 Psychiatrist services 92.8 97.8 ↓ 96.5
4 GP mental health specific services Number of services 130.9 146.3 ↑ 125.6
2017-18
2 Clinical psychologist services per 1,000 population 116.0 93.0 ↑ 113.1
7 Other psychologist services 73.8 117.3 ↑ 72.5
2 Other allied health services 22.2 16.8 ↑ 19.4
Young people (persons aged less than 25 years) who had contact with MBS Percentage of people who had contact with MBS
4 2018-19 9.0 8.9 ↑ 8.4
subsidised primary mental health care services subsidised primary mental health care services
New clients
5 Under the care of state or territory specialised public mental health services 2017-18 New clients as a percentage of total clients 40.7 41.7 ↑ 40.2
7 Of MBS subsidised mental health services 29.8 30.5 ↑ 29.2
Source: RoGS 2020, Tables 13A.8-10, 20. See the ‘How to interpret tables in this report’ appendix for information about headings, symbols and acronyms used.
13PATIENT OUTCOMES
RANKED HIGHEST South Australia ranks third out of the states and territories for people aged 0-17 years and 18-64 years who received mental health care provided by community
care services and who significantly improved, at 56.9% and 53.5%, respectively, of people discharged (RoGS 2020).
RANKED LOWEST South Australia ranks seventh out of the states and territories for people aged 18-64 years who received mental health care provided in hospital and who
significantly improved, at 65.6% of people discharged (RoGS 2020).
TRENDS There has been a 5.1 percentage point increase in the percentage of people aged 0-17 years who received mental health care provided in ongoing community care who
significantly improved, from over a quarter (27.7%) of people discharged in 2016-17 up to nearly a third (32.8%) in 2017-18 (RoGS 2020).
DATA GAPS Risk factor indicators for specific population groups—such as Aboriginal persons, persons from culturally and linguistically diverse backgrounds, select age groups, rural
and remote residents, and residents of lowest socio-economic areas—are not published in the Report on Government Services 2020 mental health management data tables.
Table 8: People who received mental health care services and who significantly improved, South Australia compared to Australia
SA rank Reporting SOUTH SA change from
Selected Report on Government Services mental health management indicator Unit of measurement Australia
(out of 8) period AUSTRALIA previous period
People who received mental health care provided by state and territory public
mental health services and who significantly improved
People discharged from hospital who significantly improved
n.a. Aged 0–17 years n.p. 56.5 n.a. n.p.
7 Aged 18–64 years 65.6 73.1 ↓ 67.5
n.a. Aged 65 years or over n.p. 70.5 n.a. n.p.
People discharged from community care who significantly improved
2017-18 Percentage of people
3 Aged 0–17 years 56.9 53.9 n.a. n.p.
3 Aged 18–64 years 53.5 53.0 n.a. n.p.
n.a. Aged 65 years or over n.p. 47.7 n.a. n.p.
People in ongoing community care who significantly improved
5 Aged 0–17 years 32.8 37.7 ↑ 27.7
6 Aged 18–64 years 20.4 24.6 ↓ 20.6
5 Aged 65 years or over 24.3 25.7 ↓ 24.7
Source: RoGS 2020, Table 13A.62. See the ‘How to interpret tables in this report’ appendix for information about headings, symbols and acronyms used.
14You can also read