Measuring the Spatial Allocation Rationality of Service Facilities of Residential Areas Based on Internet Map and Location-Based Service Data - MDPI
←
→
Page content transcription
If your browser does not render page correctly, please read the page content below
sustainability

Article
Measuring the Spatial Allocation Rationality of
Service Facilities of Residential Areas Based on
Internet Map and Location-Based Service Data
Xinxin Zhou 1,2 , Yuan Ding 3 , Changbin Wu 1,2,4, *, Jing Huang 1,2 and Chendi Hu 1,2
 1   College of Geographical Science, Nanjing Normal University, Nanjing 210023, China;
     windofmay@foxmail.com (X.Z.); huangjing04030@163.com (J.H.); 15295576608@163.com (C.H.)
 2   Key Laboratory of Virtual Geographic Environment, Ministry of Education, Nanjing Normal University,
     Nanjing 210023, China
 3   School of Earth Science and Engineering, Hohai University, Nanjing 211100, China;
     dingyuanhhu@hhu.edu.cn
 4   Jiangsu Provincial Key Laboratory for Numerical Simulation of Large Scale Complex Systems,
     Nanjing Normal University, Nanjing 210023, China
 *   Correspondence: wuchangbin@njnu.edu.cn

 Received: 29 January 2019; Accepted: 27 February 2019; Published: 4 March 2019

 Abstract: The spatial allocation rationality of the service facilities of residential areas, which is affected
 by the scope of the population and the capacity of service facilities, is meaningful for harmonious
 urban development. The growth of the internet, especially Internet map and location-based service
 (LBS) data, provides micro-scale knowledge about residential areas. The purpose is to characterize
 the spatial allocation rationality of the service facilities of residential areas from Internet map and
 LBS data. An Internet map provides exact geographical data (e.g., points of interests (POI)) and
 stronger route planning analysis capability through an application programming interface (API)
 (e.g., route planning API). Meanwhile, LBS data collected from mobile equipment afford detailed
 population distribution values. Firstly, we defined the category system of service facilities and
 calculated the available service facilities capacity of residential areas (ASFC-RA) through a scrappy
 algorithm integrated with the modified cumulative opportunity measure model. Secondly, we used
 Thiessen polygon spatial subdivision to gain the population distribution capacity of residential areas
 (PDC-RA) from Tencent LBS data at the representative moment. Thirdly, we measured the spatial
 allocation rationality of service facilities of residential areas (SARSF-RA) by combining ASFC-RA
 and PDC-RA. In this case, a trial strip census, consisting of serval urban residential areas from Wuxi
 City, Jiangsu Province, is selected as research area. Residential areas have been grouped within
 several ranges according to their SARSF-RA values. Different residential areas belong to different
 groups, even if they are spatially contiguous. Spatial locations and other investigation information
 coordinate with these differences. Those results show that the method that we proposed can express
 the micro-spatial allocation rationality of different residential areas dramatically, which provide a new
 data lens for various researchers and applications, such as urban residential areas planning and
 service facilities allocation.

 Keywords: service facilities; Tencent location-based data; points of interest (POI); spatial allocation;
 internet map

1. Introduction
    The provision of amenities/service facilities is one of the issues of concern regarding urban
inequalities in social science research [1]. Public property attributes ensure the equivalence operation of

Sustainability 2019, 11, 1337; doi:10.3390/su11051337                      www.mdpi.com/journal/sustainability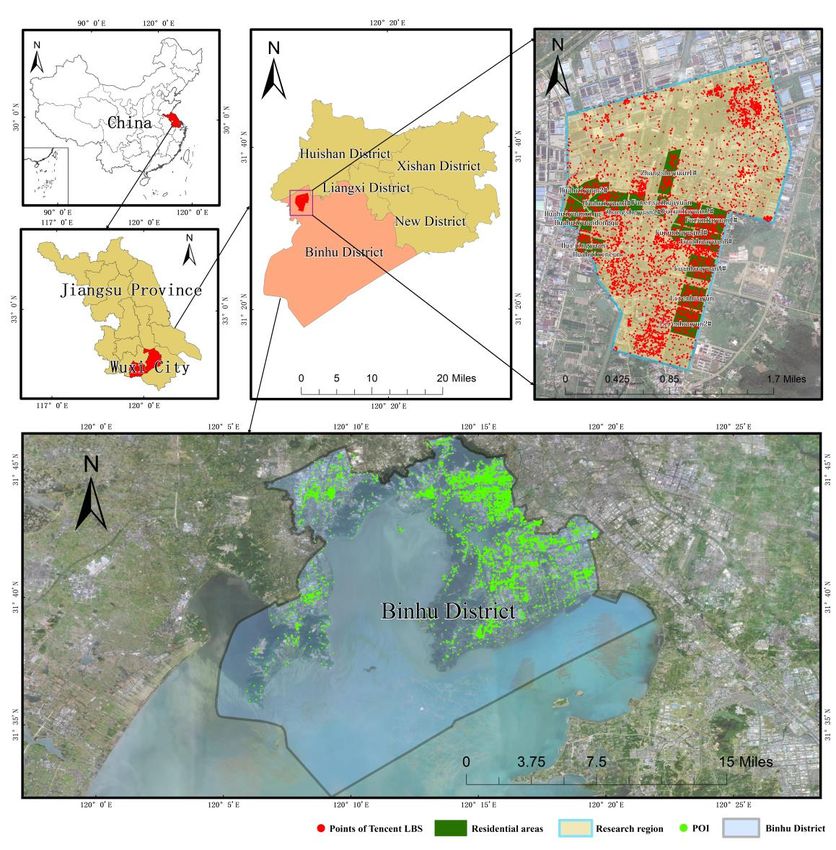
Sustainability 2019, 11, 1337                                                                          2 of 19

civic social and economic activities [2]. Several guiding documents define service facilities. For example,
“Urban Residential Area Planning and Design Specification (GB50180-93, version 2002)”, which is one
of the Chinese urban planning national standards, defines service facilities as those that meet the basic
needs of life and are compatible with the size of the population [3]. The policy of shifting the priority of
urban construction and public service resources allocation to the suburbs in Shanghai was outlined by a
government work report in 2019, which profoundly explained the city government’s policy orientation
to revitalize the disadvantaged suburbs. The planning target of spatial allocation rationality of service
facilities of residential areas (SARSF-RA) is to achieve equivalence between the accessible service
facilities of residential areas and the population of residential areas [1,4,5]. Through a geographer’s
lens, SARSF-RA becomes complicated and increasingly microscopic due to the combined influence of
natural and human factors, especially in China and other countries experiencing rapid development [6].
Therefore, it is desiderated to adopt new, representative datasets that are good at the micro-spatial
scale to calculate the spatial allocation rationality of the service facilities of residential areas.
      The study of the spatial accessibility of service facilities is a precondition for SARSF-RA
and urban evenness measurement [7]. The accessibility of service facilities research continues to
receive attention [8,9]. Previous scholars have mainly focused on a single type of service facilities
when examining accessibility, such as public healthcare services [8,10], urban green space [11],
commercial facilities [12], or transit services [13]. These accessibility evaluations can identify
the potential shortcomings of typical services and reflect the balance of facilities’ spatial layout.
However, few comprehensive assessments of the accessibility of various service facilities have been
researched [14], and the impact of diversity on the accessibility of service facilities has not been revealed.
      There are two indicators for measuring the accessibility of service facilities: the travel costs and the
quality/quantity of opportunities [15]. The travel costs represent the actual ability to reach the provider
through different transportation systems [16], in which travel distance or travel time is considered
regular. The quality/quantity of opportunities contains different aspects from different levels, such as
population flow from a macro level and population count from the micro level [17]. The traditional
measurement for travel costs is mainly based on the Geographical Information System (GIS) analysis
of origin–destination matrices, which need valuable fundamental transportation network data [13].
The conventional data source that is used to measure opportunities is often statistical survey data.
There are apparent deficiencies for traditional data, such as relying on the intensive investigation,
which is costly, time-consuming, and too coarse for detailed mapping and small areas. It is challenging
for this situation to meet the requirements of high efficiency and a microcosmic scale [18].
      The pervasive adoption and penetration of new research data, such as Internet map and
location-based service (LBS) data, create an upcoming research stream, which retrieves detailed
information about local amenities [19]. Internet mapping services, which are also called web-based
mapping services, such as Google Maps (https://www.maps.google.com), Amap (https://www.amap.
com), Baidu Map (https//www.baidu.map.com), are used to acquire the travel costs and complete point
of interest (POI) objects directly based on a route planning application programming interface (API)
and POI API [17,20]. (1) Route planning APIs consider different modes of transport, such as driving,
walking, cycling, and public transport [13,21]. It is feasible to measure the travel time costs through
route planning API [22,23]. (2) POI data, a burgeoning data source for regional research, is applied
for the automated identification and characterization of parcels (AICP) [24], extracting hierarchical
landmarks [25], and the hierarchical semantic cognition of urban functional zones [26,27]. POI data
can estimate employment locations, and implement interzonal commuting patterns [20]. (3) LBS
data contain information on people’s hobbies and places, and have provided new informat ion in
terms of understanding individual activity patterns [28]. Representative LBS data include Twitter
data and Weibo data, which can be used for dynamic land-use mapping [28] and assessing human
travel activity patterns [29]. Tencent LBS data (https://heat.qq.com) are quintessential data that record
more than 50 billion location data of dominant Chinese from China’s largest social media operator [30].
Tencent LBS data provide rich user information, including population location data and population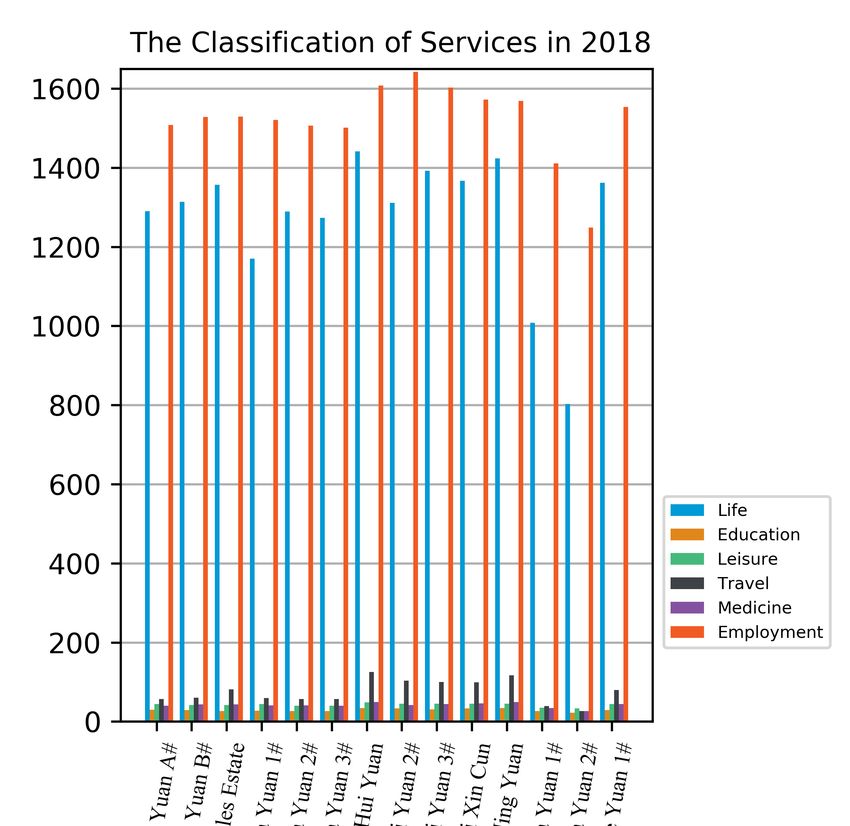
Sustainability 2019, 11, 1337                                                                                         3 of 19

category descriptions, which afford more microcosmic, dynamic, and real population data for assessing
SARSF-RA. Thus, we can use POI data and LBS data as the data of the quality/quantity of opportunities.
     Based on the above description, Internet map and LBS data that provide micro-scale knowledge
about residential areas will be pertinent to SARSF-RA. In the next section, we will introduce and
analyze detail data information and the measurement framework.

2. Materials and Methods

2.1. Study Area and Data
     This paper selected a trail strip census in Binhu District, Wuxi City as the experimental area
(Figure 1). Wuxi is a typical city in the Yangtze River Delta region of China. It ranked 18th among the
top 100 cities in China, with 10.5118 trillion gross domestic product (GDP) and 6,553,300 residents in
2017. Binhu District is dominated by secondary and tertiary industries, among which the township
of Hudai has a tax sale of 20.107 billion. BinHu District was rated as one of the top 100 areas with
investment potential in China in 2018, in which representative industries include the Internet of
Things (IoT), Computer Aided Industry Design (CAID), software service outsourcing, and so on.
The experimental area is located in the Wuxi Hudai Industrial Zone, which borders Taihu Lake in
the southeast. It is the only peripheral town in BinHu District, and is thus relatively independent
of the core urban area, where the population is dense, and the industry mainly relies on electronics,
light, and textiles. The experimental area was used to research the carrying capacity pressure of the
service facilities contained 14 communities and 13,600 residents. This paper collected Internet map data
(route planning API, POI data, and remote sensing images) and LBS data (Tencent LBS data). A detailed
introduction about the data volume, data descriptions, and data applications can be found in Table 1.

      Table 1. A detailed description of the data used in the paper. API: application programming interface,
      LBS: location-based service, POI: point of interest.

  Data Category         Dataset Name                  Data Content                 Data Application        Access Method
                                              Three route planning methods,
                                                                                                          Requesting from
                       Route planning     included driving, riding, and walking,   Calculating travel
                                                                                                               https:
   Internet map             API              requested opening API to obtain           time costs
                                                                                                          //lbs.amap.com
       data                                    corresponding planned path.
                                          POI data was requested from Amap           Representing         Requesting from
                           POI data       in BinHu District in 2018, including      different service          https:
                                            schools, banks, and restaurants.            facilities        //lbs.amap.com
                                                                                                          Downloading from
                       Basic geographic     Amap platform provides remote               As map
                                                                                                                https:
                             data             sensing image to request.               background
                                                                                                          //ditu.amap.com
                                             Requesting real-time population
                                                                                    Reflecting spatial      Crawling from
                                          locations of Tencent one time per hour
     LBS data          Tencent LBS data                                            distribution of real         https:
                                            from 9 April 2018 to 22 April 2018;
                                                                                       population          //heat.qq.com/
                                                attained 1,570,000 records.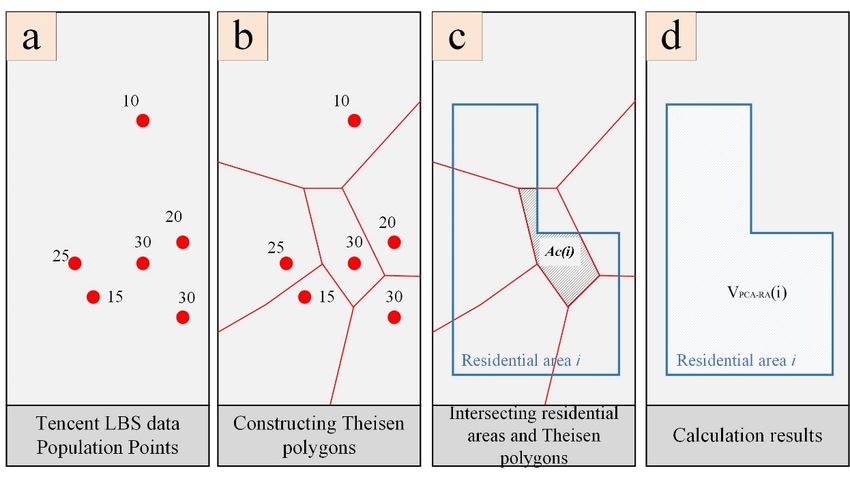
Sustainability 2019, 10, x FOR PEER REVIEW                                                                    4 of 21
Sustainability 2019, 11, 1337                                                                                 4 of 19

     Figure 1. The research area: the urban built-up area of Hudai Town. The red dots represent the
       Figure 1. The
     distribution      research
                   of the  pointarea: the urban
                                 of interest    built-up
                                             (POI),      area ofblocks
                                                    the green     Hudairepresent
                                                                        Town. Thethered dots represent
                                                                                      researching      the
                                                                                                  community,
       distribution
     and              of the
          the light yellow     point
                            blocks    of interest
                                   represent      (POI), the
                                             the research     green blocks represent the researching
                                                          region.
       community, and the light yellow blocks represent the research region.
2.2. The Assessment Methodology
        Table 1. A detailed description of the data used in the paper. API: application programming
      In general, the framework of assessing SARSF-RA has six steps (Figure 2): (I) basic data
                          interface, LBS: location-based service, POI: point of interest.
preparation based on three crawler programs to crawl POI data, Tencent LBS data, and basic geographic
data;Data
       (II) building the category system of service facilities and defining
                  Dataset                                                     Datathe travel time costs threshold;
                                            Data Content                                     Access Method
   category
(III) gaining theName
                    travel time costs to service facilities using the     Application
                                                                             route planning API program; (IV)
calculating the available         Three
                             service     route planning
                                      facilities capacitymethods,
                                                           of residential areas  (ASFC-RA) through a modified
                   Route                                                  Calculating
cumulative opportunity      measureincluded
                                       model; driving,
                                               (V)     riding,the
                                                   building    andpopulation distribution capacity
                                                                                            Requesting    from
                                                                                                       of residential
                 planning                                                  travel time
                                 walking, requested opening API to                        https://lbs.amap.com
areas (PDC-RA) basedAPI on Tencent LBS data representative moments selection  costs     and the Theisson polygon
                                obtain corresponding planned path.
space segmentation method; and lastly, (VI) measuring the SARSF-RA values and analyzing the
                                                                         Representing
   Internet and characteristics
regularity                      POI
                                  ofdata  was requested
                                      different           from
                                                 residential    Amap
                                                              areas.        different       Requesting from
  map data      POI data       in BinHu District in 2018, including
                                                                            service       https://lbs.amap.com
                                 schools, banks, and restaurants.
                                                                           facilities
                  Basic                                                                   Downloading from
                                 Amap platform provides remote             As map
               geographic                                                                 https://ditu.amap.co
                                   sensing image to request.             background
                  data                                                                              m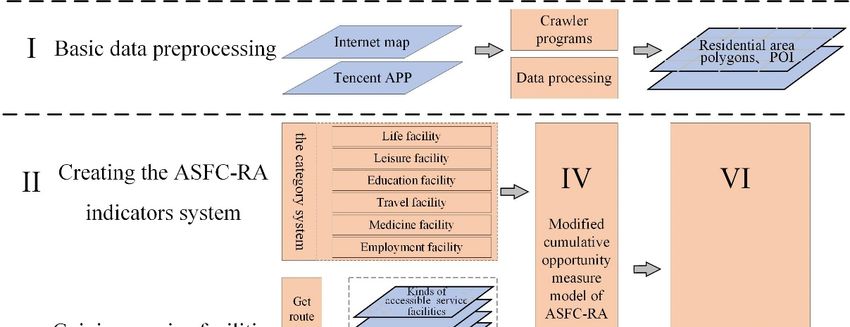
planning API program; (IV) calculating the available service facilities capacity of residential
    areas (ASFC-RA) through a modified cumulative opportunity measure model; (V) building
    the population distribution capacity of residential areas (PDC-RA) based on Tencent LBS data
    representative moments selection and the Theisson polygon space segmentation method; and
    lastly, (VI)
Sustainability 2019,measuring
                    11, 1337  the SARSF-RA values and analyzing the regularity and characteristics
                                                                                                5 of 19
    of different residential areas.

                                      Figure 2. Overall assessment roadmap.
                                      Figure 2. Overall assessment roadmap.
2.3. The Construction Process of ASFC-RA
    2.3. The Construction Process of ASFC-RA
      We will introduce the construction process of ASFC-RA, which consists of steps II, III, and IV in
Figure 2.WeThewill    introduce
                  premise          the construction
                            of diversification          processofof
                                                 is a feature        ASFC-RA, and
                                                                  a reasonable     which  consists of steps
                                                                                       comprehensive         II, III,
                                                                                                        classification
system of service facilities; thus, the calculation travel time costs based on route planning APIand
    and   IV    in   Figure   2.  The    premise    of  diversification    is  a  feature  of  a  reasonable      from
    comprehensive
Internet  map data isclassification
                          a convenientsystem
                                           spatialofstandard
                                                      service facilities; thus, thewhether
                                                               for determining       calculation travel time
                                                                                            the service       costsare
                                                                                                         facilities
    based or
accessible  onnot.
                 route   planning
                      In the followingAPIsections,
                                            from Internet    mapthe
                                                     we outline    data   is aphilosophy
                                                                      design    convenientofspatial  standard
                                                                                              a modified         for
                                                                                                          cumulative
    determining
opportunity          whether
                measure    modelthethrough
                                     service facilities  are accessible
                                               various types   of serviceor   not. In the following sections, we
                                                                           facilities.
    outline the design philosophy of a modified cumulative opportunity measure model through
(1) various
      The category
              types of system
                         service offacilities.
                                    service facilities
      Firstly, it is necessary to construct a service facilities classification system in the residential areas.
The classification system of service facilities in residential areas will be built based on the four concepts
of basic human living requirements proposed by the World Health Organization. First, the system
should be selected according to the principle of ensuring living conditions, and this information
then needs to be combined with the living environment of the city [31]. This paper refers to a total of
339 indicators in the evaluation index systems of nine livable cities at home and abroad; these indicators
comprehensively consider the attributes of residential life services in residential areas from six aspects,
including life services, education services, leisure services, transportation services, medical services,
and employment services. The detail category information is as shown in Table 2.
      The identified methods of travel include walking, public transportation, self-driving, cycling,
and combinations of these methods [22]. Many factors influence the choice of travel mode, including
economic conditions, travel distance, and travel urgency. Walking is the most basic and most common
mode of travel for human beings [32]. The principle that is usually followed is as follows: people
will choose to walk if a destination can be easily reached by walking. Therefore, to quantitatively
judge the service radius of service facilities, the walking mode is used for measurement purposes.
To determine the passing time of the travel time costs threshold, the time cost of five types of service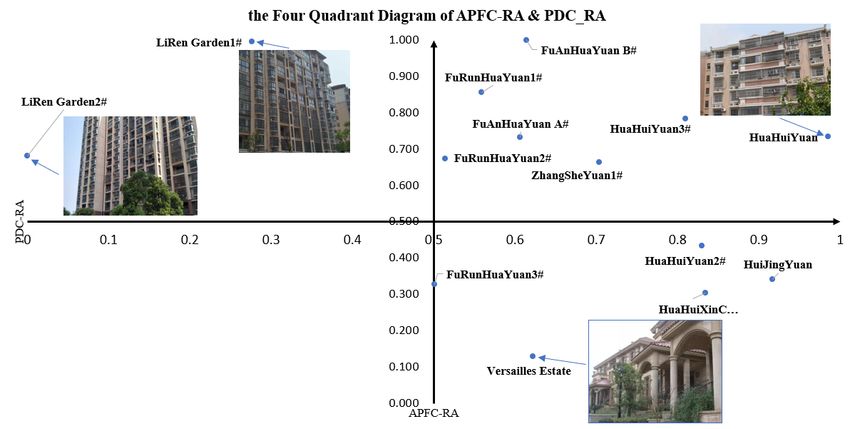
Sustainability 2019, 11, 1337                                                                                       6 of 19

facilities, including life, education, leisure, travel, and medicine, was determined to be 30 minutes.
It is believed that employment causes a specific type of commute between work and home, and this
commuting distance can be significant and differs from that of other trips; thus, the time was selected
as 60 minutes.

                                    Table 2. The category system of service facilities.

 Classification        Service Name                                 Indicator Interpretation
                                            Life service place, travel agency, information consultation center, ticket
                         life service        office, post office, express delivery, telecommunication business hall,
                                              office, water supply business hall, and electric power business hall
                                            Shopping malls, convenience stores, home appliance electronics stores,
                                              supermarkets, home building materials markets, stationery stores,
                      shopping service
                                                  sports stores, shoes, hats and leather stores, and personal
                                                                   products/cosmetic stores
        Life                                 Catering-related places, Chinese restaurants, foreign restaurants, fast
                      catering service      food restaurants, casual restaurant, cafes, tea houses, cold drink shops,
                                                                pastry shops, and dessert shops
                      accommodation
                                                   Accommodation services, hotels, and hotel guest houses
                          service
                                              Financial and insurance services, banks, automated teller machines
                    financial insurance
                                               (ATMs), insurance companies, securities companies, and finance
                          service
                                                                          companies
                                            Public toilets, funded shelters, service facilities, newsstands, and public
                       public utilities
                                                                            telephones
                     business residence                  Related business housing and residential areas
                                            Science and culture education sites, museums, convention centers, art
                    science and culture      galleries, libraries, science and technology museums, planetariums,
   Education
                          service           cultural palaces, literary and art groups, media organizations, schools,
                                                          research institutions, and training institutions
                                             Comprehensive parks, zoos, botanical gardens, children’s parks, and
                         park facility      gardens providing places for residents to enjoy, watch, relax, and enjoy
      Leisure
                                                                         scenic spots
                     sports and leisure     Sports and leisure service places, sports venues, entertainment venues,
                          services                           resorts, leisure venues, and theaters
                       parking lot and         Gas stations, car sales, car repairs, private and public parking lots,
                        repair facility        parking spaces, auto repair shops, automobile sales service shop
       Travel                                 Related airport, railway station, long-distance bus station, subway
                       transportation
                                             station, light rail station, bus station, shuttle bus station, parking lot,
                      facilities service
                                                      border port, taxi, ferry station, and ropeway station
                       road auxiliary         Road auxiliary facilities, warning information, toll stations, service
                          facilities                          areas, traffic lights, and street signs
                                              It mainly includes first-level, second-level, and third-level hospitals,
      Medicine         medical facility         community clinics, private clinics, private hospitals, pharmacies,
                                                  general hospitals, specialist hospitals, and emergency centers
 Employment           public enterprise      Companies, factories, bases with agriculture, forestry, herds, and fish

(2)    Gaining accessible service facilities of the ASFC-RA
     This paper uses Python3.6 and ArcGIS ArcPy (10.2, Esri, Redlands, California, America) to
write a parsing program for layer data parsing to gain the accessible residential service facilities
through route planning API from Amap. The code has been uploaded to GitHub, and the address is
https://github.com/windofmay5/PublicFacilitiesNavigation. The specific steps are as follows: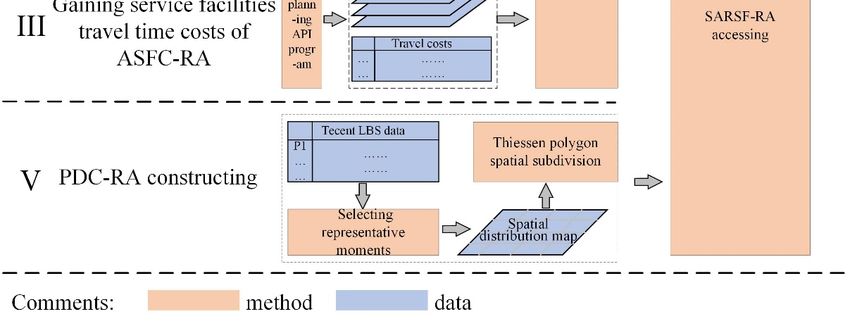
Sustainability 2019, 11, 1337                                                                                             7 of 19

     (1) Data input: Respectively input the residential area polygons layer and the POI service facilities
layers, which are multi-layered, where the residential area polygons layers are used as the starting list,
and the POI service facilities layers are used as the ending list.
     (2) Service radius input: Enter the travel time costs threshold identification list as the criteria for
judging the threshold of reachable service facilities.
     (3) Traversing the center points of residential area polygons and service facilities to verify its
travel time: Clarify the start points and end points, and then request Amap path planning API for
the dynamic planning of walking distance time. By splicing the HyperText Transfer Protocol (HTTP),
request the Uniform Resource Locator (URL) to receive the data (JavaScript Object Notation(JSON) or
Extensible Markup Language(XML) format) returned by the HTTP request, then parse the data, e.g.,
     http://restAPI.amap.com/v3/direction/walking?origin=116.45925,39.910031&destination=
116.587922,40.081577&output=xml&key=.
     (4) Dictionary output: Output the number of different types of service facilities in each district.
The specific implementation process is the following pseudo-code.

 Program 1: Gaining service facilities of available service facilities capacity of residential areas (ASFC-RA)
 through Amap route planning API
                                Input: the POI service facilities layer of one experimental area is a list of layer_s; the
 1
                                residential areas layer names layer_D
 2                              Input: the travel time costs threshold identification list is T=[t1,t2, . . . . . . tS]
                                Output: a two-dimensional array of different types of service facilities in all the residential
 3
                                areas is named accessArray[D, S]
 4                              D = count of residential areas
 5                              S = count of service facilities types
 6                              for s = 0; s < S; s++ do
 7                              #Find out the service facilities of corresponding communities in S types of facilities
 8                                 #Get the s service facilities layer deposited in layer_s
 9                                 For j = 0; j < length(layer_s); j++ do
 10                                        #Get the long-lat of the service facilities point j and save them into the facility
 11                                        For I = 0; I < D; i++ do
                                                 #Get the longitude and latitude of the community i and store them into the
 12
                                residential area
                                                 #Request route planning API, return JSON object and store result, the
                                request form is: #request.url(http:
 13
                                //restAPI.amap.com/v3/direction/walking?origin=facility.X,#facility.Y&destination=
                                residentialarea.X,residential#area.Y&output=json&key=)
 14                                               #get the current path planning time in the result and store it into timeIJ
 15                                              if timeIJ
Sustainability 2019, 11, 1337 8 of 19
measure the number of various service facilities POIs within the travel costs threshold is intuitive and
attractive to reflect the number of service facilities available for a given residential area.
∑G
VASFC− RA (i, s, t) = tij × Fj (1)
j
In Equation (1), VASFC− RA (i, s, d) is the accessibility value of a type s service facility for
a residential area i in a certain travel time costs threshold t. G tij is a binary variable, when tij
within a certain travel time costs threshold t, it is one; otherwise, it is zero. tij is the actual route
planning travel time cost between residential area i and service facility j. Fj is the opportunities for
service facility j, which can be the economic scale or building area of service facility j commonly. In
consideration of there being no uniform scale of POI data, we set Fj to one.
0
VASFC − RA (i ) = ∑ VASFC−RA (i, s, t) (2)
s
0
VASFC − RA (i ) in Equation (2) is the accessibility value of all types of service facilities for residential
0
area i. VASFC − RA (i ) reflects the quantity obtained by all service facilities, but it does not reflect the
diversity of service facilities. Based on the existing research methods, the diversity of the service
facility can be measured from the Shannon entropy index, which is shown as Equation (3):
Hi = − ∑[ Pi (s) × lnPi (s)]among them, Pi (s) = VASFC− RA (i, s, t)/VASFC
0
− RA (i ) (3)
S
In Equation (3), Hi is the Shannon entropy of residential area i, while Pi (s) is the ratio between
0
VASFC− RA (i, s, t) and VASFC − RA (i ).
Wi = Hi /lnS (4)
Based on Hi , the relative entropy Wi is the relative entropy weight in Formula (4), which ranges
from zero to lnS. S is the species number of service facilities. Multiple types of service facilities can
have different effects on different residential areas. The modified cumulative opportunity measure
formula based on the entropy weight index is shown in Equation (5):
∑ VASFC−RA (i, s, d) × Wi
00
VASPF− RA (i ) = (5)
s
Normalization that transforms the dimensional expression into dimensionless expression is a
way to simplify the calculation process. The values of ASFC-RA that have been max–min normalized
00
is obtained by the normalization Equation (6). V ASPF− RA (max ) indicates the maximum value of
00 00 00
V ASPF− RA (i ), and V ASPF− RA (min) indicates the minimum value of V ASPF− RA (i ).
00 00
V ASPF− RA (i ) − V ASPF− RA (min)
VASFC− RA (i ) = 00 00 (6)
V ASPF− RA (max ) − V ASPF− RA (min)
2.4. The Implementation Process of PDC-RA
We will introduce the implementation of PDC-RA based on Tencent LBS data. Considering that
the research area’s population size changes over the course of a day, we should select a representative
moment. We calculate the PDC-RA value by the Thiessen polygon spatial subdivision method.
(1) Choosing a representative moment
Population size data at different hours in multi-days were obtained from Tencent’s location-based
big data platform. We analyze the temporal and spatial variation and pick a representative moment
Tencent LBS data as the data for calculating PDC-RA. Through 24 hours of group summation statistics,
the temporal change characteristics of the population quantity in the experimental area during multipleshould select a representative moment. We calculate the PDC-RA value by the Thiessen
polygon spatial subdivision method.
(1) Choosing a representative moment
Population size data at different hours in multi-days were obtained from Tencent's
Sustainability 2019, 11, 1337 big data platform. We analyze the temporal and spatial variation and pick a 9 of 19
location-based
representative moment Tencent LBS data as the data for calculating PDC-RA. Through 24
hours of group summation statistics, the temporal change characteristics of the population
quantity in
days (weekdays and theweekends)
experimental
arearea during
shown multiple
in Figure 3.days (weekdays
Weekdays and and weekends)
weekends arethe
show shown
same trend
of change.in Figure 3. Weekdays
The lowest and weekends
population show the same trend
was at approximately 05:00,ofand
change. The lowest
the peak population
population occurred at
was atWhat’s
about 21:00. approximately 05:00,
more, 94% ofand the peak
people are atpopulation occurred to
home according at aabout 21:00.time-use
national What’s more,
survey [34].
94% of people are at home according to a national time-use survey [34]. We select the 21:00
We select the 21:00 population points data as the research area’s actual carrying population. The 21:00
population points data as the research area’s actual carrying population. The 21:00 population
population points data are processed to a 21:00 population points layer: 21PPL for short.
points data are processed to a 21:00 population points layer: 21PPL for short.
Figure 3. Comparison diagram of population size changes over a weekday and weekend.
Figure 3. Comparison diagram of population size changes over a weekday and weekend.
(2) Thiessen polygon
(2) Thiessen spatial
polygon subdivision
spatial subdivision
Each point object population value of 21PPL represents the statistical aggregation degree of its
circumjacent coverage, which is calculated from Tencent’s location-based big data platform. If we
intersect points of 21PPL with residential areas, there will be a great spatial error. So, studying the
method for mapping discrete points into continuous space is the basis for counting the population of
residential areas. We adopt the characteristics of “any position in the polygon is closest to the sample
point” in the Thiessen polygon, construct the population distribution statistical point data using the
Thiessen polygon on Tencent LBS data, and apply the spatial association rules by intersecting with
plots, as shown in Figure 4. Thiessen polygons are a type of partition of the space plane. The method
is characterized by any position within the polygon being the closest to potential points. Each polygon
contains only one sample point. In considering of the equal division characteristics of the Thiessen
polygon in spatial segmentation, the method can be used to solve problems such as nearest points,
minimum closed circles, spatial analyses, adjacency, proximity, and reachability analyses.
After the points of 21PPL are allocated to each residential area, the population size of the
residential area is calculated. The calculation equation of the population in each residential area
is as shown in Equation (7):
u
A c (r )
0
VPDC − RA (i ) = ∑ ( A (r ) × P(r ))(r = 1, 2 . . . , u) (7)
r =1
0
VPDC − RA (i ) is the PDC-RA value of residential area i. u indicates the number of Thiessen polygons
that are superimposed on residential area i, Ac (r ) indicates that the sub-block area of residential area
i intersects with the Thiessen polygon r, A(r ) indicates the area of the Thiessen polygon r, and P(r )
indicates the population value of the Thiessen polygon r. The PDC-RA results are shown in Table A1.Sustainability 2019, 10, x FOR PEER REVIEW 10 of 21
Each point object population value of 21PPL represents the statistical aggregation degree
of its circumjacent coverage, which is calculated from Tencent's location-based big data
platform. If we intersect points of 21PPL with residential areas, there will be a great spatial
Sustainabilityerror.
2019, 11,
So, 1337
studying the method for mapping discrete points into continuous space is the basis 10 of 19
for counting the population of residential areas. We adopt the characteristics of "any position
in the polygon is closest to the sample point" in the Thiessen polygon, construct the
The normalization Equation
population distribution (8) gains
statistical point the
data values
using theofThiessen
PDC-RA that on
polygon have beenLBS
Tencent max normalized.
data,
V0PDC− RA (and maxapply the spatial
) indicates association value
the maximum rules by
of V 0
intersecting
PDC − RA ( i with
) . Theplots, as shown
purpose of max in normalization
Figure 4. is to
Thiessen polygons are a type of partition of the space plane. The
prevent PDC-RA values from reaching zero and not being applied to SARSF-RA calculations. method is characterized by
any position within the polygon being the closest to potential points. Each polygon contains
only one sample point. In considering of the equal V 0 division characteristics of the Thiessen
− RA (i )
polygon in spatial segmentation, VPDCthe (i ) = can0 PDC
method
− RA be used to solve problems such as nearest (8)
points, minimum closed circles, spatial analyses,
VPDC−adjacency,
RA ( max ) proximity, and reachability
analyses.
Figure 4. Calculation diagram of population distribution.
Figure 4. Calculation diagram of population distribution.
2.5. The Measurement of SARSF-RA
After the points of 21PPL are allocated to each residential area, the population size of the
residential areameaning
The fundamental is calculated. The calculation
of SARSF-RA is theequation of the population
coordination in each
ratio of the residential
value of ASFC-RA and
PDC-RA. Thearea is as shown invalues
SARSF-RA Equation
are(7):
dimensionless scalar, which directly reflects the spatial allocation
( )
rationality. As the SARSF-RA value (increases, ) = ∑ ( the( )
×spatial
( )) (allocation
= 1,2. . . , )rationality of service
(7) facilities of
residential areas become high. The VSARSF− RA (i ) in Equation (9) indicates the SARSF-RA value of
( ) is the PDC-RA value of residential area . indicates the number of
residential area i.
Thiessen polygons that are superimposed on residential area
VASFC− RA (i ) , ( ) indicates that the
sub-block area of residentialVarea
SARSF − RA (i ) =with the Thiessen polygon r, ( ) indicates
intersects (9)
VPDC− RA (i )
the area of the Thiessen polygon r, and ( ) indicates the population value of the Thiessen
polygon . The PDC-RA results are shown in Table A1.
3. Results
The normalization Equation (8) gains the values of PDC-RA that have been max
normalized. V ( ) indicates the maximum value of ( ). The purpose of max
3.1. The ASFC-RA Results
normalization is to prevent PDC-RA values from reaching zero and not being applied to
SARSF-RA
We calculated calculations.
the accessible service facilities level of various facilities in each residential area, and these
are shown as the results of the indicator calculations ()
( ) = in the experimental area in Table A1. The (8) difference
( ) areas were prominent, and the spatial
regarding the number of accessible service facilities of residential
distribution of different types of service facilities is shown in Figure 5. The basic characteristics of the
resulting data are as follows. (1) The quantity (Q) order of accessible service facilities in different residential
areas showed a basically consistent order: Q(employment services) > Q(life services) > Q(travel services)
> Q(leisure services) > Q(medicine services) > Q(education services), but some residential areas have
variations; for example, Q(medicine services) in HuiJingYuan is slightly higher than Q(leisure services).
(2) Q(employment services) is the most significant number, which is far higher than the number of any
other service facilities, and each of the Q(employment services)s is more extensive than 1400. Furthermore,
the main influencing factor is that the time standard of the travel time costs threshold for enterprise service
facilities is 60 minutes, which is greater than the travel time costs threshold of the other service facilities.
Also, compared with field data, the experimental area is located in the Wuxi Hudai Industrial Zone. There is
a total planned area of 10.3 km2 in the Wuxi Hudai Industrial Zone. It is one of the essential industrial
zones in Wuxi City; it integrates industry, commerce, and logistics, and focuses on electronics, light,Sustainability 2019, 11, 1337 11 of 19
textiles, machinery, and logistics. The number of enterprise facilities, 1642, is the largest in Huahui Yuan
#2, and the community is adjacent to the Wuxi Hudai Industrial Zone. (3) The values of Q(life services)
are also high, and each value is greater than 800. The reason for these large numbers is that Hudai is
located in the Binhu District of Wuxi, and has developed economies and various living and service
facilities. The residential area with the lowest number of living facilities is the LiRen Garden #2
community, which is a new residential area that was established in 2017. The personnel occupancy
is small, and the living service facilities in the surrounding areas are limited. (4) The values of
Q(travel services), Q(leisure services), Q(medicine services), and Q(education services) are less than
200, which is related to the service attributes provided by the service facilities themselves, e.g., the
medical services, travel services, education services, and leisure services. Most of the educational
facilities belong to social welfare service facilities, which are generally undertaken by the government,
and the number of people served by each service facility is high, e.g., educational facilities and sports
facilities, primary schools, middle schools, and stadiums; furthermore, these facilities have a larger
scale and a wide range of services.
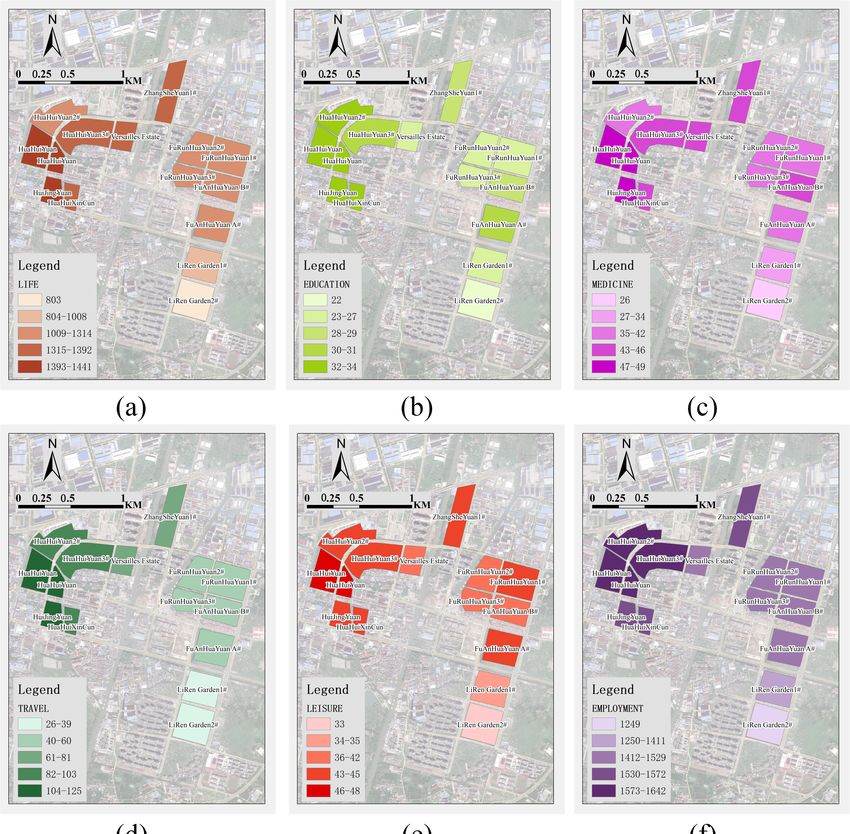
To better understand the characteristics of the spatial distribution of accessible service facilities, we
designed six maps (Figure 6) of different service facilities to express the quantitative difference between
mapped features by varying the color of symbols. We found the location of the high-value or low-value
elements to be clustered in space. In general, all types of accessible service facilities maps have a
similar spatial distribution pattern that shows high-value aggregation in the northwestern direction
and low-value aggregation in the southeast direction. The high-value group included HuaHuiXinCun,
HuaHuiXinCun#1, HuaHuiXinCun#2, HuaHuiXinCun#3, HuiJingYuan, and HuaHuiYuan; the
mid-value group included Versailles Estate, ZhangSheYuan#1, FuRunHuaYuan#3, FuRunHuaYuan#2,
FuRunHuaYuan#1, FuAnHuaYuan #B, and FuAnHuaYuan #A; and the low-value group included
LiRen Garden#2 and LiRen Garden#1. This phenomenon certifies that the overall service resource
supply level was relatively high in the northwestern region of the experimental area, and the service
resource supply in the southeast area was relatively infertile. The spatial distribution map of ASFC-RA
is shown in Figure A1a. The high-value region is over HuaHuiYuan, HuiJingYuan, HuaHuiXinCun,
and HuaHuiYuan#2, too, which reflects that this region has comprehensive and intensive service
facilities. Through field surveying, this region is located at the central part 12of
Sustainability 2019, 10, x FOR PEER REVIEW
Hudai Town,
of 21
which intensifies two factors; facilities quantity and travel times certify the ASFC-RA reasonableness.
Figure 5. Bar chart of the number of various types of service facilities in residential areas.
Figure 5. Bar chart of the number of various types of service facilities in residential areas.
To better understand the characteristics of the spatial distribution of accessible service
facilities, we designed six maps (Figure 6) of different service facilities to express the
quantitative difference between mapped features by varying the color of symbols. We found
the location of the high-value or low-value elements to be clustered in space. In general, all
types of accessible service facilities maps have a similar spatial distribution pattern that
shows high-value aggregation in the northwestern direction and low-value aggregation in theSustainability 2019, 11, 1337 12 of 19
Sustainability 2019, 10, x FOR PEER REVIEW 13 of 21
Figure 6. Graduated color maps of various types of service facilities in residential areas.
Figure 6. Graduated color maps of various types of service facilities in residential areas.
3.2. The PDC-RA Results
3.2. The PDC-RA Results
The spatialized expression of PDC-RA values in the experimental area is shown in Figure A1b,
The spatialized expression of PDC-RA values in the experimental area is shown in
and the bar charts after the quantitative expression are shown in Figure A2b. The PDC-RA values are
Figure A1 (b), and the bar charts after the quantitative expression are shown in Figure A2 (b).
different among residential areas. To further reveal the characteristics of each residential area, the basic
The PDC-RA values are different among residential areas. To further reveal the characteristics
buildingofattributes of the area,
each residential residential area
the basic were collected
building attributesfrom a real
of the estate area
residential agencywerewebsite, and these
collected
data included the estate
from a real total building area, makespan,
agency website, andincluded
and these data averagethebuilding floors,area,
total building as shown in Table A1.
makespan,
The following properties
and average canfloors,
building be summarized.
as shown in(1) The A1.
Table largerThenumber of inhabitants
following properties can wasbefound in
FuAnHuaYuan
summarized. #B and LiRen
(1) The largerGarden#1,
number of where the was
inhabitants populations were 2904 and
found in FuAnHuaYuan #B2888, respectively.
and LiRen
Garden#1, where the populations were 2904 and 2888, respectively. By analyzing
By analyzing the basic building attributes, the building average floors in the residential areas were the basic
greater building attributes,
than 10, and the building
the building averagewere
area values floors in the m
105,389 residential areas m
2 and 365,801 were greater
2 . Thus, than 10,
FuAnHuaYuan #B
and the building area values were 105,389 m 2 and 365,801 m2. Thus, FuAnHuaYuan #B was
was more densely populated than LiRen Garden#1. (2) The lower population was found in Versailles
more densely populated than LiRen Garden#1. (2) The lower population was found in
Estate, which was 376. The residential area is a high-end villa residential area with three floors and
Versailles Estate, which was 376. The residential area is a high-end villa residential area with
building area of 10,169 m2 . For verifying the validity of the Tencent LBS data and the implementation
three floors and building area of 10,169 m2. For verifying the validity of the Tencent LBS data
processand
of PDC-RA in this paper, the of
average building 2
the implementation process PDC-RA in this area
paper,pertheperson
averagewas approximately
building area per 43 m
(excluding extreme
person values, i.e., FuAnHuaYuan
was approximately 43 m2 (excluding#B, LiRen values,
extreme Garden#1, and Versailles #B,
i.e., FuAnHuaYuan Estate).
LiRenThe 2016
Jiangsu Statistical Yearbook records indicated that the housing area per person was 47 m2 . The two
indicators are close to each other. Thus, the value aligns with the real situation, and further verifies the
effectiveness of Tencent LBS data and the methods reported in this paper.Sustainability 2019, 11, 1337 13 of 19
3.3. The SARSF-RA Results
The SARSF-RA result is as shown in Figure A2c, and the spatial distribution map is as shown in
Figure A1c. It was concluded that: (1) the highest SARSF-RA value was in Versailles Estate, i.e., 4.804;
the SARSF-RA of LiRen Garden#2 was the smallest at zero, and this value was related to the processing
method of the ASFC-RA standardized data. Thus, the Versailles Estate residential area had the
strongest comprehensive service capability and the highest value of reasonableness. (2) The SARSF-RA
values of HuaHuiXinCun and HuiJingYuan were higher, at 2.750 and 2.680, respectively. It is easy to
determine from the spatial distribution that the two residential areas are adjacent to each other and are
located in the commercial area. Also, these two communities are low-floor mature communities that
were built before 2010. The overall service capacity of the low-floor mature residential area located
in the commercial center was ranked second. The SARSF-RA values in LiRen Garden#1 and LiRen
Garden#2 were the lowest, at 0.280 and 0, respectively. The reason for this phenomenon is that the
two communities are located outside of the commercial area of Hudai Town and are far from the
Hudai Industrial Zone; thus, there is less infrastructure. Also, LiRen Garden#1 was the most occupied
residential area, which resulted in a low SARSF-RA value. There were demolition and resettlement
houses in LiRen Garden#1 and LiRen Garden#2, and the number of surrounding supporting facilities
was small. However, the number of occupants was large, and it could be concluded that the
comprehensive service facilities capacity of the demolition and resettlement housing community
outside the commercial area was poor. Based on the existing analysis, the SARSF-RA largely depended
on the hierarchical position, the maturity of the location, and the location of the community.
In additional, Graduated color symbology is used to show a quantitative difference that can
classify the SARSF-RA in the experimental area, as shown in Figure A1c. The low-value area was
interlaced with the high-value area. Also, it was block-shaped, and the spatial differentiation was
evident, which indicated that the comprehensive serviceability was different at different levels and
conditions. There were social phenomena that were similar to the classification and differentiation
of communities. Some historical, social, economic, geographical, and administration factors have
impacted urban planning orientation. From the perspective of the spatial allocation rationality of
service facilities, we attempt to consider the future direction and suggestion of urban planning for the
experimental area. We suggest that increasing the surrounding commonweal service facilities over low
SARSF-RA residential areas, such as LiRen Garden#1 and LiRen Garden#2, can attract more residents.
4. Discussion
To intuitively show the differences in the SARSF-RA values, we constructed a four-quadrant map
and collected a photo of the façade from some typical communities, as shown in Figure 7, which was
expected to be more intuitive in terms of explaining the coordination between ASFC-RA and PDC-RA.
The value of ASFC-RA was the highest, but the value of PDC-RA was in the middle in HuaHuiYuan;
thus, it obtained a high degree of rationality. The value of ASFC-RA and the value of PDC-RA was
the highest in Versailles Estate, indicating it was highly reasonable. In LiRen Garden#1, the value of
ASFC-RA was lower, but the PDC-RA was the highest. Thus, it was less generous. In LiRen Garden#2,
the value of ASFC-RA was the lowest, and the PDC-RA value was lower. Thus, LiRen Garden#2
obtained the most moderate degree of reasonableness. However, near the origin, the interrupted
locating communities located in the fourth quadrant in Figure 7, including FuRunHuaYuan#1 and
FuAnHuaYuan#3, had well-situated reasonableness, and the values of ASFC-RA and PDC-RA were
more coordinated.
This paper studied the level of the service facilities and the actual population distribution in urban
residential areas; additionally, the method used quickly, freely, and accurately obtained the relevant
residential areas and auxiliary data for evaluation through open network data. Based on the population
carrying capacity level in residential areas and the supply level of service resources, we constructed
an indicator system of the comprehensive service level in residential areas, and we calculated the
reasonableness of the service facilities in each district by the entropy weight method. The conclusionsSustainability 2019, 11, 1337 14 of 19
are as follows: (1) Internet open data provide new verification data for service facilities rationality
research at the micro scale, which has practical value for the evaluation of urban detailed planning
and design. (2) It is found that the overall service resource supply level in the experimental area is
higher in the northwest and lower in the southeast, and the communities with high and low levels
show a robust spatial agglomeration phenomenon. The distribution of services in five major types also
shows noticeable spatial agglomeration. This conclusion can help the government understand regional
dominance; additionally, the population carrying capacity of the old community was generally higher
than that of the new community, and the population carrying capacity near the community with a
top service resource supply level was usually higher. This research has made significant progress
in the application of big data, but the incompleteness of the data acquisition still limits it, and there
are some shortcomings. The following points are worth further improvement and development:
(1) The experimental area could be expanded to the whole city, and the scope of the experimental area
can be enlarged in the later stage to obtain more stable law. (2) The number and scale of the service
facilities are two important indicators for measuring the supply of the service facilities. Due to the
lack of scale data, this study has certain limitations. It would also be worthwhile to study the method
for supplementing the scale data to POI through other Internet datasets. (3) The spatial subdivision
method of Tencent LBS data can improve to template-based GIS computation, such as a geometric
algebra approach [35–41]. In this paper, the model provides a new and feasible Internet big data
Sustainability 2019, 10, x FOR PEER REVIEW 15 of 21
idea for the effective verification of residential area planning, which can be effectively applied to the
evaluation of the service facilities in the micro-space residential areas. Additionally, the results can
FuRunHuaYuan#1
serve as a reference forand cityFuAnHuaYuan#3, had well-situated
planning and decisions that supportreasonableness, and thedata
multi-source Internet values of a
under
newASFC-RA
trend. and PDC-RA were more coordinated.
7. Four-quadrant
FigureFigure coordination
7. Four-quadrant of ASFC-RA
coordination and population
of ASFC-RA distribution
and population capacity
distribution of residential
capacity of
areas (PDC-RA). residential areas (PDC-RA).
This paper studied the level of the service facilities and the actual population
Author Contributions:
distribution For research
in urban articles
residential with several
areas; authors,the
additionally, a short paragraph
method usedspecifying
quickly, their individual
freely, and
contributions must be provided. Conceptualization, X.Z. and J.H.; Methodology, X.Z.; Software, X.Z. and C.H.;
accurately obtained the relevant residential areas and auxiliary data for evaluation through
Validation, C.W., Y.D. and X.Z.; Data Curation, J.H.; Writing-Original Draft Preparation, X.Z.; Writing-Review &
openX.Z.,
Editing, network data. BasedJ.H.;
Y.D.; Visualization, on Supervision,
the populationC.W.;carrying capacity level
Project Administration, in residential
C.W.; areas and
Funding Acquisition, C.W.
the supply level of service resources, we constructed an indicator system of the
Funding: This research was funded by National Natural Science Foundation of China grant number 41471318.
comprehensive service level in residential areas, and we calculated the reasonableness of the
Conflicts of Interest: The authors declare no conflict of interest.
service facilities in each district by the entropy weight method. The conclusions are as
follows: (1) Internet open data provide new verification data for service facilities rationality
research at the micro scale, which has practical value for the evaluation of urban detailed
planning and design. (2) It is found that the overall service resource supply level in the
experimental area is higher in the northwest and lower in the southeast, and the communities
with high and low levels show a robust spatial agglomeration phenomenon. The distribution
of services in five major types also shows noticeable spatial agglomeration. This conclusion
can help the government understand regional dominance; additionally, the populationSustainability 2019, 11, 1337 15 of 19
Appendix A
Table A1. Table of calculation results for each index in the experimental area.
Residential Area Education Employment Leisure Life Medicine Travel Population Building Completion
ID VASFC−RA VPDC−RA VSARSF−RA Floors
Name Services Services Services Services Services Services Count Area Year
1 LiRen Garden#2 0 0.680 0 22 1249 33 803 26 26 1976 43761 2012 18
2 LiRen Garden#1 0.276 0.994 0.278 26 1411 35 1008 34 39 2888 365801 2010 18
3 FuRunHuaYuan#1 0.559 0.857 0.652 27 1521 44 1170 41 59 2488 90012 2012 12
4 FuAnHuaYuan #B 0.614 1.000 0.614 29 1528 42 1314 43 60 2904 105389 2012 12
5 FuAnHuaYuan #A 0.606 0.733 0.827 30 1508 44 1290 40 57 2128 71925 2012 12
6 HuaHuiYuan#3 0.81 0.782 1.035 31 1603 45 1392 44 100 2272 110903 2008 6
7 HuaHuiYuan 0.985 0.733 1.344 34 1608 48 1441 49 125 2129 145609 2008 6
8 ZhangSheYuan#1 0.704 0.664 1.060 29 1554 44 1362 44 80 1928 69740 2012 12
9 FuRunHuaYuan#3 0.501 0.328 1.528 26 1501 40 1273 40 57 952 43069 2012 12
10 FuRunHuaYuan#2 0.514 0.672 0.765 26 1506 40 1289 41 57 1952 31860 2012 18
11 HuaHuiYuan#2 0.83 0.433 1.919 33 1642 45 1311 42 103 1256 85329 2008 6
12 HuiJingYuan 0.917 0.342 2.684 34 1569 45 1424 49 117 992 40908 2009 6
13 HuaHuiXinCun 0.834 0.303 2.752 33 1572 45 1367 46 99 880 51238 2005 5
14 Versailles Estate 0.622 0.129 4.804 26 1529 42 1357 43 81 376 12711 2010 3
Note: The building average floors were obtained by field survey; the building area was obtained by multiplying the floors and the base map of the building based on the remote image
from Tianditu; the completion year was obtained from the real estate agent, and the website address is https://wuxi.anjuke.com/sale/hudaizhen/.Sustainability
Sustainability2019, 10, x11,
2019, FOR PEER REVIEW
1337 18 of 21 16 of 19
FigureA1.
Figure A1. The
The spatial
spatialdistribution
distributionof of
results.
results.Sustainability 2019, 11, 1337 17 of 19
Sustainability 2019, 10, x FOR PEER REVIEW 19 of 21
Figure A2.Bar
FigureA2. Bar charts
charts ofofthe
the result.
result.Sustainability 2019, 11, 1337 18 of 19
References
1. Frey, N. Equity in the distribution of urban environmental amenities: The case of Washington, DC. Urban
Geogr. 2017, 38, 1534–1549. [CrossRef]
2. Reddy, A.; Leslie, T.F. Volume per capita as a useful measure of residential space. Urban Geogr.
2015, 36, 1099–1112. [CrossRef]
3. Ye, L.; Cheng, Z.; Wang, Q.; Lin, H.; Lin, C.; Liu, B. Developments of green building standards in China.
Renew. Energy 2015, 73, 115–122. [CrossRef]
4. Michalos, A.C.; Zumbo, B.D. Public services and the quality of life. Soc. Indic. Res. 1999, 48, 125–157.
[CrossRef]
5. Talen, E. Visualizing fairness: Equity maps for planners. J. Am. Plan. Assoc. 1998, 64, 22–38. [CrossRef]
6. Yang, X.J. China’s rapid urbanization. Science 2013, 342, 310. [CrossRef] [PubMed]
7. Zhengna, S.; Wen, C.; Guixiang, Z.; Lei, Z. Spatial accessibility to public service facilities and its measurement
approaches. Prog. Geogr. 2010, 29, 1217–1224.
8. Polo, G.; Acosta, C.M.; Ferreira, F.; Dias, R.A. Location-allocation and accessibility models for improving the
spatial planning of public health services. PLoS ONE 2015, 10, e0119190. [CrossRef] [PubMed]
9. Páez, A.; Scott, D.M.; Morency, C. Measuring accessibility: Positive and normative implementations of
various accessibility indicators. J. Transp. Geogr. 2012, 25, 141–153. [CrossRef]
10. Wang, F. Measurement, optimization, and impact of health care accessibility: A methodological review. Ann.
Am. Assoc. Geogr. 2012, 102, 1104–1112. [CrossRef] [PubMed]
11. Wolch, J.R.; Byrne, J.; Newell, J.P. Urban green space, public health, and environmental justice: The challenge
of making cities ‘just green enough’. Landsc. Urban Plan. 2014, 125, 234–244. [CrossRef]
12. Widener, M.J.; Farber, S.; Neutens, T.; Horner, M. Spatiotemporal accessibility to supermarkets using public
transit: An interaction potential approach in Cincinnati, Ohio. J. Transp. Geogr. 2015, 42, 72–83. [CrossRef]
13. Lee, J.; Miller, H.J. Measuring the impacts of new public transit services on space-time accessibility: An analysis
of transit system redesign and new bus rapid transit in Columbus, Ohio, USA. Appl. Geogr. 2018, 93, 47–63.
[CrossRef]
14. Zhao, M.; Xu, G.; Li, Y. Evaluating urban public facilities of Shenzhen by application of open source data.
Geo-Spat. Inf. Sci. 2016, 19, 129–139. [CrossRef]
15. Neutens, T. Accessibility, equity, and health care: Review and research directions for transport geographers.
J. Transp. Geogr. 2015, 43, 14–27. [CrossRef]
16. García-Albertos, P.; Picornell, M.; Salas-Olmedo, M.H.; Gutiérrez, J. Exploring the potential of mobile phone
records and online route planners for dynamic accessibility analysis. Transp. Res. Part A Policy Pract. 2018.
[CrossRef]
17. Xia, N.; Cheng, L.; Chen, S.; Wei, X.; Zong, W.; Li, M. Accessibility based on Gravity-Radiation model and
Google Maps API: A case study in Australia. J. Transp. Geogr. 2018, 72, 178–190. [CrossRef]
18. Kitchin, R. The real-time city? Big data and smart urbanism. GeoJournal 2014, 79, 1–14. [CrossRef]
19. Geurs, K.T.; De Montis, A.; Reggiani, A. Recent advances and applications in accessibility modeling. Comput.
Environ. Urban Syst. 2015, 49, 82–85. [CrossRef]
20. Li, M.; Kwan, M.-P.; Wang, F.; Wang, J. Using points-of-interest data to estimate commuting patterns in
central Shanghai, China. J. Transp. Geogr. 2018, 72, 201–210. [CrossRef]
21. Jiang, B.; Liu, X. Computing the fewest-turn map directions based on the connectivity of natural roads. Int. J.
Geogr. Inf. Sci. 2011, 25, 1069–1082. [CrossRef]
22. Zhou, X.; Kim, J. Social disparities in tree canopy and park accessibility: A case study of six cities in Illinois
using GIS and remote sensing. Urban For. Urban Green. 2013, 12, 88–97. [CrossRef]
23. Kolcsar, R.A.; Szilassi, P. Assessing accessibility of urban green spaces based on isochrone maps and street
resolution population data through the example of Zalaegerszeg, Hungary. Carpath. J. Earth Environ. Sci.
2018, 13, 31–36.
24. Liu, X.; Long, Y. Automated identification and characterization of parcels with OpenStreetMap and points of
interest. Environ. Plan. B Plan. Des. 2016, 43, 341–360. [CrossRef]
25. Zhao, W.; Li, Q.; Li, B. Extracting hierarchical landmarks from urban POI data. Yaogan Xuebao J. Remote Sens.
2011, 15, 973–988.You can also read


