D3.2 - Data and Report Analysis and Processing - FARO
←
→
Page content transcription
If your browser does not render page correctly, please read the page content below
Ref. Ares(2021)796768 - 31/01/2021
                                                  EXPLORATORY RESEARCH

D3.2 – Data and Report
Analysis and Processing
Deliverable ID:           D3.2
Dissemination Level:      PU
Project Acronym:          FARO
Grant:                    892542
Call:                     H2020-SESAR-2019-2
Topic:                    Safety and Resilience
Consortium Coordinator:   CRIDA
Edition date:             27 January 2021
Edition:                  00.01.00
Template Edition:         02.00.02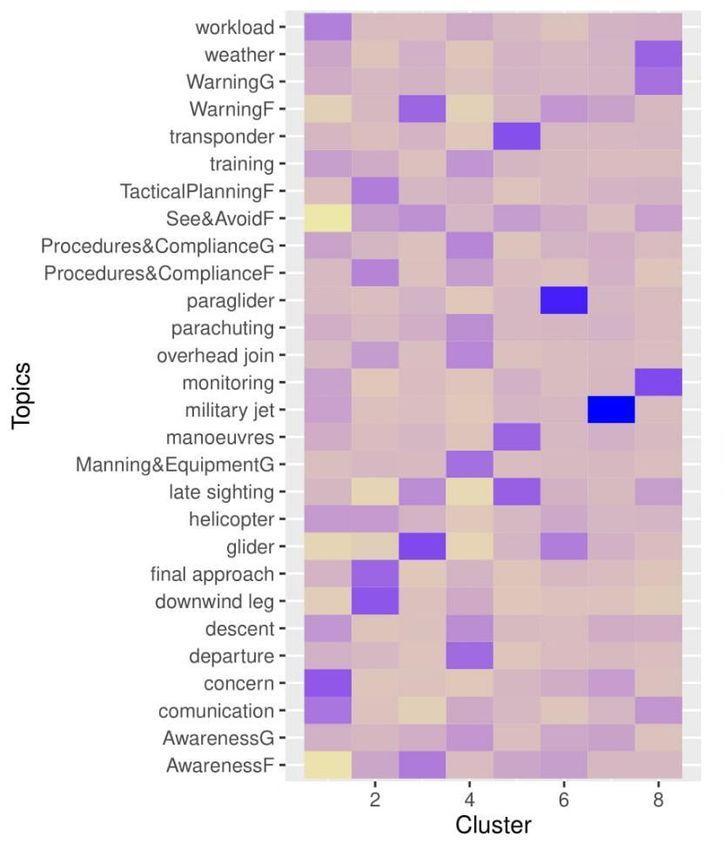
D3.2 – DATA AND REPORT ANALYSIS AND PROCESSING

Authoring & Approval

Authors of the document
Name/Beneficiary                    Position/Title                               Date
Irene BUSELLI / ZENABYTE            Project Contributor                          22/01/2021
Carlo DAMBRA / ZENABYTE             WP3 Lead                                     22/01/2021
Luca ONETO / ZENABYTE               Project Contributor                          22/01/2021

Reviewers internal to the project
Name/Beneficiary                    Position/Title                               Date
Christian VERDONK/ CRIDA            Project Coordinator                          27/01/2021
Fernando GÓMEZ / UPM                WP4 Lead                                     27/01/2021
Anthony SMOKER/ LU                  WP5 Lead                                     27/01/2021
Fedja NETJASOV/ UB-FTTE             WP6 Lead                                     27/01/2021
Patricia RUIZ/ ENAIRE               Project Contributor                          27/01/2021

Approved for submission to the SJU By - Representatives of beneficiaries involved in the project
Name/Beneficiary                    Position/Title                               Date
Christian VERDONK/ CRIDA            Project Coordinator                          29/01/2021
Icíar GARCÍA-OVIES/ CRIDA           WP2 Lead
Fernando GÓMEZ / UPM                WP4 Lead                                     27/01/2021
Anthony SMOKER/ LU                  WP5 Lead
Fedja NETJASOV/ UB-FTTE             WP6 Lead                                     27/01/2021
Tamara PEJOVIC/ ECTL                Project Contributor
Patricia RUIZ/ ENAIRE               Project Contributor

Rejected By - Representatives of beneficiaries involved in the project
Name/Beneficiary                    Position/Title                               Date

Document History
Edition            Date              Status               Author                   Justification
00.00.01           24/11/2020        CREATED              Irene Buselli, Carlo     TEMPLATE WITH TOC
                                                          Dambra, Luca Oneto
00.00.02           19/01/2021        DRAFT                Irene Buselli, Carlo     Completed the UK
                                                          Dambra, Luca Oneto       scenario

                                                                                                       2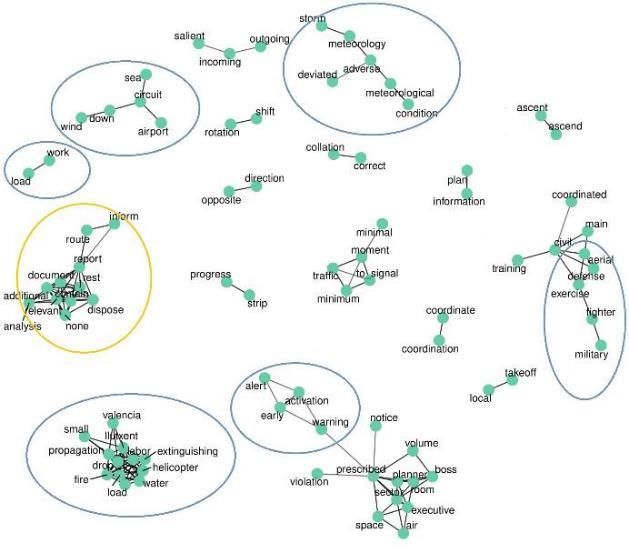
D3.2 – DATA AND REPORT ANALYSIS AND PROCESSING

00.00.03          22/01/2021         Review version        Irene Buselli, Carlo    Final draft completed
                                                           Dambra, Luca Oneto
00.01.00          27/01/2021         Final version ready to Irene Buselli, Carlo   All the reviews’
                                     be submitted           Dambra, Luca Oneto     comments included

Copyright Statement
© – 2021– FARO Consortium. All rights reserved. Licensed to the SESAR Joint Undertaking
under conditions

                                                                                                           3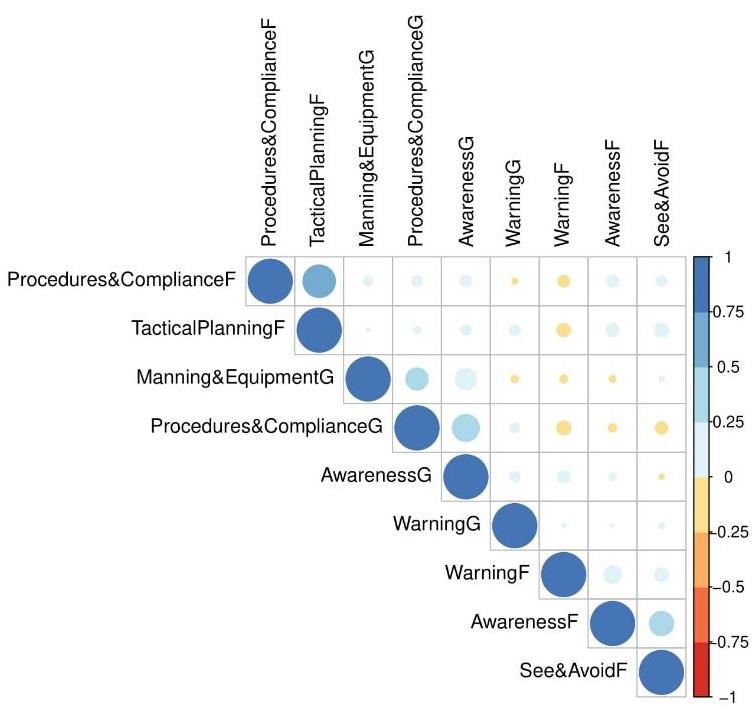
D3.2 – DATA AND REPORT ANALYSIS AND PROCESSING

FARO
SAFETY AND RESILIENCE GUIDELINES FOR AVIATION

This deliverable is part of a project that has received funding from the SESAR Joint Undertaking under
grant agreement No 892542 under European Union’s Horizon 2020 research and innovation
programme.

Abstract

Deliverable “D3.2: Data and Report Analysis and Processing” is framed within WP3 of FARO project,
and it covers the activities contained in the homonymous task T3.2. The objective of this task is to
identify and apply suitable data-driven techniques able to gain useful insight from safety reports and
contextual data. In particular, this document reports the main results obtained from the application of
different statistical, Natural-Language-Processing, and Machine-Learning tools to public Airprox
reports from both Spanish and UK airspace, other than some ancillary data sources. This mixture of
free-text and structured data from the two scenarios was thoroughly explored, and the promising
results show that it is possible to develop data and visual analytics solutions able to extract information
and generate knowledge in the safety and resilience scope. The outcome of these analyses will be
further investigated during the activities of T3.3, by interacting also with safety experts in WP4 and
resilience experts in WP5.

Additionally, this document includes a detailed list of the main data requirements emerged during the
work on the task - not only in the interest of the current project but also for future developments in
this scope.

                                                                                                              4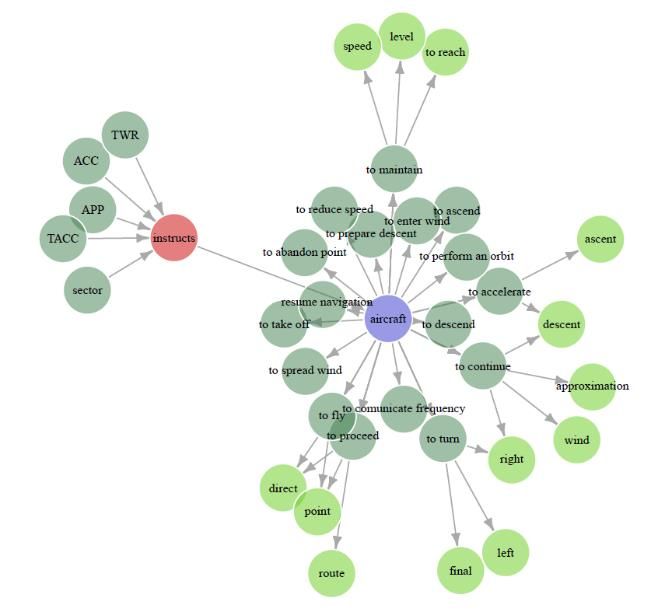
D3.2 – DATA AND REPORT ANALYSIS AND PROCESSING

Table of Contents

    Abstract ................................................................................................................................... 4
1      Introduction ............................................................................................................... 8
    1.1       Purpose of the document............................................................................................... 8
    1.2       Document Structure ...................................................................................................... 8
    1.3       Acronyms and Terminology ........................................................................................... 8
2      Available Data and Reports ...................................................................................... 10
    2.1       Overview ..................................................................................................................... 10
    2.2       Spanish Airspace.......................................................................................................... 12
    2.3       UK Airspace ................................................................................................................. 14
3      Exploratory Analysis................................................................................................. 17
    3.1       Spanish Airspace.......................................................................................................... 17
    3.2       UK Airspace ................................................................................................................. 21
4      Natural Language Processing and Machine Learning ................................................ 30
    4.1       Spanish Airspace.......................................................................................................... 30
    4.2       UK Airspace ................................................................................................................. 39
5      Data guidelines ........................................................................................................ 47
6      Conclusions .............................................................................................................. 50
7      References ............................................................................................................... 51

List of Tables
Table 2: Safety Barriers Legend ............................................................................................................. 22

Table 3: Topics description .................................................................................................................... 30

Table 4: Examples of automatic detection of taxonomy factors .......................................................... 38

Table 5: Topic words and labels ............................................................................................................ 40

List of Figures
Figure 1: Available data ......................................................................................................................... 10

Figure 2: Distribution of CEANITA reports in time ................................................................................ 12

Figure 3: Location and separation score of CEANITA reports ............................................................... 12

Figure 4: Distribution of ICAO risk categories in CEANITA reports ....................................................... 13

                                                                                                                                                        5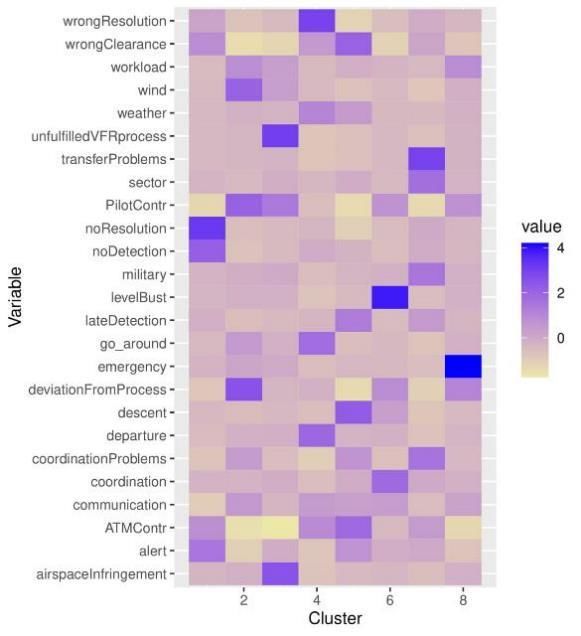
D3.2 – DATA AND REPORT ANALYSIS AND PROCESSING

Figure 5: Distribution of 3D separation in data ..................................................................................... 14

Figure 6: Distribution of UK incidents in time ....................................................................................... 15

Figure 7: Distribution of UK incidents in months .................................................................................. 15

Figure 8: Location and severity of UK incidents .................................................................................... 16

Figure 9: Distribution of ICAO risk categories in UKAB reports............................................................. 16

Figure 10: Flight Type frequency ........................................................................................................... 17

Figure 11: Frequency of most frequent conclusions ............................................................................. 18

Figure 12: Average separation score per conclusion ............................................................................ 18

Figure 13: Correlations between conclusions ....................................................................................... 18

Figure 14: Pilot contribution ................................................................................................................. 19

Figure 15: ATM contribution ................................................................................................................. 19

Figure 16: Contribution and severity score ........................................................................................... 19

Figure 17: Contribution and altitude of the incident ............................................................................ 20

Figure 18: Contribution and airspace class ........................................................................................... 20

Figure 19: Flight Type distribution in UK incidents ............................................................................... 21

Figure 20: Frequency of each key factor ............................................................................................... 23

Figure 21: Average severity per key factor (A=2, C=0) .......................................................................... 23

Figure 22: Correlation between the key factors ................................................................................... 24

Figure 23: Distribution of contribution ................................................................................................. 25

Figure 24: Risk perceived by the pilot VS actual ICAO risk category ..................................................... 26

Figure 25: Frequency of the main meteorological phenomena............................................................ 26

Figure 26: Frequency of wind directions ............................................................................................... 27

Figure 27: Histogram of incidents in time (drones, balloons, unknown objects) ................................. 27

Figure 28: Distribution of incidents in space (drones, balloons, unknown objects) ............................. 27

Figure 29: Type of objects ..................................................................................................................... 28

Figure 30: Risk categories ...................................................................................................................... 28

Figure 31: Contributing factors frequency ............................................................................................ 28

Figure 32: Text network visualisation ................................................................................................... 29

                                                                                                                                                       6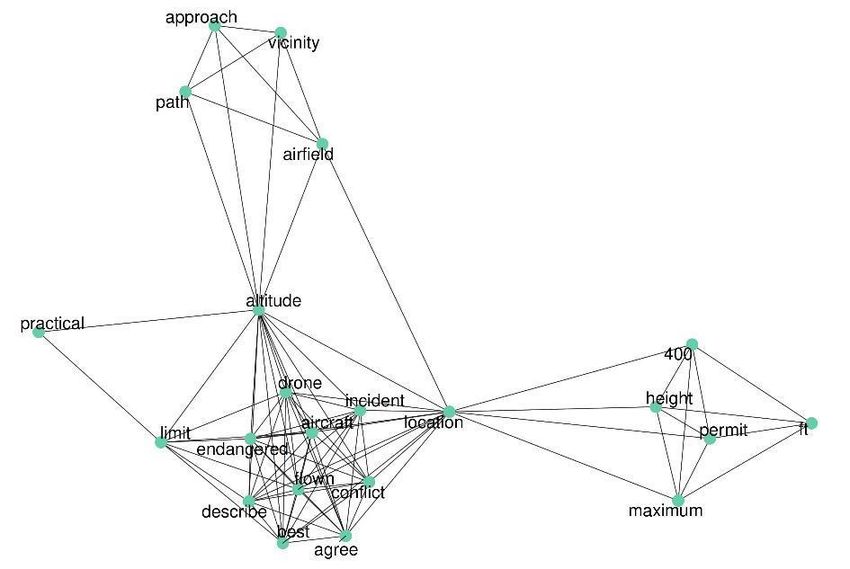
D3.2 – DATA AND REPORT ANALYSIS AND PROCESSING

Figure 33: Example of word cloud for Topics visualisation ................................................................... 31

Figure 34: Topics average prevalence ................................................................................................... 31

Figure 35: Prevalence of topics in terms of number of reports ............................................................ 32

Figure 36: Text Network ........................................................................................................................ 32

Figure 37: Cluster Dendrogram ............................................................................................................. 33

Figure 38: Heatmap of clusters ............................................................................................................. 34

Figure 39: Example of syntactic analysis tool ........................................................................................ 35

Figure 40: Example of syntactic analysis on sentences with "instructs"............................................... 36

Figure 41: Example of syntactic analysis on sentences with "authorised" ........................................... 36

Figure 42: Example of syntactic analysis with noun “load” .................................................................. 37

Figure 43: Example of retracing of sentences with "without" .............................................................. 37

Figure 44: Decision tree......................................................................................................................... 39

Figure 45: Topic average prevalence..................................................................................................... 41

Figure 46: Topic prevalence in terms of number of reports ................................................................. 41

Figure 47: Text Network visualisation of UKAB reports ........................................................................ 42

Figure 48: Clustering dendrogram of UK reports .................................................................................. 43

Figure 49: Heatmap of clusters ............................................................................................................. 44

Figure 50: Prevalence of taxonomy factors in a report......................................................................... 45

Figure 51: Average prevalence of factors in UKAB reports ................................................................... 45

Figure 52: ID connection between free-text and structured data ........................................................ 48

Figure 53: Scanned text (Spain) VS digital text (UK).............................................................................. 48

Figure 54: Evolution of assessment guidelines (UK) ............................................................................. 48

Figure 55: Example of table in CEANITA reports (Spain) ....................................................................... 49

                                                                                                                                                       7
D3.2 – DATA AND REPORT ANALYSIS AND PROCESSING

1 Introduction
1.1 Purpose of the document
Work package 3 (WP3) addresses FARO Data Transformation and Loading, which is basic for the
smooth running of WP4, WP5 and WP6.

Within this WP, Task 3.2 (T3.2), addresses the application of data analytics, Natural Language
Processing (NLP) and Machine Learning (ML) to safety reports and shows what kind of information is
possible to extract and how it can be used to generate potential safety indicators and dimensions [1].
Data used in this task have been treated according to the procedures described in [2].

Deliverable D3.2 reports on the results of the Task 3.2.

1.2 Document Structure
This document is structured as follows:
      •   Section 1 introduces the purpose of this document.
      •   Section 2 describes the available data sources.
      •   Section 3 explores safety reports using data-analytics techniques.
      •   Section 4 reports the results of the application of Natural Language Processing (NLP) and
          Machine Learning (ML).
      •   Section 5 assesses some guidelines and recommendations about data sources.
      •   Finally, Section 6 summarises the main conclusions.

1.3 Acronyms and Terminology
 Term                     Definition
 ATC                      Air Traffic Control
 ATM                      Air Traffic Management
 ATM                      Air Traffic Management
 CEANITA                  Comisión de Estudio y Análisis de Notificaciones de Incidentes de Tránsito
                          Aéreo / Commission for Study and Analysis of Notifications of Incidents of
                          Air Traffic
 CWP                      Controller Working Position
 DWH                      Data Warehouse
 FT                       Feet
 ICAO                     International Civil Aviation Organization
 LDA                      Latent Dirichlet Allocation
 LoS                      Loss of Separation

                                                                                                         8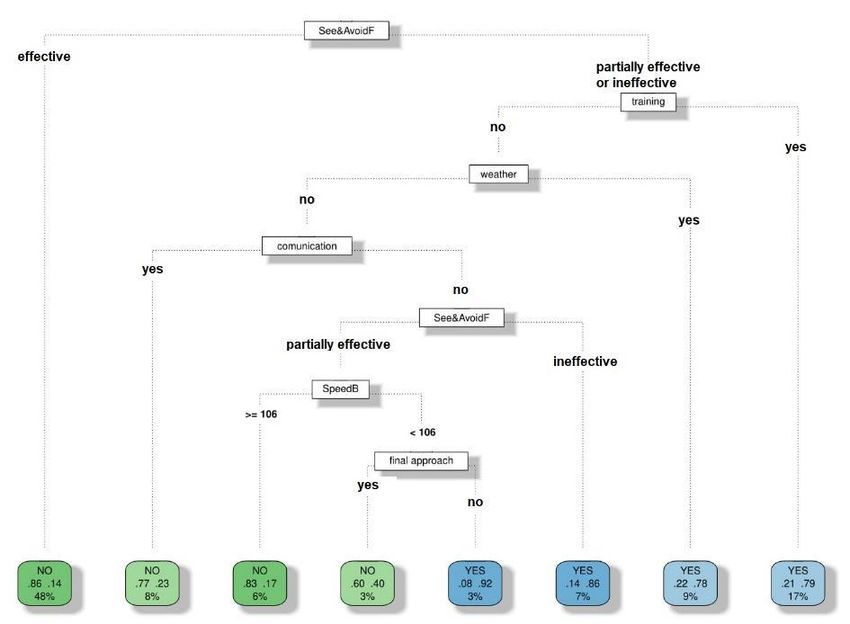
D3.2 – DATA AND REPORT ANALYSIS AND PROCESSING

 Term                     Definition
 ML                       Machine Learning
 NLP                      Natural Language Processing
 NM                       Nautical Miles
 RAT                      Risk Analysis Tool
 STCA                     Short Term Conflict Alert
 TOKAI                    Tool Kit for ATM Occurrence Investigation
 UKAB                     United Kingdom Airprox Board
 VFR                      Visual Flight Rule
 WP                       Work Package

                                                                      9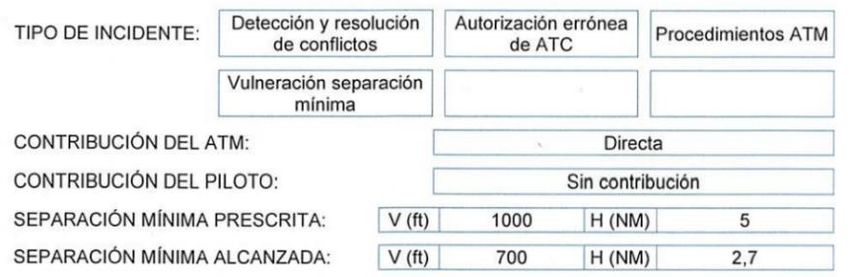
D3.2 – DATA AND REPORT ANALYSIS AND PROCESSING

2 Available Data and Reports
2.1 Overview
Deliverable D3.2 describes the results of the application of data analytics, Natural Language Processing
(NLP) and Machine Learning (ML) to safety reports and contextual data and shows what kind of
information is possible to extract and how it can be used to generate potential safety indicators and
dimensions. NLP and ML have been applied to two different sets of safety reports (Spanish, to exploit
CRIDA/ENAIRE expertise, and UK, since the English language is the most commonly available in NLP
tools):

    •   CEANITA Airprox reports (Spain);
    •   UKAB Airprox reports (UK).

Figure 1 outlines the available data sources and their connections. Structured data are coloured in blue
and free-text ones in yellow.

                                         Figure 1: Available data

    •   CEANITA reports: anonymised incident reports about “Loss of separation” events, from
        January 2018 to July 2019. They are public reports published by the Agencia Estatal de
        Seguridad Aérea (Spanish Safety Aviation Agency) under the commission CEANITA (Comisión
        de Estudio y Análisis de Notificaciones de Incidentes de Tránsito Aéreo – Commission for Study
        and Analysis of Notifications of Incidents of Air Traffic)1.The content of these reports is in
        Spanish, and a detailed example of it can be found in D3.1.

1
 Source: https://www.seguridadaerea.gob.es/es/ambitos/gestion-de-la-seguridad-
operacional/ceanita#Informes%20Definitivos

                                                                                                           10
D3.2 – DATA AND REPORT ANALYSIS AND PROCESSING
• Loss of Separation data: A Loss of Separation describes the interval of time where two aircraft
are below some specific limits of horizontal (NM – Nautical Miles) and vertical (FT – Feet)
separation. For each event the distance at the closest point of approach (with different
metrics) and the separation score are indicated, after the application of the RAT methodology
(Risk of Collision, Separation).
• ATC events data: Interactions of some Air Traffic Controllers with the Controller Working
Position (CWP), related to the aircraft.
• STCA alerts data: Raw STCA (Short Term Conflict Alert) data, per flight, as provided by the
surveillance source. STCA is a ground-based safety net generating timely an alert of a potential
or actual infringement of minimal separation.
• Sector entry data: All the geographical transitions of aircraft from a sector to another one.
• Flights: The invariant information related to each flight.
• Radar tracks: A flown flight track with a frequency of 5 seconds.
A more accurate description of the Spanish data can be found in the D3.1. Only information about the
analysed reports have been considered.
• UKAB Airprox reports: publicly available incident reports about Airprox events stored by UK
Airprox Board2. This source includes all the Airprox reports for UK airspace from 2010 to 2020,
composed by both structured data and free text. The information that can be extracted is very
similar to the one relative to Spanish airspace, except for the absence of the lower-resolution
data (i.e., data relative to all the flights, radar tracks, alerts) present in CRIDA Data Warehouse
(DWH). See Table 1.
Table 1: A summary of an UKAB Airprox Report Example
Variable Example
ID 2019028
Date 15/02/2019
Time 15:25
Latitude 51:07:00 N
Longitude 0:39:00 E
Altitude 1900
Risk Category C
Aircraft Type (1 and 2) VULCAN - P68 / BEECH - 36
2
Source: https://www.airproxboard.org.uk/Reports-and-analysis/Monthly-summaries/Monthly-Airprox-
reviews/.
11D3.2 – DATA AND REPORT ANALYSIS AND PROCESSING
Variable Example
Flight Classification (1 and 2) Non-Commercial Operations - Pleasure
Airspace Class G
Airspace Name London FIR
ATS UK FIS - BASIC SERVICE
Flight Rules (1 and 2) VFR
Separation (V/H) 100ft V/0.1nm H
Weather METAR EGKK 151520Z 15005KT CAVOK 14/05 Q1025
2.2 Spanish Airspace
2.2.1 CEANITA reports
The considered reports are relative to Airprox incidents happened between January 2018 and July
2019, in different operating environments. In the following, a brief overview of their content in terms
of time (Figure 2), space and separation score (Figure 3) is provided.
Figure 2: Distribution of CEANITA reports in time Figure 3: Location and separation score of CEANITA
reports
89 incidents are reported in this period (incidents that may or may not, after investigation, be
considered a breach of separation), involving different operational environments. The temporal
distribution can be seen from the histogram (Figure 2)). It is important to notice that incidents reported
by CEANITA are a subset of the safety-related occurrences, with higher severity incidents being
overrepresented (Section 2.2.2 offers a more detailed characterisation of the subset).
12D3.2 – DATA AND REPORT ANALYSIS AND PROCESSING
From a spatial point of view, reported incidents tend to be quite scattered, as it can be seen from the
map in Figure 3 (which also reports their separation score according to the metric used in CRIDA DWH
data). In Figure 4 the distribution of ICAO levels of severity (or ICAO risk category) is shown, as reported
in the CEANITA reports. In particular, incidents of class D and E are a negligible amount, while the
majority are classified as B.
Figure 4: Distribution of ICAO risk categories in CEANITA reports
As a final observation, as regards airspace class, the vast majority of the considered incidents
happened in classes C and D (about 40% each) and about 10% in class A.
2.2.2 CRIDA DWH
Since the focus of Task 3.2 is mainly on the analysis of reports – and therefore the other data sources
are used as complement to this activity – in this document only some major characteristics of these
data are highlighted. For more information on the data sets please refer to Deliverable D3.1.
Figure 5 shows the distribution of 3D separation (i.e., calculated with the so-called 3D algorithm) in
incidents contained in the entire LoS collection (red) in comparison with the subset described in
CEANITA reports (teal). While in the global case the separation is distributed in an almost Gaussian
fashion which tends to the boundaries to the separation limits, CEANITA reports focus on more
“serious” LoSs, showing in general lower values of this metric, even if minimum and maximum values
coincide in the two groups.
Some further observations on 3D separation should be done:
• This is not the only metric used to determine the distance between the two aircraft; in fact,
other than the 3D algorithm, the value calculated by the Percentage algorithm is reported as
well. However, the two metrics are really similar, so in the following only the 3D value will be
reported.
• The separation value does not have an absolute meaning: the same distance value may or may
not be classified as a loss of separation depending on the separation standards in force.
13D3.2 – DATA AND REPORT ANALYSIS AND PROCESSING
• The correlations between separation, separation score and ICAO category are positive but
not high enough to consider them interchangeable when evaluating the seriousness of the
incident.
Figure 5: Distribution of 3D separation in data
2.3 UK Airspace
2.3.1 UKAB reports
UKAB reports differ from CEANITA ones in a number of respects, but their content is in large part
comparable. The reports considered are relative to Airprox incidents happened between January 2010
and December 2019. In the following, a brief overview of their content in terms of time, space and
severity is provided.
Since 2286 incidents are reported in these 10 years, it is possible to say that the average frequency is
more than 4 incidents a week, in all operating environments. Actually, as can be seen in Figure 6, the
number of analysed incidents has constantly increased during this period: indeed, the number of
reports has almost doubled in these years. Furthermore, the distribution during the year is quite
uneven (Figure 7) and, not surprisingly, in summer the average amount of analysed incidents is
significantly higher than in the other seasons.
14D3.2 – DATA AND REPORT ANALYSIS AND PROCESSING
Figure 6: Distribution of UK incidents in time Figure 7: Distribution of UK incidents in months
Also, from a spatial point of view (Figure 8), the distribution is not homogeneous: by looking at the
map it seems that incidents were more concentrated on the part over London and the South East of
England. Severity, instead, seems more scattered in the map. The general distribution of ICAO levels
of severity (or ICAO risk category) can be seen in Figure 9. In slight contrast with the Spanish
counterpart, the percentage of incidents classified as D or E (risk not determinable or not present) is
not completely negligible (together they represent more than 10% of the total); furthermore, the most
frequent ICAO category is C and not B as in CEANITA reports. However, ICAO categories A and B (which
identify the so-called “risk-bearing” incidents) represent more than one third of the total.3
3
For more information about incident statistics: https://www.airproxboard.org.uk/Reports-and-
analysis/Annual-Airprox-summary-reports/
15D3.2 – DATA AND REPORT ANALYSIS AND PROCESSING
Figure 8: Location and severity of UK incidents
Figure 9: Distribution of ICAO risk categories in UKAB reports
The main significant difference with incidents contained in CEANITA reports, however, is in the
airspace classes: more than 90% of the incidents described in UKAB reports happened in class G.
Furthermore, not surprisingly, flight rules in place during the incidents were mostly VFR.
16D3.2 – DATA AND REPORT ANALYSIS AND PROCESSING
3 Exploratory Analysis
3.1 Spanish Airspace
The aim of the analyses reported in this section is to identify some potential contributing factors (and
therefore contribute to the definition of safety performance indicators) and their relationships with
the different features of the incidents. The exploited variables are mostly derived from the
combination of both features extracted from reports and structured information from CRIDA DWH
relative to the same incidents. In particular, the main results in this context are:
• The statistical significance of the abundance of Flight Training and Military flights in CEANITA
reports with respect to their standard prevalence in air traffic (Figure 10).
• The differences in prevalence and severity of the conclusions reported (Figure 11 and Figure
12), and their correlations (Figure 13).
• The different rate of contribution for pilot and ATM in the incidents (Figure 14 and Figure 15),
and how the different contribution can lead to different outcomes (Figure 16, Figure 17 and
Figure 18).
Figure 10: Flight Type frequency
Figure 10 shows how the distribution of the flight types (General, Military, Non regular, Regular, Other)
is different in CEANITA reports (teal) with respect to the general distribution in flights (red). In
particular, the relative frequency of regular flights (S) is significantly lower in the ones involved in
incidents, while flight classified as X and M are relatively more frequent. This graphical observation is
confirmed by a statistical test: in fact, the Chi-squared test returns a negligible p-value, which means
17D3.2 – DATA AND REPORT ANALYSIS AND PROCESSING
the difference in distributions is statistically significant. It is important to notice that the flights
classified with X in CEANITA reports are for the vast majority Flight Academy flights; so, to sum up, the
prevalence of Military and Flight Academy flights in the reported incidents can be defined significantly
higher than the standard proportion in air traffic.
Figure 11: Frequency of most frequent conclusions Figure 12: Average separation score per conclusion
Figure 13: Correlations between conclusions
As regards the causes of the incident, the ones reported in the graphs are retrieved from the conclusive
paragraph of each CEANITA report. These causes are not mutually exclusive: in fact, Figure 13 shows
how some couples of conclusions are very likely (or unlikely) to appear together. For instance,
• the absence of detection is highly correlated with the absence of resolution,
18D3.2 – DATA AND REPORT ANALYSIS AND PROCESSING
• while a problem of wrong clearance is unlikely to happen together with a deviation from
process.
Looking at how the two colours (blue and yellow, corresponding respectively to positive and negative
values of correlations) form two separate blocks, it is possible to derive that these two groups of causes
roughly correspond to ATM responsibility (e.g., wrong clearance, wrong resolution or coordination
problems) and pilot responsibility (e.g., level bust, deviation from process, airspace infringement).
Figure 14: Pilot contribution Figure 15: ATM contribution
Other than these conclusions, CEANITA reports also include an evaluation of the actual contribution of
both ATM and pilot, classifying them as Direct, Indirect and None. As it can be easily seen from Figure
14 and Figure 15:
• ATM contribution is direct in the great majority of cases, while the incidents with pilot’s direct
contribution are significantly fewer.
• It is also interesting to notice that the percentage of indirect contribution is always minor but
not negligible.
Figure 16: Contribution and severity score
19D3.2 – DATA AND REPORT ANALYSIS AND PROCESSING
Given these considerations derived from the CEANITA reports, one may be tempted to think that ATM
actions are associated to a greater severity; but, by looking at Figure 16 it is possible to observe that,
when the direct contribution is of the ATM only, the separation score tends to be lower. Therefore,
from a pure data analysis perspective, it is possible to state that ATM responsibility is involved in the
majority of CEANITA incidents, but the most severe ones are usually due to pilot contribution.
Figure 17: Contribution and altitude of the incident
Figure 18: Contribution and airspace class
Finally, Figure 17 and Figure 18 show that the contribution is not independent of other variables. In
fact, pilot’s contribution seems to play an important role when incidents are at low altitude (possibly
during take-off or landing operations), while at higher altitudes the responsibility is almost surely of
the ATM (Figure 17). Figure 18 is a mosaic plot: the area of the tiles is proportional to the number of
20D3.2 – DATA AND REPORT ANALYSIS AND PROCESSING
observations within that category and the colours correspond to Standardised Pearson Residuals, i.e.,
a measure of significance of the correlation: blue and red tiles are respectively “too large” or “too
little” to be considered random. It can be observed that:
• The tile containing incidents in class C and with ATM contribution is the largest one, while the
co-occurrence of pilot responsibility and class C is almost negligible.
• In classes G and E (where indeed ATC has no authority) the major contribution is of pilots.
In the end, it is possible to conclude that the extraction of features from the reports – and the
subsequent combination with structured data – highlighted the main causes or major contributing
factors of incidents contained in CEANITA reports. Further analyses of these data-driven conclusions
are left to the expert interpretation of WP4 and WP5.
3.2 UK Airspace
Analogous with the previous section, the objective of the following analyses is to identify the main
contributing factors and their relationships with other features, in a purely statistical way. The
exploited variables are mostly derived through the extraction from UKAB reports. In particular, the
main contents are:
• A quick observation about the flight type distribution (Figure 19).
• The differences in prevalence of the causal factors reported (Figure 20 and Figure 21), and
their correlations (Figure 22).
• The different rate of contribution for pilot and ATM in the incidents (Figure 23), which shows
a completely different situation with respect to the Spanish one.
• A comparison between perceived risk and actual risk (Figure 24).
• An overview of the meteorological situation during the incidents (Figure 25 and Figure 26).
Figure 19: Flight Type distribution in UK incidents
21D3.2 – DATA AND REPORT ANALYSIS AND PROCESSING
A preliminary observation is needed here: contrary to the Spanish case, for UK only data about
incidents could be exploited. As a consequence, no significant comparison with “non-incident”
conditions can be made. For instance, it was not possible to check if the Flight Type distribution in the
reported incidents is statistically different from the norm; however, the high percentage (Figure 19) of
military and training flights involved in incidents may suggest that, as for the Spanish airspace, these
kinds of traffic tend to be involved in incidents more easily.
Considering the assessment of contributing factors, UKAB reports are an accurate source of
information: at least in the most recent years, each report contains a conclusive section about “Safety
Barrier Assessment”. The factors considered in this analysis can be seen in Table 2, together with the
abbreviations used in the following graphs. Please be aware that since this assessment methodology
has evolved during the past years, the only way to aggregate this information in a meaningful and
coherent way is to consider just reports from 2017 on, so the results about key factors and contribution
are only relative to 2017-2019 incidents.
Barrier Abbreviation
Regulations, Processes, Procedures&ComplianceG
Procedures and Compliance
Manning & Equipment Manning&EquipmentG
GROUND ELEMENTS Situational Awareness of the AwarenessG
Confliction & Action
Electronic Warning System WarningG
Operation and Compliance
Regulations, Processes, Procedures&ComplianceF
Procedures and Compliance
Tactical Planning and Execution TacticalPlanningF
FLIGHT ELEMENTS Situational Awareness of the AwarenessF
Conflicting Aircraft & Action
Electronic Warning System WarningF
Operation and Compliance
See & Avoid See&AvoidF
Table 2: Safety Barriers Legend
In the considered reports, each of these key factors is evaluated as effective, partially effective or
ineffective. In Figure 20 the frequency of non-effectiveness of each contributing factor is represented,
with different colours accordingly to the level of criticality. In particular, it is interesting to notice that
the frequency of flight elements is disproportionately higher than the one of ground elements. In
particular, the situational awareness seems to be the most critical problem, or at least the most often
mentioned factor when listing the “ineffective” ones. Also the ability to “see and avoid” and “tactical
planning and execution” are in the top three of the factors defined as problematic.
22D3.2 – DATA AND REPORT ANALYSIS AND PROCESSING
Figure 20: Frequency of each key factor
Figure 21: Average severity per key factor (A=2, C=0)
The difference in frequency, however, does not completely overlap with the difference in average
severity. Figure 21 shows the average severity of an incident given that a particular factor is non-
effective; the numerical severity is computed posing risk category C equal to 0 and A equal to 2,
excluding classes D and E from the computation. A first observation is that the difference between
these values is not particularly large (for instance if compared with Figure 12 which shows the Spanish
equivalent). Nevertheless, the most evident observation however is the discrepancy in ranking
between this graph and the frequency one: for instance, problems with electronic warning system at
ground level are the least common but the most critical in terms of average severity; on the contrary,
the loss of situational awareness is the most frequent problem but its impact on safety is just in the
middle of the ranking.
23D3.2 – DATA AND REPORT ANALYSIS AND PROCESSING
Figure 22: Correlation between the key factors
The way factors correlate with each other, instead, is not particularly surprising: flight elements are in
general positively correlated within themselves and negatively correlated with ground elements,
which in turn are positively correlated with each other. This is not completely systematic though: for
instance, “WarningF” is negatively correlated with “Procedures&ComplianceF” and
“TacticalPlanningF”, and slightly positively correlated with ATM situational awareness. Indeed, as
shown in Figure 23, it is quite common (more than 30% of times) that contributing factors are both
ground and flight elements. However, in the majority of incidents (more than 60%) the highlighted
contributing factors are identified as flight elements. The difference with the Spanish situation is
remarkable; nonetheless, this is in line with the different proportion of airspaces classes: most UK
incidents are reported to happen in class G, where the responsible of the separation among aircraft
are the pilots. As a last remark on this, contrary to the Spanish scenario, further analyses on the
different outcomes generated by different contribution did not lead to significant results.
24D3.2 – DATA AND REPORT ANALYSIS AND PROCESSING
Figure 23: Distribution of contribution
The last observation about human factors and, in particular, about human biases, regards the
discrepancy between the risk of collision perceived by the pilot and the actual risk. Figure 24 shows
how the perceived risk is often really different from the one defined by the risk category (please be
aware that the size of the cells on both sides of the chart is just due to their proportion in the reports):
• “High” risk is associated just in a minor part to category A, while about half of the times the
incident ends up being classified as C or even E (i.e., no risk at all).
• “Medium” risk is associated largely with C and E, which again are not risk-bearing incidents.
• “Very high”, “Low” and “None” seem more coherent with the final classification, even if not
completely.
In general, the tendency suggests that pilots tend to overestimate risk most of the times. Potential
factors that might be behind the difference are:
• First, pilot estimation of risk is often a judgement formed “in the heat” of the action, when
their own safety might be at risk.
• Second, they are often unaware of surrounding factors that might result in a lowered risk
score, such as ATC giving adequate evasive instructions to the other aircraft involved.
25D3.2 – DATA AND REPORT ANALYSIS AND PROCESSING
Figure 24: Risk perceived by the pilot VS actual ICAO risk category
The last part of this section is a brief overview about the meteorological conditions reported during
the incidents. Indeed, contrary to CEANITA reports, in the UKAB ones, weather is reported both when
a particular phenomenon is in place and when no significant phenomenon is observed. As a result, it
is possible to state that more than 95% of the considered incidents (Figure 25) happened in the absence
of significant meteorological phenomena. As regards wind direction (Figure 26), the most frequent
ones are W and SW, which is in line with the standard conditions in UK: again, this suggests
atmospheric conditions do not play a major role in incidents.
Figure 25: Frequency of the main meteorological phenomena
26D3.2 – DATA AND REPORT ANALYSIS AND PROCESSING
Figure 26: Frequency of wind directions
3.2.1 Airprox with drones, balloons and unknown objects
Airprox reported by UKAB include a non-negligible percentage of problems with drones, balloons and
unknown objects.
Figure 27: Histogram of incidents in time Figure 28: Distribution of incidents in space (drones,
(drones, balloons, unknown objects) balloons, unknown objects)
A first overview of the data about this kind of incidents reveals that the trend in time and space is
similar to other kinds of Airprox (Figure 27and Figure 28): peaks are in summer and near London and
the South East of England.
27D3.2 – DATA AND REPORT ANALYSIS AND PROCESSING
The most frequently involved objects are drones, while balloons represent only about 4% (Figure 29).
Looking at risk categories (Figure 30), the situation is partially different from standard incidents: the
distribution is almost one third for each category A, B and C, while D and E are a negligible percentage.
Figure 29: Type of objects Figure 30: Risk categories
Reports about these incidents are shorter and less detailed than the other Airprox reports, but there
are some interesting contents:
• A schematic part describing the main contributing factors (Figure 31), which suggests that lack
of situational awareness and deviations from procedures are the most common causes.
• A free-text part describing the incident, which is summarised here with the text network in
Figure 32. It is interesting to note that the core of the network (bottom left), which form the
very common sentence “the incident is best described as the drone has flown in conflict with
the aircraft” has two main “branches”: one points out the vicinity to an airfield approach path,
the other one is about the infringement of height limit of 400 ft.
Figure 31: Contributing factors frequency
28D3.2 – DATA AND REPORT ANALYSIS AND PROCESSING
Figure 32: Text network visualisation
29D3.2 – DATA AND REPORT ANALYSIS AND PROCESSING
4 Natural Language Processing and Machine
Learning
4.1 Spanish Airspace
4.1.1 Unsupervised
4.1.1.1 Topic Modelling
Topic Modelling is an NLP unsupervised-learning text analysis technique which enables the discovery
of the main themes that pervade a collection of textual data. Thanks to this technique, a text collection
can be organized according to the discovered themes and its information can be therefore made
quantitative, since the probability of finding a topic (or prevalence) can be associated to every report,
becoming a numerical feature describing the document. The technique applied here is Latent Dirichlet
Allocation (LDA), which is one of the most used in literature ( [3] [4]).
In particular, the application of LDA lead to the identification of 12 main topics which aviation experts
from CRIDA considered significant and coherent. The words or bigrams describing these topics are
reported in Table 3.
WORDS/BIGRAMS LABEL
helicopter drop water fires extinguishing coordination drop area emergency / fire
load work high alone workload instructions previous tactical workload
aircraft to take off departure / initial
departure to take off runway rate they are
climb aircraft climb
wind tail down-wind leg wind leg right tail runway wind / traffic circuit
adverse meteorologic
weather adverse detours due to weather thunderstorm weather
weather conditions
aircraft
runway go around go around to take off to land go around
established
sector frequency
sectors high coordination transfer limit sector operations
aircraft sector
communication /
answer received finally decided they saw communication visual contact
traffic information
course aircraft to descent sector to aircraft to
clearance rate descent
descent descend rate descend maintain
to confirm maintaining
received coordinating confirming sector informs receipt coordination
receipt formation
activation
alert early early alert activation function alert function alert
function
military military
military formation defence air defence main centre military
formation aircraft
Table 3: Topics description
30D3.2 – DATA AND REPORT ANALYSIS AND PROCESSING
Figure 33: Example of word cloud for Topics visualisation
For a more clear and intuitive representation, topics can also be visualised via word clouds, as in 33.
Topic modelling allows to obtain a sort of higher-resolution insight with respect to simple exploratory
analysis: in fact, while in Section 3.1 just the major conceptual problems are identified (e.g., wrong
clearance, airspace infringement etc.) now some underlying factors can be pointed out (e.g., it can be
discovered that the ATM error was due to excessive workload or to an emergency situation). In Section
4.1.1.3 the relationships between topics and main causes are analysed by applying a clustering
technique. Further investigations about relationships between topics and previously identified
variables will be considered in T3.3.
In Figure 34 the average prevalence of each topic (i.e., how prevalent it is inside each report) is shown;
this value is interesting in terms of “relative” comparison (i.e., the fact that top topics are relative to
communication, alerts, wind and workload), but to have an idea of how frequent each topic is, we have
to look at Figure 35.
Figure 34: Topics average prevalence
31D3.2 – DATA AND REPORT ANALYSIS AND PROCESSING
Figure 35: Prevalence of topics in terms of number of reports
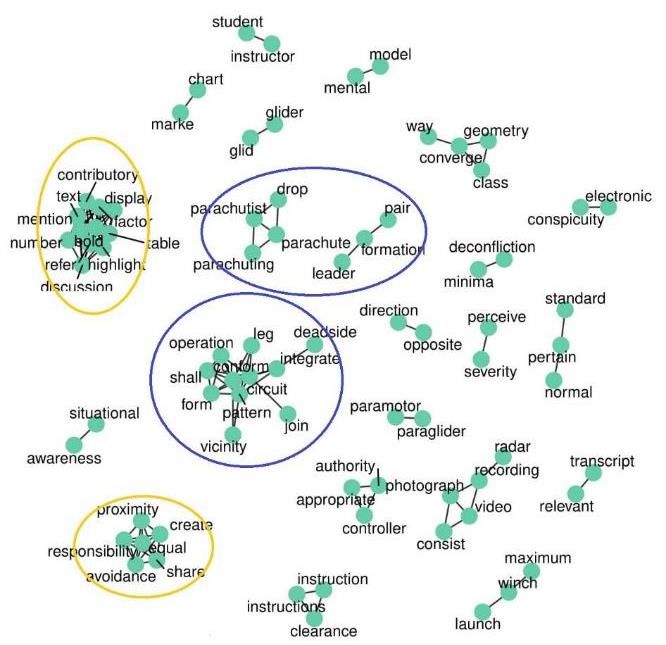
4.1.1.2 Text Networks
The second unsupervised technique applied to the free-text reports is Text Network Visualisation [4]
[5] . The result (which can be seen in Figure 36) gives an insight which is partially overlapped with the
one produced by Topic Modelling, but not completely. Indeed, other than identifying correlated groups
of words, similarly to LDA, it also outlines some bigrams or trigrams which are naturally connected in
the report language, giving some hints on the fixed formulas which are often used in the text. In the
picture, the groups of words circled in blue are the ones similar to LDA topics.
Figure 36: Text Network
Some examples of information retrieved from the network are:
32D3.2 – DATA AND REPORT ANALYSIS AND PROCESSING
• A group of correlated words like helicopter, fire, extinguishing, water etc., which interestingly
are connected to Llutxent (Valencia), where a serious fire caused severe problems in summer
2018.
• A group of words like defence, military etc.
• A group of words like alert, warning, activation etc.
• A group of words describing aerodrome traffic circuit (downwind, circuit, airport).
• A group of words (circled in yellow) which form sentences like “the rest of the documents do
not contain other relevant information for the analysis”.
• Some potentially interesting bigrams, to be further analysed by safety and resilience experts:
rotation-shifts, early-alert, progress-strip, workload, opposite-direction etc.
It is important to consider that these are not the most frequent groups of words, but just the most
relatively correlated ones, which is a different kind of information. In general, this approach does not
add much information to the one presented in the previous sections.
4.1.1.3 Similarity Clustering
The last unsupervised technique is the Clustering one. In particular, hierarchical clustering with Ward
distance is applied on a dataset where the reports are described in terms of topic probabilities,
contribution (ATM vs Pilot) and presence of the main conclusions (Section 3.1). The dendrogram
(Figure 37) allows us to identify 8 possible clusters, of different sizes, which group the reports and,
therefore, the exploited variables, according to the heatmap in Figure 38.
Figure 37: Cluster Dendrogram
33D3.2 – DATA AND REPORT ANALYSIS AND PROCESSING
Figure 38: Heatmap of clusters
As it is possible to observe from the heatmap, which reports normalized values of the relative
frequency of the features, the eight clusters are quite different. In detail:
• Two very small subgroups (clusters 6 and 8) are identified as particularly different from the
norm: cluster 8 is composed of incidents where the main topic is “emergency” (indeed, they
are the reports referred to Llutxent fire in summer 2018); cluster 6 instead contains the three
incidents caused by level bust (and quite expectedly, according to the heatmap, the main
contribution was of the pilot and the other main conclusion was “deviation from process”).
• The largest group (cluster 5) is mainly composed of wrong-clearance and late-detection
incidents, with clearly the highest frequency of ATM contribution and an interesting high
prevalence of “descent” topic.
• Cluster 4 contains incidents mainly caused by “wrong resolution” by ATM, with high
prevalence of topics related to go around, departure and weather.
• Cluster 7 is composed of incident caused essentially by transfer problems or coordination
problems; the most frequent topics are “sector” and “military”.
• Incidents in cluster 3 are essentially due to pilots’ errors, in particular to airspace infringement
and unfulfillment of VFR process.
• Cluster 2 is characterised by incidents due to pilots’ deviations from process, especially in the
landing phase (topic wind/traffic circuit).
• Cluster 1 is composed of incidents due to ATM’s inability to both detect and resolve, with
interesting high values of “alert” topic.
A further interesting fact is that some topics (workload, communication etc.) are almost
homogeneously distributed in all the clusters, without high or low peaks.
34D3.2 – DATA AND REPORT ANALYSIS AND PROCESSING
4.1.2 Supervised
The aim of supervised analyses is to take a further step towards the identification of recurring patterns
and contributing factors: indeed, the objective is not only to detect underlying factors, but also to link
them with safety indicators and with TOKAI taxonomy (currently implemented only in the UK scenario
due to the language).
4.1.2.1 Syntactic Analysis for contributing factors
This section reports the main results relative to the syntactic analysis of the reports. This tool (Figure
39) is based on a state-of-the-art methodology [6], which in this framework can be used for three main
analyses:
• Starting from a particularly significant verb (e.g., “instructs”, or “authorized”) the related
event is automatically retraced (e.g., who instructs the aircraft to do what) possibly providing
some hints about the contribution of the action to the incident (Figure 40 and Figure 41).
• Starting from a particularly significant noun (e.g., “load”), the related adjective and nominal
modifier (if present) can be retrieved, possibly providing a more useful information about the
object or fact (Figure 42).
• Starting from some particular words which may indicate something happening in an incorrect
or unconventional way (e.g., “without”, “couldn’t”, etc.), possibly providing some hints about
what went wrong during the incident (Figure 43) and possibly allowing to associate each
problem to a factor in taxonomy (Table 4). This could be useful not only in a qualitative way
(i.e., improving knowledge from a human point of view) but also in a quantitative way (i.e.,
generating some features describing reports by the presence or absence of these factors in
an automatic way).
Figure 39: Example of syntactic analysis tool
As can be seen in Figure 39, through syntactic analysis it is possible to identify subject, main verb,
object and clause; furthermore, we can retrieve specific adjectives or complements, or search for a
particular lemma (e.g., if you want to find all the possible derivations of “instruct”, “instructs”,
“instructed”, “instructing” etc., you can just search for the lemma “instruct”).
Figure 40 and Figure 41 shows the most probable subjects and clauses related to “instructs” and
“authorized” contained in the entire collection of CEANITA reports.
35D3.2 – DATA AND REPORT ANALYSIS AND PROCESSING
Figure 40: Example of syntactic analysis on sentences with "instructs"
Figure 41: Example of syntactic analysis on sentences with "authorised"
36D3.2 – DATA AND REPORT ANALYSIS AND PROCESSING
Figure 42: Example of syntactic analysis with noun “load”
Figure 42 is an example of syntactic analysis applied to nouns, in particular to the noun “load”. First of
all, it is interesting to see that the four possible nominal modifiers suggest four different situations:
traffic load, workload, water load (in case of fire extinguishing) and load of communications. These are
four different scenarios and for each of them we can retrace the seriousness by retrieving the
associated adjectives, which in CEANITA reports vary from “reasonable” to “excessive”, identifying
different level of severity.
Figure 43: Example of retracing of sentences with "without"
37D3.2 – DATA AND REPORT ANALYSIS AND PROCESSING
Factor Example
A. Personnel
A-1. Perception A-1-2; A-1-4. Detection Sector authorised without detecting
aircraft 2
A-1-5; A-1-6. Perceive Crew may not have seen
visual/auditory information
A-2. Memory A-2. Recall information Aircraft2 was authorised without
remembering presence [of Aircraft1]
A-4. Action A-4-5. Convey / record Sector indicated without specifying
information (completeness) level
A-5. Conformance A-5. Conformance [with Aircraft 2 did not comply with the
rules or procedures] instruction
B. Interaction with Environment
B-2. Pilot/Controller B-2-11. Phraseology They instructed without using
Communications (correctness) phraseology
B-6. Weather B-6-6. Thunderstorm They could not comply due to
activity thunderstorm
Table 4: Examples of automatic detection of taxonomy factors
4.1.2.2 ML models for contributing factors
Another possible way to identify contributing factors and to assess their relationships is building a
Machine Learning model. ML is often used with predictive aims, but the objective can actually be (like
in this case) not strictly predictive: it is possible to just simulate a prediction of the severity of incident
given some features in order to understand the roles of them in generating a more or less severe issue.
Clearly, a situation in which we already know an incident will take place in few minutes and we want
to know how severe it will be is completely unrealistic. However, if the model is white-box and easy to
interpret, it can really help in discovering the contribution of each factor to the severity of the incident.
The success of tree-based models in literature is essentially due to their readability: indeed, even
without a particular knowledge about ML, “decision trees” like the one in Figure 44 are quite intuitively
interpretable: starting from the top, the reader just has to follow the “branches” until he reaches the
“leaves” at the bottom. For instance, taking a right he can read: if the flight type of one of the aircraft
involved is M or X, and the topic about workload is present, the most probable outcome in terms of
separation score is 10. Furthermore, the leaf also indicates that the probability of this outcome given
these features is 83% (while just 8% of outcome 1 or 3 and zero probability of outcome 7) according
to the past. The last information contained in the leaf is that these features (flight type M or X and
presence of workload) characterise the 17% of the reports corpus.
By iterating this reading mechanism, the tree interestingly suggests for instance that the most severe
incidents typically involve Military or Flight-school flights (in CEANITA reports the X-type aircraft are
usually the “flight-school” ones), that incidents containing “alert” topic are usually the less
problematic, and that workload is always a very worsening factor.
38You can also read


