HOUSEHOLD WASTE COLLECTION BENCHMARKING REPORT - Prepared for: The Irish Waste ...
←
→
Page content transcription
If your browser does not render page correctly, please read the page content below

HOUSEHOLD WASTE COLLECTION
                                 BENCHMARKING REPORT

                                              Prepared for:

SLR Ref: 501.00047.00023
Revision No: 8
June 2018
IWMA
Republic of Ireland Household Waste Collection Cost Benchmarking                                                                                     SLR Ref No: 501.00047.00023
Filename: 180613_501.00047.00023_Benchmarking Household Waste Costs_CW_Rev8                                                                                            June 2018

       BASIS OF REPORT
                                             This document has been prepared by SLR Consulting Limited with reasonable skill, care and diligence, and taking account of the manpower,
                                             timescales and resources devoted to it by agreement with the IWMA (the Client) as part or all of the services it has been appointed by the
                                             Client to carry out. It is subject to the terms and conditions of that appointment.

                                             SLR shall not be liable for the use of or reliance on any information, advice, recommendations and opinions in this document for any
                                             purpose by any person other than the Client. Reliance may be granted to a third party only in the event that SLR and the third party have
                                             executed a reliance agreement or collateral warranty.

                                             Information reported herein may be based on the interpretation of public domain data collected by SLR, and/or information supplied by
                                             the Client and/or its other advisors and associates. These data have been accepted in good faith as being accurate and valid.

                                             The copyright and intellectual property in all drawings, reports, specifications, bills of quantities, calculations and other information set out
                                             in this report remain vested in SLR unless the terms of appointment state otherwise.

                                             This document may contain information of a specialised and/or highly technical nature and the Client is advised to seek clarification on any
                                             elements which may be unclear to it.

                                             Information, advice, recommendations and opinions in this document should only be relied upon in the context of the whole document
                                             and any documents referenced explicitly herein and should then only be used within the context of the appointment.

                                                                                .
IWMA
Republic of Ireland Household Waste Collection Cost Benchmarking                                                                                    SLR Ref No: 501.00047.00023
Filename: 180613_501.00047.00023_Benchmarking Household Waste Costs_CW_Rev8                                                                                           June 2018

          CONTENTS
    EXECUTIVE SUMMARY ....................................................................................................... 1

    1.0      INTRODUCTION ........................................................................................................ 6
    1.1      Republic of Ireland ............................................................................................................. 6

    2.0      METHODOLOGY ........................................................................................................ 9
    2.1      Recycling Levels ................................................................................................................. 9
    2.2      Reliance on Landfill .......................................................................................................... 11
    2.3      Initial Shortlist of Benchmarked Countries ...................................................................... 12
    2.4      Labour Costs .................................................................................................................... 12
    2.5      Population Density........................................................................................................... 14
    2.6      Rural versus Urban Population ........................................................................................ 14

    3.0      HOUSEHOLD WASTE COLLECTION COSTS AND SERVICES IN OTHER EUROPEAN COUNTRIES
             .............................................................................................................................. 16
    3.1      England ............................................................................................................................ 16
    3.2      Scotland ........................................................................................................................... 20
    3.3      Wales ............................................................................................................................... 24
    3.4      Northern Ireland .............................................................................................................. 27
    3.5      Denmark .......................................................................................................................... 30
    3.6      Sweden ............................................................................................................................ 31
    3.7      Italy .................................................................................................................................. 33
    3.8      Germany .......................................................................................................................... 34
    3.9      The Netherlands .............................................................................................................. 36
    3.10 Austria ............................................................................................................................. 37
    3.11 Finland ............................................................................................................................. 38
    3.12 France .............................................................................................................................. 40
    3.13 Belgium ............................................................................................................................ 41

    4.0      CONCLUSIONS ON BENCHMARKING AGAINST OTHER COUNTRIES ............................ 43

    5.0      HISTORICAL WASTE COLLECTION COSTS IN IRELAND ................................................ 46
    5.1      Background and Brief ...................................................................................................... 46
    5.2      Municipal Waste Management in Ireland in 2004 ........................................................... 46
    5.3      Private Sector Charges in 2004 ........................................................................................ 48

.
IWMA
Republic of Ireland Household Waste Collection Cost Benchmarking                                                                    SLR Ref No: 501.00047.00023
Filename: 180613_501.00047.00023_Benchmarking Household Waste Costs_CW_Rev8                                                                           June 2018

    5.4      Public Sector Costs & Charges in 2004 ............................................................................ 49
    5.5      Conclusions on Historical Waste Collection Costs in Ireland ........................................... 53

    6.0      CLOSURE ................................................................................................................ 55

          DOCUMENT REFERENCES
          REFERENCES ARE PROVIDED AS FOOTNOTES THROUGHOUT THE REPORT

          TABLES
          Table 1 Household Waste Collection Costs per Capita in Each Country .............................................. 2
          Table 2 Household Waste Collection Costs Per Capita Adjusted to Account for Apartments ............. 3
          Table 3 CA Survey of Private Operator Charges for Household Waste Collection Services in 2004 .... 4
          Table 4 Local Authority Costs for Household Waste Collection Services 2004 with VAT Added ......... 4
          Table 5 Charges under a Flat-Rate Waste Collection System Quoted in TCD 2005 Study ................... 5
          Table 1-1 Percentage of Population Living in Flats/Apartments (Eurostat 2016 data) ........................ 7
          Table 2-1 Estimated Labour costs for 17 shortlisted countries (Eurostat 2017 data)........................ 13
          Table 3-1 Municipal Waste Management Costs in France per Capita ............................................. 40
          Table 3-2 Municipal Waste Collection Costs in Flanders .................................................................. 41
          Table 4-1 Household Waste Collection Costs per Capita in Each Country ......................................... 43
          Table 4-2 Household Waste Collection Costs Per Capita Adjusted to Account for Apartments ........ 43
          Table 4-3 Household Waste Collection Cost Factors in Each Country ............................................... 44
          Table 5-1 Landfill Charges in Ireland in 2004 ..................................................................................... 47
          Table 5-2 Private Operator Charges for Household Waste Collection Services 2004 ........................ 48
          Table 5-3 Local Authority Costs for Household Waste Collection Services 2004 with VAT ............... 53
          Table 5-4 Charges under a Flat-Rate Waste Collection System Quoted in TCD 2005 Study .............. 53

          FIGURES
          Figure 2-1 Proportion of Recycling, Composting and Digestion......................................................... 10
          Figure 2-2 Proportion of Municipal Waste Sent to Landfill ................................................................ 11
          Figure 2-3 Hourly Labour Costs in the EU in 2017 .............................................................................. 12
          Figure 2-4 Population Density in the Shortlisted Countries ............................................................... 14
          Figure 2-5 Rural Population in the Shortlisted Countries................................................................... 15
          Figure 3-1 Waste Collection Frequency in England ........................................................................... 18
          Figure 3-2 Waste Collection Scheme Type in England ...................................................................... 18
          Figure 3-3 Waste Collection Service Provider in England .................................................................. 19

.
IWMA
Republic of Ireland Household Waste Collection Cost Benchmarking SLR Ref No: 501.00047.00023
Filename: 180613_501.00047.00023_Benchmarking Household Waste Costs_CW_Rev8 June 2018
Figure 3-4 Waste Management Costs per Household in Scotland ..................................................... 20
Figure 3-5 Waste Collection Frequency in Scotland .......................................................................... 22
Figure 3-6 Waste Collection Scheme Type in Scotland ..................................................................... 22
Figure 3-7 Waste Collection Service Provider in Scotland ................................................................. 23
Figure 3-8 Waste Collection Frequency in Wales .............................................................................. 25
Figure 3-9 Waste Collection Scheme Type in Wales ......................................................................... 25
Figure 3-10 Waste Collection Service Provider in Wales ................................................................... 26
Figure 3-11 Waste Collection Frequency in Northern Ireland........................................................... 28
Figure 3-12 Waste Collection Scheme Type in Northern Ireland ...................................................... 28
Figure 3-13 Waste Collection Service Provider in Northern Ireland .................................................. 29
Figure 3-14 Waste Management Costs per Household in Sweden .................................................... 31
Figure 3-15 Waste Management Costs per Household in Germany .................................................. 34
Figure 4-1 Household Waste Collection Costs Per Capita in Shortlisted Countries ........................... 44
APPENDICES
None
.IWMA
Republic of Ireland Household Waste Collection Cost Benchmarking SLR Ref No: 501.00047.00023
Filename: 180613_501.00047.00023_Benchmarking Household Waste Costs_CW_Rev8 June 2018
Executive Summary
The Irish Waste Management Association (IWMA) commissioned SLR Consulting to
benchmark the cost of household waste collection services in the Republic of Ireland
(Ireland) against services offered in countries across Europe. In addition, SLR was asked to
examine historical household waste collection and treatment costs in Ireland, at a time
when the local authorities were heavily involved in the market.
Benchmarking Against Other Countries
Municipal solid waste (MSW) management in Ireland is quite advanced in terms of environmental performance,
but not quite as good as the best performing countries in Europe, that have no reliance on landfill and very high
recycling rates. Using the latest Eurostat data,1 Ireland’s recycling rate is 42% and disposal of MSW to landfill is
22%.
Some European countries lag well behind Ireland in this regard and have a high reliance on landfill and low
recycling rates. Comparing prices and costs in Ireland against countries with a heavy reliance on cheap landfill
would be unfair, so in order to benchmark like with like, we removed countries that landfill more than 40% MSW
and have an MSW recycling rate of less than 30%.
Labour costs are quite variable across Europe and we took the view that benchmarking Ireland against countries
with very high labour costs or very low labour costs would be unfair. We therefore excluded countries that have
average labour costs of greater than €46 per hour and also excluded countries that have average labour costs of
less than €20 per hour2. Ireland has average labour costs of €31 per hour, according to 2017 Eurostat data.
We struggled to get data on Luxembourg, so that country was also excluded from the study at this point. The
final shortlist of 14 countries considered in the study is as follows:
1. Austria 4. England 7. Germany 10. Northern Ireland 13. Sweden
2. Belgium 5. Finland 8. Italy 11. Rep. of Ireland 14. Wales
3. Denmark 6. France 9. Netherlands 12. Scotland
SLR’s research team sourced data from each of the benchmarked countries. We contacted many of the waste
management associations in these countries and with their assistance, we sourced national data on the costs of
household waste collection and treatment. For completeness, we also sent working drafts of our report to these
associations for peer-review and received some useful feedback that influenced our final report.
In order to compare like with like, we removed VAT where it applied and we removed the costs associated with
the operation of civic amenity sites, litter management and street cleaning. In some cases where we believed
that administration costs were not included in the published data, we added 4% to the costs, based on the
breakdown of detailed data that was sourced from the UK.
1
Generally 2016 data, with some 2014 data applied where 2016 data is unavailable.
2
based on Eurostat 2017 data for labour costs for enterprises of 10 or more employees. The quoted cut-off points are 50% higher than
Ireland and 50% lower than Ireland.
Page 1IWMA
Republic of Ireland Household Waste Collection Cost Benchmarking SLR Ref No: 501.00047.00023
Filename: 180613_501.00047.00023_Benchmarking Household Waste Costs_CW_Rev8 June 2018
The service offered for kerbside household waste collection across Europe is very variable and varies quite a lot
internally in some countries. In our report, we provide details on the types and frequencies of collection for
household wastes.
Taking the estimated costs of household waste collection and treatment in each of the benchmarked countries,
the lowest to highest costs are listed in Table 1 below, with some relevant comments.
Table 1 Household Waste Collection Costs per Capita in Each Country
Rank Country Cost per capita Comments
1 Finland € 59.54 No recyclables collected from single houses. Low rural population.
2 Belgium (Flanders) € 62.85 Flanders only. High population density & very low rural population.
3 France € 73.00 Biowaste not commonly collected at kerbside.
4 England € 73.75 Relatively low labour costs. High Population density. Low rural population.
5 Germany € 74.00 Costs are for 100 largest cities, so urban in nature.
6 Wales € 76.80 Relatively low labour costs.
7 Netherlands € 79.63 High Population density. Low rural population
8 Republic of Ireland € 81.50 Low population density. High rural population.
9 Scotland € 84.63 Low population density.
10 Northern Ireland € 101.84 Low population density. High rural population.
11 Italy € 106.00 High rural population.
12 Austria € 107.00 High rural population.
13 Sweden € 114.00 Low population density & relatively high labour costs
14 Denmark € 134.00 High labour costs. Relatively low population density
Average € 87.75
The data shows that Ireland is mid-table and the cost is below average for the benchmarked countries.
There is a large variation in the ratio of apartments to houses across Europe. In Ireland, only 7.3% of people live
in flats/apartments, whereas the EU average is 41.8% according to Eurostat 2016 data. Collecting waste from
apartments costs a lot less per person when compared with collecting waste from individual houses. In Ireland,
our research has found that the cost of collection per person in individual houses is about 50% more expensive
than the cost per person living in apartments.
In order to benchmark fairly, we normalised each country’s costs by adjusting the cost per capita based on the
percentage of people living in apartments and the percentage living in houses. The adjusted (normalised) case is
based on the EU average of 41.8% of people living in apartments.
This adjustment increased the benchmarked cost per capita of countries such as Germany and Italy that have a
high level of apartment dwellers and lowered the benchmarked cost per capita of countries such as Ireland, the
UK, the Netherlands and Belgium that have lower levels of apartment dwellers.
Page 2IWMA
Republic of Ireland Household Waste Collection Cost Benchmarking SLR Ref No: 501.00047.00023
Filename: 180613_501.00047.00023_Benchmarking Household Waste Costs_CW_Rev8 June 2018
The adjusted figures are presented in Table 2 below, which also provides more detail on some of the factors that
influence the costs of household waste collection.
Table 2 Household Waste Collection Costs Per Capita Adjusted to Account for Apartments
Population
Average
Adjusted cost Density Rural Recycling Landfill
Rank Country Labour Costs
per Capita (people per Population Rate Reliance
€ per hour
km2)
1 Belgium (Flanders) € 58.35 € 39.60 480 2% 54% 0.8%
2 Finland € 59.08 € 32.70 18 16% 42% 3.3%
3 England € 66.65 € 25.70 420 17% 45% 15.6%
4 Wales € 69.41 € 25.70 149 20% 61% 9.6%
5 France € 70.20 € 36.00 106 20% 42% 22.4%
6 Republic of Ireland € 72.00 € 31.00 69 36% 42% 21.7%
7 Netherlands € 73.12 € 34.80 498 9% 53% 1.4%
8 Scotland € 76.48 € 25.70 67 18% 43% 45.3%
9 Germany € 78.66 € 34.10 233 24% 66% 1.5%
10 Northern Ireland € 92.04 € 25.70 136 37% 43% 37.0%
11 Austria € 108.34 € 34.10 106 34% 59% 2.7%
12 Italy € 110.58 € 28.20 204 31% 51% 27.6%
13 Sweden € 115.48 € 38.30 24 14% 49% 0.6%
14 Denmark € 129.09 € 42.50 136 12% 48% 1.0%
It can be seen from Table 2 that some of the more expensive countries such as Sweden, Denmark and Austria are
achieving very low landfill levels and very high recycling rates. Austria, Italy and Northern Ireland have a relatively
high proportion of their population living in rural areas and this clearly adds cost.
Belgium (Flanders) and England have very high population densities, which may explain the low costs in those
countries. Finland is low cost for a country with a very low population density, but the demographics are helped
by the fact that only 16% of the population live in rural areas. This is even more of an advantage in Belgium,
where World Bank data reports that only 2% of people live in rural areas.
The Republic of Ireland is performing well on price, but lags behind many of the benchmarked countries in terms
of recycling rates. We expect that the continued roll-out of brown (organic) bins will increase Ireland’s recycling
rate without having a significant impact on the prices charged to householders. We expect that the recycling rate
can reach 50% through this ongoing programme, which is the average of the benchmarked countries.
The biggest factors for prices in Ireland are thought to be the high rural population and the low population
density. The prices in Ireland are significantly lower than in other countries that have a high percentage of the
population living in rural areas, such as Northern Ireland, Austria and Italy, so the price performance in Ireland is
considered to be very good in light of the demographics.
Page 3IWMA
Republic of Ireland Household Waste Collection Cost Benchmarking SLR Ref No: 501.00047.00023
Filename: 180613_501.00047.00023_Benchmarking Household Waste Costs_CW_Rev8 June 2018
Benchmarking Against Historical Costs
SLR used the following sources of data for benchmarking against historical costs of household waste collection
and treatment:
A Competition Authority (CA) Report3 published in 2005 containing a survey of private sector charges in
2004.
Local authority budgets from 2004/5, mostly accessed through Freedom of Information requests.
Various Regional Waste Management Plans published in 2005.
A 2005 report prepared by Trinity College Dublin for the EPA.4
SLR selected 2004 as the base year for benchmarking for two reasons. Firstly, it was prior to the mass withdrawal
of local authorities from waste collection and secondly, there was good reliable available data on that year from
the sources quoted above. Where 2004 data was unavailable or unreliable, we used 2005 data instead.
The results of our analysis are presented in the Tables 3 to 5 below.
Table 3 CA Survey of Private Operator Charges for Household Waste Collection Services in 2004
County Annual Price (€) 240 l bins County Annual Price (€) 240 l bins
Carlow 420-444 Louth 270-372
Cavan 324 Mayo 300-360
Clare 330 Meath 270-372
Cork 360-370 Monaghan 324-372
Donegal 360 Offaly 312-324
Galway 350-375 Tipperary 380-384
Kildare 320-360 Roscommon 350
Kilkenny 456-480 Sligo 350
Laois 320-384 Waterford 480
Leitrim 380 Wexford 420-460
Limerick 344 Wicklow 372
Longford 324-380
Table 4 Local Authority Costs for Household Waste Collection Services 2004 with VAT Added5
2005 Cost per
2004 Cost per
Rank Local Authority Household Comments
Household
(where relevant)
Operated Kilbarry Landfill but closed in 2004, so
1 Waterford City € 242 € 341
Costs increased for 2005
2 Fingal County € 299 Operated Balleally Landfill
3
Enforcement Decision Series (No. E/05/002), Decision of the Competition Authority (Case COM/108/02), Alleged excessive pricing by
Greenstar Recycling Holdings Limited in the provision of household waste collection services in northeast Wicklow. 2005.
4
A Nationwide Review of Pay-By-Use (PBU) Domestic Waste Collection Charges in Ireland: Extensive Survey Findings (2005-WRM-MS-33)
Interim Report Prepared for the Environmental Protection Agency by Department of Geography, School of Natural Sciences, Trinity College,
Dublin Authors: Abigail O’Callaghan-Platt and Anna Davies (Environmental RTDI Programme 2000–2006)
5
Costs/charges have had 13.5% VAT added to allow benchmarking against private sector charges in 2004 and current charges.
Page 4IWMA
Republic of Ireland Household Waste Collection Cost Benchmarking SLR Ref No: 501.00047.00023
Filename: 180613_501.00047.00023_Benchmarking Household Waste Costs_CW_Rev8 June 2018
2005 Cost per
2004 Cost per
Rank Local Authority Household Comments
Household
(where relevant)
3 South Tipperary County € 341 Operated Donohill Landfill
4 South Dublin County € 348 Operated Arthurstown Landfill
5 Dublin City € 368 No Operational Landfill
6 Dun Laoghaire Rathdown € 395 No Operational Landfill
Provided 3 bin system & Operated Carrowbrowne
7 Galway City € 402
Landfill & Compost Facility
Cost based on 2 scenarios of using residual bin only
8 Waterford County € 384 to €448
(lower) or recycling & composting (higher)
Operated North Kerry Landfill. Costs are estimated
9 Kerry County € 387 to €448 by KCC as system was PBU. Lower cost required
home composting
10 Wexford County €420 to €557 Operated Killurin Landfill. Lower cost is New Ross
Table 5 Charges under a Flat-Rate Waste Collection System Quoted in TCD 2005 Study
Local Authority Annual Charge (€)
Minimum Charge per Annum € 300
Maximum Charge per Annum € 520
Mean Charge per Annum € 374.81
The current price in urban areas in Ireland is generally between €200 and €300 per annum and the price in rural
areas is generally between €300 and €400 per annum, with some exceptions to both cases. It is clear from the
data presented above that the costs and charges for kerbside household waste collection in Ireland in 2004/2005
were roughly €100 per household more expensive than current prices.
Since 2004, base costs for waste collection have increased significantly including the roll-out of a third bin, the
introduction of mandatory weighing systems and increases in the landfill levy, minimum wage, insurance costs
and diesel costs. The fact that household waste collection charges are now significantly lower than 2004 is, in our
view, due to the following factors:
Greater efficiencies in waste collection and treatment, including consolidation and vertical integration.
Landfill charges with the €75 levy are lower than many of the 2004 local authority landfill charges that
were artificially high.
Lower volumes of residual waste are sent to landfill, c.20% now compared with 80% in 2004.
The development of new infrastructure by the private sector including improved waste transfer stations,
waste to energy plants, materials recovery facilities, composting plants and anaerobic digestion plants.
Better research and engagement with International recycling markets, although this has suffered recently
with the restrictions imposed by the Chinese Government.
Engagement with the European Waste to Energy market as an alternative outlet to landfill, which has
effectively capped landfill prices.
The production of Solid Recovered Fuel (SRF) as an alternative outlet for residual waste. SRF replaces
carbon fuels such as coal and pet-coke at cement kilns in Ireland.
Page 5IWMA
Republic of Ireland Household Waste Collection Cost Benchmarking SLR Ref No: 501.00047.00023
Filename: 180613_501.00047.00023_Benchmarking Household Waste Costs_CW_Rev8 June 2018
1.0 Introduction
The Irish Waste Management Association (IWMA) commissioned SLR Consulting to
benchmark the cost of household waste collection services in the Republic of Ireland
(Ireland) against services offered in countries across Europe. In addition, SLR was asked to
examine historical household waste collection and treatment costs in Ireland, at a time
when the local authorities were heavily involved in the market.
This report is a culmination of the research and analysis undertaken by SLR. To ensure a consistent comparison
against Ireland, the report focusses on countries in Europe that are not overly reliant on landfill and countries that
currently achieve a relatively high recycling rate. The threshold applied and methodologies are described in
further detail in subsequent sections of this report.
For these selected comparator countries, SLR has reviewed and analysed publicly available data to estimate an
equivalent cost for collection and onward management of waste generated by households. To put these findings
into context, this report also summarises typical household waste management provision in each of the countries
considered. Where value added tax (VAT) is routinely included in the reported costs, adjustments have been
made to correct for this.
Initial research was based on general feedback and data provided to SLR and to the Irish waste Management
Association by other waste management associations in Europe with assistance from the European Federation of
Waste Management (FEAD). Subsequently, SLR has undertaken desk-based research of its own to corroborate
some of the data received from the FEAD members, referring also to information available publicly from Eurostat
and other data sources.
1.1 Republic of Ireland
Household waste collection in the Republic of Ireland6 is fully privatised with side-by-side competition that is
tightly regulated by the authorities. Household waste collection largely consists of a 3-bin system (for dry
recyclables, food waste and residual waste) in urban areas and a 2-bin system (for dry recyclables and residual
waste only) in rural areas. There are so many different service offerings in the market that it is difficult to put a
price on the average service.
Through the knowledge held internally of the waste management market, SLR estimate that the current cost of a
kerbside waste management service in Ireland is generally between €200 and €400 per household per annum,
including VAT at 13.5%. It is also estimated that the average cost for waste services per household in Ireland is
between €250 and €300 per annum, including VAT, as the majority of customers live in urban areas where the
costs are lowest.
Netting off the VAT from the average household waste costs results in a range of costs of between €220 and €264
per household per annum. It is understood that the average household in Ireland has 2.9 occupants based on
2016 data published by the Central Statistics Office (CSO). Therefore, the annual waste costs are between €76 and
€91 per person excluding VAT. The midpoint of this range is €83.50 per person. Note that this is based on houses
only and does not extend to apartments, where the cost of waste management per person is lower.
6
In this report where we refer to ‘Ireland’ and where Eurostat data refers to ‘Ireland’, this means the Republic of Ireland and does not
include Northern Ireland.
Page 6IWMA
Republic of Ireland Household Waste Collection Cost Benchmarking SLR Ref No: 501.00047.00023
Filename: 180613_501.00047.00023_Benchmarking Household Waste Costs_CW_Rev8 June 2018
In terms of service, most companies in Ireland collect each waste type fortnightly, with the exception of Panda
Waste Management in the Dun Laoghaire-Rathdown area, where the residual waste is collected weekly.
Analysis of the data on collection from apartments in Ireland, confidentially received from a number of large
waste management companies, suggests that the average cost of waste collection and treatment per apartment
is approximately €114, excluding VAT. According to the CSO data, occupied apartments in Ireland house an
average of 2.03 people, which therefore suggests that the average waste cost in apartments in Ireland is
approximately €56 per person.
On average in the EU28, 41.8% of people live in flats or apartments, whereas in Ireland (Ireland) it is just 7.3%,
according to 2016 Eurostat data presented in Table 1-1 below.
Table 1-1 Percentage of Population Living in Flats/Apartments (Eurostat 2016 data)
Country Percentage
Spain 66.1
Latvia 66.1
Switzerland 62.7
Estonia 62.0
Lithuania 58.2
Germany 57.1
Greece 57.1
Malta 55.0
Italy 52.5
Czech Republic 52.0
Slovakia 51.5
Iceland 48.5
Bulgaria 45.1
Sweden 45.1
Austria 45.0
Portugal 45.0
Poland 42.5
European Union (EU28) 41.8
Romania 36.3
Finland 34.2
France 31.5
Denmark 31.4
Hungary 31.4
Luxembourg 30.4
Slovenia 29.2
Cyprus 25.7
Serbia 24.6
Belgium 21.9
Croatia 21.0
Norway 19.7
Netherlands 18.8
Page 7IWMA
Republic of Ireland Household Waste Collection Cost Benchmarking SLR Ref No: 501.00047.00023
Filename: 180613_501.00047.00023_Benchmarking Household Waste Costs_CW_Rev8 June 2018
Country Percentage
United Kingdom 14.3
FYR Macedonia 13.6
Ireland 7.3
Combining the cost per person in apartments (€56) with the midpoint cost per person in houses (€83.50) and
using the 7.3% for apartment living in Ireland, we estimate that the average cost per capita for waste collection
and treatment in Ireland is €81.50.
In order to compensate for low level of apartment living in Ireland, we calculate the estimated cost per capita if
41.8% of people in Ireland lived in apartments at a cost of €56 per person and 58.2% lived in houses at a cost of
€83.50 per person. This would result in a cost per capita of €72 in Ireland.
In order to achieve a fair comparison, in other Chapters of this report we normalise the costs per capita in this
way, to get a cost based on 41.8% apartment living.
Population density is another important factor in household waste collection costs. Ireland has a population
density of 69 inhabitants per square kilometre; whereas the EU average is 118 inhabitants per square kilometre
based on Eurostat data for 2016. We do not normalise this factor in this report, but in our conclusions, we take
cognisance of the fact that collecting household waste in countries with lower population density is inherently
more expensive than collecting in higher density countries.
Household waste collection in Ireland is subsidised by the national packaging producer responsibility scheme
REPAK. We estimate from detailed data that the subsidy for kerbside waste collection is worth about €3 per
annum per person. We know from our research that many of the other countries in the study also benefit from
producer responsibility subsidies, either directly or indirectly, but we have not analysed this in detail, as it is
outside the scope of our work. However, we do not believe that the impact of these subsidies would have a
significant impact on the results of the benchmarking, given the relatively modest impact of the subsidy in Ireland
and the availability of similar benefits in other benchmarked countries.
Page 8IWMA
Republic of Ireland Household Waste Collection Cost Benchmarking SLR Ref No: 501.00047.00023
Filename: 180613_501.00047.00023_Benchmarking Household Waste Costs_CW_Rev8 June 2018
2.0 Methodology
In comparing household waste collection costs against European benchmarks, it is important to ensure
comparator countries operate household waste management services which are broadly comparable to those on
offer in the Republic of Ireland. To this end, it is important to focus on countries in Europe that do not
predominantly rely on landfill, and currently achieve a relatively high recycling rate.
In addition, labour costs vary widely across Europe and it is not expected that countries with high labour costs,
would have similar waste collection and treatment costs to countries that have very low labour costs. The
methodology and thresholds applied to meet these requirements are set out below.
2.1 Recycling Levels
There are approximately 38 states and territories in Europe. Based on the Eurostat dataset for ‘municipal waste
by waste operations’, SLR has ranked the countries in order of recycling performance for 20167. The data is
updated every 2 years, so where no data has been recorded for 2016, the data for the previous reporting period
has been used.
The ranking of European countries in order of recycling performance is presented in Figure 2-1.
7
http://appsso.eurostat.ec.europa.eu/nui/show.do?dataset=env_wasmun&lang=en
Page 9IWMA
Republic of Ireland Household Waste Collection Cost Benchmarking SLR Ref No: 501.00047.00023
Filename: 180613_501.00047.00023_Benchmarking Household Waste Costs_CW_Rev8 June 2018
Figure 2-1
Proportion of Recycling, Composting and Digestion
Bosnia & Herzegovina, 0%
Serbia, 0%
Montenegro, 5%
Malta, 8%
Turkey, 10%
Romania, 15%
Greece, 17%
Cyprus, 19%
Croatia, 21%
Slovakia, 23%
Latvia, 28%
Spain, 30%
Portugal, 30%
Estonia, 31%
Bulgaria, 32%
Iceland, 33%
Czech Republic, 34%
Hungary, 35%
Norway, 38%
France, 42%
Finland, 42%
Ireland, 42%
Poland, 44%
United Kingdom, 44%
Denmark, 48%
Luxembourg, 48%
Sweden, 49%
Lithuania, 50%
Italy, 51%
Switzerland, 53%
Netherlands, 53%
Belgium, 54%
Slovenia, 58%
Austria, 59%
Germany, 66%
0% 10% 20% 30% 40% 50% 60% 70%
Proportion of Municipal Waste sent for Recycling, Composting and Digestion
Ireland is achieving 42% municipal solid waste (MSW) recycling, according to the Eurostat data. Countries that
are achieving less than 30% MSW recycling were excluded from further consideration at this stage.
Page 10IWMA
Republic of Ireland Household Waste Collection Cost Benchmarking SLR Ref No: 501.00047.00023
Filename: 180613_501.00047.00023_Benchmarking Household Waste Costs_CW_Rev8 June 2018
2.2 Reliance on Landfill
Based on Eurostat data, SLR has also ranked the countries in order of proportion of MSW disposed to landfill in
2016, the results of which are illustrated in Figure 2-2.
Figure 2-2
Proportion of Municipal Waste Sent to Landfill
Switzerland, 0%
Sweden, 1%
Belgium, 1%
Denmark, 1%
Netherlands, 1%
Germany, 1%
Austria, 3%
Finland, 3%
Norway, 4%
Estonia, 11%
Luxembourg, 17%
Ireland, 22%
France, 22%
Slovenia, 24%
Italy, 28%
United Kingdom, 28%
Lithuania, 31%
Poland, 37%
Portugal, 49%
Czech Republic, 50%
Hungary, 51%
Spain, 57%
Iceland, 57%
Bulgaria, 64%
Slovakia, 66%
Latvia, 72%
Croatia, 78%
Albania, 79%
Romania, 80%
Cyprus, 81%
Greece, 82%
Turkey, 90%
Montenegro, 92%
Malta, 92%
Serbia, 100%
Bosnia Herzegovina, 100%
Kosovo, 100%
FYR Macedonia, 100%
0% 20% 40% 60% 80% 100%
Proportion of Municipal Waste sent to Landfill for Disposal
Ireland is achieving 22% landfill rate for MSW, according to the Eurostat data. Countries that are disposing more
than 40% of MSW to landfill were excluded from further consideration at this stage.
Page 11IWMA
Republic of Ireland Household Waste Collection Cost Benchmarking SLR Ref No: 501.00047.00023
Filename: 180613_501.00047.00023_Benchmarking Household Waste Costs_CW_Rev8 June 2018
2.3 Initial Shortlist of Benchmarked Countries
An initial shortlist of countries was drawn up at this point, excluding countries with a recycling rate of less than
30% and a rate of landfill disposal of over 40% of MSW. The result is a shortlist of the following 20 countries:
Austria; Luxembourg;
Belgium; Switzerland;
Denmark; Netherlands;
Estonia; Norway;
Finland; Poland:
France; Slovenia;
Germany; Sweden;
Italy; United Kingdom (4 countries as England, Wales, Scotland and
Lithuania; Northern Ireland considered separately).
2.4 Labour Costs
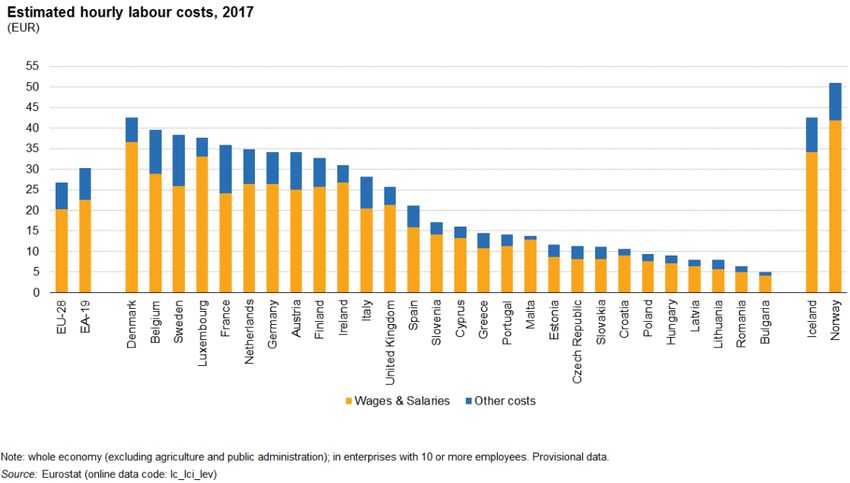
SLR then considered the cost of labour in these countries, which is provided in Figure 2-3 below, based on
Eurostat 2017 data for labour costs for enterprises of 10 or more employees.
Figure 2-3
Hourly Labour Costs in the EU in 2017
The data shows that labour costs in Ireland are €31.0 per employee per hour, compared with an EU average of
€26.8. Table 2-1 below shows the 2017 estimated labour costs in each of the 17 initial shortlisted countries.
Page 12IWMA
Republic of Ireland Household Waste Collection Cost Benchmarking SLR Ref No: 501.00047.00023
Filename: 180613_501.00047.00023_Benchmarking Household Waste Costs_CW_Rev8 June 2018
Table 2-1 Estimated Labour costs for 17 shortlisted countries (Eurostat 2017 data)
Country 2017 labour Costs
8
Switzerland 51.3
Norway 51.0
Denmark 42.5
Belgium 39.6
Sweden 38.3
Luxembourg 37.6
France 36.0
Netherlands 34.8
Austria 34.1
Germany 34.1
Finland 32.7
Ireland 31.0
Italy 28.2
European Union (EU28) 26.8
United Kingdom 25.7
Slovenia 17.0
Estonia 11.7
Poland 9.4
Lithuania 8.0
Of the initial shortlist of countries, the following were considered to have very low labour costs compared to
Ireland and were excluded from further consideration in the study:
Slovenia €17.0
Estonia €11.7
Poland €9.4
Lithuania €8.0
The following countries were considered to have very high labour costs compared to Ireland and were also
excluded from the study:
Switzerland €51.3
Norway €51.0
We struggled to get data on Luxembourg, so that country was also excluded from the study at this point. The
final shortlist of 14 countries considered in the study is as follows:
1. Austria 4. England 7. Germany 10. Northern Ireland 13. Sweden
2. Belgium 5. Finland 8. Italy 11. Rep. of Ireland 14. Wales
3. Denmark 6. France 9. Netherlands 12. Scotland
8
Switzerland was not included in the Eurostat data, so this was sourced from www.swissinfo.ch quoting figures from the Swiss Federal
statistics Office.
Page 13IWMA
Republic of Ireland Household Waste Collection Cost Benchmarking SLR Ref No: 501.00047.00023
Filename: 180613_501.00047.00023_Benchmarking Household Waste Costs_CW_Rev8 June 2018
2.5 Population Density
As mentioned above, population density is an important factor in household waste collection costs. Population
densities in the shortlisted countries are presented in Figure 2-49.
Figure 2-4
Population Density in the Shortlisted Countries
Finland, 18
Sweden, 24
Scotland, 67
Ireland, 69
France, 106
Austria, 106
Northern Ireland, 136
Denmark, 136
Wales, 149
Italy, 204
Germany, 233
England, 420
Belgium(Flanders),480
Netherlands, 498
0 100 200 300 400 500 600
Population Density in 2016 (inhabitants / square kilometer)
It is notable that Ireland’s population density fall towards the low end of the European spectrum. Ireland
traditionally has a high level of ‘one-off’ housing in the countryside and household waste collection lacks
economy of density in that scenario.
Whilst Finland and Sweden have lower population densities than Ireland, there are vast areas with few or no
houses in these countries and we assume that those areas are not served by kerbside household waste collection
services. So in reality the population density served by kerbside waste collection in Finland and Sweden is higher
than the data suggests.
2.6 Rural versus Urban Population
Collecting household waste from kerbsides in urban areas is a lot more cost effective than collecting in rural
areas, due to economies of density and scale. We use World Bank statistics10 to estimate the percentage rural
9
Mostly from http://ec.europa.eu/eurostat/tgm/table.do?tab=table&init=1&language=en&pcode=tgs00024&plugin=1
Page 14IWMA
Republic of Ireland Household Waste Collection Cost Benchmarking SLR Ref No: 501.00047.00023
Filename: 180613_501.00047.00023_Benchmarking Household Waste Costs_CW_Rev8 June 2018
population in each of the shortlisted countries in 2016, as presented in Figure 2-5 below. The World Bank figure
for the UK is 17% rural population, but we used local sources11 for each of the UK countries, as there are
significant differences in the demographics of these countries.
Figure 2-5
Rural Population in the Shortlisted Countries
Northern Ireland, 37%
Rep. of Ireland, 36%
Austria, 34%
Italy, 31%
Germany , 24%
Wales, 20%
France, 20%
Scotland, 18%
England, 17%
Finland, 16%
Sweden, 14%
Denmark, 12%
Netherlands, 9%
Belgium , 2%
0% 5% 10% 15% 20% 25% 30% 35% 40% 45%
Percentage of Population Living in Rural Areas
The data shows that Ireland, North and South, has a high percentage of people living in rural areas compared with
the other benchmarked countries. Austria and Italy also have a relatively high proportion of the population living
in rural areas. In contrast, Belgium is particularly urban, according to the World Bank data.
10
See https://data.worldbank.org/indicator/SP.RUR.TOTL.ZS
11
NISRA for Northern Ireland. National Records of Scotland. Welsh Government. DEFRA.
Page 15IWMA
Republic of Ireland Household Waste Collection Cost Benchmarking SLR Ref No: 501.00047.00023
Filename: 180613_501.00047.00023_Benchmarking Household Waste Costs_CW_Rev8 June 2018
3.0 Household Waste Collection Costs and Services in Other
European Countries
This chapter presents the waste management costs and collection services in each of the
shortlisted European countries.
3.1 England
3.1.1 Waste Management Costs
In seeking to establish waste management costs for England, SLR has referred to the dataset of budget estimates
of local authority revenue, expenditure and financing for 2017/18 published by the Ministry for Housing,
Communities and Local Government (MHCLG)12.
Simplistically summing revenue expenditure reported by MHCLG for waste collection, waste disposal, recycling
and waste minimisation activities (trade waste in particular being excluded), gives a total expenditure of £3.64 bn.
for waste services in England. However, to provide a fully inclusive cost which is comparable to the benchmarked
service in Ireland, it is necessary to apply the following adjustments:
MHCLG data is inclusive of expenditure on household waste and recycling centres (HWRCs, commonly
known as civic amenity sites). While no separate itemisation is available for the cost of HWRCs in England,
data published by the Welsh Government Association13 indicates that HWRC service account for 17% of
local authority waste service expenditure. Applying this reduction factor, gives an estimate of £3.02
billion.
It is understood that MHCLG dataset excludes council expenditure on administrative services which
support the collection and treatment of household waste. In total, MHCLG report a ‘central services’
budget of £2.99 bn. No published data exists on the proportion of this total which is attributable to waste
management services. Indicatively however, examining the detail of this budget, we estimate that
expenditure on waste management services amounts to 4% of total expenditure on local authority public
services in England. Applying this 4% factor, it is estimated that circa £120 million of the central services
cost is associated administrative support to waste management. Coincidentally, this amounts to 4.0% of
the quoted waste costs.
In deriving costs from the MHCLG 2017/18 cost dataset, it is also important to note that expenditure on
capital is aggregated under a separate heading (i.e. the reported £3.64 bn revenue expenditure is not
inclusive of all capital items). Previously, MHCLG has published service specific capital costs in 2013/14,
and this earlier dataset indicates that waste management accounts for 2.3% of the capital spend total.
Applying this factor to the reported total £9.37 bn capital spend in 2017/18, 2017/18 capital expenditure
on waste services in England is estimated at £210 million.
Applying corrections for central administrative services and capital expenditure, a combined total of
£3.35 bn on household kerbside waste services is estimated.
12
https://www.gov.uk/government/uploads/system/uploads/attachment_data/file/623097/RA_2017-18_data_by_LA.xlsx
13
http://www.wlga.wales/SharedFiles/Download.aspx?pageid=62&mid=665&fileid=706
Page 16IWMA
Republic of Ireland Household Waste Collection Cost Benchmarking SLR Ref No: 501.00047.00023
Filename: 180613_501.00047.00023_Benchmarking Household Waste Costs_CW_Rev8 June 2018
Data published by the Office for National Statistics (ONS) indicates that England had a population of
approximately 55.6 million in 2017/1814, suggesting a per capita waste service expenditure of £60.25 per
person.
In our analyses of the UK countries, we have data from a number of years during which the value of sterling has
been quite volatile in response to the planned Brexit. The average exchange rate over the last 5 years has been
€1.224 to £1 sterling, so we use this figure consistently in this report when addressing the UK countries. Applying
the exchange rate of EUR 1.224 per GBP, this equates to an average expenditure of €73.75 per person.
In order to benchmark the collection costs with Ireland, we adjust for apartment versus houses in each country.
Based on data from Ireland, the cost per capita of collecting from houses is roughly 1.5 times more expensive
than the cost of collecting from apartments. According to the Eurostat data quoted earlier in this report, 14.1% of
people in the UK live in flats or apartments compared to 41.8% on average in the EU. Adjusting for this factor, if
England had 41.8% of people living in apartments, the adjusted cost per capita would be €66.65.
3.1.2 Waste Collection Services
The Waste and Resources Action Programme (WRAP) publishes a list annually showing the kerbside waste
collection schemes offered by local authorities across the UK. The most recent dataset presents kerbside waste
collection schemes for 2016/1715. SLR has reviewed the WRAP data and analysed the figures for England.
As shown in Figure 3-1 and Figure 3-2 there is considerable variation in the collection service offering for
households across England. The majority of households (64%) have their residual waste collected fortnightly; 33%
have weekly collections, while 3% have collections at other frequencies.
14
https://www.ons.gov.uk/peoplepopulationandcommunity/populationandmigration/populationprojections/datasets/localauthoritiesinen
glandtable2
15
http://laportal.wrap.org.uk/Statistics.aspx
Page 17IWMA
Republic of Ireland Household Waste Collection Cost Benchmarking SLR Ref No: 501.00047.00023
Filename: 180613_501.00047.00023_Benchmarking Household Waste Costs_CW_Rev8 June 2018
Figure 3-1
Waste Collection Frequency in England
Figure 3-2
Waste Collection Scheme Type in England
Page 18IWMA
Republic of Ireland Household Waste Collection Cost Benchmarking SLR Ref No: 501.00047.00023
Filename: 180613_501.00047.00023_Benchmarking Household Waste Costs_CW_Rev8 June 2018
With regards to food waste, 31% of properties have separate food waste collections; 40% have mixed collections
(i.e. food and garden waste combined), while 29% of properties have no food waste collections at all16. Of the
properties that have some form of kerbside food waste collection, 76% have this collected weekly and the
remainder have their food waste collected fortnightly.
For the collection of dry recycling, 73% of properties have their dry recycling collected fortnightly; 24% have
material collected weekly, while 3% of properties have collections at other frequencies. The majority of
properties (49%) have a comingled collection; 33% of properties have a two stream partly comingled collection
and the remainder (18%) have a kerbside sorted collection scheme.
As shown in Figure 3-3, there is almost an even split in the proportion of waste and recycling collections across
England provided by public bodies and private waste management companies, with about 3% of collections
provided by third sector organisations such as community groups and social enterprises.
Figure 3-3
Waste Collection Service Provider in England
16
London Borough of Sutton have answered ‘none’ to the question of whether there is a separate food waste collection; however it is
understood that the Council does offer this service.
Page 19IWMA
Republic of Ireland Household Waste Collection Cost Benchmarking SLR Ref No: 501.00047.00023
Filename: 180613_501.00047.00023_Benchmarking Household Waste Costs_CW_Rev8 June 2018
3.2 Scotland
3.2.1 Waste Management Costs
In seeking to establish waste management costs for Scotland, SLR has referred to the most recent published
dataset for local government benchmarking data for 2016/17 published by the national improvement service for
local government in Scotland17. These figures are sourced directly from the Scottish Government’s Local Finance
Return (LFR) which is completed by Councils each year18. The information of relevance to this study pertains to
waste collection costs and waste disposal costs exclusive of VAT, as reported under the following key
performance indicators:
ENV1a – net expenditure for waste collection per property; and
ENV2a – net expenditure for waste disposal per property.
This dataset covers 32 local authorities and analysis of the waste management costs in 2016/17 shows that costs
were lowest in the Shetland Islands at £117.46 (€143.78) per property, and highest in Argyll and Bute at £231.55
(€283.41) per property. It is however notable that analysis of the dataset shows that the majority of local
authorities in Scotland reported waste management costs of €175 to €225 per property per year as shown in
Figure 3-4.
Figure 3-4
Waste Management Costs per Household in Scotland
275 to 300
Combined waste managmeent cost per
250 to 275
household (€/hh/yr)
225 to 250
200 to 225
175 to 200
150 to 175
125 to 150
0 2 4 6 8 10
Number of Scottish Authorities
The dataset shows that the average waste management costs in 2016/17 were approximately £161.31 (€199.89)
per property (i.e. £64.54 for collection and £98.77 for disposal).
17
http://www.improvementservice.org.uk/documents/benchmarking/1617rawdata.xlsx
18
http://www.gov.scot/Topics/Statistics/Browse/Local-Government-Finance/ReturnLFR
Page 20IWMA
Republic of Ireland Household Waste Collection Cost Benchmarking SLR Ref No: 501.00047.00023
Filename: 180613_501.00047.00023_Benchmarking Household Waste Costs_CW_Rev8 June 2018
In total, reported Scottish local authority expenditure on waste collection and disposal in 2016/17 amounts to
£431M. As per the case of England, it is understood that local authority waste management costs reported in
Scotland are inclusive of the cost of operation of HWRCs. Applying a reduction of 17%, again derived from HWRC
operation costs reported in Wales, leaves a combined cost of £357.7M.
As mentioned previously, the reported figures account for the costs associated with the collection and disposal of
waste managed by local authorities in Scotland. The figures will include staff costs for those working directly
within waste management but exclude elements which are defined as support costs. The local governance
structures in each Council will dictate what are classified as support costs. The LFR have issued guidance in this
regard which suggests that costs associated with the finance, legal, human resources, information technology,
internal audit, procurement and asset management departments should be regarded as support costs19. Scottish
datasets however provide no clear basis to estimate this unquantified support element. Therefore, to be
consistent with England, we add 4%20 to cover those costs, so the total cost of kerbside household collection in
Scotland is estimated at £372M.
Dividing by Scotland’s population in 2016, estimated by National Records of Scotland at 5.38M, indicates a
household waste management cost of £69.14 per person. At the 5 year average EUR 1.224 per GBP exchange
rate, this converts to €84.63 per person.
In order to benchmark the collection costs with Ireland, we adjust for apartment versus houses in each country.
Based on data from Ireland, the cost per capita of collecting from houses is roughly 1.5 times more expensive
than the cost of collecting from apartments. According to the Eurostat data quoted earlier in this report, 14.1% of
people in the UK live in flats or apartments compared to 41.8% on average in the EU. Adjusting for this factor, if
Scotland had 41.8% of people living in apartments, the adjusted cost per capita would be €76.48.
3.2.2 Waste Collection Services
The Waste and Resources Action Programme (WRAP) publishes a list annually showing the kerbside waste
collection schemes offered by local authorities across the UK. The most recent dataset presents kerbside waste
collection schemes for 2016/1721.
SLR has analysed this data for Scotland, and as shown in Figure 3-5 and Figure 3-6, there is considerable variation
in the collection service offering for households across Scotland. The majority of households (71%) have their
residual waste collected fortnightly; 13% have weekly collections, while 8% have 3 or 4 weekly collections.
19
http://www.gov.scot/Topics/Statistics/Browse/Local-Government-Finance/ReturnLFR/LFR2015-16supportcosts
20
In the England case, this was £120M out of £3.02Bn = 4.0%
21
http://laportal.wrap.org.uk/Statistics.aspx
Page 21IWMA
Republic of Ireland Household Waste Collection Cost Benchmarking SLR Ref No: 501.00047.00023
Filename: 180613_501.00047.00023_Benchmarking Household Waste Costs_CW_Rev8 June 2018
Figure 3-5
Waste Collection Frequency in Scotland
Figure 3-6
Waste Collection Scheme Type in Scotland
Page 22IWMA
Republic of Ireland Household Waste Collection Cost Benchmarking SLR Ref No: 501.00047.00023
Filename: 180613_501.00047.00023_Benchmarking Household Waste Costs_CW_Rev8 June 2018
With regards to food waste, 56% of properties have separate food waste collections; 37% have mixed collections
(i.e. food and garden waste combined), while 7% of properties have no food waste collections at all. Of the
properties that have some form of kerbside food waste collection, 68% have this collected weekly and the
remainder have their food waste collected fortnightly.
For the collection of dry recycling, 84% of properties have their dry recycling collected fortnightly; 10% have
material collected 3 or 4 weekly, while 5% of properties have weekly collections. The majority of properties (49%)
have a comingled collection; 39% of properties have a two stream partly comingled collection and the remainder
(13%) have a kerbside sorted collection scheme.
As shown in Figure 3-7, waste and recycling collections across Scotland are typically provided by public bodies –
either in-house or by a Direct Services Organisation (DSO). Other bodies offering waste and recycling collections
include private waste management companies and third sector organisations (e.g. community groups and social
enterprises).
Figure 3-7
Waste Collection Service Provider in Scotland
Page 23You can also read


