Reference and Troubleshooting Guide - GeneMapper Software Version 4.1
←
→
Page content transcription
If your browser does not render page correctly, please read the page content below
GeneMapper® Software Version 4.1

                                   Process Quality
                                   Values and Basic
Reference and                      Troubleshooting

Troubleshooting Guide

                                   SNPlex™ System
                                   Troubleshooting

                                   Algorithms

GeneMapper® Software Version 4.1

                                    Process Quality
                                   Values and Basic
Reference and                       Troubleshooting

Troubleshooting Guide

                                   SNPlex™ System
                                    Troubleshooting

                                        Algorithms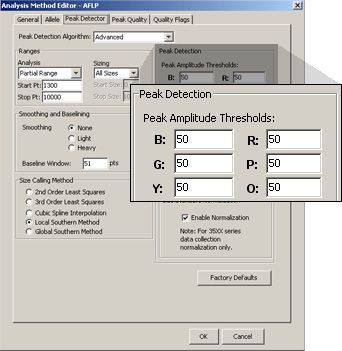
For Research Use Only. Not for use in diagnostic procedures.
Information in this document is subject to change without notice.
APPLIED BIOSYSTEMS DISCLAIMS ALL WARRANTIES WITH RESPECT TO THIS DOCUMENT, EXPRESSED OR
IMPLIED, INCLUDING BUT NOT LIMITED TO THOSE OF MERCHANTABILITY OR FITNESS FOR A PARTICULAR
PURPOSE. TO THE FULLEST EXTENT ALLOWED BY LAW, IN NO EVENT SHALL APPLIED BIOSYSTEMS BE
LIABLE, WHETHER IN CONTRACT, TORT, WARRANTY, OR UNDER ANY STATUTE OR ON ANY OTHER BASIS FOR
SPECIAL, INCIDENTAL, INDIRECT, PUNITIVE, MULTIPLE OR CONSEQUENTIAL DAMAGES IN CONNECTION WITH
OR ARISING FROM THIS DOCUMENT, INCLUDING BUT NOT LIMITED TO THE USE THEREOF, WHETHER OR NOT
FORESEEABLE AND WHETHER OR NOT APPLIED BIOSYSTEMS IS ADVISED OF THE POSSIBILITY OF SUCH
DAMAGES.
NOTICE TO PURCHASER: DISCLAIMER OF LICENSE
Purchase of this software product alone does not imply any license under any process, instrument or other apparatus,
system, composition, reagent or kit rights under patent claims owned or otherwise controlled by Applied Biosystems, either
expressly, or by estoppel.
GeneMapper Software has not undergone specific developmental validation for human identification applications. Human
identification laboratories analyzing single-source or parentage samples which choose to use GeneMapper Software for data
analysis should perform their own developmental validation studies.
The AFLP process is covered by patents owned by Keygene N.V.
TRADEMARKS:
Applied Biosystems, AB (Design), ABI PRISM, GeneMapper, GeneScan, Primer Focus, and SNaPshot are registered trademarks,
and GeneScan and SNPlex are trademarks of Applied Biosystems or its affiliates in the U.S. and/or certain other countries.
AFLP is a registered trademark of Keygene N.V.
This product includes software developed by the Apache Software Foundation (http://www.apache.org/). Copyright © 1999-2000
The Apache Software Foundation. All rights reserved.
This product includes software developed by the ExoLab Project (http://www. exolab.org/). Copyright 2000 © Intalio Inc. All
rights reserved.
JNIRegistry is Copyright © 1997 Timothy Gerard Endres, ICE Engineering, Inc., http://www.trustice.com.
Oracle is a registered trademark of Oracle Corporation.
All other trademarks are the sole property of their respective owners.
© Copyright 2009, Applied Biosystems. All rights reserved.

Part Number 4403673 Rev. A
04/2009

                                     GeneMapper® Software Version 4.1 Reference and Troubleshooting Guide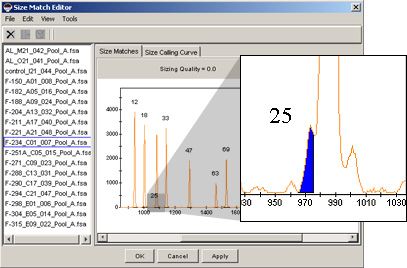
Contents

                         Preface                                                                                          v
                         How to Use This Guide . . . . . . . . . . . . . . . . . . . . . . . . . . . . . . . . . v
                         How to Obtain More Information . . . . . . . . . . . . . . . . . . . . . . . . . . vi
                         How to Obtain Support . . . . . . . . . . . . . . . . . . . . . . . . . . . . . . . . viii

      Chapter 1          Process Quality Values and Basic
                         Troubleshooting                                                                                  1
                         Diagnosing and Resolving Basic Problems . . . . . . . . . . . . . . . . . . . 2
                              Common Troubleshooting Procedures . . . . . . . . . . . . . . . . . . . 5
                         ADO (Allele Display Overflow) . . . . . . . . . . . . . . . . . . . . . . . . . . . . . 8
                         AE (Allele Edit) . . . . . . . . . . . . . . . . . . . . . . . . . . . . . . . . . . . . . . . . . 8
                         AN (Allele Number) . . . . . . . . . . . . . . . . . . . . . . . . . . . . . . . . . . . . . . 9
                         BD (Broad Peak) . . . . . . . . . . . . . . . . . . . . . . . . . . . . . . . . . . . . . . . . 9
                         BIN (Out of Bin Allele) . . . . . . . . . . . . . . . . . . . . . . . . . . . . . . . . . . . 10
                         CC (Control Concordance) . . . . . . . . . . . . . . . . . . . . . . . . . . . . . . . 11
                         DP (Double Peak) . . . . . . . . . . . . . . . . . . . . . . . . . . . . . . . . . . . . . . 12
                         GQ (Genotype Quality) . . . . . . . . . . . . . . . . . . . . . . . . . . . . . . . . . . 13
                         LPH (Low Peak Height) . . . . . . . . . . . . . . . . . . . . . . . . . . . . . . . . . 15
                         MNF (Matrix Not Found) . . . . . . . . . . . . . . . . . . . . . . . . . . . . . . . . . 16
                         NB (Narrow Bin) . . . . . . . . . . . . . . . . . . . . . . . . . . . . . . . . . . . . . . . 18
                         OBA (One Basepair Allele) . . . . . . . . . . . . . . . . . . . . . . . . . . . . . . . 18
                         OS (Offscale) . . . . . . . . . . . . . . . . . . . . . . . . . . . . . . . . . . . . . . . . . 19
                         OVL (Overlap) . . . . . . . . . . . . . . . . . . . . . . . . . . . . . . . . . . . . . . . . . 20
                         PHR (Peak Height Ratio) . . . . . . . . . . . . . . . . . . . . . . . . . . . . . . . . 21
                         SFNF (Sample File Not Found) . . . . . . . . . . . . . . . . . . . . . . . . . . . . 22
                         SHP (Sharp Peak) . . . . . . . . . . . . . . . . . . . . . . . . . . . . . . . . . . . . . . 23
                         SNF (Size Standard Not Found) . . . . . . . . . . . . . . . . . . . . . . . . . . . 23

GeneMapper® Software Version 4.1 Reference and Troubleshooting Guide                                                      iii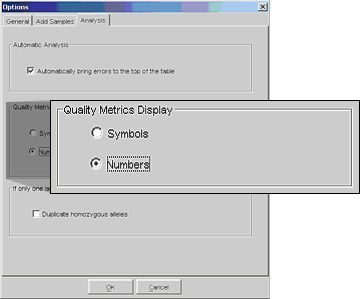
Contents

            SP (Split Peak) . . . . . . . . . . . . . . . . . . . . . . . . . . . . . . . . . . . . . . . . 24
            SPA (Single Peak Artifact) . . . . . . . . . . . . . . . . . . . . . . . . . . . . . . . 24
            SPU (Spectral Pull-Up) . . . . . . . . . . . . . . . . . . . . . . . . . . . . . . . . . 25
            SQ (Sizing Quality) . . . . . . . . . . . . . . . . . . . . . . . . . . . . . . . . . . . . . 25
            XTLK (Cross Talk) . . . . . . . . . . . . . . . . . . . . . . . . . . . . . . . . . . . . . 32

Chapter 2   SNPlex™ System Troubleshooting                                                                     33
            Overview . . . . . . . . . . . . . . . . . . . . . . . . . . . . . . . . . . . . . . . . . . . . 34

Chapter 3   Algorithms                                                                                         35
            Genotyping Algorithms . . . . . . . . . . . . . . . . . . . . . . . . . . . . . . . . . 36
            Peak Detection . . . . . . . . . . . . . . . . . . . . . . . . . . . . . . . . . . . . . . . 38
            Optimizing Peak Detection Sensitivity . . . . . . . . . . . . . . . . . . . . . 41
                 Example 1: Reducing Window Size . . . . . . . . . . . . . . . . . . . . 41
                 Example 2: Reducing Window Size/Increasing Polynomial Degree
                 . . . . . . . . . . . . . . . . . . . . . . . . . . . . . . . . . . . . . . . . . . . . . . . . . 42
                 Example 3: Extreme Settings . . . . . . . . . . . . . . . . . . . . . . . . . 43
            Slope Thresholds for Peak Start/End Parameters . . . . . . . . . . . . 44
            Slope Threshold Example . . . . . . . . . . . . . . . . . . . . . . . . . . . . . . . 45
            Size-Matching/Size-Calling Algorithm . . . . . . . . . . . . . . . . . . . . . . 46
            Size-Calling Methods (Classic and Advanced Modes) . . . . . . . . . 47
                 Least Squares Method . . . . . . . . . . . . . . . . . . . . . . . . . . . . . . 47
                 Cubic Spline Interpolation Method . . . . . . . . . . . . . . . . . . . . . 49
                 Local Southern Method . . . . . . . . . . . . . . . . . . . . . . . . . . . . . 50
                 Global Southern Method . . . . . . . . . . . . . . . . . . . . . . . . . . . . . 52
            Allele-Calling Algorithms . . . . . . . . . . . . . . . . . . . . . . . . . . . . . . . . 53
                 Microsatellite Analysis Methods . . . . . . . . . . . . . . . . . . . . . . . 54
                 SNPlex™ System Analysis Methods . . . . . . . . . . . . . . . . . . . . 55

            Glossary                                                                                           59

            Index                                                                                              67

iv                     GeneMapper® Software Version 4.1 Reference and Troubleshooting Guide
Preface
How to Use This Guide
Purpose of This This guide describes the function of the Process Quality Values
Guide (PQV) for the supported analyses of the GeneMapper® Software,
explains the fundamental algorithms used by the software, and
provides basic troubleshooting techniques.
Audience This guide is intended for trained laboratory personnel. Applied
Biosystems is not liable for damage or injury that results from use of
this guide by unauthorized or untrained parties.
Assumptions This guide assumes that:
• You have installed GeneMapper® Software Version 4.1 as described
in the GeneMapper® Software Version 4.1 Installation and
Administration Guide (PN 4403614).
• You have a working knowledge of the Microsoft® Windows®
operating system.
Text Conventions This guide uses the following conventions:
• Bold indicates user action. For example:
Type 0, then press Enter for each of the remaining fields.
• Italic text indicates new or important words and is also used for
emphasis. For example:
Before analyzing, always prepare fresh matrix.
• A right arrow bracket () separates successive commands you
select from a drop-down or shortcut menu. For example:
Select FileOpenSpot Set.
Right-click the sample row, then select View FilterView All.
GeneMapper® Software Version 4.1 Reference and Troubleshooting Guide vPreface
How to Obtain More Information
User Attention Two user attention words appear in Applied Biosystems user
Words documentation. Each word implies a particular level of observation
or action as described below:
Note: Provides information that may be of interest or help but is not
critical to the use of the product.
IMPORTANT! Provides information that is necessary for proper
instrument operation, accurate chemistry kit use, or safe use of a
chemical.
Examples of the user attention words appear below:
Note: The size of the column affects the run time.
Note: The Calibrate function is also available in the Control
Console.
IMPORTANT! To verify your client connection to the database, you
need a valid Oracle user ID and password.
IMPORTANT! You must create a separate Sample Entry Spreadsheet
for each 96-well plate.
How to Obtain More Information
Safety See the GeneMapper® Software Version 4.1 Installation and
Information Administration Guide (PN 4403614) for safety information.
Software See the GeneMapper® Software Version 4.1 Installation and
Warranty and Administration Guide (PN 4403614) for warranty and licensing
License information.
vi GeneMapper® Software Version 4.1 Reference and Troubleshooting GuidePreface
How to Obtain More Information
Related The following related documents are shipped with the software:
Documentation • GeneMapper® Software Version 4.1 Installation and
Administration Guide (PN 4403614) – Provides procedures for
installing, securing, and maintaining version 4.1 of the
GeneMapper Software.
• GeneMapper® Software Version 4.1 Getting Started Guides for
microsatellite analysis (PN 4403672), loss of hetereozygosity
(LOH) analysis (PN 4403621), AFLP® system analysis
(PN 4403620), SNaPshot® kit analysis (PN 4403618), and
SNPlex™ system analysis (PN 4403617) – Five guides that
explain how to analyze the application-specific example data
provided with the GeneMapper Software. The guides provide
brief, step-by-step procedures for the analysis of microsatellite,
LOH, AFLP® system, SNaPshot® kit, and SNPlex™ system data
generated by compatible Applied Biosystems electrophoresis
instruments and Data Collection Software. The guides are
designed to help you quickly learn to use basic functions of the
GeneMapper Software.
• GeneMapper® Software Version 4.1 Online Help – Describes
the GeneMapper Software and provides procedures for common
tasks. Access online help by pressing F1, selecting Help
Contents and Index, or clicking in the toolbar of the
GeneMapper window.
• GeneMapper® Software Version 4.1 Quick Reference Guide
(PN 4403615) – Provides workflows for specific analysis types
and lists instruments, software, and analysis applications
compatible with the GeneMapper Software.
• GeneMapper® Software Version 4.1 Reference and
Troubleshooting Guide (PN 4403673) – Provides reference
information such as theory of operation and includes
troubleshooting information.
Portable document format (PDF) versions of this guide and the other
documents listed above are available on the GeneMapper® Software
Version 4.1 Documentation CD.
Note: For additional documentation, see “How to Obtain Support”
on page viii.
GeneMapper® Software Version 4.1 Reference and Troubleshooting Guide viiPreface
How to Obtain Support
Send Us Your Applied Biosystems welcomes your comments and suggestions for
Comments improving its user documents. You can e-mail your comments to:
techpubs@appliedbiosystems.com
Obtaining The GeneMapper® Software features an online help system that
Information from describes how to use each feature of the user interface. To access the
the Online Help online help, click in any window or dialog box (HelpContents
and Index if available) for more information.
How to Obtain Support
For the latest services and support information for all locations, go to
http://www.appliedbiosystems.com, then click the link for Support.
At the Support page, you can:
• Search through frequently asked questions (FAQs)
• Submit a question directly to Technical Support
• Order Applied Biosystems user documents, MSDSs, certificates
of analysis, and other related documents
• Download PDF documents
• Obtain information about customer training
• Download software updates and patches
In addition, the Support page provides access to worldwide telephone
and fax numbers to contact Applied Biosystems Technical Support
and Sales facilities.
viii GeneMapper® Software Version 4.1 Reference and Troubleshooting GuideChapter 1
Process Quality Values and
Basic Troubleshooting
Chapter 1
In this chapter:
Process Quality Values ■ Diagnosing and Resolving Basic Problems . . . . . . . . . . . . . . 2
and
Basic Troubleshooting ■ ADO (Allele Display Overflow) . . . . . . . . . . . . . . . . . . . . . . 8
■ AE (Allele Edit) . . . . . . . . . . . . . . . . . . . . . . . . . . . . . . . . . . . 8
■ AN (Allele Number). . . . . . . . . . . . . . . . . . . . . . . . . . . . . . . . 9
■ BD (Broad Peak) . . . . . . . . . . . . . . . . . . . . . . . . . . . . . . . . . . 9
■ BIN (Out of Bin Allele) . . . . . . . . . . . . . . . . . . . . . . . . . . . . 10
■ CC (Control Concordance). . . . . . . . . . . . . . . . . . . . . . . . . . . 11
Chapter 2
■ DP (Double Peak). . . . . . . . . . . . . . . . . . . . . . . . . . . . . . . . . 12
SNPlex™ System
Troubleshooting ■ GQ (Genotype Quality) . . . . . . . . . . . . . . . . . . . . . . . . . . . . 13
■ LPH (Low Peak Height). . . . . . . . . . . . . . . . . . . . . . . . . . . . 15
■ MNF (Matrix Not Found) . . . . . . . . . . . . . . . . . . . . . . . . . . 16
■ NB (Narrow Bin) . . . . . . . . . . . . . . . . . . . . . . . . . . . . . . . . . 18
■ OBA (One Basepair Allele) . . . . . . . . . . . . . . . . . . . . . . . . . 18
■ OS (Offscale) . . . . . . . . . . . . . . . . . . . . . . . . . . . . . . . . . . . . 19
Chapter 3
■ OVL (Overlap) . . . . . . . . . . . . . . . . . . . . . . . . . . . . . . . . . . . 20
Algorithms
■ PHR (Peak Height Ratio) . . . . . . . . . . . . . . . . . . . . . . . . . . . 21
■ SFNF (Sample File Not Found) . . . . . . . . . . . . . . . . . . . . . . 22
■ SHP (Sharp Peak). . . . . . . . . . . . . . . . . . . . . . . . . . . . . . . . . 23
■ SNF (Size Standard Not Found). . . . . . . . . . . . . . . . . . . . . . 23
■ SP (Split Peak) . . . . . . . . . . . . . . . . . . . . . . . . . . . . . . . . . . . 24
■ SPA (Single Peak Artifact). . . . . . . . . . . . . . . . . . . . . . . . . . 24
■ SPU (Spectral Pull-Up) . . . . . . . . . . . . . . . . . . . . . . . . . . . . 25
■ SQ (Sizing Quality) . . . . . . . . . . . . . . . . . . . . . . . . . . . . . . . 25
■ XTLK (Cross Talk) . . . . . . . . . . . . . . . . . . . . . . . . . . . . . . . 32
GeneMapper® Software Version 4.1 Reference and Troubleshooting Guide 1Chapter 1 Process Quality Values and Basic Troubleshooting
Diagnosing and Resolving Basic Problems
Diagnosing and Resolving Basic Problems
PQVs and the The GeneMapper® Software has a system of Process Quality Values
Troubleshooting (PQVs) that provide the basis for troubleshooting fragment analysis
Process data using the software. PQVs are application-specific metrics, where
each evaluates the data for a specific quality that is consistent with a
problem associated with the type of analysis. In this way, the PQV
system can alert you to potential problems and provide you with a
starting point for investigation.
About Process Each individual PQV displays the result of a unique algorithmic test
Quality Values that evaluates a specific property of the fragment analysis data. The
(PQVs) software performs the PQV tests in a specific sequence during the
analysis. With the exception of the Sizing Quality (SQ) PQV, the
software completes the analysis of each sample in a project even if a
sample fails one or more PQV tests.
The majority of PQV metrics yield numeric values between 0 and 1,
where 1 indicates that the related sample data or genotype completely
passed the associated test. Following the analysis, the software uses
the upper and lower thresholds for each PQV to translate the numeric
score into one of three symbols, displayed in the Samples or
Genotypes tab of the GeneMapper window.
Note: If the thresholds of a PQV can be customized, the software
displays the parameters in the Quality Flags tab of the analysis method.
Default
Symbol Definition
Range
Pass: The sample or genotype passed the PQV 0.75 to 1.0
test.
Check: A possible problem exists for the sample 0.25 to 0.75
or genotype.
Low Quality/Fail: There is a strong possibility that 0.0 to 0.25
a problem exists for the sample or genotype.
Note: Applied Biosystems recommends examining all samples that
produce (Check) or (Low Quality).
2 GeneMapper® Software Version 4.1 Reference and Troubleshooting GuideChapter 1 Process Quality Values and Basic Troubleshooting
Diagnosing and Resolving Basic Problems
Note: The Allele Display Overflow (ADO) and Allele Edit (AE)
PQVs of the Genotypes tab report their results as instead of the
colored icons.
Note: The GeneMapper Software does not complete the analysis of
samples that display (Low Quality) for the Sizing Quality (SQ)
PQV test.
Adjusting the Threshold Settings of PQV Tests
Some PQV metrics include components that can be customized. In
those cases, the user-defined parameters for the PQV appear in the
Peak Quality tab of analysis methods for the applicable analysis type.
Adjusting the Weights of PQV
The majority of PQV contribute to the Genotype Quality (GQ) PQV, a
metric used to gauge the confidence of each genotype call. In those
cases, some PQV contain user-defined weights that determine how
significantly the associated PQV affect the GQ PQV calculation. For
those PQV, the user-defined weights appear in the Quality Flag tab of
analysis methods for the applicable analysis type. For more information
on the calculation of the GQ PQV, see “GQ (Genotype Quality)” on
page 13.
Note: You can configure a PQV so that it does not contribute to the
GQ (by setting the weight to 0). However, the PQV remains active.
Rules for PQV Columns
• Quality metrics with Pass/ Check values and no Low
Quality values are warning flags. Analysis does not stop if problems
are detected with these properties, but Applied Biosystems
recommends examining results flagged as (Check).
• Holding the cursor over a column header displays a tooltip that lists
the full name of the column (the default names are often acronyms).
GeneMapper® Software Version 4.1 Reference and Troubleshooting Guide 3Chapter 1 Process Quality Values and Basic Troubleshooting
Diagnosing and Resolving Basic Problems
Table 1-1 PQV values by application
Analysis
PQVs
SNaPshot®
Microsatelite
See Page
SNPlex™
System
System
AFLP®
Other
Abb. Name
Kit
2n
ADO Allele Display Overflow ✔ ✔ ✔ ✔ ✔ 8
AE Allele Edit ✔ ✔ ✔ ✔ ✔ 8
AN Allele Number ✔ ✔ ✔ ✔ 9
BD Broad Peak ✔ ✔ ✔ ✔ ✔ 9
BIN Out of Bin Allele ✔ ✔ ✔ 10
CC Control Concordance ✔ ✔ ✔ ✔ 11
DP Double Peak ✔ 12
GQ Genotype Quality ✔ ✔ ✔ ✔ ✔ 13
LPH Low Peak Height ✔ ✔ ✔ ✔ 15
MNF Matrix Not Found ✔ ✔ ✔ ✔ 16
NB Narrow Bin ✔ 18
OBA One Basepair Allele ✔ 18
OS Off-Scale ✔ ✔ ✔ ✔ ✔ 19
PHR Peak Height Ratio ✔ ✔ ✔ ✔ 21
SFNF Sample File Not Found ✔ ✔ ✔ ✔ ✔ 22
SHP Sharp Peak ✔ 23
SNF Size Standard Not Found ✔ ✔ ✔ ✔ ✔ 23
SP Split Peak ✔ 24
SPA Single Peak Artifact ✔ 24
SPU Spectral Pull-Up ✔ ✔ ✔ ✔ ✔ 25
SQ Sizing Quality ✔ ✔ ✔ ✔ ✔ 25
XTLK Cross Talk ✔ ✔ ✔ 8
4 GeneMapper® Software Version 4.1 Reference and Troubleshooting GuideChapter 1 Process Quality Values and Basic Troubleshooting
Diagnosing and Resolving Basic Problems
Common Troubleshooting Procedures
About the Procedures commonly used to troubleshoot errors and irregularities
Procedures in fragment analysis data:
■ Displaying Sample Information/Raw and EPT Data . see below
■ Displaying Numeric PQV Metrics . . . . . . . . . . . . . . . . . . . . . . 7
Displaying Sample 1. In the GeneMapper window, select the Samples tab.
Information/Raw
and EPT Data 2. In the Navigation Pane of the GeneMapper window:
a. Click to expand the contents of the project folder.
b. From the list of samples, select a sample that displayed
(Check) or (Low Quality).
3. Select the Info, Raw Data, and EPT Data tabs as needed to
display the sample information for the selected file.
• Info tab – Displays a summary of all information for the
associated sample file (see Table 1-2 on page 6).
• Raw Data tab – Displays an electropherogram of spectral
data collected during the run of the associated sample. The
spectral data is displayed in relative fluorescent units (RFU).
• EPT Data tab – Displays the EPT (electrical, power, and
temperature) data for the associated sample throughout the
course of the run.
Note: Table 1-2 lists only the information contained in the Info tab
that is relevant to troubleshooting. For a complete description of the
elements listed in the Info tab, see the GeneMapper® Software Online
Help.
GeneMapper® Software Version 4.1 Reference and Troubleshooting Guide 5Chapter 1 Process Quality Values and Basic Troubleshooting
Diagnosing and Resolving Basic Problems
Table 1-2 Info Tab information relevant to troubleshooting
Group Description/Information
Sample Describes the source and status of the imported sample data.
Information
Sample Origin Path – Displays the path to the associated sample file at the time it
was imported (provided that the sample was added to the project from a sample
file).
Status Message – Displays information related to any events that occurred when
the sample was imported into the project.
Error Message Displays any errors the software encounters during the analysis of the associated
sample. You can use the information in this group to verify the source of several
analysis problems.
Current Settings Describes the analysis settings currently applied to the associated sample.
All of the data displayed in this group is useful for troubleshooting problems with
the GeneMapper Software. Although, most of the information can be viewed in
various parts of the software, the Current Settings group summarizes all the
information in a single location for easier access.
Run Information Provides basic information about the configuration of the compatible
Applied Biosystems electrophoresis instrument and the run itself.
Instrument Name – Displays the name of the instrument used to run the sample.
The instrument name is important when diagnosing trends in analysis errors that
can be traced back to the instrument used to run the failed sample(s).
Data Collection Ver – Displays the version number of the Data Collection
Software used to run the sample.
Data Collection Describes the configuration of the Data Collection Software at the time the sample
Settings was run.
The data displayed in this group can be used to troubleshoot problems caused by
modifications to run modules. By comparing the Data Collection Settings
information from passing and failing runs, you can identify any changes made to
the run module (intentional or unintentional) that may have caused or contributed
to the failure.
Note: The data displayed in the EPT tab provides a log of the actual parameters
throughout the run.
Capillary Provides the basic specifications of the capillary array used to run the sample.
Information
Capillary Number – Displays the number of the capillary used to run the
associated sample. Like the instrument name, the capillary number is important
when diagnosing trends in analysis errors that can be traced back to the capillary
used to run the failed sample(s).
6 GeneMapper® Software Version 4.1 Reference and Troubleshooting GuideChapter 1 Process Quality Values and Basic Troubleshooting
Diagnosing and Resolving Basic Problems
Displaying By default, the GeneMapper Software displays (Pass), (Check),
Numeric PQV or (Low Quality) in some PQV columns to represent the numeric
Metrics score of the associated quality metric. When troubleshooting quality
errors, it is often more useful to configure the software to display
numeric representations of the quality values.
For example, the Sizing Quality (SQ) PQV evaluates the similarity
between the fragment pattern defined by the size standard definition and
the actual size standard peak distribution pattern in the sample data. The
Sizing Quality metric yields a value between 1 and 0 that represents a
combination of statistical measures for the size calling method used to
perform the analysis. Based on the PQV Threshold settings of the
Quality Flags tab, the software displays (Pass), (Check), or
(Low Quality) to indicate the result of the Sizing Quality calculation.
Sizing Quality Representation Samples Table Example
Symbols
(default)
Numbers
(recommended for troubleshooting)
To display numerical representations of the quality metrics:
1. Select ToolsOptions, then select the Analysis tab.
2. In the Quality Metrics Display settings, select Numbers.
3. Click OK to apply the settings.
GeneMapper® Software Version 4.1 Reference and Troubleshooting Guide 7Chapter 1 Process Quality Values and Basic Troubleshooting
ADO (Allele Display Overflow)
ADO (Allele Display Overflow)
Description/ The ADO PQV indicates that the number of alleles called for the
Function associated sample at the specified marker exceeds the Allele Setting in
the Genoptypes tab of the table setting. Because the software is
configured to display fewer alleles than are present, the data for the
additional allele is hidden from view.
Note: For each allele detected by the software, the Genotypes tab
displays six columns: name, size, height, area, mutation, and comments.
Expected Values – Indicates that the associated sample contains a number of
alleles at the specified marker that is greater than the user-defined
limit.
Troubleshooting Select the affected genotype, click (AnalysisDisplay Plots),
then review the affected sample for miscalled peaks.
AE (Allele Edit)
Description/ The AE PQV indicates whether or not a user modified the allele call
Function for the associated genotype.
Note: Allele calls can be modified in the Samples Plot, the
Genotypes Plot, and the Cluster Plot.
Expected Values – Indicates that the associated genotype call has been edited.
8 GeneMapper® Software Version 4.1 Reference and Troubleshooting GuideChapter 1 Process Quality Values and Basic Troubleshooting
AN (Allele Number)
AN (Allele Number)
Description/ The AN PQV indicates that the associated sample contains either:
Function • A number of alleles at the specified marker that exceeds the
Max Expected Alleles setting (in the Peak Quality tab of the
analysis method)
or
• No alleles are present at the specified marker
Expected Values (Pass) or (Check)
Troubleshooting Select the affected genotype(s), click (AnalysisDisplay Plots),
then review the sample data at the affected marker for additional peaks
or for the absence of peaks.
BD (Broad Peak)
Description/ The BD PQV indicates that the width of the peak for the associated
Function genotype exceeds the Max peak width setting (in the Peak Quality tab of
the analysis method).
Note: When the BD PQV is triggered, the software reduces the GQ
PQV by 50% because the default multiplier is 0.5.
Expected Values (Pass) or (Check)
Troubleshooting Select the affected genotype, click (AnalysisDisplay Plots),
then review the associated peak for irregularities.
GeneMapper® Software Version 4.1 Reference and Troubleshooting Guide 9Chapter 1 Process Quality Values and Basic Troubleshooting
BIN (Out of Bin Allele)
BIN (Out of Bin Allele)
Description/ The BIN PQV indicates that the apex of the peak for the associated
Function genotype is outside of the boundaries that define the associated bin.
Note: When the BIN PQV is triggered, the software reduces the GQ
PQV by 80% because the default multiplier is 0.8.
Note: For human identification (HID) analysis, the BIN PQV is
displayed as the OL (Off-Ladder Alleles) PQV.
Expected Values (Pass) or (Check)
Troubleshooting Select the affected genotype, click (AnalysisDisplay Plots),
then review the allele(s) at the appropriate bin location.
Symptom Possible Cause Solution
BIN PQV displays After using Auto Bin to generate bins, Correct the SPA flag by editing the
(Check) the software did not create a bin for an marker minimum fragment length,
allele peak because it considered the then reanalyze and perform the Auto
peak to be a single peak artifact. The Bin again.
SPA flag was triggered because the
software did not detect any stutter
peaks to the left of the allele peak; a
result of the minimum fragment length
for the marker being set too high
The GeneMapper Software detected In the Samples tab of the
an allele peak that did not fit into any GeneMapper window, set the Sample
of the defined bins because the bins Type of the sample containing the
were not calibrated to the allelic allelic ladder to Allelic Ladder.
ladder; a result of a sample file
containing an allelic ladder that is not
designated as an allelic ladder in the
Samples tab.
You generated bins using the Auto Bin View the allele peak(s) for the marker
function but the GQ value for a marker in the Genotypes Plot window.
was less than the Minimum Quality Determine if the allele peaks(s) are
Value of 0.1 (as set in the Auto Bin valid. If so, manually create bin(s) for
dialog box). the peak(s).
10 GeneMapper® Software Version 4.1 Reference and Troubleshooting GuideChapter 1 Process Quality Values and Basic Troubleshooting
CC (Control Concordance)
CC (Control Concordance)
Description/ The CC PQV indicates that the associated control sample does not
Function exactly match the defined alleles for the related marker.
IMPORTANT! Applied Biosystems recommends running the control
sample at least once for every panel.
Note: The CC PQV serves primarily as an internal control for quality
assurance.
Expected Values (Pass) or (Check)
Troubleshooting Select the affected control sample in the Samples tab of the GeneMapper
window, click (AnalysisDisplay Plots), then review the positions
of the peaks relative to the bins.
Symptom Possible Cause Solution
CC PQV displays The allele calls of the sample defined Run the correct positive control and
(Check) as the Positive Control in the Samples add the sample file to the project,
tab do not match the Positive Control then define the sample as the
allele calls in the marker definition Positive Control in the Samples tab
because the well contains the of the GeneMapper window.
incorrect positive control sample.
The allele calls of the sample defined Edit the Positive Control allele calls in
as the Positive Control in the Samples the marker definition in the Panel
tab do not match the positive control Manager.
allele calls in the marker definition
because the alleles were defined
incorrectly.
The sample defined as the Negative Rerun the negative control and add
Control contains an “allele peak” due the sample file to the project, then
to the presence of a spike caused by define the sample as the Negative
dust or a gas bubble. Control in the Samples tab of the
GeneMapper window.
GeneMapper® Software Version 4.1 Reference and Troubleshooting Guide 11Chapter 1 Process Quality Values and Basic Troubleshooting
DP (Double Peak)
DP (Double Peak)
Description/ The DP PQV indicates that the peak for the associated genotype:
Function • Resides in a bin with another peak of the same dye color
and
• The ratio of the peak height (minor/major peak height) is greater
than the Double Peak setting in the Peak Quality tab of the
Analysis Method
Expected Values (Pass) or (Check)
Troubleshooting Select the affected genotype, click (AnalysisDisplay Plots), then
review the sample data at the appropriate bin for additional peaks.
Symptom Possible Cause Solution
DP PQV displays A problem with the chemistry is Check primer lengths and
(Check) causing peaks from two different electrophoresis conditions and
markers not to resolve, possibly adjust as necessary.
because either of the primers are too
similar in length or the mobilities of
the two primer fragments are similar.
12 GeneMapper® Software Version 4.1 Reference and Troubleshooting GuideChapter 1 Process Quality Values and Basic Troubleshooting
GQ (Genotype Quality)
GQ (Genotype Quality)
Description/ The GQ PQV provides a summary of the quality metrics for each
Function genotype. The GQ value is a calculated combination of the relevant,
weighted PQVs and the Marker Quality value for the genotype.
Calculation of the Genotype Quality (GQ) Metric
The formulas used by the GeneMapper Software to calculate the GQ
value are analysis-specific, and differ largely based on the PQVs
supported by each application. The following general formula
describes the genotype quality calculation:
GQ = MQ × ( ( 1 – BD ) × ( 1 – OS ) × … × ( 1 – SPU ) )
where the Marker Quality (MQ) value is modified by the user-defined
PQVs to generate the final GQ value, and the PQVs are weighted from 0
to 1. The actual value of each PQV in the equation is 1 minus the weight
assigned in the Quality Flags tab of the analysis method used to analyze
the data.
PQV Weight Net Effect on GQ Calculation
0 No effect on the GQ calculation
The initial value of 1 minus the weight of 0 yields a PQV of
1. When used in the GQ calculation, the PQV has no effect
since 1 ∞ MQ = MQ.
1 Reduces the GQ value to 0
The initial value of 1 minus the weight of 1 yields a PQV of
0. When used in the GQ calculation, the PQV automatically
causes the GQ to fail since 0 ∞ MQ = 0.
0Chapter 1 Process Quality Values and Basic Troubleshooting
GQ (Genotype Quality)
Calculation of the Marker Quality Metric
Figure 1-1 shows how the GeneMapper Software generates a Marker
Quality (MQ) value from sample peak data with assigned Allele
Quality (AQ) values. AQ values are a function of quality value
assignments for: sizing quality, allele calling quality, bin assignment
quality, and bin quality.
Note: When analyzing SNPlex™ System sample data, the GeneMapper
Software calculates GQ values depending on the method (Model or
Rules) selected to perform allele calling. The following figure
illustrates the derivation of GQ values using the Rules method.
AQ
AQ
AQ
x (AQ) = MQ
AQ
GR2119
Figure 1-1 Calculation of the Marker Quality metric
Expected Values (Pass), (Check), or (Fail)
Note: The software assigns the GQ PQV flags based on the PQV
threshold settings in the Quality Flags tab of the analysis method.
Troubleshooting Review the PQV for the affected genotype to determine the metric that
is causing the GQ PQV to fail.
Note: To better determine how individual PQV contribute to the GQ
PQV, configure the software to display the PQV numerically, as
explained in “Displaying Numeric PQV Metrics” on page 7.
14 GeneMapper® Software Version 4.1 Reference and Troubleshooting GuideChapter 1 Process Quality Values and Basic Troubleshooting
LPH (Low Peak Height)
LPH (Low Peak Height)
Description/ The LPH PQV indicates that the height of the peak for the associated
Function genotype is lower than the associated heterozygous or homozygous
height limit that is specified in the analysis method. You can set
homozygous value (default is 200) and heterozygous value (default is
100) in the Peak Quality tab of the analysis method.
Note: When the LPH PQV is triggered, the software reduces the GQ
PQV by 50% (the default multiplier is “0.5”).
Expected Values (Pass) or (Check)
Troubleshooting Select the affected genotype, click (AnalysisDisplay Plots),
then review the associated peak for irregularities.
GeneMapper® Software Version 4.1 Reference and Troubleshooting Guide 15Chapter 1 Process Quality Values and Basic Troubleshooting
MNF (Matrix Not Found)
MNF (Matrix Not Found)
Description/ The MNF PQV indicates whether or not the GeneMapper Software
Function can access the matrix specified in the Matrix column of the Samples
tab for the associated sample.
IMPORTANT! Because recent models of Applied Biosystems
instruments save matrix data to the sample files they create, the MNF
flag is applicable only to sample files created by the ABI PRISM® 310
and 377 instruments.
Expected Values (Pass) or (Check)
Troubleshooting Determine the name of the missing matrix file(s) by reviewing the
sample information for the affected samples, as explained in
“Displaying Sample Information/Raw and EPT Data” on page 5.
Symptom Possible Cause Solution
MNF PQV displays The software could not Locate the missing matrix file, then import it as
(Check) access the matrix file explained in “Importing a Matrix File (Windows®
specified in the Matrix Only)” on page 16
column for the associated
If the sample files for the matrix standards used
sample file.
to create the missing matrix are available, re-
create the matrix as explained in “Generating a
Matrix” on page 17.
Importing a IMPORTANT! You must convert matrix files created by Macintosh®
Matrix File computers before importing them. The conversion utility is free and
(Windows® Only) available from the software support section of the Applied Biosystems
website (www.appliedbiosystems.com/support/software/).
1. Click (ToolsGeneMapper Manager).
2. In the GeneMapper Manager, select the Matrices tab, then
click Import.
3. In the Importing Matrix dialog box, navigate to and select the
matrix file, then click Import.
4. Click Done to close the GeneMapper Manager, then analyze the
project.
16 GeneMapper® Software Version 4.1 Reference and Troubleshooting GuideChapter 1 Process Quality Values and Basic Troubleshooting
MNF (Matrix Not Found)
Generating a 1. Click (ToolsGeneMapper Manager).
Matrix
2. In the GeneMapper Manager, select the Matrices tab, then
click New.
3. In the Matrix Editor dialog box:
a. Type a name and description for the matrix.
b. In the Number of Dyes drop-down list, select the number of
dyes present in the matrix (4 or 5).
c. Click B, navigate to and select the sample file for the blue
matrix standard, then click Open.
d. Repeat step 3c for the remaining dyes in the matrix (Green,
Yellow, Red, and Orange if applicable).
e. Click Create to create the matrix.
f. Click OK.
Size standard
name
Size standard dye
channel
Fragment sizes
for the size
standard
Generated matrix
data
4. Click Done to close the GeneMapper Manager.
5. In the Matrix column of the Samples tab, select the new matrix,
then analyze the project.
GeneMapper® Software Version 4.1 Reference and Troubleshooting Guide 17Chapter 1 Process Quality Values and Basic Troubleshooting
NB (Narrow Bin)
NB (Narrow Bin)
Description/ The NB PQV indicates that the apex of the associated peak for the
Function associated genotype is present within 0.5 base pairs of a bin that does
not contain a peak. This PQV is designed to capture peaks that are
outside of bin boundaries because of incorrect bin definitions.
Expected Values (Pass) or (Check)
Troubleshooting Select the affected genotype, click (AnalysisDisplay Plots),
then review the peak at the appropriate bin location.
Symptom Possible Cause Solution
NB PQV displays You created a bin that is too narrow In the Panel Manager, edit the bin
(Check) to contain its associated allele peak. width and/or location so that it
contains the allele peak.
OBA (One Basepair Allele)
Description/ The OBA PQV indicates, for the associated genotype, that the apex
Function of the associated peak is present at a position within 1 base pair of
another peak.
Expected Values (Pass) or (Check)
Troubleshooting Select the affected genotype, click (AnalysisDisplay Plots),
then review the allele at the appropriate bin location for a
microvariant peak or an invalid allele call.
18 GeneMapper® Software Version 4.1 Reference and Troubleshooting GuideChapter 1 Process Quality Values and Basic Troubleshooting
OS (Offscale)
OS (Offscale)
Description/ The OS PQV is displayed in both the Samples and Genotypes tabs of
Function the GeneMapper window, but the function of the OS PQV in each tab
differs in the following way:
• OS PQV for the Samples tab – The signal associated with the
size standard of the specified sample contains one or more peaks
that exceed the maximum detectable range.
• OS PQV for the Genotypes Tab – The signals associated with
the given sample contain one or more peaks that exceed the
maximum detectable range.
Note: When the OS PQV of the Genotypes tab is triggered, the
software reduces the GQ PQV by 50% (the default multiplier is “0.5”).
Expected Values (Pass) or (Check)
Troubleshooting 1. In the GeneMapper window, select the Samples tab.
2. In the Navigation Pane, click to expand the project folder, then
select the sample that displays (Check) in the OS column.
3. Select the Raw Data tab to display the electropherogram of
normalized spectral data collected during the associated sample run.
The spectral data is displayed in Relative Fluorescent Units (RFU).
4. Review the data for offscale peaks.
Offscale peak
(primer peak)
5. Use Table 1-3 on page 20 to determine an appropriate corrective
action.
GeneMapper® Software Version 4.1 Reference and Troubleshooting Guide 19Chapter 1 Process Quality Values and Basic Troubleshooting
OVL (Overlap)
Table 1-3 OS PQV Troubleshooting
Symptom Possible Cause Solution
• MNF PQV in the Samples tab displays Too much size No action necessary. The data
(Check) standard injected cannot be manipulated to remove
• Raw data contains multiple off-scale into the capillary the oversized peaks.
size standard peaks Decrease the quantity of size
standard used in subsequent runs.
Also, make sure to use Hi-Di
Formamide as the loading reagent.
IMPORTANT! Water loading can
produce artificially high signal and
is not recommended.
• MNF PQV in the Genotypes tab Too much sample No action necessary. The data
displays (Check) injected into the cannot be manipulated to remove
• Raw data contains multiple off-scale capillary the oversized peaks.
peaks in the signal(s) associated with Decrease the quantity of sample
the sample fragments used in subsequent runs.
OVL (Overlap)
Description/ The OVL PQV indicates that the peak for the associated genotype
Function has been called twice by the GeneMapper Software. If the ranges of
two bins overlap, a peak can reside in both bins and, therefore, be
called twice, once for each allele.
Expected Values (Pass) or (Check)
Troubleshooting Select the affected genotype, click (AnalysisDisplay Plots),
then review the peak and associated bins at the appropriate location.
20 GeneMapper® Software Version 4.1 Reference and Troubleshooting GuideChapter 1 Process Quality Values and Basic Troubleshooting
PHR (Peak Height Ratio)
PHR (Peak Height Ratio)
Description/ The PHR PQV indicates that the apex of the peak for the associated
Function genotype is:
• Present at a position within 1 base pair of another peak
and
• The ratio of the height of the lower peak to that of the higher
peak is less than the Minimum Peak Height Ratio setting in the
Peak Quality tab of the analysis method.
Note: For LMS markers, the ratio is calculated based on the peak
heights of the called allele peaks.
Note: For SNaPshot® kit analysis, the ratios are calculated as they
are for microsatellite markers except that they span two different
colors, and only two peaks are used in the calculation.
Expected Values (Pass) or (Check)
Troubleshooting Select the affected genotype, click (AnalysisDisplay Plots),
then review the peaks at the appropriate location.
Symptom Possible Cause Solution
PHR PQV displays The sample has undergone Loss of Normal occurrence. No action
(Check) Heterozygosity (LOH). A difference necessary.
in peak heights between alleles is
Further evaluate the sample for LOH
expected.
using the Report Settings Editor and
Report Manager.
For more information, see the
GeneMapper® Software Version 4.1
LOH Analysis Getting Started Guide
(PN 4403621).
GeneMapper® Software Version 4.1 Reference and Troubleshooting Guide 21Chapter 1 Process Quality Values and Basic Troubleshooting
SFNF (Sample File Not Found)
SFNF (Sample File Not Found)
Description/ The SFNF PQV indicates whether or not the software can access the
Function sample file (*.fsa) shown in the Sample File column of the associated
sample. When the software adds a sample to a project from a sample file,
it retains a link to the original file. The software displays (Check) in
the SFNF column if the sample file is deleted, renamed, or moved.
Expected Values (Pass) or (Check)
Troubleshooting Determine the name and location of the missing sample file:
1. In the GeneMapper window, select the Samples tab.
2. In the Navigation Pane of the GeneMapper window, click to
expand the contents of the project folder, then select the sample
that display (Check) in the SFNF column.
3. Select the Info tab, then note the name (Sample File) and
location (Sample Origin Path) of the sample.
Symptom Possible Cause Solution
SFNF PQV displays Sample file has been Search the local drives of the computer for the
(Check) renamed, moved, or sample file, then do one of the following:
deleted.
• If you cannot find the file, no further action can
be taken to resolve the PQV flag.
• If you find the file, use the Associate Sample
feature to direct the software to the new
location as follows:
a. In the Samples tab of the GeneMapper
window, select the affected samples.
b. Select FileAssociate Samples.
c. In the Select Folder dialog box, select the
folder containing the missing files, then
click Select.
22 GeneMapper® Software Version 4.1 Reference and Troubleshooting GuideChapter 1 Process Quality Values and Basic Troubleshooting
SHP (Sharp Peak)
SHP (Sharp Peak)
Description/ The SHP PQV indicates that the peak for the associated genotype is
Function part of a cluster of peaks with a large, narrow peak in the middle
whose width is 50% less than either of the neighboring peaks.
Expected Values (Pass) or (Check)
Troubleshooting Select the affected genotype, click (AnalysisDisplay Plots),
then review the peak at the appropriate location.
SNF (Size Standard Not Found)
Description/ The SNF PQV indicates whether or not the GeneMapper Software
Function can access the size standard definition specified in the Size Standard
column for the associated sample.
Expected Values (Pass) or (Check)
Troubleshooting Verify that the software does not contain the desired size standard:
1. In the Samples tab of the GeneMapper window, note the name
of the size standard assigned to the affected sample.
2. Click (ToolsGeneMapper Manager).
3. In the GeneMapper Manager, select the Size Standards tab.
4. Verify that the Size Standard tab does not list the missing size
standard, or that it has not been renamed.
Symptom Possible Cause Solution
SNF PQV displays (Autoanalysis only) The size Do one of the following:
(Check) standard may have been set
• If using an Applied Biosystems
incorrectly in the plate record of the
size standard, click Import to
Data Collection Software.
import the definition from the
The size standard definition has been default Panels folder.
renamed, deleted, or does not exist. • Click New to create a custom
size standard of the same name.
GeneMapper® Software Version 4.1 Reference and Troubleshooting Guide 23Chapter 1 Process Quality Values and Basic Troubleshooting
SP (Split Peak)
SP (Split Peak)
Description/ The SP PQV indicates that the peak for the associated genotype is
Function part of a pair of overlapping peaks that are less than 0.25 base pairs
apart (the horizontal distance between two peak apexes).
Expected Values (Pass) or (Check)
Troubleshooting Select the affected genotype, click (AnalysisDisplay Plots),
then review the peak at the appropriate location.
SPA (Single Peak Artifact)
Description/ The SPA PQV indicates that no peaks are present within a two-base-
Function pair range before the peak for the associated genotype. This PQV is
designed to detect the absence of stutter peaks that accompany
microsatellite peaks.
Expected Values (Pass) or (Check)
Troubleshooting Select the affected genotype, click (AnalysisDisplay Plots),
then review the peak at the appropriate location.
Symptom Possible Cause Solution
SPA PQV displays The GeneMapper Software did not In the Panel Manager, edit the
(Check) detect any stutter peaks to the left of marker minimum fragment length,
the allele peak because the then reanalyze.
minimum fragment length for the
marker was set too high.
24 GeneMapper® Software Version 4.1 Reference and Troubleshooting GuideChapter 1 Process Quality Values and Basic Troubleshooting
SPU (Spectral Pull-Up)
SPU (Spectral Pull-Up)
Description/ The SPU PQV indicates that the apex of the peak for the associated
Function genotype is at a position where the marker signal contains pull-up
peaks (also called bleed-through peaks). Pull-up peaks occur when
the peak height of the called allele is less than X% of the larger peak
that is within ±1 data point.
Expected Values (Pass) or (Check)
Troubleshooting Select the affected genotype, click (AnalysisDisplay Plots),
then review the peak at the appropriate location.
SQ (Sizing Quality)
Description/ The SQ PQV reports the result of the Sizing Quality test, which gauges
Function the similarity between the fragment pattern defined by the size
standard definition, and the actual distribution of size standard peaks in
the sample data. The metric of the Sizing Quality test is a combination
of several values which measure the success of the algorithms that:
• Identify and eliminate primer peaks based on peak shape
• Perform size matching (ratio matching)
• Make a size-calling curve using the chosen sizing method
The Sizing Quality metric yields a value between 0 and 1. Based on the
PQV Threshold settings in the analysis method used to analyze the
data, the software translates the metric into the (Pass), (Check),
or (Low Quality) flags to indicate the result of the test.
Note: The GeneMapper Software does not complete the analysis of
samples that fail the Sizing Quality test (samples that display ).
Expected Values (Pass), (Check), or (Low Quality)
Note: When performing size calling using the Classic sizing method,
the software cannot determine Sizing Quality and, therefore, SQ is
always (Check).
GeneMapper® Software Version 4.1 Reference and Troubleshooting Guide 25Chapter 1 Process Quality Values and Basic Troubleshooting
SQ (Sizing Quality)
Troubleshooting Review the data of the size standards that failed the SQ PQV:
1. In the Samples tab of the GeneMapper window, click
(AnalysisLow Quality to Top) to sort the data so that the
samples that produced errors appear at the top of the table.
2. In the Samples tab, select the rows for the sample(s) that display
(Check) or (Fail) in the SQ column.
3. Click (AnalysisSize Match Editor) to view the sizing
information for the selected sample(s).
4. In the Navigation Pane of the Size Match Editor, select a sample
file to display the sizing data for the associated sample.
5. Review the data for the following qualities:
• Signal Strength – The signal strength (peak height) of all
peaks must exceed the Peak Detection Threshold defined in
the analysis method used to analyze the data.
• Correct Size Calls/Labels – All peaks must be correctly
identified by the software. The labels above the peaks must
be in sequential order from left to right, least to greatest.
• Evenness of Signal Strength – All peaks should have
relatively uniform signal strengths.
• Sizing Quality – The sizing quality of each sample should
be within the passing range for your chemistry application.
Note: To magnify the plot of the Size Matches tab, drag the
mouse cursor ( ) across a region of the x- or y-axis.
6. Use Table 1-4 on page 27 to determine an appropriate corrective
action.
7. Repeat steps 4 through 6 for each sample file.
26 GeneMapper® Software Version 4.1 Reference and Troubleshooting GuideChapter 1 Process Quality Values and Basic Troubleshooting
SQ (Sizing Quality)
Table 1-4 SQ PQV Troubleshooting
Symptom Possible Cause Solution
• SQ PQV displays or The Size Standard Dye setting for 1. Verify that the correct size
• Size Match Editor does not the size standard definition is not standard definition is in use.
display peak data set to the correct dye.
2. Open the size standard
• SQ PQV displays or The fragment sizes of the size definition and verify that the:
• Peaks do not contain size standard definition do not match – Dye setting is set to the
labels the positions of the detected correct dye
peaks. – Fragment sizes are correct
3. Modify the size standard
definition as necessary.
• SQ PQV displays or Peak detection threshold Adjust the analysis method so
• One or more miscalled peaks associated with the size standard that the peak detection threshold
is set too high or low. associated with the size standard
is greater than the height of the
• SQ PQV displays or Peak detection threshold
miscalled peak. See “Adjusting
• Peaks are clear and associated with the size standard
Peak Detection Thresholds” on
distinguishable, but have is set too high or low.
page 29 for more information.
low signal strength
Electrophoresis or pipetting error
• SQ PQV displays or Insufficient cleanup step Create and analyze the data
• Size standard peaks occur using a custom size standard
within a primer peak that does not include the
undetectable peak. See
“Correcting Miscalled Peaks” on
page 28 for more information.
• SQ PQV displays or Incorrect concentration of size Increase the concentration of
• Size standard peaks are clear standard in sample loading size standard added to
and distinguishable, but reagent subsequent runs.
consistently have low signal
strength Incorrect injection settings Review the injection settings of
the run module for errors.
• SQ PQV displays or • Electrophoresis or pipetting See the user manual for your
• Peaks are clear and error Applied Biosystems
distinguishable, but have • Defective capillaries/arrays electrophoresis instrument for
low signal strength information on troubleshooting
• Sizing failures occur in a defective capillaries/arrays.
regular pattern (the same
wells fail repeatedly)
• SQ PQV displays or Defective capillary
• Size calling errors occur for
different samples on the same
capillary over multiple runs
GeneMapper® Software Version 4.1 Reference and Troubleshooting Guide 27Chapter 1 Process Quality Values and Basic Troubleshooting
SQ (Sizing Quality)
Correcting You can use the Size Match Editor to correct peaks that are miscalled
Miscalled Peaks by the GeneMapper Software.
To correct a miscalled size standard:
1. In the Navigation Pane of the Size Match Editor, select the
sample file containing the miscalled peak.
2. Remove the label from the miscalled peak:
a. Select the peak with the label by clicking inside the body of
the peak.
b. Select EditDelete Size Label (or right-click the peak,
then select Delete).
3. Apply the label to the correct peak:
a. Select the correct peak.
b. Select EditAdd Size Label (or right-click the peak, then
select Add).
c. In the Select Size dialog box, double-click the label to
apply to the selected peak.
4. Click (ToolsCheck Sizing Quality) to verify that the
sample sizes correctly.
5. Click Apply to save the changes, then click OK.
IMPORTANT! You must click Apply to reanalyze the sample.
Note: Observe that the cell in the Status column for the sample
now displays (Analysis Required).
6. Reanalyze the sample using the new setting to verify that the
problem is resolved.
28 GeneMapper® Software Version 4.1 Reference and Troubleshooting GuideChapter 1 Process Quality Values and Basic Troubleshooting
SQ (Sizing Quality)
Adjusting Peak You can resolve a significant number of sizing failures by adjusting
Detection the peak detection thresholds of the analysis method for a project.
Thresholds The software identifies peaks that exceed the threshold for each
associated dye channel, but it cannot identify peaks that fall below it.
Samples that exhibit low signal intensity (low peak heights) can
occasionally fail sizing because one or more peaks fall below the
threshold defined in the analysis method. By lowering the threshold
of the appropriate dye channel, the software can call the peak(s)
correctly.
In contrast, when the signals of the size standard peaks are very high,
the software may misidentify a shoulder preceding a peak as the main
peak (see Figure 1-2). Because the shoulder peak does not occur at
the correct position relative to the other peaks, sizing fails. By
adjusting the analysis method so that the threshold value is greater
than the height of the shoulder, you can achieve good sizing.
25-bp shoulder
incorrectly labeled
as a peak
Figure 1-2 Size standard with shoulder incorrectly labeled as a peak
To lower the peak detection thresholds of an analysis method:
1. In the GeneMapper window, click (ToolsGeneMapper
Manager).
2. In the GeneMapper Manager, select the Analysis Methods tab.
GeneMapper® Software Version 4.1 Reference and Troubleshooting Guide 29Chapter 1 Process Quality Values and Basic Troubleshooting
SQ (Sizing Quality)
3. Do one of the following, to:
Modify the current analysis method, go to step 4.
Create a copy of the current analysis method:
a. Select the current analysis method.
b. Click Save As.
c. In the Save As dialog box, type a name for the new method,
then click OK.
4. Select the analysis method you want to modify, then click Open.
5. In the Analysis Method Editor, select the Peak Detector tab.
6. Modify the appropriate Peak Amplitude Threshold settings as
needed. Ideally, you should set the threshold of the appropriate
dye channel to a value less than the signal intensity of the
shortest size standard peak.
Note: Applied Biosystems recommends using Peak Amplitude
Threshold settings of no less than 50 RFU.
Peak Amplitude
Threshold settings
7. Click OK to save the analysis method.
8. Click Done to close the GeneMapper Manager, then reanalyze
the samples using the new analysis method.
30 GeneMapper® Software Version 4.1 Reference and Troubleshooting GuideYou can also read


