Annual epidemiological commentary: Gram-negative bacteraemia, MRSA bacteraemia, MSSA bacteraemia and C. difficile infections, up to and including ...
←
→
Page content transcription
If your browser does not render page correctly, please read the page content below
Annual epidemiological commentary:
Gram-negative bacteraemia, MRSA
bacteraemia, MSSA bacteraemia and
C. difficile infections, up to and
including financial year April 2020 to
March 2021
15 September 2021

1

Annual epidemiological commentary: Gram-negative bacteraemia, MRSA bacteraemia, MSSA
bacteraemia and C. difficile infections

Contents
Executive Summary ..................................................................................................................... 5
 Highlights .............................................................................................................................. 6
Effect of the COVID-19 pandemic on bacteraemia and CDI surveillance .................................... 8
Bacteraemia caused by Gram-negative organisms ................................................................... 11
 Escherichia coli bacteraemia .................................................................................................. 11
 Total reports ........................................................................................................................ 11
 Hospital-onset cases........................................................................................................... 12
 Age and sex distribution...................................................................................................... 13
 Seasonal trends in E. coli bacteraemia ............................................................................... 17
 Primary focus of E. coli bacteraemia................................................................................... 18
 Geographic distribution of E. coli bacteraemia .................................................................... 20
 Klebsiella spp. bacteraemia .................................................................................................... 21
 Total reports ........................................................................................................................ 21
 Hospital onset cases ........................................................................................................... 22
 Distribution of Klebsiella species ........................................................................................ 25
 Age and sex distribution...................................................................................................... 26
 Seasonal trends in Klebsiella spp. bacteraemia ................................................................. 29
 Primary focus of Klebsiella spp. bacteraemia ..................................................................... 29
 Geographic distribution of Klebsiella spp. bacteraemia ...................................................... 31
 Pseudomonas aeruginosa bacteraemia ................................................................................. 32
 Total reports ........................................................................................................................ 32
 Hospital onset cases ........................................................................................................... 33
 Age and sex distribution...................................................................................................... 36
 Seasonal trends in P. aeruginosa bacteraemia .................................................................. 40
 Primary focus of P. aeruginosa bacteraemia ...................................................................... 40
 Geographic distribution of P. aeruginosa bacteraemia ....................................................... 42
 Discussion .............................................................................................................................. 44
Epidemiological analysis of Staphylococcus aureus bacteraemia ............................................. 46
 Meticillin resistant Staphylococcus aureus bacteraemia......................................................... 46
 Total reports ........................................................................................................................ 46
 Hospital-onset reports ......................................................................................................... 47
 Age and sex distribution...................................................................................................... 50
 Source of MRSA bacteraemia ............................................................................................ 53
 Geographic distribution of MRSA bacteraemia ................................................................... 55
 2
Annual epidemiological commentary: Gram-negative bacteraemia, MRSA bacteraemia, MSSA
bacteraemia and C. difficile infections

 Discussion .......................................................................................................................... 55
 Meticillin-susceptible Staphylococcus aureus bacteraemia .................................................... 57
 Total reports ........................................................................................................................ 57
 Hospital-onset reports ......................................................................................................... 58
 Age and sex distribution...................................................................................................... 60
 Source of MSSA bacteraemia ............................................................................................. 62
 Geographic distribution of MSSA bacteraemia ................................................................... 63
 Discussion .......................................................................................................................... 65
Epidemiological analysis of Clostridioides difficile Infection ....................................................... 66
 Hospital-onset reports ......................................................................................................... 67
 Prior trust exposure............................................................................................................. 68
 Seasonal trends in CDI ....................................................................................................... 69
 Age and sex distribution...................................................................................................... 70
 Trends in age and sex ........................................................................................................ 72
 Geographic distribution of CDI ............................................................................................ 73
 Discussion .......................................................................................................................... 74
Appendix .................................................................................................................................... 77
 Background to the mandatory surveillance of MRSA and MSSA bacteraemia ....................... 77
 Mandatory surveillance of C. difficile infection ........................................................................ 78
 Mandatory surveillance of Gram-negative bacteraemia ......................................................... 78
 E. coli bacteraemia ............................................................................................................. 78
 Klebsiella and P. aeruginosa bacteraemia .......................................................................... 78
 A note on terminology............................................................................................................. 79
 Use of mandatory surveillance statistics................................................................................. 79
 E. coli bacteraemia ............................................................................................................. 80
 Klebsiella spp. bacteraemia ................................................................................................ 80
 P. aeruginosa bacteraemia ................................................................................................. 80
 MRSA bacteraemia ............................................................................................................. 80
 MSSA bacteraemia ............................................................................................................. 80
 C. difficile infections ............................................................................................................ 80
 Commentary ........................................................................................................................... 81
 Alternative presentations of the annual data ....................................................................... 81
 Glossary ................................................................................................................................. 82
 Average .............................................................................................................................. 82
 Bacteraemia ........................................................................................................................ 82
 Bias ..................................................................................................................................... 82

 3

Annual epidemiological commentary: Gram-negative bacteraemia, MRSA bacteraemia, MSSA
bacteraemia and C. difficile infections

 Confidence interval (CI) ...................................................................................................... 82
 Denominator ....................................................................................................................... 82
 Epidemiology ...................................................................................................................... 82
 Gram-negative .................................................................................................................... 83
 NHS Sustainability Transformation Partnerships ................................................................ 83
 Mean ................................................................................................................................... 83
 Median ................................................................................................................................ 83
 Mode ................................................................................................................................... 84
 Rate ratio ............................................................................................................................ 84
 Secular trends ..................................................................................................................... 84
Methods ..................................................................................................................................... 85
 Inclusion criteria for reporting to the surveillance system ....................................................... 85
 MRSA bacteraemia ............................................................................................................. 85
 MSSA bacteraemia ............................................................................................................. 85
 E. coli bacteraemia ............................................................................................................. 85
 C. difficile infection .............................................................................................................. 85
 Methods of reporting data on the HCAI Data Capture System (DCS) .................................... 86
 Deadline for entering data................................................................................................... 86
 CCG attribution process ...................................................................................................... 86
 Algorithms for apportioning cases ....................................................................................... 87
 Analysis of data ...................................................................................................................... 89
 Time to onset calculations .................................................................................................. 89
 Denominator data ............................................................................................................... 90
 Rate calculations ................................................................................................................ 91
 Healthcare associated infections in Wales, Scotland and Northern Ireland ........................ 92
References................................................................................................................................. 93

 4
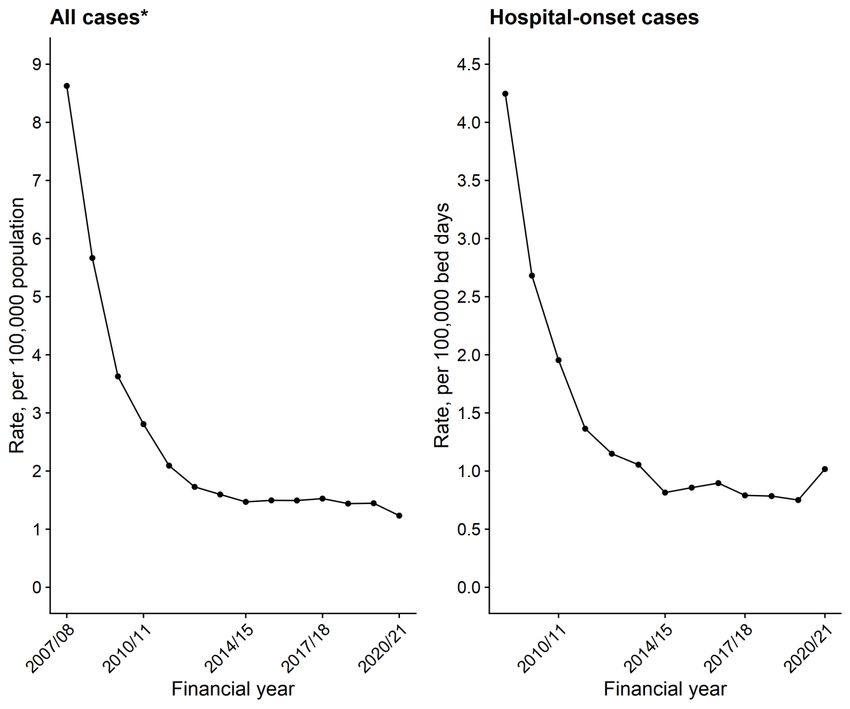
Annual epidemiological commentary: Gram-negative bacteraemia, MRSA bacteraemia, MSSA
bacteraemia and C. difficile infections

Executive Summary
In April 2020 to March 2021, the number of S. aureus and Gram-negative bacteraemia
and CDI cases reported in England declined compared to previous years. This coincided
with the COVID-19 pandemic and the extensive interventions put in place mitigate the
spread of the virus. The COVID-19 pandemic has impacted the counts and rates of
infections covered in this report. Except with Klebsiella spp., incidence rates for all
reported cases of each infection covered in this report declined in April 2020 to March
2021 compared to the previous years. This was likely due to the reduced number of
cases as a result of the reduced hospital activity in the first and second wave of the
pandemic. However, this also contributed to the increases in hospital-onset (HO)
incidence rates. The number of beds occupied overnight is used as the population at risk
to determine hospital-onset incidence rates. Therefore, the relatively large increases in
hospital-onset incidence rates in April 2020 to March 2021 compared to previous years
is partly due to the considerable reduction in admitted patients during that period.

At the height of the second wave of the COVID-19 pandemic in England, the number of
HO meticillin resistant Staphylococcus aureus (MRSA), Klebsiella spp. and
Pseudomonas aeruginosa bacteraemia peaked in January 2021. This was the largest
monthly count of HO cases for the Klebsiella spp. and Pseudomonas bacteraemias,
since the mandatory surveillance of these conditions started in April 2017 to March
2018. Furthermore, for P. aeruginosa and MRSA cases, this was also the first time there
were more HO cases than community-onset (CO) cases during the pandemic period.

Overall, rates of all reported MRSA bacteraemia and Clostridioides difficile (CDI)
infection have declined over time. This is testament to the success of the interventions
introduced to combat these infections. Prior to April 2020 to March 2021, these declines
were observed in both hospital-onset (HO) and community-onset (CO) cases of both
infections however, in April 2020 to March 2021 the number of HO MRSA bacteraemia
cases increase compared to the previous year. This is the first annual increase in HO-
onset MRSA since April 2014 to March 2015 and one of only 2 annual increases since
the start of mandatory surveillance.

In contrast, prior to April 2020 to March 2021, the overall rates of Escherichia coli and
meticillin sensitive Staphylococcus aureus (MSSA) rates had been increasing since the
start of their enhanced surveillance, with the most prominent rises seen in the
community-onset cases.

Over time the community-onset cases have accounted for an increasing proportion of all
reported cases. This is true even for MRSA and CDI, as although rates have reduced in
both settings the reduction was steeper in the hospital setting. This highlights the need

 5
Annual epidemiological commentary: Gram-negative bacteraemia, MRSA bacteraemia, MSSA
bacteraemia and C. difficile infections

to increase efforts to prevent cases in community settings. Nevertheless, hospital-onset
infections remain important, representing thousands of cases a year.

Although many of the infections were community-onset it is estimated that a large
proportion (up to 50% in the case of E. coli) have had recent healthcare interactions
(Abernethy and others, 2017). Therefore, to reduce infection rates further, control efforts
in the hospital setting must be maintained or strengthened, while increasing focus on
healthcare interventions in the community and the interface between hospital and
community infection control teams improved.

Highlights
Since the beginning of mandatory E. coli bacteraemia surveillance in 2011, rates of all
reported cases increased each year until April 2020 to March 2021 when it declined to
65.3 cases per 100,000 population from 77.0 in the previous year.

After E. coli, Klebsiella spp. and P. aeruginosa are the most common causative
organisms in Gram-negative bacteraemia. These species caused substantially lower
rates of bacteraemia than E. coli. Rates of Klebsiella spp. increased slightly, from 19.6 in
April 2019 to March 2020 to 19.8 in April 2020 to March 2021. Rates of P. aeruginosa
bacteraemia decreased slightly, from 7.7 in April 2019 to March 2020 to 7.6 in April 2020
to March 2021. Urinary tract infection (UTI) remained the most important primary focus;
31.3% for Klebsiella spp. and 28.5% of P. aeruginosa cases respectively.

Rates of MSSA bacteraemia continued to increase moderately from April 2011 to March
2012 when the surveillance was introduced. However, the rate decreased from 21.7
cases per 100,000 population in April 2019 to March 2020 to 20.8 per 100,000
population in April 2020 to March 2021.

In contrast to MSSA, rates of MRSA bacteraemia and CDI in April 2020 to March 2021
have remained low at 1.2 and 22.2 per 100,000 population respectively in comparison to
rates at their peak. However, rates of all reported MRSA cases peaked in January 2021
compared to other months in more recent years, which had relatively stable rates. This
peak coincided with the second wave of the COVID-19 pandemic.

The high rates of Gram-negative bacteraemias and the diverse nature of the underlying
causes of these infections compared to MRSA and CDI present a significant challenge
to achieving the ambition to halve healthcare-associated Gram-negative bacteraemia by
2023 to 2024 (HM Government 2018).

Counts of cases across all collections except CDI and Klebsiella spp. are lower than
would be expected given previous trajectories. This is a result of associated
interventions and the global COVID-19 pandemic on the number of cases reported to

 6

Annual epidemiological commentary: Gram-negative bacteraemia, MRSA bacteraemia, MSSA
bacteraemia and C. difficile infections

the surveillance of BSI and CDI. From an analysis of data from the voluntary laboratory
surveillance scheme, there has also been a reduction in the number of cases of other
bloodstream infections, not only those covered by mandatory surveillance. In response
to the pandemic, many elective procedures in hospitals were cancelled. As hospital
patient populations declined, so did the population at risk, however, this drop in the
denominator was greater than that in the cases contributing to the rise in calculated
hospital-onset incidence rates for April 2020 to March 2021. This artefact is more
pronounced in Klebsiella spp. and P. aeruginosa bacteraemia cases due to actual
increases in the count of hospital-onset relative to previous year. For us to understand
the true incidence rate of infections we will need to consider these changes. Further
work is ongoing to better understand these trends in the context of the changed hospital
population and practises in England during the COVID-19 pandemic.

This report constitutes a full and descriptive analysis of the data from the mandatory
surveillance of bacteraemia and CDI programmes in England. Detailed information on
each pathogen can be found in the individual sections of the report.

 7
Annual epidemiological commentary: Gram-negative bacteraemia, MRSA bacteraemia, MSSA
bacteraemia and C. difficile infections

Effect of the COVID-19 pandemic on
Bacteraemia and CDI surveillance
The first case of SARS-CoV-2 was detected in England on 30 January 2020 [Brown
2021]. A series of epidemics with cross-border transmission was declared a pandemic
on 11 March 2020 [Cucinotta 2020]. Since then, England has experienced 2 major
waves of increasing infection during March to May 2020 and September 2020 to March
2021, triggering national lockdowns. During the pandemic many elective procedures in
hospitals were cancelled leading to reduced hospital activity. This led to large declines in
the number of Gram-negative and S. aureus bacteraemia and CDI reported during this
period. A similar analysis of the laboratory surveillance scheme showed similar declines
in the number of processed bacteraemia isolates and thus cases over the same period.
This suggests that the declines in reported cases are genuine and not a result of under-
reporting in the mandatory surveillance scheme.

Except for Klebsiella spp. and CDI, there were considerable declines in the number of all
reported cases of each the infections covered in this report over the course of the
pandemic (Figure S0). Most of these declines occurred in community-onset cases.

The Gram-negative and MSSA bacteraemia saw the largest declines in cases which
contrasts previously increasing trends. However, hospital-onset cases became more
common during the pandemic, especially in MRSA and Pseudomonas bacteraemia
cases, where in January 2021 hospital-onset cases exceeded community onset cases.
In addition, during the pandemic, the dominant primary focus of Klebsiella spp. and P.
aeruginosa infection was respiratory tract infection compared to urinary tract infection in
the same period from previous years. Pneumonia as a source of MRSA cases became
more common as well. Data from this report also shows increases in ICU-associated
cases during the pandemic. The correlation between peaks of COVID-19 cases and
hospital-onset bacterial infections is not unexpected. COVID-19 patients requiring
hospitalisation are likely to need longer stays than the average admitted patient
therefore increasing the risk of acquiring a HCAI. COVID-19 related care and IPC
measures such as, proning, increased corticosteroid use and use of sessional PPE may
have had adverse effects on HCAI but will require dedicated research to discern.

The calculated hospital-onset infection rates increased for all bacteraemia and CDI
cases during the pandemic. However, it is important to note that the hospital population
during much of pandemic reduced considerably. These population (based on overnight
admissions) have been used in the calculation of hospital-onset incident rates.
Therefore, in instances such an hospital-onset E. coli bacteraemia cases, the calculated
incidence rates increased from the previous year despite a decline in case number.

 8
Annual epidemiological commentary: Gram-negative bacteraemia, MRSA bacteraemia, MSSA
bacteraemia and C. difficile infections

Figure S0. Monthly counts of Gram-negative and S. aureus bacteraemia, and C.
difficile infections in England, April 2017 to March 2021

 9
Annual epidemiological commentary: Gram-negative bacteraemia, MRSA bacteraemia, MSSA
bacteraemia and C. difficile infections

For Klebsiella spp. and P. aeruginosa hospital-onset cases, the count of cases
increased which when combined with reducing denominators resulted in steep rate
increases.

The April 2020 to March 2021 trends for all infections covered in this report have been
affected by COVID-19 pandemic. This report only covers data up to the end of March
2021, therefore, covering the whole of the first wave and the majority of the second
COVID-19 wave in England. The COVID-19 pandemic in England entered its third wave
towards the end of April 2021. Thus, the full effect of the active pandemic on healthcare-
associated infections cannot yet be determined and it is impossible to estimate with any
certainty at present if HCAI trends will return to those seen beforehand. If patient
populations and NHS practice change substantially then the HCAI trends will need to be
reassessed with consideration to these changes.

 10
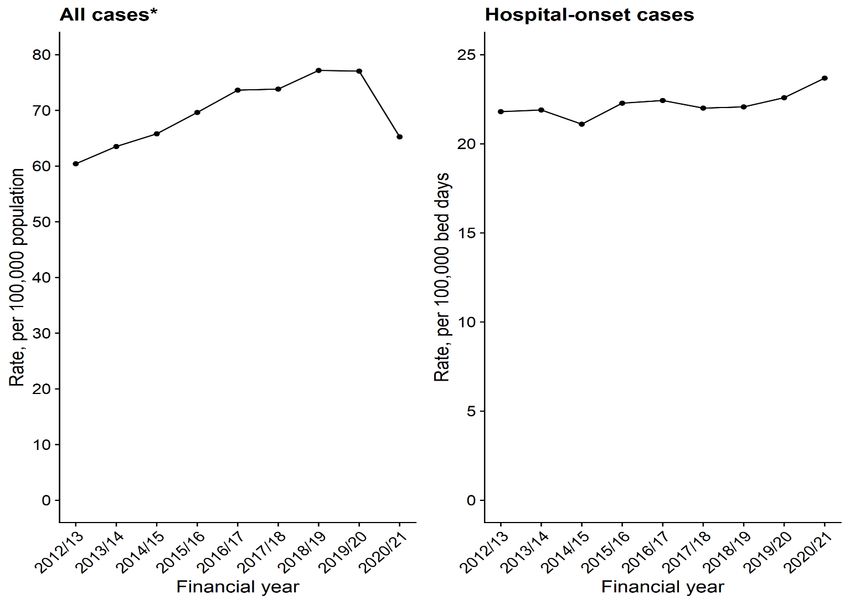
Annual epidemiological commentary: Gram-negative bacteraemia, MRSA bacteraemia, MSSA
bacteraemia and C. difficile infections

Bacteraemia caused by Gram-negative
organisms
Escherichia coli bacteraemia
Total reports
A total of 36,728 cases of E. coli bacteraemia were reported by NHS Trusts in England
between 1 April 2020 and 31 March 2021. Of the 36,728 E. coli cases, 6,544 (17.8%)
were hospital-onset cases. The total number of cases reported in April 2020 to March
2021 decreased by 15.3% compared to April 2019 to March 2020 (n = 43,368) but is an
increase of 13.7% when comparing over a longer period from 2012 to 13 (n = 32,309).
Figure 1 shows the trends in the rates of E. coli cases from April 2012 to March 2013 to
April 2020 to March 2021. Overall, the rate of E. coli cases per 100,000 population has
risen from 60.4 in April 2012 to March 2013 to 65.3 in April 2020 to March 2021.

Figure 1. Trends in the rate of E. coli bacteraemia in England, April 2012 to March
2013 to April 2020 to March 2021*

* Mid-year population estimates for April 2020 to March 2021 were not available at time of publication and so
population data for April 2019 to March 2020 were used as a proxy.
 11
Annual epidemiological commentary: Gram-negative bacteraemia, MRSA bacteraemia, MSSA
bacteraemia and C. difficile infections

Hospital-onset cases
The rate (cases per 100,000 bed-days) of E. coli hospital-onset cases was relatively stable at
22.0 between April 2012 to March 2013 and April 2017 to March 2018 although, this dropped to
21.0 in April 2014 to March 2015. However, there has been a relatively small but consistent
increase in the incidence rate of hospital-onset cases between April 2017 to March 2018 and
April 2020 to March 2021 (23.7 cases per 100,000 bed-days).

Table 1. E. coli counts and rates by financial year, England: April 2012 to March 2013 to
April 2020 to March 2021
Financial Mid-year All Rate (all Total bed Hospital- Rate (hospital-
year population reported reported cases days onset onset cases
 estimate cases per 100,000 cases per 100,000
 population)* bed days)
2012/2013 53,475,358 32,309 60.4 34,633,855 7,552 21.8
2013/2014 53,976,973 34,286 63.5 34,514,871 7,558 21.9
2014/2015 54,432,437 35,816 65.8 34,972,728 7,380 21.1
2015/2016 55,018,884 38,309 69.6 34,752,604 7,743 22.3
2016/2017 55,240,933 40,676 73.6 35,148,014 7,884 22.4
2017/2018 55,707,642 41,125 73.8 34,903,075 7,680 22.0
2018/2019 56,053,563 43,262 77.2 34,538,184 7,623 22.1
2019/2020 56,286,961 43,368 77.0 34,637,156 7,824 22.6
2020/2021 56,286,961 36,728 65.3 27,629,101 6,544 23.7

* Mid-year population estimates for April 2020 to March 2021 were not available at time of publication and so
population data for April 2019 to March 2020 were used as a proxy.

 12
Annual epidemiological commentary: Gram-negative bacteraemia, MRSA bacteraemia, MSSA
bacteraemia and C. difficile infections

Figure 2. Rate of ICU-associated hospital-onset E. coli bacteraemia cases, April
2016 to March 2017 to April 2020 to March 2021

Rates of E. coli infections in ICUs have fluctuated over the years, with spikes seen in
April 2017 to March 2018 and April 2020 to March 2021, with rates in both years rising to
0.48 cases per 1,000 ICU bed days greater than 2 days.

Age and sex distribution
For all age and sex analyses, cases in which the sex was missing or given as unknown
were excluded. In April 2012 to March 2013, the sex was unknown for 815 cases (2.5%),
while in April 2020 to March 2021, the sex was unknown for 18 cases (less than 1%).

Figure 3 compared the age and sex distribution of E. coli cases as a proportion of all
infections in April 2012 to March 2013 and April 2020 to March 2021. There has been
little change to the distribution of cases. Most cases occur in adults aged 45 and over.
The proportion of cases from male and female cases where broadly similar in each age
group, except in the 15 to 44 and greater to or equal to 85 age groups. In these 2 age
groups, cases were more common in female patients compared to males.

 13
Annual epidemiological commentary: Gram-negative bacteraemia, MRSA bacteraemia, MSSA
bacteraemia and C. difficile infections

Figure 3. Age and sex distribution of E. coli bacteraemia by percentage of cases,
England, April 2012 to March 2013 and April 2020 to March 2021

In general, the incidence rates of E. coli bacteraemia are greater in male patients
compared to females, and particularly so among older age groups (Table 2, Table 3 and
Figure 4). However, there is a notable exception to this. In young adulthood (15 to 44)
the rate of E. coli bacteraemia is usually higher in women compared to among men. In
April 2020 to March 2021 this was 17.0 per 100,000 population for males compared to
7.3 in females, giving a giving a male-to-female rate ratio of 0.4 (95% CI: 0.4 to 0.5).

Table 2. E. coli counts and rates by age group and sex, England: April 2012 to March
2013
 Age Population Cases Rate, per 100,000
 group Males Females Males Females Males Females
 (years)
 Under 1 353,705 336,393 306 195 86.5 58
 1 to 14 4,503,696 4,294,578 81 136 1.8 3.2
 15 to 44 10,724,195 10,658,628 712 2,087 6.6 19.6

 14
Annual epidemiological commentary: Gram-negative bacteraemia, MRSA bacteraemia, MSSA
bacteraemia and C. difficile infections

 Age Population Cases Rate, per 100,000
 group Males Females Males Females Males Females
 (years)
 45 to 64 6,669,559 6,835,423 2,944 2,878 44.1 42.1
 65 to 74 2,347,921 2,530,754 3,520 2,889 149.9 114.2
 75 to 84 1,320,659 1,677,572 4,577 4,311 346.6 257
 Over 85 408,948 813,327 2,937 3,921 718.2 482.1

Table 3. E. coli counts and rates by age group and sex, England: April 2020 to
March 2021
 Age Population* Cases Rate, per 100,000
 group Males Females Males Females Males Females
 (years)
 Under 1 318,032 300,826 425 260 133.6 86.4
 1 to 14 4,907,107 4,666,124 95 120 1.9 2.6
 15 to 44 10,763,419 10,571,978 787 1,799 7.3 17
 45 to 64 7,103,072 7,302,687 3,515 3,253 49.5 44.5
 65 to 74 2,682,950 2,893,116 4,284 3,359 159.7 116.1
 75 to 84 1,536,167 1,844,432 5,645 4,770 367.5 258.6
 Over 85 517,084 879,967 3,968 4,430 767.4 503.4

 15
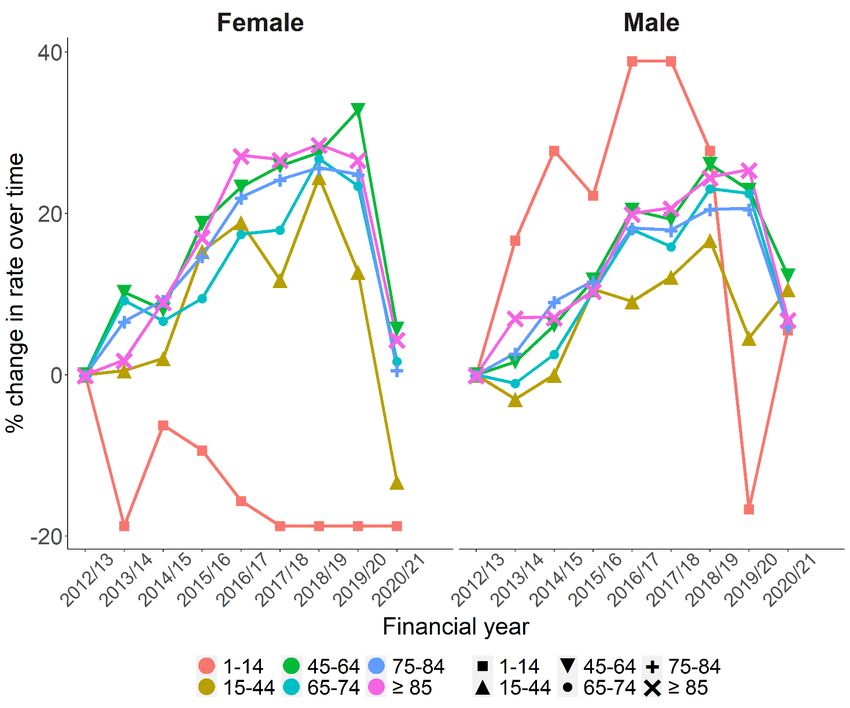
Annual epidemiological commentary: Gram-negative bacteraemia, MRSA bacteraemia, MSSA
bacteraemia and C. difficile infections

Figure 4. Trend in age and sex structure of E. coli cases and rate per 100,000
population in England, April 2012 to March 2013 to April 2020 to March 2021

* Mid-year population estimates for April 2020 to March 2021 were not available at time of publication and
so population data for April 2019 to March 2020 were used as a proxy.

Percentage changes in the age and sex-specific rates of E. coli bacteraemia relative to
the first year of surveillance are shown in Figure 5. Except for females between the ages
of one and 14, rates of E. coli bacteraemia have increased since the start of
surveillance. Compared to the start of mandatory surveillance, the age group with the
highest increases in incidence rates has been the less than 1 age group. However, the
decline in incidence rates between April 2019 to March 2020 and April 2020 to March
2021 was observed in almost all age-groups but more so among female patients.

 16
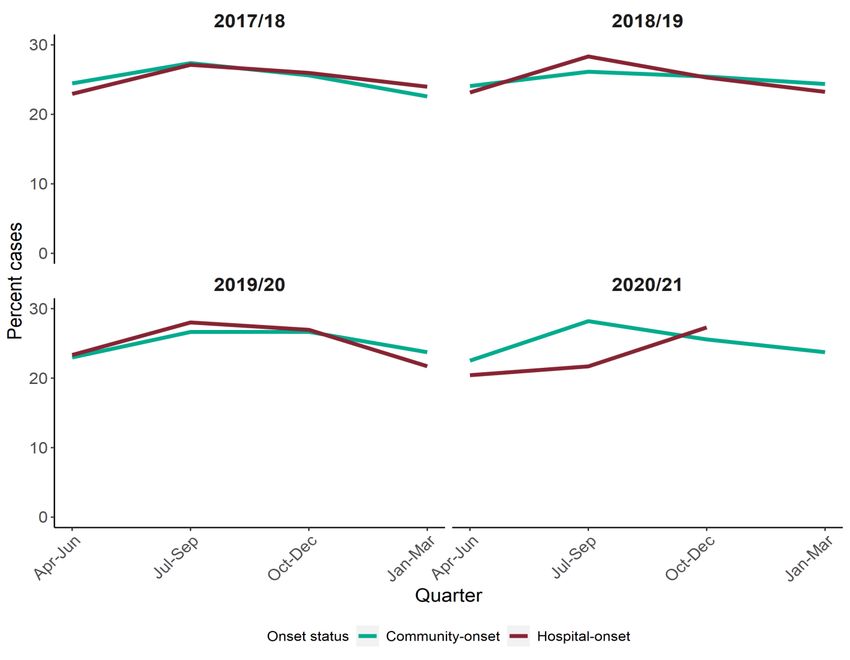
Annual epidemiological commentary: Gram-negative bacteraemia, MRSA bacteraemia, MSSA
bacteraemia and C. difficile infections

Figure 5. Change in age- and sex-specific E. coli bacteraemia rates, April 2012 to
March 2013 to April 2020 to March 2021

Seasonal trends in E. coli bacteraemia
In general, community-onset E. coli cases peaks in the July-September quarter of the
year, a trend that has not changed since April 2012. There is much less seasonal
variation in hospital-onset E. coli cases although, in April 2020 to March 2021, here was
a considerable change to this trend when hospital-onset E. coli cases peaked in October
to December 2020 and January and March 2021. This is the first time since April 2012 to
March 2013 where increases in hospital-onset cases during these 2 quarters have been
higher than the rest of financial year.

 17
Annual epidemiological commentary: Gram-negative bacteraemia, MRSA bacteraemia, MSSA
bacteraemia and C. difficile infections

Figure 6. Trends in the seasonality of E. coli bacteraemia, April 2012 to March
2013 to April 2020 to March 2021

Primary focus of E. coli bacteraemia
The provision of data on the most likely primary focus of E. coli infection information is
voluntary. The percentage of cases where this information has been provided has
declined over time from 85.5% (n= 27,610) in April 2012 to March 2013 to 54.3% (n=
19,941) in April 2020 to March 2021.

Of cases with a reported primary focus of infection, urinary tract infection (UTI) has
consistently been the most frequent primary focus for E. coli bacteraemia cases. In April
2012 to March 2013, 48.9% of cases had a most likely primary focus of UTI, by April
2020 to March 2021 it was 43.9% (n= 8,747). Conversely, the percentage of records for
which the primary focus was reported as unknown has decreased from 20.2% in April
2012 to March 2013 to 17.7% in April 2020 to March 2021.

 18
Annual epidemiological commentary: Gram-negative bacteraemia, MRSA bacteraemia, MSSA bacteraemia and C. difficile infections

Table 4. E. coli counts and rates by primary focus of bacteraemia in England, April 2011 to March 2012 to April 2020 to
March 2021

 Financial Gastrointestinal Hepatobiliary UTI Respiratory tract Other Unknown Total
 Year (not hepatobiliary)
 N (%) N (%) N (%) N (%) N (%) N (%) N
 2012/2013 1,782 (6.5) 3,756 (13.6) 13,501 (48.9) 1,050 (3.8) 1,936 (7) 5,585 (20.2) 27,610
 2013/2014 1,711 (6) 3,855 (13.6) 13,393 (47.3) 1,016 (3.6) 1,873 (6.6) 6,452 (22.8) 28,300
 2014/2015 1,640 (5.7) 3,818 (13.3) 13,087 (45.6) 1,099 (3.8) 1,851 (6.4) 7,233 (25.2) 28,728
 2015/2016 1,491 (5.6) 3,556 (13.4) 12,219 (46.2) 1,068 (4) 1,703 (6.4) 6,407 (24.2) 26,444
 2016/2017 1,237 (5.4) 3,277 (14.4) 10,724 (47.2) 1,027 (4.5) 1,553 (6.8) 4,907 (21.6) 22,725
 2017/2018 1,717 (6.7) 4,035 (15.8) 12,566 (49.1) 1,575 (6.1) 1,757 (6.9) 3,963 (15.5) 25,613
 2018/2019 1,969 (6.9) 4,686 (16.5) 13,913 (48.9) 1,728 (6.1) 1,989 (7) 4,182 (14.7) 28,467
 2019/2020 1,774 (6.5) 4,346 (15.8) 13,238 (48.1) 1,671 (6.1) 1,898 (6.9) 4,575 (16.6) 27,502
 2020/2021 1,325 (6.6) 3,637 (18.2) 8,747 (43.9) 1,219 (6.1) 1,493 (7.5) 3,520 (17.7) 19,941

* Urinary tract infection
** Gastrointestinal (not hepatobiliary)
*** ‘Other’ includes the following options HCAI DCS: bone and joint, central nervous system, genital tract (including prostate), indwelling intravascular
device, other, respiratory tract, skin or soft tissue, no clinical signs of bacteraemia.

The primary focus of E. coli bacteraemia also varies according to time to onset (Figure 7). UTI as the primary focus was more
common in cases with where the time to onset was less than 2 days (44.7%) compared to cases where it was between 2 and 6
days (31.5%).

 19
Annual epidemiological commentary: Gram-negative bacteraemia, MRSA bacteraemia, MSSA
bacteraemia and C. difficile infections

Figure 7. Distribution of primary focus E. coli bacteraemia in England, by time to
onset April 2020 to March 2021

Geographic distribution of E. coli bacteraemia
Regional distribution of cases is presented by Sustainability Transformation Partnerships
(STP). Some geographical variation in rates of E. coli bacteraemia is noted (Figure 8).
The highest incidence rates (cases per 100,000 population) were observed in Devon
(84.0), Cumbria and North East (83.5) and Joined Up Care Derbyshire (83.4), while the
lowest incidence rates (cases per 100,000 population) were observed in Gloucestershire
(36.4), Bedfordshire, Luton and Milton Keynes (44.9) and Leicester, Leicestershire and
Rutland (47.7).

 20
Annual epidemiological commentary: Gram-negative bacteraemia, MRSA bacteraemia, MSSA
bacteraemia and C. difficile infections

Figure 8. Geographic distribution of E. coli rates per 100,000 population, England
April 2020 to March 2021*

* Mid-year population estimates for April 2020 to March 2021 were not available at time of publication and
so population data for April 2019 to March 2020 were used as a proxy.

See Table 4b of the accompanying data sheet for a breakdown of STP-specific E. coli
bacteraemia rates.

Klebsiella spp. bacteraemia
Total reports
A total of 11,123 cases of Klebsiella spp. bacteraemia were reported by NHS Trusts in
England between 1 April 2020 and 31 March 2021. Of the 11,123 Klebsiella spp. cases,
3,785 (34.0%) were hospital-onset cases.

 21
Annual epidemiological commentary: Gram-negative bacteraemia, MRSA bacteraemia, MSSA
bacteraemia and C. difficile infections

Figure 9. Trends in the rate of Klebsiella spp. in England, April 2017 to March 2018
to April 2020 to March 2021

* Mid-year population estimates for April 2020 to March 2021 were not available at time of publication and
so population data for April 2019 to March 2020 were used as a proxy.

Hospital onset cases
The rate (cases per 100,000 bed-days) of hospital-onset Klebsiella spp. cases was 8.4 in April
2017 to March 2018 and 9.3 in April 2018 to March 2019 and April 2019 to March 2020.
However, this increased to 13.7 in April 2020 to March 2021.

 22
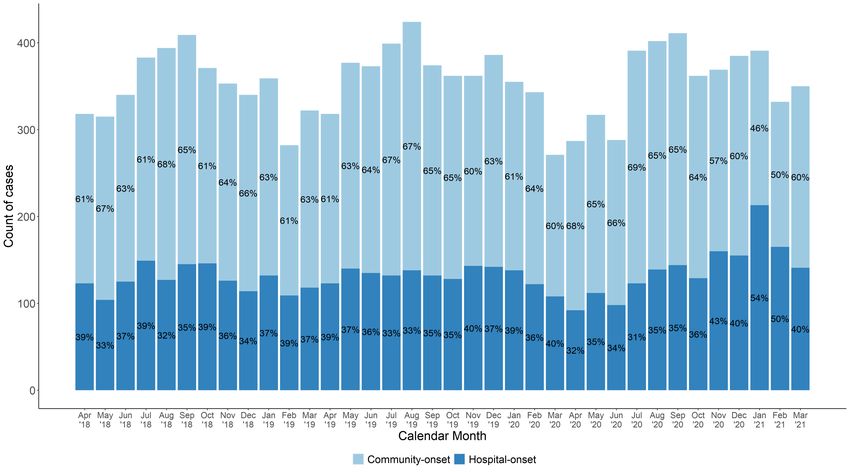
Annual epidemiological commentary: Gram-negative bacteraemia, MRSA bacteraemia, MSSA
bacteraemia and C. difficile infections

Table 5. Klebsiella spp. counts and rates by financial year, England: April 2017 to
March 2018 to April 2020 to March 2021
Financial Mid-year All Rate (all Total bed Hospital- Rate
year population reported reported days** onset (Hospital-
 estimate cases cases per cases onset
 100,000 cases per
 population) 100,000
 bed days)
2017/2018 55,707,642 9,782 17.6 34,903,075 2,920 8.4
2018/2019 56,053,563 10,688 19.1 34,538,184 3,202 9.3
2019/2020 56,286,961 11,032 19.6 34,637,156 3,206 9.3
2020/2021 56,286,961 11,123 19.8 27,629,101 3,785 13.7

In April 2020 to March 2021, the counts of both all reported cases and hospital-onsets peaked
in January 2021 at 1,074 and 487 cases respectively (Figure 10). These were the highest
numbers of all reported cases and those that were hospital-onset ever observed since the start
of mandatory surveillance. These increases coincided with the COVID-19 pandemic and are
likely a result of the change to the usual hospital population and practices during this period.

 23
Annual epidemiological commentary: Gram-negative bacteraemia, MRSA bacteraemia, MSSA bacteraemia and C. difficile infections

Figure 10. Monthly counts of Klebsiella spp. bacteraemia by onset of infection, April 2018 to March 2019 to April 2020 to March 2021

 24
Annual epidemiological commentary: Gram-negative bacteraemia, MRSA bacteraemia, MSSA
bacteraemia and C. difficile infections

Figure 11. Rate of ICU-associated hospital-onset Klebsiella spp. bacteraemia
cases, April 2016 to March 2017-April 2020 to March 2021

Rates of Klebsiella spp. infections in ICUs have remained below 0.5 per 1,000 ICU bed days
greater than 2 days from April 2017 to March April 2018 to March April 2019 to March 2020. A
steep rise was seen from April 2019 to March 2020 to April 2020 to March 2021, with the rate
rising from 0.42 to 1.02 cases per 1,000 ICU bed days greater than 2 days.

Distribution of Klebsiella species
K. pneumoniae was the most frequently reported species, followed by K. oxytoca. This
distribution was the same regardless of onset of infection.

Table 6. Counts and percentages of Klebsiella species, England, April 2020 to March
2021
 Species All cases Hospital-onset Community-onset
 cases cases
 K. pneumoniae 7,871 (18.5%) 2,572 (19.6%) 5,299 (18.0%)
 K. oxytoca 1,937 (4.5%) 580 (4.4%) 1,357 (4.6%)
 K. aerogenes 546 (1.3%) 346 (2.6%) 200 (0.7%)
 Other named species 420 (1.0%) 147 (1.1%) 273 (0.9%)
 Not speciated 349 (0.8%) 140 (1.1%) 209 (0.7%)

 25
Annual epidemiological commentary: Gram-negative bacteraemia, MRSA bacteraemia, MSSA
bacteraemia and C. difficile infections

Age and sex distribution
For all age and sex analyses, cases in which the sex was missing or given as unknown
were excluded. In April 2017 to March 2018, no case was reported with an ‘unknown’
sex, while 5 cases gave the sex as ‘unknown’ in April 2020 to March 2021.

Figure 12 compares the age and sex distribution of Klebsiella spp. cases as a proportion
of all reported cases in April 2017 to March 2018 and April 2020 to March 2021. There
has been little change to the distribution of cases. Most cases occur in adults aged 45
and over. Unlike E. coli bacteraemia cases, the proportion of Klebsiella spp. cases was
usually greater in males of all age groups compared to their female counterparts.

Figure 12. Age and sex distribution of Klebsiella spp. bacteraemia by percentage
of cases, England, April 2017 to March 2018 and April 2020 to March 2021

* Mid-year population estimates for April 2020 to March 2021 were not available at time of publication and
so population data for April 2019 to March 2020 were used as a proxy.

In general, incidence rates of Klebsiella spp. bacteraemia were greater in male patients
and increased with age, except in the under 1 age group where rates were higher than

 26
Annual epidemiological commentary: Gram-negative bacteraemia, MRSA bacteraemia, MSSA
bacteraemia and C. difficile infections

patients in the 1 to 14 and 15 to 44 age groups (Table 7, Table 8 and Figure 13).
Compared to E. coli cases, the difference in incidence rates between sexes were
greater. For example, the rate ratio for male and female patients in the Over 85 age
group is 3.3 (95% CI: 3.0 to 3.7) in April 2020 to March 2021.

Table 7. Klebsiella spp. counts and rates by age group and sex, England: April
2017 to March 2018

Age group Population Cases Rate, per 100,000
(years) Males Females Males Females Males Females
Under 1 333,130 316,482 105 76 31.5 24
1 to 14 4,827,472 4,595,038 68 53 1.4 1.2
15 to 44 10,750,236 10,570,942 304 400 2.8 3.8
45 to 64 7,027,291 7,219,864 1,265 874 18 12.1
65 to 74 2,652,198 2,855,857 1,446 827 54.5 29
75 to 84 1,446,314 1,757,576 1,719 925 118.9 52.6
Over 85 490,494 864,748 1,094 619 223 71.6

Table 8. Klebsiella spp. counts and rates by age group and sex, England: April
2020 to March 2021

Age group Population* Cases Rate, per 100,000
(years) Males Females Males Females Males Females
Under 1 318,032 300,826 131 99 41.2 32.9
1 to 14 4,907,107 4,666,124 83 60 1.7 1.3
15 to 44 10,763,419 10,571,978 448 447 4.2 4.2
45 to 64 7,103,072 7,302,687 1,783 1,064 25.1 14.6
65 to 74 2,682,950 2,893,116 1,648 882 61.4 30.5
75 to 84 1,536,167 1,844,432 1,818 877 118.3 47.5
Over 85 517,084 879,967 1,175 603 227.2 68.5

* Mid-year population estimates for April 2020 to March 2021 were not available at time of publication and
so population data for April 2019 to March 2020 were used as a proxy.

 27
Annual epidemiological commentary: Gram-negative bacteraemia, MRSA bacteraemia, MSSA
bacteraemia and C. difficile infections

Figure 13. Trend in age and sex structure of Klebsiella spp. cases and rate per
100,000 population*, England, April 2017 to March 2018 to April 2020 to March
2021

* Mid-year population estimates for April 2020 to March 2021 were not available at time of publication and
so population data for April 2019 to March 2020 were used as a proxy.

 28
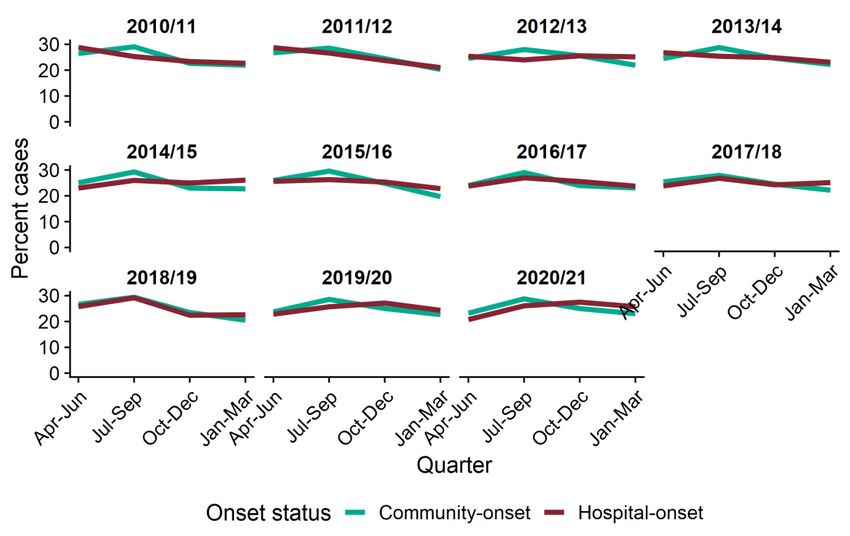
Annual epidemiological commentary: Gram-negative bacteraemia, MRSA bacteraemia, MSSA
bacteraemia and C. difficile infections

Seasonal trends in Klebsiella spp. bacteraemia
In general, community-onset Klebsiella spp. cases peak in the July to September and
October to December quarter of the year (Figure 14). This is a trend that has not
changed since April 2017. A similar trend is observed with hospital-onset Klebsiella spp.
cases. However, April 2020 to March 2021 saw a considerable change to this trend.
Hospital-onset Klebsiella spp. cases peaked in October to December 2020 and January
and March 2021. This was the first time since April 2017 to March 2018 where increases
in hospital-onset cases during these 2 quarters have been higher than the rest of the
financial year.

Figure 14. Trends in the seasonality of Klebsiella spp. bacteraemia, April 2017 to
March 2018 to April 2020 to March 2021

Primary focus of Klebsiella spp. bacteraemia
The most frequently reported primary focus of bacteraemia for Klebsiella spp. cases was
urinary tract infection (UTI), constituting 31.3% of cases with a reported primary focus of
infection in April 2020 to March 2021. However, in that same period, the primary focus
was not reported for 51.3% of all cases.
 29
Annual epidemiological commentary: Gram-negative bacteraemia, MRSA bacteraemia, MSSA bacteraemia and C. difficile infections

Table 9. Klebsiella spp. counts and rates by primary focus of bacteraemia, England, April 2017 to March 2018 to April
2020 to March 2021
Financial UTI* GI** Hepatobiliary Respiratory Other* Unknown Total
year tract
 n (%) n (%) n (%) n (%) n (%) n (%) n (%)
2017/2018 1,680 (32.9) 374 (7.3) 1,032 (20.2) 469 (9.2) 603 (11.8) 946 (18.5) 5,104
2018/2019 1,941 (33.4) 492 (8.5) 1,104 (19) 585 (10.1) 768 (13.2) 916 (15.8) 5,806
2019/2020 2,050 (33.7) 484 (7.9) 1,215 (20) 581 (9.5) 744 (12.2) 1,015 (16.7) 6,089
2020/2021 1,698 (31.3) 399 (7.4) 972 (17.9) 696 (12.8) 688 (12.7) 964 (17.8) 5,417

* Urinary tract infection
** Gastrointestinal (not hepatobiliary)
*** ‘Other’ includes the following options HCAI DCS: bone and joint, central nervous system, genital tract (including prostate), indwelling intravascular
device, other, respiratory tract, skin or soft tissue, no clinical signs of bacteraemia.

Amongst inpatients with a time to onset of less than 2 days, UTI forms a major primary focus of bacteraemia (35.9%, Figure 15)
compared to where the time to onset was greater than or equal to 7 days (14.1%).

 30
Annual epidemiological commentary: Gram-negative bacteraemia, MRSA bacteraemia, MSSA
bacteraemia and C. difficile infections

Figure 15. Distribution of primary focus of Klebsiella spp. bacteraemia, by time to
onset, England, April 2017 to March 2018 to April 2020 to March 2021

Geographic distribution of Klebsiella spp. bacteraemia
Regional distribution of cases is presented by Sustainability Transformation Partnerships
(STP). Some geographical variation in rates of Klebsiella spp. is noted (Figure 16). The
highest incidence rates (cases per 100,000 population) were observed in Somerset
(29.9), Cumbria and North East (24.9) and East London Health and Care Partnership
(24.7), while the lowest incidence rates (cases per 100,000 population) were observed in
Gloucestershire (10.2), Bedfordshire, Luton and Milton Keynes (14) and Bristol, North
Somerset and South Gloucestershire (15.9).

 31
Annual epidemiological commentary: Gram-negative bacteraemia, MRSA bacteraemia, MSSA
bacteraemia and C. difficile infections

Figure 16. Geographic distribution of Klebsiella spp. rates per 100,000 population,
England April 2020 to March 2021*

* Mid-year population estimates for April 2020 to March 2021 were not available at time of publication and
so population data for April 2019 to March 2020 were used as a proxy.

See Table 9b of the accompanying data sheet for a breakdown of STP-specific
Klebsiella spp. bacteraemia rates.

Pseudomonas aeruginosa bacteraemia
Total reports
A total of 4,285 cases of P. aeruginosa bacteraemia were reported by NHS Trusts in
England between 1 April 2020 and 31 March 2021. Of the 4,285 P. aeruginosa cases,
1,671 (39.0%) were hospital-onset cases.

 32
Annual epidemiological commentary: Gram-negative bacteraemia, MRSA bacteraemia, MSSA
bacteraemia and C. difficile infections

Figure 17. Trends in the rate of P. aeruginosa in England, April 2017 to March 2018
to April 2020 to March 2021

* Mid-year population estimates for April 2020 to March 2021 were not available at time of publication and
so population data for April 2019 to March 2020 were used as a proxy.

Hospital onset cases
The rate (cases per 100,000 bed-days) of P. aeruginosa hospital-onset cases was relatively
stable April 2017 to March 2018 and April 2020 to March 2021 ranging from 4.4 to 4.6.
However, this increased to 6.0 in April 2020 to March 2021.

 33
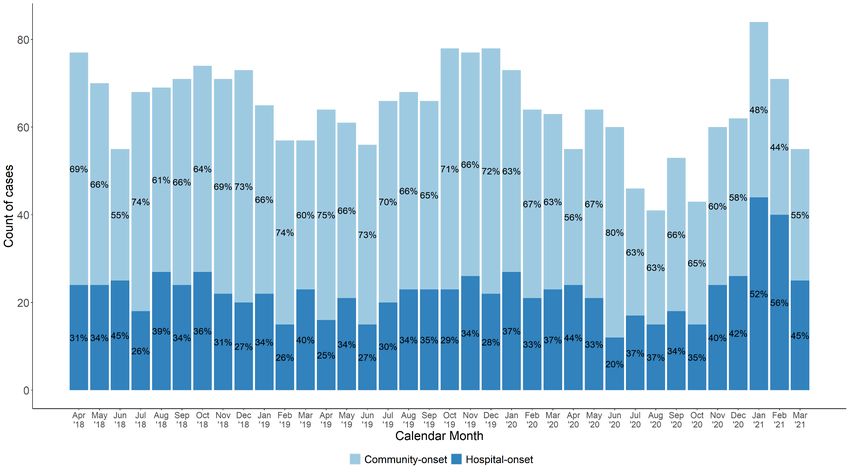
Annual epidemiological commentary: Gram-negative bacteraemia, MRSA bacteraemia, MSSA
bacteraemia and C. difficile infections

Table 10. P. aeruginosa counts and rates by financial year, England: April 2017 to
March 2018 to April 2020 to March 2021
Financial year Mid-year All Rate (all Total bed Hospital- Rate
 population reported reported days** onset (Hospital-
 estimate cases cases per cases onset cases
 100,000 per 100,000
 population) bed days)
 *
2017/2018 55,707,642 4,305 7.7 34,903,075 1,624 4.7
2018/2019 56,053,563 4,186 7.5 34,538,184 1,518 4.4
2019/2020 56,286,961 4,344 7.7 34,637,156 1,581 4.6
2020/2021 56,286,961 4,285 7.6 27,629,101 1,671 6.0
* Mid-year population estimates for April 2020 to March 2021 were not available at time of publication and
so population data for April 2019 to March 2020 were used as a proxy.

In April 2020 to March 2021, the counts of all reported P. aeruginosa cases peaked in January
2021 at 391 cases and most cases where hospital-onset (54%). This was the first time since the
start of mandatory surveillance when there were more hospital-onset cases than community-
onset cases (Figure 18). These increases coincided with the COVID-19 pandemic and are likely
a result of the change to the usual hospital population and practice during this period.

 34
Annual epidemiological commentary: Gram-negative bacteraemia, MRSA bacteraemia, MSSA bacteraemia and C. difficile infections

Figure 18. Monthly counts of P. aeruginosa bacteraemia by onset of infection, April 2018 to March 2019 to April 2020 to March 2021

 35
Annual epidemiological commentary: Gram-negative bacteraemia, MRSA bacteraemia, MSSA
bacteraemia and C. difficile infections

Figure 19. Rate of ICU-associated hospital-onset P. aeruginosa bacteraemia
cases, April 2017 to March 2018 to April 2020 to March 2021

Rates of P. aeruginosa infections in ICUs have also gradually increased year on year
between the April 2017 to March 2018 and April 2020 to March 2021 financial years. A
steep rise was seen from April 2019 to March 2020 to April 2020 to March 2021, with the
rate rising from 0.20 to 0.29 cases per 1,000 ICU bed days greater than 2 days.

Age and sex distribution
Cases in which the sex was missing or reported as ‘unknown’ were excluded. In April
2017 to March 2018, no case had an ‘unknown’ sex while in April 2020 to March 2021
one case was reported with an ‘unknown’.

Figure 20 compares the age and sex distribution of P aeruginosa cases as a proportion
of all reported cases in April 2017 to March 2018 and April 2020 to March 2021. There
has been little change to the distribution of cases. Most cases occur in adults aged 45
and over. Unlike E. coli bacteraemia cases, the proportion of P. aeruginosa cases was
usually greater in males of all age groups compared to their female counterparts.

 36
Annual epidemiological commentary: Gram-negative bacteraemia, MRSA bacteraemia, MSSA
bacteraemia and C. difficile infections

Figure 20. Age and sex distribution of P. aeruginosa bacteraemia by percentage of
cases, England, April 2017 to March 2018 and April 2020 to March 2021

* Mid-year population estimates for April 2020 to March 2021 were not available at time of publication and
so population data for April 2019 to March 2020 were used as a proxy.

In general, incidence rates of P. aeruginosa bacteraemia were greater in male patients
and increased with age, except in the Under 1 age group where rates were higher than
patients in the 1 to 14 and 15 to 44 age groups (Table 11, Table 12 and Figure 21).
Compared to E. coli case, the difference in incidence rates between sexes were greater.
For example, the rate ratio for male and female patients in the Over 85 age group was
3.5 (95% CI: 3.0 to 4.1) in April 2020 to March 2021.

 37
Annual epidemiological commentary: Gram-negative bacteraemia, MRSA bacteraemia, MSSA
bacteraemia and C. difficile infections

Table 11. P. aeruginosa counts and rates by age group and sex, England: April
2017 to March 2018
Age Population Cases Rate, per
group 100,000
(years) Males Females Males Females Males Females
Under 1 333,130 316,482.30 36 23 10.8 7.3
1 to 14 4,827,472 4,595,037.80 60 49 1.2 1.1
15 to 44 10,750,236 10,570,942.20 180 155 1.7 1.5
45 to 64 7,027,291 7,219,863.60 539 351 7.7 4.9
65 to 74 2,652,198 2,855,856.80 650 365 24.5 12.8
75 to 84 1,446,314 1,757,575.70 748 320 51.7 18.2
Over 85 490,494 864,748.20 533 296 108.7 34.2
* Mid-year population estimates for April 2020 to March 2021 were not available at time of publication and
so population data for April 2019 to March 2020 were used as a proxy.

Table 12. P. aeruginosa counts and rates by age group and sex, England: April
2020 to March 2021
Age Population Cases Rate, per
group 100,000
(years) Males Females Males Females Males Females
Under 1 318,032 300,826 25 22 7.9 7.3
1 to 14 4,907,107 4,666,124 70 62 1.4 1.3
15 to 44 10,763,419 10,571,978 189 160 1.8 1.5
45 to 64 7,103,072 7,302,687 646 375 9.1 5.1
65 to 74 2,682,950 2,893,116 652 348 24.3 12
75 to 84 1,536,167 1,844,432 723 319 47.1 17.3
Over 85 517,084 879,967 465 228 89.9 25.9
* Mid-year population estimates for April 2020 to March 2021 were not available at time of publication and
so population data for April 2019 to March 2020 were used as a proxy.

 38
Annual epidemiological commentary: Gram-negative bacteraemia, MRSA bacteraemia, MSSA
bacteraemia and C. difficile infections

Figure 21. Trend in age and sex structure of P. aeruginosa cases and rate per 100,000
population*, England, April 2017 to March 2018 to April 2020 to March 2021

* Mid-year population estimates for April 2020 to March 2021 were not available at time of publication and so
population data for April 2019 to March 2020 were used as a proxy.

 39
Annual epidemiological commentary: Gram-negative bacteraemia, MRSA bacteraemia, MSSA
bacteraemia and C. difficile infections

Seasonal trends in P. aeruginosa bacteraemia
In general, community-onset P. aeruginosa cases peak in the July-September quarter of
the year. This is a trend that has not changed since April 2017. A similar trend is
observed with hospital-onset P. aeruginosa cases. However, April 2020 to March 2021
saw a considerable change to this trend. Hospital-onset P. aeruginosa cases peaked in
October to December 2020 and January and March 2021. This was the first time since
April 2017 to March 2018 where increases in hospital-onset cases during these 2
quarters have been higher than the rest of the financial year.

Figure 22. Trends in the seasonality of P. aeruginosa bacteraemia, April 2017 to
March 2018 to April 2020 to March 2021

Primary focus of P. aeruginosa bacteraemia
The most frequent primary focus of bacteraemia for P. aeruginosa was urinary tract
infection (UTI), constituting 28.5% of cases with a reported primary focus of infection in
April 2020 to March 2021. However, in that same period, the primary focus was not
reported for 52.4% of cases.

 40
Annual epidemiological commentary: Gram-negative bacteraemia, MRSA bacteraemia, MSSA bacteraemia and C. difficile infections

Table 13. P. aeruginosa counts and rates by primary focus of bacteraemia, England, April 2017 to March 2018 to April
2020 to March 2021
Financial year UTI* GI** Hepatobiliary Respiratory Other*** Unknown Total
 tract
 n (%) n (%) n (%) n (%) n (%) n (%) n (%)
2017/18 638 (30) 125 (5.9) 102 (4.8) 300 (14.1) 491 (23.1) 471 (22.1) 2,127
2018/19 644 (29.8) 156 (7.2) 100 (4.6) 281 (13) 557 (25.8) 423 (19.6) 2,161
2019/20 716 (30.9) 160 (6.9) 123 (5.3) 313 (13.5) 549 (23.7) 459 (19.8) 2,320
2020/21 582 (28.5) 126 (6.2) 114 (5.6) 331 (16.2) 482 (23.6) 404 (19.8) 2,039
* Urinary tract infection
** Gastrointestinal (not hepatobiliary)
*** ‘Other’ includes the following options HCAI DCS: bone and joint, central nervous system, genital tract (including prostate), indwelling intravascular
device, other, respiratory tract, skin or soft tissue, no clinical signs of bacteraemia.

Among inpatients with a time to onset of less than 2 days, UTI forms a major primary focus of bacteraemia (34.9%, Figure 23)
compared to where the time to onset was greater than or equal to 7 days (13.9%).

 41
You can also read


