Creating dashboards and data stories within the Data & Analytics Framework (DAF) - Semantic Web ...
←
→
Page content transcription
If your browser does not render page correctly, please read the page content below
Creating dashboards and data stories within
the Data & Analytics Framework (DAF)
Michele Petitoc, Francesca Fallucchia,b and De Luca Ernesto Williama,b
a
  DIII, Guglielmo Marconi University, Via Plinio 44, 00193 Roma RM, Italy
E-mail: f.fallucchi@unimarconi.it, ew.deluca@unimarconi.it
b
  DIFI, Georg Eckert Institute Braunschweig, Celler Str. 3, 38114 Braunschweig, German
E-mail: fallucchi@gei.de, deluca@gei.de
c
  DIFI, Università̀ di Pisa, Lungarno Antonio Pacinotti 43, 56126, Pisa PI, Italy
E-mail: michele.petito@unipi.it

Abstract. In recent years, many data visualization tools have appeared on the market that can potentially guarantee citizens and
users of the Public Administration (PA) the ability to create dashboards and data stories with just a few clicks, using open and
unopened data from the PA. The Data Analytics Framework (DAF), a project of the Italian government launched at the end of
2017 and currently being tested, integrates data based on the semantic web, data analysis tools and open source business intelli-
gence products that promise to solve the problems that prevented the PA to exploit its enormous data potential. The DAF favors
the spread of linked open data (LOD) thanks to the integration of OntoPiA, a network of controlled ontologies and vocabularies
that allows us to describe the concepts we find in datasets, such as "sex", "organization", "people", "addresses", "points of inter-
est", "events" etc. This paper contributes to the enhancement of the project by introducing the process of creating a dashboard in
the DAF in 5 steps, starting from the dataset search on the data portal, to the creation phase of the real dashboard through Superset
and the related data story. The case study created by the author, concerns tourism of Sardinia (a region of Italy). This case study
is one of the few demonstrations of use on a real case of DAF and highlights the ability of the DAF to transform the analysis of
a large amount of data into simple visual representations with clear and effective language.

Keywords: Data & Analytics Framework, Data Visualization, Dashboard, Ontology, Controlled vocabulary, Open Data.

1. Introduction                                                       (AgID) [1] at the end of 2012 through the national
                                                                      guidelines [2] that paved the way to the use of LOD as
   Open and Closed Public Administration (PA) Data,                   the data paradigm for enabling semantic interoperabil-
are one of the major digital useful assets for interpret-             ity in the collaboration between PAs..
ing social and economic phenomena, making deci-                          In this scenario, the big data platform DAF [3] de-
sions, for improving services to citizens and compet-                 signed by the Digital Transformation Team [4], a in-
ing on the international scene. To better exploit their               frastructure of the Italian Government established in
potential, it is necessary to leave the approach based                September 2016, represents Italy's latest effort to val-
on silos in favor of a systemic vision: a platform that               orize public information assets. The objective of the
supports data sharing and access. This is especially                  DAF is to overcome these difficulties by channeling
true of open data, whose spread has slowed in recent                  data flows from the various local and central PAs into
years because large number of databases and open                      a large container (data lake) where, thanks to a frame-
data portals are only available as silos in the various               work for distributed applications such as Apache Ha-
PAs, so non-interoperable between them. Furthermore,                  doop [5], data can be explored and analyzed, also us-
very few PAs have adopted standardized production,                    ing machine learning techniques, to fully exploit in-
analysis or data storage, according to the methodolog-                sights and information hidden in it. Thanks to a very
ical approach defined by the Agency for Digital Italy                 simple interface and an API (Application Program
Interface) system, the DAF allows individual admin-                    speed, and show the DAF project which integrates two
istrations to communicate and share data, analysis and                 business intelligence tools for data representation Su-
dashboards using open standards and open source                        perset [9] and Metabase [10]. There are many other
technologies. Furthermore, the DAF promotes seman-                     platforms in the same category such as Microsoft
tic interoperability, according to the new European In-                Power BI [11], Tableau [12], Google Data Studio [13]
teroperability Framework (EIF) [6]. To enhance in-                     e Ploty.ly [14] that offer the possibility of use in the
teroperability DAF make use of an ecosystem of on-                     cloud via API and that could allow integration with the
tologies and controlled vocabularies (OntoPiA) [7], a                  DAF, even if with important limitations.
set of ingestion pipelines that performs standardiza-                     Public Tableau allows the creation of complex
tion to incoming data, and a rich set of metadata. Every               dashboards with great flexibility, do not require spe-
dataset in DAF is accompanied by metadata that de-                     cific technical skills nevertheless an application needs
scribes the dataset and its internal structure. It will be             to be installed in locale.
the user's responsibility to define the ontological infor-                Google Data Studio is very intuitive but does not
mation and controlled vocabularies associated with                     allow the use of more than one dataset within the same
the data structure, through the meaning of the semantic                dashboard. It has few data connectors (only for MySql
tags. A tagging system will allow to drive the user to                 [15], and for PostgreSQL [16]) and the quality of the
the correct use of controlled vocabularies and to en-                  dashboards is not comparable to that of the competi-
sure that all datasets can be effectively connected to-                tors in the sector.
gether.                                                                   Plot.ly allows the creation and sharing of quick in-
   In this paper, we focus on DAF data visualization                   teractive dashboards. But it only accepts datasets with
tools, illustrating the weaknesses of some of the most                 a maximum size of 5 MB and the published graphics
famous data visualization tools on the market and the                  must be public (for them to be private it is necessary
advantages of the integration in the DAF of two open                   to pay a subscription). Among the open source catego-
source software (Metabase and Superset, see Section                    ries we have instead distinguished three data visuali-
2). In Section 3, we present the general architecture of               zation tools: Superset [9], Metabase [10], and Redash
the DAF, its main functionalities and the semantic                     [17].
technologies used, with particular reference to Onto-                     All these projects meet the requirements [18] that
PiA, the network of controlled ontologies and vocab-                   an OGD2 visualization tool should possess. Superset
ularies. Section 4 focuses on the process of building a                and Redash are very similar. Both are powerful and
dashboard through Apache Superset. Finally, a case of                  give the possibility to connect to a large number of
use of the DAF will be presented for the construction                  data sources. In addition, they have a powerful inter-
of a dashboard starting from a dataset on tourism in                   face for writing and executing SQL queries.
the Sardinia Region (see Section 5). We conclude the                      Once saved, queries can also be used as a basis for
paper with some future developments (see Section 6).                   the creation of dashboards. Superset supports a larger
                                                                       number of authentication systems than Redash and
2. Related works                                                       Metabase. For example, it includes LDAP3 , the sys-
                                                                       tem used for the unique authentication of all modules
   William S. Cleveland said “The human brain is                       in the DAF. Although Redash is an excellent project
more able to identify and comprehend relationships                     in rapid evolution, Superset [9] has been chosen for
and patterns if data is encoded into visual forms.                     three main reasons: the presence of LDAP authentica-
Graphs allow us to explore data and observe patterns                   tion, the high number of views, and the support of the
that no other approach can achieve.” [8]                               Python language (used throughout the DAF project).
   According to this, we believe that the identification               In addition, Superset was preferred to Metabase, alt-
of information needs is useful for the definition of data              hough Metabase is more intuitive, because its graphs
driven policy and the realization of interface for ana-                are less parametrizable and offers much less types of
lytical tools.                                                         visual representations.
   Therefore, we consider the importance of data vis-
ualization1 and the goal of the PA to obtain useful
trends and information with maximum simplicity and

   1                                                                      2
     The science of visual representation of ‘data’, which has been         Open Government Data. http://www.oecd.org/gov/digital-gov-
abstracted in some schematic form, including attributes or variables   ernment/open-government-data.htm
                                                                          3
for the units of information.                                               Lightweight Directory Access Protocol. http://foldoc.org/ldap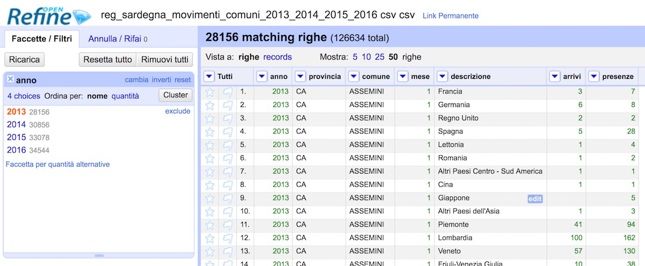
Superset is an open source product hosted on the                  national catalog data. Instead, in the private section,
Apache Foundation GitHub4 platform and is devel-                     the acces is done through a login, thus allowing only
oped using Flask [19] a very lean Python framework                   accredited users to exploit the functionality of query-
[20] for web development. The part that generates the                ing, analyzing and sharing data.
interactive graphs instead makes use of NVD3 [21] a
javascript library built on D3.js [22].
   Any dashboard created with Superset consists of a
series of graphs (called slices in the current version of
Superset installed in the DAF). Each of these can be
resized, moved relative to the others, or shown in full
screen.
   In addition, each dataset represented in a graph can
also be exported in CSV or JSON format or through
SQL queries. The "slices" are created starting from a
table available in the many data sources that Superset
is able to manage. Superset provides two main inter-
faces: the first is the Rich SQL IDE (Interactive De-
velopment Environment) called Sql Lab5 with which                                 Fig. 1. Logical architecture of the DAF
the user can have immediate and flexible access to                      The Dataportal communicates with the rest of the
data or write specific SQL queries (for example UN-                  system through the Kong API Gateway [27] and the
ION of datasets of different annuities); the second is a             MICROSERVICE LAYER. The layer container docker,
data exploration interface that allows the conversion                represented in point (1) of Fig. 1, manages the analysis,
of data tables into rich visual insights.                            cataloging and display of data. This layer encapsulates
   The combination of these two interfaces allows data               some docker containers, including Superset [28],
to be used in different ways. Users can directly view                Metabase [10], Jupyter [29] and CKAN [30]. The lat-
data from tables stored in a variety of databases, ie all            ter implements a component called a harvester, which
those supported by the python SQLAlchemy library                     allows the DAF to collect all datasets within the DAF.
[23].                                                                In addition, CKAN performs data catalog functions
                                                                     and allows the download of datasets. Jupyter is instead
                                                                     a very useful tool for data scientists, as it allows to per-
3. Data & Analytics Framework (DAF)                                  form operations such as data cleaning and transfor-
                                                                     mation, numerical simulations, statistical modeling,
    DAF has a complex architecture which integrates                  machine learning and to run Scala and Python appli-
different components [24].                                           cations on the big data platform of DAF thanks to in-
    Fig. 1 shows a simplified view of two relevant re-               tegration with Apache Spark. On the left side of Fig.
lated characteristics: (1) the interoperability between              1, the Superset container docker is shown: as you can
the components mediated by the use of microservices                  see, in this container there are also databases as Post-
and (2) the use of docker container6 technology that                 greSQL [16], used to store the tables and Redis [31] to
isolates the components for greater security. In fact,               manage the cache. Centralized authentication is guar-
with dockers container, all processes running in con-                anteed by the FreeIPA LDAP [32], an open source so-
tainer A cannot see processes running in another con-                lution for integrated identity management. The point
tainer B and vice versa.                                             (2) of Fig. 1 shows a second layer of docker container
    The Dataportal (private [25] and public [26]) is the             consisting of the platforms OpenTSDB [33], Livy [34]
main point of access to the DAF and its functionalities.             and Nifi [35]. Finally, in the lower part we find the
It is characterized by a public section and a private sec-           Hadoop storage and computational layer [5] that con-
tion.                                                                tains the entire storage platform provided by Hadoop
    In the public section (accessible via https://datapor-           (HDFS [36], Kudu [37] and HBase [36]).
tal.daf.teamdigitale.it/) anyone can browse the data                    The microservices layer is described in the previous
stories 7 and the dashboards associated with the                     study [38]. This layer provides the semantic

   4                                                                   6
     Superset Github repository. https://github.com/apache/incuba-      https://www.docker.com/resources/what-container
                                                                       7
tor-superset                                                            Data stories are an extension of the dashboards, which allow
   5
     https://superset.incubator.apache.org/sqllab.html               you to express what you can see from the views.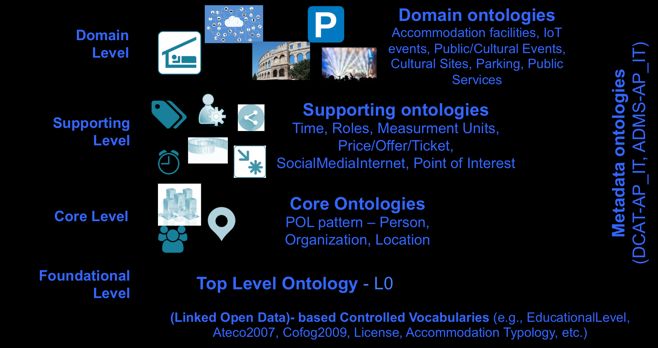
microservices that allow the implementation of se-          consequently the respective urls for ontologies, con-
mantic technologies, namely the standardisation, pro-       trolled vocabularies and data are:
duction, and publication of LOD. These processes can           • https://w3id.org/italia/onto/
be achieved thanks to the presence of OntoPiA [7] a            • https://w3id.org/italia/controlled-vocabulary/
network of remote ontologies and vocabularies, pub-            • https://w3id.org/italia/data/
lished on github. OntoPiA allows the DAF to provide            All URIs are in English but each property and con-
the catalog of controlled vocabularies. Moreover it fa-     cepts of the ontology have a label in Italian and Eng-
vors the function of semantic tagging and the reuse of      lish. Moreover it is possible to browse ontologies and
controlled ontologies and vocabularies by companies         vocabularies and query them with SPARQL from
and PAs. The network, developed with the support of         https://OntoPiA.daf.teamdigitale.it/sparql.
the STLab [39] (Semantic Technology Laboratory of              Since the same problems are often encountered in
the Institute of Cognitive Sciences and Technologies        order to devise ontologies, even when reinventing the
of the CNR [40]) and in collaboration with various          wheel, the ontology design pattern has been used. Fi-
central and local authorities, is issued with an open li-   nally, an indirect reuse of existing ontologies was
cense, is based on the standards of the Semantic Web        made. For example, the FOAF ontology refers to the
and it is aligned with the so-called Core Vocabulary        concept of "person".
[41] of the European Commission's ISA2 program.
OntoPiA was built according to the FAIR [42] model
principles:
   • Findable: permanent URIs are used to identify
     concepts and relationships in the ontology net-
     work and terms in controlled vocabularies. In
     other words, the data is associated with metadata
     and there is always a URI that allows me to relate
     them over time.
   • Accessible: Open standard protocols are used for
     Web access (i.e. HTTP(S)) and for data query (i.e.
     SPARQL). In other words, datasets must be ac-
     cessible by machines (machine-readable).                          Fig. 2. Top level architecture of OntoPiA
   • Interoperable: open standard protocols are used           The architectural level of OntoPiA consists essen-
     to model the data (i.e. RDF and OWL). OntoPiA          tially of three components (Fig. 2):
     use                                                         a) the ontology component (in the middle) with
   • Reusable: all controlled ontologies and vocabu-                   its classes and properties. This blocking dia-
     laries are public, released according to an open                  logues with the ontology called "external
     license (CC-BY 4.0) and are linked to other                       alignments" which in turn connects with the
     standard ontologies available on the Data Web.                    external controlled ontologies and vocabular-
     In the case of OntoPiA, they are open by defini-                  ies of the semantic web. The "external align-
     tion because they are published on github.italia.it,              ment" ontology has been defined entirely by
     in the platform developers with the CC BY 4.0                     Agid [1] for technical reasons and is used for
     license and are connected to other ontologies of                  interfacing with external ontologies (i.e
     the web.                                                          FOAF [43]). These alignments can be
                                                                       "strong", ie it is possible to say that one class
   To apply the first (findable) principle, which is to                is equivalent to another class, or that it is
associate a URI with data, OntoPiA uses the w3id.org                   "more or less similar". So using constructs
service. This service, founded by a community within                   "subClassOf", "subPropertyOf" or "equiva-
the W3C, provides the public and free URI service.                     lent", we can manage these alignments with
The mechanism is simple, it requires, through a "pull                  other ontologies present on the web. This
request" on their github repo, to reserve a name to be                 technique is also used in Dbpedia [44], the fa-
associated with the PROJECT-ID on the URL of this                      mous project born in 2007 to extract struc-
type: https://w3id.org/PROJECT-ID/SUB -ID. For                         tured information from Wikipedia.
OntoPiA the name "italia" has been requested,                    b) On the right we find the Italian application
                                                                       profile, which allows to define rules for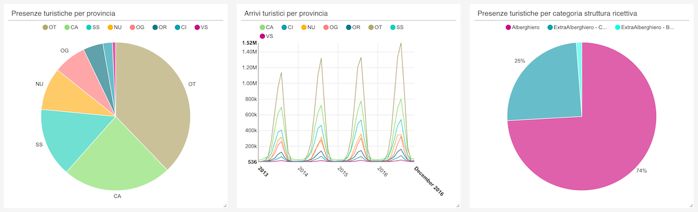
ontologies. For example, it sets rules on the            IoT Events (IoT-AP_IT), People (CPV-AP_IT),
           use of the data catalog defined by the DCAT              Organizations (COV-AP_IT), Addresses / Loca-
           [45] ontology of W3C. This ontology does                 tions (CLV-AP_IT) etc.
           not say for example that a catalog must have          • The Controlled Vocabularies folder that contains
           one and only one title, therefore, if I use the          RDF files (in the three RDF / Turtle, RDF / XML,
           DCAT, I could define even more titles or                 JSON-LD serializations), CSV (UTF-8 encod-
           none! So the application profile allows you to           ing) and Excel. Within the DAF, controlled vo-
           give a minimum of data quality and a bit of              cabularies are datasets and as such include the
           rules.                                                   corresponding metadata that conform to DCAT-
     c) Ontologies are linked to controlled vocabu-                 AP_IT [46]. Some controlled vocabularies are for
           laries (see on the left of Fig. 2). For example,         example: public-event-types, licenses, territorial-
           the ontology of accommodation, has the con-              classifications, classifications-for-accommoda-
           cept of "accommodation" and "type of ac-                 tion-facitilities, classifications-for-organizations,
           commodation". The "type of accommoda-                    etc.
           tion" class is linked to a controlled vocabu-         OntoPiA ontologies are created on levels (see Fig.
           lary of the list of types of accommodation we      3). The core level defines the concept as the address,
           have in Italy. To do this, a notation property     person, organization and others that we have in almost
           has been created: this allows to specify for       all the datasets.
           each concept and property, which is the ref-
           erence vocabulary that controls the instances
           of that concept.
     d) The third figure concerns the application
           profiles, which allows to set constraints on
           ontologies, in order to provide data quality.
           For example, it provides rules that impose
           one and only one title to the dataset. In fact,
           without an application profile, it would even
           be possible to publish an untitled dataset! The
           term DCAT_AP stands for "Data Catalog                            Fig. 3. Ontology levels in OntoPiA
           Application Profile", while "IT" stands for It-    The domain level defines vertical ontologies such as
           aly. So there are two levels of application        receptive structures, events and IoTs, while support
           profiles: one European (DCAT-AP) and the           level are the link between the two previous levels and
           more specific Italian (DCAT-AP_IT) [46].           define concepts such as units of measurement, prices,
           Specific requirements of certain domains are       time etc. Below we have the controlled vocabularies
           treated with separate extensions: for example      used by ontologies and on the side there are two ontol-
           IoT-AP [47] for IoT events, ACCO-AP for            ogies, the DCAT-AP_IT and ADMS-AP_IT [50]. The
           accommodation facilities, POT-AP for ticket        latter represents the ontology for the metadata of on-
           prices and offers, GeoDCAT-AP [48] and             tologies that is based on DCAT-AP_IT but adds fur-
           StatDCAT-AP [49] for geospatial data and           ther elements.
           statistical).                                         At the time this paper was written, OntoPiA have
   The publication of OntoPiA [7] on the Github plat-         25 published ontologies (one under development and
form allows to manage both the versioning of the ma-          two under revision), 264 classes, 22 controlled vocab-
terial (file alignments, ontologies, controlled vocabo-       ularies, a mapping between two controlled vocabular-
laries) and a better collaboration between the Agency         ies and around 10800 axioms.
for Digital Italy and the other PAs.                             OntoPiA allows access to ontologies in a simple
                                                              way, thanks to a series of user interfaces, contained in
                                                              the github OntoPiA-UI repository [51]. Thanks to the
   Currently the repository is divided into two directo-      three open source projects (LODE [52], LodView [53]
ries:                                                         and WebVOWL [54]) it is in fact possible to navigate
   • The Ontologies folder that contains the OWL on-          an ontology respectively in three different forms (tab-
      tologies, serialized in RDF / Turtle RDF / XML          ular, html and graph). OntoPiA also provides a
      and JSON-LD. Some ontologies are for example            SPARQL [55] endpoint (implemented in the DAF via
the Virtuoso open source software [56]) for perform- addition to the already mentioned STLab, we have
ing machine-to-machine queries. For example, the fol- ISTAT, MIBAC, "Piedmont" Region, ANAC, Munic-
lowing query filters events of type "show" and "festi- ipalities of Palermo and Udine, Autonomous Province
val" on the controlled vocabulary of public events and of Trento. Moreover the project, being available on
the result can be saved in the desired format (in CSV, Github, anyone can always comment and / or propose
JSON etc.). From the query we deduce that to query changes or corrections.
the controlled vocabularies of OntoPiA we must use To implement the semantic services, the DAF uses,
the W3C SKOS [57] ontology. This ontology is typi- in addition to OntoPiA, the OntoNetHub web applica-
cally used for the representation of taxonomies, of tion [58], implemented to manage the ontology net-
code lists, thesauri and therefore also of controlled vo- work. This application allows you to upload, delete
cabularies. and index the elements of network ontologies. It was
Although used in the DAF, OntoPiA is an inde- designed as an extension to Apache Stanbol [59] and
pendent project open to everyone's collaboration. Cur- released as a docker container.
rently several Public Administrations collaborate: in
of a given administration and accessible according to
the relative privacy policy. Using the search form you
4. Building the Dashboard Process can search with keywords or browse through the cate-
gories that describe the domain. In the current version
The process of creating a dashboard in the DAF is of the DAF, some open datasets have not yet been
structured, as illustrated in Fig. 4, in five steps. The loaded. It is however possible to analyze a specific da-
process is inspired by the KDD model [60] for extract- taset not present in the DAF, sending a request to the
ing useful knowledge from volumes of data. The first related Public Administration or to the Digital Trans-
two steps are presented in Section 4.1 and show the formation Team. In fact the load of a dataset on the
Dataportal and Jupyter, a search for the dataset, data DAF are operations only granted to specific users of
analysis and a verification of the minimum quality re- the organization that assume the role of Editor [61].
quirements are carried out. The other three steps (see Once the dataset has been identified, we move on to
Section 4.2) are activities carried out within Superset. the second step consisting in carrying out a first anal-
During this phase the dataset is opened in Superset, ysis of the data to evaluate a part of the quality charac-
some parameters of the dataset indispensable for the teristics foreseen by the ISO / IEC 25024 [62] and de-
realization of the slices are defined (e.g. dimensions scribed in action no. 9 of the National guidelines for
and metrics), finally the slices and the final dashboard the enhancement of public information8 . In particular,
are created. in this phase there are only 4 of the 15 quality features
and they are: syntactic and semantic accuracy, con-
sistency, completeness and correctness. Data quality is
a necessary requirement for generating useful infor-
mation and value for citizens. To carry out this activity
Fig. 4. Drafting process of the dashboard in the DAF the DAF provides the Jupyter Notebook tool. Alterna-
tively, you can download the dataset from the DAF
4.1. Dataset research and quality analysis and perform the analysis using the preferred tool.
In the first step you look for the dataset to analyze. 4.2. Dataset analysis, cataloging and visualization
This activity can be carried out in two ways: through
the public portal [26], as anonymous visitors, or from The last three steps of the DAF dashboard creation
the private portal [25]. Access to the private portal process are mainly realized in the components of the
takes place after registration, which can be carried out Superset. Before proceeding to the realization of the
from the public portal by clicking on the "Request ac- slices, it is necessary to modify the settings of the
cess" button. Both methods have the same graphical fields (or columns in the Superset jargon) of the table.
interface, the only difference is the numbers of da- This means that it will be necessary to verify the cor-
tasets that can be viewed: in the public data portal only rect assignment of the field types (INT, BIGINT,
the open datasets are visible, while on the private data CHAR, DATETIME etc.), establish the dimensions on
portal it is also possible to access the reserved datasets
8
https://lg-patrimonio-pubblico.readthedocs.iowhich to perform the aggregations and define the rel- • Which types of structures are present?
ative metrics. This allows the local government to decide how and
Once the step of settings of local tables is finished, where to spend public money. For example, with re-
it is possible to proceed with the realization of the first gard to the first question, if a high percentage of Ger-
slice. Superset has no less than 34 different types of man tourism is highlighted, the Mayor could establish
graphics9 . The choice of the type of visualization will the installation of tourist road signs in German or pro-
be made based on what we want to communicate and vide German language courses for City employees.
the type of phenomenon that we are describing. Some Regarding the second question, if you find that the
of the most used graphics in the DAF are Distribuition German tourism is concentrated mainly in the months
bar, Pie chart, Time series line chart, Big number total, of September and June, the local administrator may
Big number with trendline, Country map, Pivot table, choose for example to enhance tourist services in the
World cloud, Treemap and Map box. areas and months involved, extending the opening
The last step is the creation of the dashboard. The hours of offices or municipality health districts.
number, type and position of the slices inside the dash- In the open data catalog of the Sardinia Region
board will depend on what you want to represent and (published on dati.regione.sardegna.it) it is possible to
the message you want to give. find the datasets related to the movements of the clients
in the hospitality establishments in the years between
2013 and 2016. The data derive from the communica-
5. Use Case Study tions for statistical and obligatory purposes by law,
which the accommodation facilities do to the Sardinia
The case study we created in the DAF on February Region. Finally, the Region transmits the data to
4, 2018 during the Open Sardinia Contest10, concerns ISTAT (The Italian National Institute of Statistics), ac-
the development of a dashboard and the related data cording to the current legal requirements. During the
story based on the Sardinia Region's tourism dataset. period of realization of the dashboard (April 2018), the
Specifically, we describe the 5 steps of the process for DAF catalog did not yet contain this data. For this rea-
creating a dashboard illustrated in the previous para- son, a data ingestion process was carried out through
graph. In particular, the phenomenon to be studied and the support of the Digital Transformation Team to
the analysis of the relative dataset will be introduced transfer the necessary data sets from the data.re-
(see paragraph 5.1), the whole development activity in gione.sardegna.it portal into the DAF. At the ingestion
Superset will be illustrated (see paragraph 5.2), con- time, every dataset get transformed and enriched so
cerning the configuration of the dataset, the realization that the output can be easily "linked" to other datasets.
of the slices and the dashboard. In paragraph 5.3 the The data ingestion phase includes two main activities:
case of data story associated with the dashboard is pre- • data are transformed according to internal con-
sented. ventions, for example the date format, URL for-
mat, address format etc;
5.1. Sardinia Tourism dataset • datasets are associated to concepts and attributes
into domain ontologies via semantic tagging.
The tourism industry in general occupies an im- This mechanism consists of linking columns /
portant place in the economy of a country and tourism features of the datasets to the corresponding on-
activities are a potential source of employment, so it is tologies of OntoPiA. This is done to specify the
good to know the volume of tourism and its character- concepts and the attributes of the datasets con-
istics. This is important for the local government to an- tain. For example, let's consider a dataset con-
swer questions such as: taining the list of accommodations. Here the col-
• What is the origin of tourism between June and umn related to accommodation typology (e.g. ho-
September? tel, camping, etc.) will be tagged with the corre-
• What is the tourist period preferred by the Ger- sponding semantic tag contained in the "Accomo-
mans in the Olbia area? dation ontology" (ACCO-AP_IT) that we can
• What is the accommodation capacity in the south find in OntoPiA Github repository at path Ontol-
of the island? ogie/ACCO/. For example, this ontology presents
9 10
https://superset.incubator.apache.org/gallery.html#visualiza- Contest dedicated to open data, promoted by the Sardinia Re-
tions-gallery gion and held in the period from 16/10/2017 to 21/01/2018.
http://contest.formez.it/the AccommodationTypology class that repre- visualization, in this case it was preferred to use an ex-
sents the typology of accommodation facility. ternal tool. As a result, the local datasets were down-
The elements of this class are skos:Concept and loaded and a simple data analysis was performed
must be defined according to the controlled vo- through OpenRefine [64] (open source tool for data
cabulary available at https://w3id.org/italia/con- transformation and cleaning). The analysis of Fig. 6
trolled-vocabulary/classifications-for-accommo- immediately showed that the dataset had excellent
dation-facilities/accommodation-typology". quality and met all four minimum quality characteris-
The following datasets (in CSV format) are those tics mentioned in paragraph 4.1. From a first observa-
selected for the case study: tion, the fields "year" and "month" appeared suitable
- (1) Tourist movements in Sardinia by municipal- for the realization of trend graphs on the arrivals and
ity presences fields.
- (2) Tourist movements in Sardinia by province
- (3) Tourist movements in Sardinia by macro type
of accommodation facility
- (4) Capacity for accommodation facilities in Sar-
dinia
The CSV (1-3) collect the arrivals (number of
hosted customers) and the presence (number of nights
spent) of tourists in Sardinia, divided by the tourist's
origin and type of accommodation. The CSV (4) col-
lects the capacities of the receptive structures of the
Sardinia Region. The capacity measures the con-
sistency in terms of number of accommodation facili- Fig. 6. Analysis of datasets with OpenRefine
ties and related beds and rooms.
5.2. Sardinia Tourism dashboard
In Fig. 5 (point 4) we can see that the dataset related
to the Sardinian tourist movements has been linked to
the Jupyter and Superset tools, while the association is
not yet available for Metabase. For instance, to open
the dataset in Superset it is sufficient to click on the
"Tools" button (Fig. 5, point 2). At this point we have
reached the third step of the process of creating the
dashboard described in paragraph 4. In this phase the
Fig. 5. Dataset detail "Tourist movements in Sardinia" Superset tables will be configured. As an example,
let's consider the type of slice Table view, named “Ar-
As illustrated in point 1 of Fig. 5, in the data portal rivi e presenze totali per provenienza turista”, easily
it is possible to perform a series of operations includ- searchable by setting the filter on the slice name in Su-
ing downloading the dataset (limited to 1000 records), perset. As indicated by the arrow in Fig. 7, the slice is
obtaining the endpoint API (button "API" in point 2) associated with the data source (i.e. the table associ-
to make REST API calls , access the analysis tools ated with the dataset) in Superset.
("TOOLS" button in point 4) and display the slices
("WIDGET" button in point 2) made with the current
dataset. The "OPEN CKAN" button (point 3 of Fig. 5)
allows access to the CKAN [30], module integrated
into the DAF and allows to see all metadata associated
to the dataset. The Preview button in point 2 of Fig. 5 Fig. 7. Editing a slice of type Table view
provides a preview in JSON format [63] of the data. If we click on the Edit the datasource's configura-
As already mentioned, the DAF provides Jupyter tion link, the Edit table form opens (see Figura 6). The
Notebook, a powerful data analysis tool. Since there is form is divided into three tabs (Detail, List Columns
no need for an in-depth analysis of the dataset and and List Metrics) and allows the modification of the
wanting to focus the attention above all on the data table parameters. The initial tab shows some basicinformation such as the table name and the associated not a standard field, but is dynamically generated by
slices (the table considered in this use case has 17 the function "Expression = concat (cast (year as string),
slices). The second tab displays the fields in the table, '-', cast (month as string), '-01 00:00:00') "And from
for example, province, macro-typology, arrivals, etc. the option" Datetime Format =% Y-% m-% d% H:%
The first and third columns respectively contain the M:% S ": this sets the timestamp format according to
name of the field (e.g. province, macro-typology, arri- the Python datetime string pattern. Here the syntax can
vals, etc.) and the type of data contained (STRING, vary depending on the db used: the DAF uses Apache
INT, DATETIME, etc.). Impala [65] the engine for Hadoop SQL queries [5]. If
you use SQLite [66] (the default Superset database)
the setting to use would be "Expression = year || '-' ||
month "and" Datetime Format =% Y-% d ". This hap-
pens because SQLite accepts a date format of type
Year + Month that does not exist in Impala. The only
way to get the same result in Impala is to use a
timestamp format and concatenate the "year" and
"month" fields with the string '-01 00:00:00'.
Now let's consider the "year" field: on this the Is tem-
poral option has been set which tells Superset to treat
the values to describe variable phenomena over time.
Fig. 8. Edit table form On this same field, "Datetime format =% Y" was set,
in order to tell Superset to treat the values as years. If
The following columns show how the values can be in the ingestion phase (as happened in this case) the
treated for display: field should be of an incorrect type (for example INT)
• groupable: if you want the values to be grouped it is possible to use the option "Database expression =
by contained values (eg to create graphs like date_part ('year', '{}')" to perform the conversion from
treemap or cakes); INT to DATETIME. The Impala function "date_part"
• filtertable: if you want to have the option to filter in addition to casting from INT to DATETIME, ex-
data for one or more values contained in that col- tracts the year from the timestamp.
umn; Once the dimensions have been established, ie the
• Count distinct, if you want to have the total recur- fields on which to group, the metrics (SUM, AVG,
rences; etc.) to be applied to these groupings must be defined
• Sum: if you want to have the total (= sum) of the (third and last tab of Fig. 8). For example, to create the
values contained in that column (applies only to Table view represented in Fig. 7, a grouping was set
columns containing numeric values); on the "Origin" field, and the "sum_arrivi" and
• Min: if you want to know the minimum value "sum_presenze" metrics were defined and assigned us-
among all those contained in that column; ing the SUM (arrivals) and SUM (presences) func-
• Max: if you want to know the maximum value tions). The result is a Table view with the list of arri-
among all those contained in that column; vals and
• Is Temporal: if the column contains a time value The result is a Table view with the list of arrivals and
(day, month, year, hours, minutes). presences divided by geographical area of origin of the
Superset automatically assigns the correct properties tourist. Another metric of this table has been defined
in relation to the type of data declared, but you can de- in the "_presenzamedia" field, to realize the slice on
cide to change them or increase the details. Special at- average daily presence of tourists (graph 3 of Fig. 11).
tention should be paid to DATETIME columns where To create this metric simply click on the "+" icon
formatting and ordering by day, month and year can (which performs the function of add new record), then
change. Superset allows you to customize them thanks provide a name (in this case "_presenzamedia" has
to all the combinations that can be created with the been chosen) and the SQL expression that defines it:
management of dates in Python. In the specific case of "SQL Expression = AVG (attendance / arrivals) ".
the table in Fig. 8, the format "% Y-% m-% d% H:% After completing the table configuration phase, we
M:% S" was used for the calculated field move on to the fourth step and create the dashboard,
"_anno_mese", ie a timestamp useful for a time based which consists in providing the slices. Superset has no
analysis on month / year. The "_anno_mese" field is less than 34 different types of graphics. Some of the
most important and used in DAF dashboards areDistribuition bar, Pie chart, Time series line chart, Big • Pivot arrivals and presences by year and tourist
number total, Big number with trendline, Country map, origin
Pivot table, World cloud, Treemap and Map box. Fig. • Average presence
9 shows the links that allow access to the configuration • Total attendance (number of nights)
of the slice discussed in the previous step. The first • Arrivals (number of customers) total
link provides access to the configuration in JSON for- • Accommodation facilities (trend over time by
mat, while the second allows you to change the set- type)
tings through the graphical interface and to explore the • Tourist presences by category accommodation
data using one of the many types of graphs available facility
in Superset (by default the Table view is always pro- • Arrivals and total attendance by tourist origin
posed).
• Tourist presences by province
• Accommodation facilities (province and munici-
pality capacity distribution)
• Tourist arrivals by province.
We can add slices all together and then decide at the
Fig. 9. Slice links end to resize or move them, but it is advisable to im-
mediately get an idea of the final result to be achieved
Now supposing we want to create a graph showing the
based on the information we want to provide.
average number of tourists in Sardinia and at the same
The layout of the Superset dashboards is very flexible:
time a graph presenting the trend of presence over time.
slices can be easily resized by drag and drop. Between
This is achievable thanks to a slice view as Big number
one slice and another you can insert a box containing
with trendline. Using the "_anno_mese" field on the
abscissa axis and on the ordinates the "_presen- text or html. For reasons of space, in Fig. 10 only part
of the realized dashboard11 is shown.
zamedia" metric will get the result of graph 3 in Fig.
11.
Many other options can be applied on the slice: for ex-
ample, in the Filters section you can add one or more
values to exclude in the results. For more complex fil-
ters, you can use Where clause option, which allows
you to write conditions directly in SQL.
There is also the possibility to create complex tables
(such as pivot tables) or create dynamic selectable fil-
ters that can be used directly by the user on the dash-
board.
Once we have finished the first slice, we will already
be able to proceed with the creation of the dashboard
(fifth step of the process), which initially will naturally
contain only one slice. Each slice must belong to at
least one Superset dashboard, so each time the slice is
saved, Superset asks which dashboard it should belong
to.
Then the creation of the dashboard takes place during
the provision of the slice or from the dedicated menu.
For the realization of the tourist movements dashboard
in Sardinia from 2013 to 2016 (Fig. 10), the following
13 slices were used:
• Accommodation facilities (distribution by type
and province) Fig. 10. A section of the dashboard of tourist movements in Sardinia
• Attendance trends by tourist origin
• Presence filter
11
The complete dashboard is accessible online at
http://bit.ly/storia-turismo-sardo-story5.3. Sardinia tourism data story
With the data story we try to provide an interpreta-
tion of a phenomenon from the data. This narration
was published in the Public Data portal and can be
accessed from the Menu > Community > Story.
Thanks to the filters the user can analyze the data by
year, province, macro-typology, origin and month. Fig. 13. Average presence of German tourism
For example, analyzing the datasets as a whole (i.e.
without setting filters) it is possible to observe how As shown in Fig. 14, German tourism is mainly dis-
Sardinian tourism has grown steadily both in terms of tributed in the provinces of Olbia-Tempio, Cagliari
presences and arrivals during the four years of survey and Sassari with preference for hotel facilities in 74%
(2013-2016): 10 million arrivals in total with an aver- of cases.
age stay of 3.14 days which generated 47.9 million and
a half million visitors in the accommodation facilities
of the island.
Fig. 14. Presence / arrivals by province and structure
Fig. 11. Presence, arrivals and average presence of tourists in Sar-
dinia between 2013 and 2016
From the point of view of the foreign tourist origin (see
Fig. 12), the most important numbers are (for 2016) 6. Conclusion
those of the Germans (1.74 million) and the French
(1.18 million), while the major presences from Italy In this paper we presented the shortcomings of the
they are those of the residents of Lombardy (1.80 mil- some data visualizing tools on the market with respect
lion) and Lazio (795 thousand). An ANSA article [67] to the potential of open source tools integrated into the
confirms these data stating that 2016 "was a record DAF, a project requested by the Italian Government to
year for Sardinian tourism: 2.9 million arrivals with an overcome the difficulties of channeling data stored in
average stay of 4.6 days which generated 13.5 million local public administrations into a single container
attendance in the accommodation facilities of the Is- (data lake). Therefore, we have introduced the DAF
land ". architecture and the semantic functionality of two
components (OntoPiA and OntoNetHub). In particular,
we introduced Superset, a data visualization tool
which has a central role in the creation of dashboards.
Finally, a dashboard use case was presented using
some datasets from the Sardinia Region present in the
DAF. The use case represents not only one of the first
experimental uses of the DAF but also the demonstra-
tion of how, following a process in only 5 steps, it is
possible to extract information from large data collec-
tions with a simple tool available not only to the PA,
but also to businesses and ordinary citizens. Currently
Fig. 12. Arrivals and total attendance by the tourist's origin the DAF is still being tested (alpha version) and there
Focusing on the data of the German provenance (filter are critical issues, such as the reluctance of some PAs
set on field provenance = Germany) we find an aver- who still do not want to provide their data and accept
age presence on the period 2013-2016 equal to 5.91 the arrival of the new platform. But in general the
million and a particular appreciation of the warmer number of public and private subjects who are using it
months that makes it reach a maximum average attend- is growing more and more (also thanks to the renewal
ance of 7.17 in November 2014 (see Fig. 13). of the loan approved by the new Italian government),therefore it is very likely that the project will grow in (DAF) - Developer Documentation.” [Online]. Available:
https://daf-docs.readthedocs.io/. [Accessed: 15-Sep-
the short term. 2018].
[25] “DAF Private Dataportal.” [Online]. Available:
https://dataportal.daf.teamdigitale.it/#/login. [Accessed:
References 05-Jan-2019].
[26] “DAF - Public Dataportal.” [Online]. Available:
https://dataportal.daf.teamdigitale.it. [Accessed: 05-Jan-
[1] “Agency for Digital Italy (Agid).” [Online]. Available: 2019].
https://www.agid.gov.it/. [Accessed: 01-Dec-2018]. [27] “Kong.” [Online]. Available: https://konghq.com/.
[2] SPC BOARD, “Linee guida per l’interoperabilità [Accessed: 15-Sep-2018].
semantica attraverso i Linked Open Data.” Digital Italian [28] Apache Software Foundation and Apache Superset
Agency, Rome, p. 15, 2013. Contributors, “Apache Superset — Apache Superset
[3] D. Team Transformation, “GitHub - italia/daf: Data & documentation,” 2018. [Online]. Available:
Analytics Framework (DAF).” [Online]. Available: https://superset.incubator.apache.org/.
https://github.com/italia/daf. [Accessed: 10-Sep-2018]. [29] Project Jupyter, “Project Jupyter | Home,” 2017. .
[4] “Digital Transformation Team.” [Online]. Available: [30] “CKAN.” [Online]. Available:
https://teamdigitale.governo.it. [Accessed: 01-Jun-2018]. https://github.com/ckan/ckan. [Accessed: 12-Sep-2018].
[5] C. H. E. Hadoop, “Apache hadoop.” [Online]. Available: [31] “Redis.” [Online]. Available: https://redis.io. [Accessed:
http://hadoop.apache.org/. 15-Sep-2018].
[6] “European Interoperability Framework (EIF).” [Online]. [32] “FreeIPA LDAP.” [Online]. Available:
Available: https://ec.europa.eu/isa2/eif_en. [Accessed: https://www.freeipa.org/. [Accessed: 19-Sep-2018].
10-Dec-2018]. [33] StumbleUpon, “OpenTSDB - A Distributed, Scalable
[7] “OntoPia.” . Monitoring System,” 2012. .
[8] B. I. U. Dur, “Analysis of Data Visualizations in Daily [34] “Apache Livy.” [Online]. Available:
Newspapers in Terms of Graphic Design,” Procedia - Soc. https://livy.incubator.apache.org/. [Accessed: 19-Sep-
Behav. Sci., vol. 51, pp. 278–283, 2012. 2018].
[9] “Apache Superset.” [Online]. Available: [35] The Apache Software Foundation, “Apache NiFi,”
https://superset.incubator.apache.org. [Accessed: 19- Website, 2017. .
Aug-2018]. [36] A. HBase, M. Cafarella, D. Cutting, and A. HBase,
[10] “Metabase.” [Online]. Available: “Apache HBase,” Http://Hbase.Apache.Org/, 2015.
https://www.metabase.com/. [Accessed: 16-Sep-2018]. [Online]. Available: https://hbase.apache.org/. [Accessed:
[11] C. Sabotta, “Introducing Microsoft BI Reporting and 12-Sep-2018].
Analysis Tools,” Microsoft, 2015. [Online]. Available: [37] “Apache Kudu.” [Online]. Available:
http://msdn.microsoft.com/en-us/library/d0e16108-7123- https://kudu.apache.org/. [Accessed: 11-Sep-2018].
4788-87b3-05db962dbc94. [38] F. Fallucchi, M. Petito, and E. W. De Luca, “Analysing
[12] Tableau, “Free Data Visualization Software,” Tableau and Visualising Open Data within the Data & Analytics
Public. 2011. Framework.”
[13] “Google Data Studio.” [Online]. Available: [39] “STLab Semantic Technology Laboratory.” .
https://datastudio.google.com/. [Accessed: 15-Sep-2018]. [40] “Istituto di Scienze e Tecnologie della Cognizione
[14] Plotly, “Modern Visualization for the Data Era - Plotly,” (ISTC).” [Online]. Available: https://www.istc.cnr.it/.
2017. [Online]. Available: https://plot.ly/. [Accessed: 15-Jan-2019].
[15] “MySql.” [Online]. Available: https://www.mysql.com/i. [41] S. I. C. (SEMIC), “Core Vocabularies.” [Online].
[Accessed: 15-Sep-2018]. Available:
[16] PostgreSQL, “PostgreSQL: The world’s most advanced https://joinup.ec.europa.eu/collection/semantic-
open source database,” http://www.postgresql.org/, 2014. interoperability-community-semic/core-vocabularies.
[Online]. Available: http://www.postgresql.org/. [Accessed: 01-Dec-2018].
[17] “Redash.” [Online]. Available: [42] M. D. Wilkinson et al., “The FAIR Guiding Principles for
https://github.com/getredash/redash. [Accessed: 15-Sep- scientific data management and stewardship,” Sci. Data,
2018]. vol. 3, p. 160018, Mar. 2016.
[18] A. Graves and J. Hendler, “Visualization tools for open [43] W3C, “FOAF Vocabulary Specification 0.99,” 2014.
government data,” in Proceedings of the 14th Annual [Online]. Available: http://xmlns.com/foaf/spec/.
International Conference on Digital Government [Accessed: 02-Sep-2018].
Research - dg.o ’13, 2013, p. 136. [44] S. Auer, C. Bizer, G. Kobilarov, J. Lehmann, R. Cyganiak,
[19] A. Ronacher, “Flask MicroFramework.” [Online]. and Z. Ives, “DBpedia: A nucleus for a Web of open data,”
Available: http://flask.pocoo.org/. [Accessed: 10-Sep- in Lecture Notes in Computer Science (including
2018]. subseries Lecture Notes in Artificial Intelligence and
[20] “Python.” [Online]. Available: https://www.python.org/. Lecture Notes in Bioinformatics), 2007.
[Accessed: 15-Sep-2018]. [45] W3C, “Data Catalog Vocabulary (DCAT),” 2014. .
[21] “NVD3 Project.” [Online]. Available: http://nvd3.org/. [46] Agid, “DCAT-AP_IT Italian Application Profile for data
[Accessed: 15-Sep-2018]. portals in Europe,” 2016. [Online]. Available:
[22] R. van Dierendonck, S. van Tienhoven, and T. Elid, https://www.dati.gov.it/sites/default/files/DCAT-
“D3.JS: Data-Driven Documents,” 2015. AP_IT_v10.pdf. [Accessed: 02-Sep-2018].
[23] “SQLAlchemy.” [Online]. Available: [47] A. Gangemi, R. Lillo, G. Lodi, A. G. Nuzzolese, and V.
https://www.sqlalchemy.org/. [Accessed: 11-Sep-2018]. Presutti, “A pattern-based ontology for the Internet of
[24] D. Team Transformation, “Data & Analytics Framework Things.”[48] A. Perego, V. Cetl, A. Friis-Christensen, and M. Lutz,
“GeoDCAT - AP : Representing geographic metadata by
using the ‘ DCAT application profile for data portals in
Europe ,’” in Workshop on Integrating Geospatial and
Statistical Standards, 2017.
[49] M. Pellegrino, “StatDCAT-AP: Representing statistical
metadata by using the ‘DCAT application profile for data
portals in Europe,’” in Workshop on Integrating
Geospatial and Statistical Standards 2017, 2017.
[50] E. Commission, “ADMS Application Profile for solutions
on Joinup,” 2016. [Online]. Available:
https://joinup.ec.europa.eu/release/adms-ap-joinup-
version/20. [Accessed: 10-Jan-2019].
[51] Agid, “OntoPiA-UI.” .
[52] S. Peroni, D. Shotton, and F. Vitali, “The live OWL
documentation environment: A tool for the automatic
generation of ontology documentation,” in Lecture Notes
in Computer Science (including subseries Lecture Notes
in Artificial Intelligence and Lecture Notes in
Bioinformatics), 2012.
[53] “LodView.” [Online]. Available:
https://www.w3.org/2001/sw/wiki/LodView. [Accessed:
02-Jan-2019].
[54] S. Lohmann, V. Link, E. Marbach, and S. Negru,
“WebVOWL: Web-based visualization of ontologies,” in
Lecture Notes in Computer Science (including subseries
Lecture Notes in Artificial Intelligence and Lecture Notes
in Bioinformatics), 2015.
[55] E. Prud’Hommeaux, A. Seaborne, E. Prud, and H.
Laboratories, “SPARQL Query Language for RDF,” W3C
Work. Draft., 2008.
[56] “OpenLink Virtuoso.” [Online]. Available:
https://virtuoso.openlinksw.com. [Accessed: 03-Jan-
2019].
[57] S. R. A. L. / U. of O. Alistair Miles and U. of M. Sean
Bechhofer, “SKOS Simple Knowledge Organization
System Reference,” W3C Recommendation 18 August
2009. 2009.
[58] T. Digitale, “OntoNetHub,” 2018. [Online]. Available:
https://github.com/teamdigitale/ontonethub. [Accessed:
08-Jan-2019].
[59] “Apache Stanbol.” [Online]. Available:
https://stanbol.apache.org/. [Accessed: 09-Nov-2018].
[60] U. Fayyad, G. Piatetsky-Shapiro, and P. Smyth, “The
KDD process for extracting useful knowledge from
volumes of data,” Commun. ACM, 1996.
[61] “DAF - User manual.” [Online]. Available: https://daf-
dataportal.readthedocs.io. [Accessed: 14-Sep-2018].
[62] ISO/IEC, “ISO/IEC 25024:2015 Systems and software
engineering — Systems and software Quality
Requirements and Evaluation (SQuaRE) — Measurement
of data quality,” International Standard ISO/IEC
25024:2015. [Online]. Available:
https://www.iso.org/obp/ui/#iso:std:iso-iec:25024:ed-
1:v1:en. [Accessed: 14-Sep-2018].
[63] S. S. Sriparasa, JavaScript and JSON Essentials: 2013.
[64] “OpenRefine.” [Online]. Available: http://openrefine.org/.
[Accessed: 15-Sep-2018].
[65] “Apache Impala.” [Online]. Available:
https://impala.apache.org/. [Accessed: 15-Sep-2018].
[66] “SQLite relational database management system.”
[Online]. Available: https://www.sqlite.org/. [Accessed:
15-Sep-2018].
[67] “Turismo: 2,9mln arrivi in Sardegna 2016,” Ansa,
Cagliari, 24-May-2018.You can also read