Atlas of MS 3rd edition - PART 1: MS Society of Canada
←
→
Page content transcription
If your browser does not render page correctly, please read the page content below
Atlas of MS
                 3rd edition
                 PART 1 :
                 Mapping multiple
                 sclerosis around the world
                 key epidemiology findings

September 2020
About this report
This report was prepared by Rachel King,
International Evidence Manager, Multiple
Sclerosis International Federation (MSIF).

Contributors
MSIF would like to thank the extensive number
of collaborators and contributors involved in this global
report, without whom it would not have been possible.
You can find a full list of acknowledgements
at the end of the report.

For additional data, information and documents
Please visit our website to access the interactive
chart and map tool, country factsheets, the full
dataset and other materials to help you use
the Atlas of MS: www.atlasofms.org.

                                     Citation
                                     The Multiple Sclerosis International
                                     Federation, Atlas of MS, 3rd Edition
                                     (September 2020).

                                     Published by
                                     The Multiple Sclerosis International
                                     Federation (MSIF), September 2020.
                                     Copyright © Multiple Sclerosis
                                     International Federation (MSIF)

                                     Report Design
                                     Osomi | www.osomi.co.uk

                                                                            2
Foreword
We established the Atlas of MS in 2008 with the World Health
Organization to address the huge lack of data on MS around the globe.
We continued to refine and improve the methodology with our second
edition in 2013 and this newest edition is no exception. We’ve been
able to collect data from 115 countries covering 87% of the world’s
population. We have also improved the way we fill in the gaps, making
our estimate of 2.8 million people living with MS worldwide our most
accurate yet. The Atlas shows a much larger number of children and
young people under 18 living with MS than was known before. It confirms
the high proportion of females living with MS and shows a variation
in this proportion between different regions. These and other findings
need attention in medical research and in the shaping of healthcare
and policies to improve the quality of life of people living with MS.
Since the last edition of the Atlas of MS in 2013, we have seen
continued improvement in diagnostic guidelines and their global
adoption is enabling many people with MS to be diagnosed earlier
in the disease course. This is one of the factors contributing to
our higher estimate of the total number of people living with MS.
Of course, importantly, an earlier diagnosis opens up the window for
earlier effective intervention with disease modifying therapies and
offers the possibility to postpone the accumulation of disability.
Globally there have been improvements in data quality, with
14 new countries being able to report data for the first time
and 84% citing peer-reviewed or MS registry data for their
prevalence figures, an increase of 13% since 2013. But there are
still big gaps in our understanding, particularly around incidence,
pediatric MS and MS in low income countries and Africa.
We hope that the MS community will help us fill these gaps and
help keep the Atlas up to date, by reporting new epidemiology data
through the website www.atlasofms.org and that people affected by
MS, healthcare professionals, researchers and MS patient groups and
organisations will make the most of this vital open-source resource.

Peer Baneke
CEO of the MS International Federation

                                 This 3rd edition of the Atlas of MS provides updated data on
                                 the prevalence and incidence of multiple sclerosis around the
                                 world. The information presented in this 3rd edition will guide
                                 policy-makers, health planners and specialists, in order to
                                 decrease inequities and improve care to MS patients globally.
                                 It provides a valuable tool for decision making and the planning
                                 of services to diagnose, treat and support people with MS.
                                 Tarun Dua
                                 Unit Head, Brain Health Unit, Department of Mental
                                 health and substance use, World Health Organization
                                                                                                    3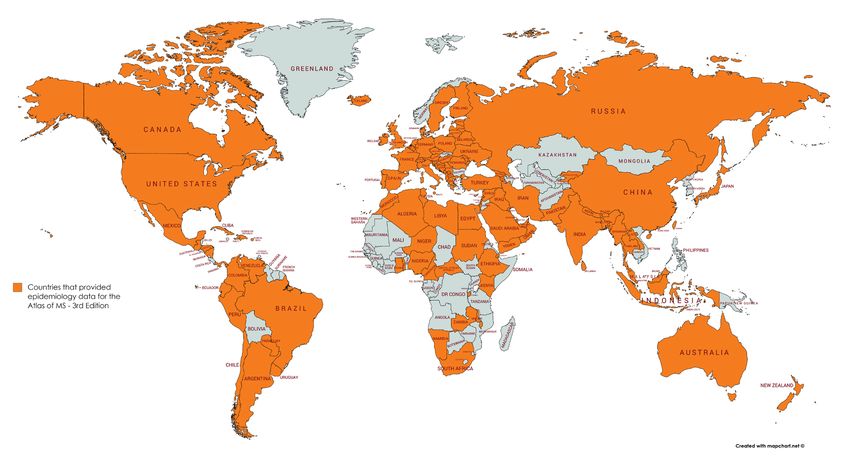
What is MS?
• Multiple sclerosis (MS) is a neurological condition that
  affects the brain and spinal cord (the central nervous
  system), which control all bodily functions.
• MS causes damage to the coating that protects the nerves
  (myelin). Myelin insulates nerves, acting like the covering
  of an electric wire. The loss of myelin (demyelination) is
  accompanied by a disruption in the ability of the nerves
  to conduct electrical impulses to and from the brain. This
  causes a range of MS symptoms, such as blurred vision,
  weak limbs, tingling sensations, dizziness and fatigue.
• MS symptoms vary widely between people. For some people,
  MS is characterised by periods of relapse and remission
  while for others it has a progressive pattern. For everyone
  with MS, it makes life unpredictable. It is a common life-long
  condition and in many countries, it is the leading cause of
  non-traumatic neurological disability in young adults. This
  has major implications for the quality of life of people with
  MS and their families and friends, and for the cost to society
  if their condition is not adequately managed.

Introduction
Global information on MS epidemiology and healthcare accessibility
for people affected by MS is fragmented. The Atlas of MS aims to
bring together all available information in an open-source data set
to allow a more complete understanding of the burden of the disease
and provide useful insights on how it varies across the world.

      The Atlas of MS is unique in that it is not a standard review
      of the published literature, but instead seeks to reach out to
      organisations and experts in every country in the world asking
      them to provide the most up-to-date information on MS.

                                                                       4
The first Atlas of MS - published in 2008 as a joint project by
the MS International Federation (MSIF) and the World Health
Organization - was one of the most cited global resources on
MS. The 2013 edition has been used to inform research initiatives
as well as for campaigning and advocacy.
Together with our international working group, panel of expert
advisors and our epidemiology partner McKing Consulting
Corporation, we have strived to improve the volume, reach and
accuracy of the data in this 3rd edition. Additionally, we have focused
on making the data more accessible by improving the website as
well as providing extra materials such as country factsheets. This
edition of the Atlas collected data around the following themes:
• Epidemiology of MS: focuses on the number of people
  with MS, how this varies across the globe, as well as
  demographic data such as age and gender.

• Clinical management of MS: looks at the clinical management
  of MS and places particular emphasis on the barriers to
  accessing healthcare and disease modifying treatments.

This report presents the key epidemiological findings. The clinical
management data will be available in early 2021 – sign up on the
website to be notified of its release (www.atlasofms.org).

What is epidemiology?
Epidemiology is the study of the number of people
affected by a condition and how it varies across different
groups of people (demographics, regions, nations). It is
also used to illuminate risk factors and changes over time.
Two common epidemiological terms
are prevalence and incidence:
• Prevalence is the number of people who are living
  with a condition. This can be shown as the estimated
  number of people or as the number per 100,000 people.
• Incidence refers to the number of new cases of
  a condition diagnosed within a set period of time,
  normally the number of people diagnosed in a year.

                                                                          5
Summary of key findings

                                      There are 2.8 million people living with
                                      MS around the globe. This is our most
                                      accurate and up-to-date estimate of the
                                      number of people living with MS worldwide.

                                                This equates to 1 in 3,000 people
                                                in the world living with MS. In countries
                                                with the highest prevalence, as many
                                                as 1 in every 300 people have MS.

The estimated number of people with MS globally
has increased from 2.3 million people in 2013.
Several factors are likely to be contributing to
the increase, including: better counting methods
nationally and globally as well as improved
diagnosis, people with MS living longer and
global population growth. However, from the data
available we cannot rule out that there may also
be some increase in the risk of developing MS.

                                                Every 5 minutes, someone, somewhere
                                                in the world is diagnosed with MS1.

                                                Although the number of people with MS has
                                                increased, gender and age at diagnosis remain
                                                similar to those seen in the 2013 Atlas of MS, as
                                                does the regional distribution around the globe.

    Based on 75 reporting countries
                                                                                                    6
1
MS not only affects adults - there are at least
            30,000 people living with MS who are under 182.
            This number is considerably higher than reported
            in 2013. It likely reflects a number of childhood MS
            prevalence studies that have been completed since
            then and more countries reporting data rather than
            an increased incidence of MS amongst children.

                                                                Data quality has improved. Experts from 84% of
                                                                countries were able to cite peer-reviewed publications,
                                                                MS registries or electronic health records as their source
                                                                of prevalence data, compared to 71% in 2013.

             Availability of high quality epidemiological
             data varies considerably across the world
             and despite improvements in the number of
             countries reporting data to the Atlas, there are
             still big gaps in our evidence on MS globally.

    Pediatric data is limited worldwide – only 47 countries provided this data
                                                                                                                             7
2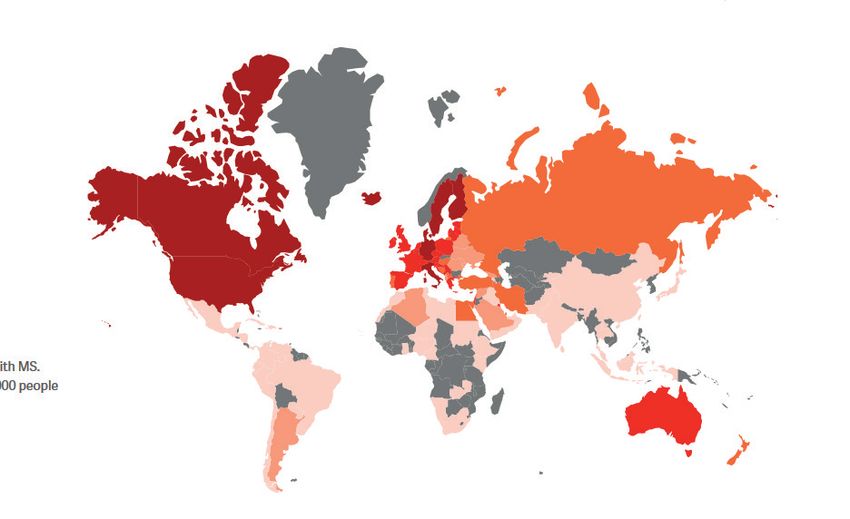
Recommendations
The Atlas of MS is a powerful tool to raise awareness and drive change
that improves the quality of life for people affected by MS across the globe.
We call on governments, policy makers, healthcare professionals and the
MS movement to make the most of this open-data resource by:

        1     Using and updating the statistics in the Atlas, to discover
              new insight, stimulate additional research, raise awareness
              of MS and support evidence-based advocacy efforts.

       2
              Implementing systematic evidence collection in
              countries where there are gaps, particularly in low
              and lower middle income countries, to enable a more
              comprehensive understanding of the epidemiology
              of MS at the country, regional and global level.

       3
              Prioritising the collection of incidence data
              to better understand the future trajectory of
              MS cases and plan healthcare resources for
              diagnosis and treatment accordingly.

       4
              Recognising that some groups of the population
              are disproportionally affected by MS (females and
              young adults) and ensuring that this is accounted
              for as part of healthcare and support systems.

       5
              Improving awareness that children and young people
              can develop MS. Enhance steps to collect data on pediatric
              cases as well as ensuring they have access to prompt
              diagnosis, the relevant treatments, specialist healthcare
              professionals as well as sufficient support for
              those affected and their families.

       6
              Funding and implementing research projects to
              investigate how genetics, environments and other
              factors increase people’s chances of developing MS
              and identifying interventions that could prevent
              or delay onset.

                                                                                8
Using epidemiology data as an advocacy tool
A recent epidemiological study led by the National MS Society (NMSS)
showed the number of people with MS in the United States was nearly
1 million people (913,925). This was more than twice the previously reported
number from a national study in 1975 and subsequent updates.
NMSS has successfully leveraged this revised prevalence estimate to increase
investment in MS research and improve MS data collection at a national level.
Here are two of the successes this data-driven advocacy has had so far:
• The U.S. Congress increased investment in MS research at the Department
  of Defense by $10 million USD and the House of Representatives has earmarked
  a possible further increase to $20 million USD for the programme in 2021.
• The U.S. Centers for Disease Control and Prevention (CDC) established
  and funded the National Neurological Conditions Surveillance System.
  The CDC launched 2 pilot programmes, one in MS and one in Parkinson’s
  Disease, to identify U.S. incidence and prevalence for those diseases.

Methodology
The 3rd edition of the Atlas of MS is an ambitious project.
We sought to make several improvements on the 2013 publication:
broadening the reach by including new countries, achieving
greater population coverage, and increasing confidence in the
data and accuracy of the global prevalence estimate. As well
as improving the accessibility and usability of the statistics.
To help with this ambition, we recruited a working group and panel
of expert advisors to help guide the project, the questionnaire design
and analysis, ensuring our advice was wide reaching across different
parts of the globe. Furthermore, we partnered with epidemiology experts
McKing Consulting Corporation in the US, to ensure the highest quality
data collection and analysis approaches underpinned the project.

The Atlas working group                    The Atlas expert advisors
The working group consisted                A panel of 10 expert advisors who
of representatives from 13 MSIF            brought epidemiological, clinical and
members across 12 countries,               access expertise from 9 countries
covering 5 of the 6 WHO regions.           in the European, Americas and
                                           Western Pacific WHO regions.

                                                                                   9
Data collection and response rates
Data was collected via an international online survey completed
by experts in participating countries between September 2019
and March 2020. English, Spanish, French and PDF versions of
the survey were available to encourage greater response rates
and to encourage collaboration with other national experts.
The epidemiology questionnaire covered a wide range of data
points: prevalence, incidence, mean age of diagnosis, type
of MS and patient registries. It was piloted prior to launch
to test clarity, understanding and ease of completion.
138 countries3 enrolled to take part in the Atlas of MS 3rd edition.
Country coordinators were identified in each of these countries to be
the focal point for gathering the relevant information; typically, they were
representatives from MS organisations, neurologists, epidemiologists
or researchers. Contacts were identified through MSIF’s network of
MS organisations (members and non-members), our International
Medical and Scientific Board, International Working Group on Access,
previous Atlas contacts, the World Federation of Neurology, the Atlas
working group and expert advisors, the various regional International
Committees for the Treatment and Research in Multiple Sclerosis
(TRIMS) as well as from scientific literature. We thank everyone who
was involved and helped us achieve a wider reach in this edition.
80 countries did not have an identified coordinator or did not agree
to participate – these tended to be countries with small populations,
without MS organisations or where neurologists could not be identified.
Country coordinators were asked to complete the questionnaire,
making use of all possible sources of information available to
them and collaborating with other experts in the country where
possible/necessary. A glossary of terms was provided to improve
the uniformity and comparability of the information received.

3
    The word ‘countries’ is used throughout to reference the 218 countries/territories that were recognised by this project
    (combining members of the United Nations (UN), the World Health Organization (WHO) and the World Bank).
                                                                                                                              10
Experts in 115 countries responded (a response rate of 83%)
including 9 countries4 that reported in 2008 but not 2013 and
14 countries from which data was reported to the Atlas of MS for
the first time (Bhutan, Burundi, Cape Verdi, Central Africa Republic,
Djibouti, Kosovo, Kyrgyzstan, Lao, Nepal, Niger, Puerto Rico,
Sudan, Timor-Leste, Togo). Additionally there were 145 countries
that provided data in 2013 but not for this latest edition.
The map below shows the countries from which data was
reported (in orange).
Countries that provided
epidemoilogy data for the
Atlas of MS 3rd Edition
4
9 countries took part in 2008 but not 2013 (Belarus, Chile, Georgia, Haiti, Honduras, Hong Kong, Namibia, Syrian Arab Republic and Ukraine)
5
14 countries reported in 2013 but not in 2020 (Bahrain, Bolivia, Bulgaria, Costa Rica, Core d’Ivoire, Democratic Republic
of the Congo, Guinea, Jordan, Liechtenstein, Mongolia, Norway, the Republic of Korea, Slovakia and Zimbabwe)
11Regional analysis
Countries were grouped into the six World Health Organization
(WHO) regions (Africa, the Americas, Eastern Mediterranean,
Europe, South-East Asia and Western Pacific) and four World Bank
income levels (High, Upper Middle, Lower Middle and Low).
Population data from the 2019 UN population prospects was
used for the analyses. The data was analysed using MS Excel.
The World Health Organization (WHO) regions
WHO regions
Africa
Americas
Eastern Mediterranean
Europe
South-East Asia
Western Pacific
World Bank Income (June 2019)
World Bank Income
Low income
Lower middle income
Upper middle income
High income
12Representativeness and data quality
115 countries took part in the Atlas Positively we also see a trend of increased
epidemiology survey. These countries reporting for most epidemiology statistics
represented 87% of the world population. compared to 2013.
A high proportion of the population was The largest uplifts are for pediatric prevalence,
represented within each of the World Bank incidence and type of MS at diagnosis.
Income categories and the WHO regions The only exception is for the average
with the exception of the African region age of diagnosis where the number
and the low income countries. of reporting countries has gone down.
Proportion of population covered Number of countries
by countries providing data providing each type of data
No. of
countries 2013 2020
World 87% 115 Any epidemiology information
106
115
World Bank
Prevalence data
High Income 94% 46 93
104
Upper Middle Income 98% 34
Gender prevalence
Lower Middle Income 87% 25 85
91
Low Income 37% 10
Pediatric prevelance
34
47
WHO Region
Africa 56% 15 Incidence
52
75
Americas 97% 20
Eastern Mediterranean 91% 18 Age of diagnosis
82
72
Europe 90% 44
South-East Asia 99% 9 Type of MS at diagnosis
45
64
Western Pacific 85% 9
The quality of the data provided has also improved. Experts in 84% of
countries provided evidence to support their prevalence data compared
to 71% in 2013. Positively, 57% cited the gold standard of a peer-reviewed
academic study (an uplift on the 51% seen in 2013). Additionally, experts in
most countries (67%) referenced data collected recently (2017-2019) with
2019 being the most common year cited.
Despite the significant improvements, however, there are still substantial
gaps in our knowledge, which need to be addressed to understand the
true dimensions of MS. In order to measure the availability of high quality
epidemiological evidence around the globe, we developed a confidence
tool to assess the strength of the data sources, rating them as either very
low, low, moderate or high. This helps to highlight where there are data
inadequacies and to encourage systematic data gathering and surveillance
in all countries across the globe.
13The factors driving the confidence scoring are shown below:
Population MS diagnostic
size covered Year of data criteria used
(Whole country
collection (McDonald 2017
or region) criteria or older criteria)
Types of Overall
data source Peer review
confidence
(Data from health process or
scoring
survey/registry validation efforts
or peer-reviewed Very low, Low,
study or opinion) Moderate, High
Globally, 54% of the experts had access to prevalence source evidence
that rated as high (20%) or moderate (34%) on our confidence tool. 29%
referenced sources rated as low (23%) or very low (6%), whilst 8% lacked
prevalence evidence and 10% were unable to provide prevalence data.
There was limited access to evidence in the African and South-
East Asia regions, with 33% and 56% of the country experts in
these regions saying there was no prevalence data available.
Prevalence evidence confidence coding - WHO region
No prevalence data No evidence Very low Low Moderate High
Western Pacific
22% 56% 22%
Eastern Mediterranean
17% 6% 6% 44% 28%
Americas
5% 5% 20% 50% 20%
Europe
9% 34% 27% 25%
South-East Asia
56% 22% 11% 11%
Africa
33% 27% 7% 13% 20%
n = 115 countries
14Looking at this by World Bank income levels, there is a clear
trend towards more and higher quality data sources as you
move from low through to high income countries.
Prevalence evidence confidence coding - World Bank Income
No prevalence data No evidence Very low Low Moderate High
High Income
26% 35% 35%
Upper Middle Income
15% 24% 41% 15%
Lower Middle Income
20% 12% 8% 20% 32% 8%
Low Income
50% 30% 10% 10%
n = 115 countries
On average, prevalence sources scored higher on the confidence tool
than sources providing incidence and other epidemiological data.
The gaps in evidence make it difficult to fully understand how MS
varies across the globe. The MSIF movement calls on governments,
health professionals, patient organisations and others to
improve the collection of MS data. This evidence is important to
inform healthcare provision, pharmacovigilance, and legislation
and help to demonstrate the true global burden of MS.
15A new methodology for calculating
the global prevalence number
To calculate the worldwide prevalence estimate, prevalence data
was required from each country and population in the world. In total,
218 countries were recognised by this project, and an additional 20
populations/territories were identified to account for the 2019 world
population of 7.7 billion. The additional populations included transient
populations such as expats and refugees in Qatar and Lebanon, as well
as small territories such as Martinique, Réunion and Guadeloupe.
Experts in 104 countries, representing 83% of the global population,
reported prevalence data, an increase from 92 countries (79%) in 2013.
Combining the data submitted from these countries provided a global
total of 2.6 million people with MS. However, we were missing data from
countries representing 17% of the global population. In order to fill the
gaps we searched for published data available for the missing countries
Generated
Literature Consulted data for another
review the 2013 Atlas 19 countries
(16 countries) (3 countries)
(2% of the global population)
After completing a literature review for published data sources and
consulting the 2013 Atlas, we still had prevalence data missing for 95
countries and 20 populations representing 15% of the global population.
Recognising that most of these data gaps were from regions of the world
that had lower MS prevalence, we factored this into our calculation
methods, thereby improving the accuracy of our estimation.
In our analysis, we grouped the 123 countries, where experts
had provided prevalence data or where we had found the data,
into 15 geographically diverse sub-regions, based on the Global
Health Data Exchange (GHDx)6. The prevalence data from these
123 countries was used to calculate the number of people with
MS per 100,000 for each sub-region. The appropriate sub-region
prevalence was applied to the missing countries/populations
to determine an estimated number of people with MS for each
of the countries/populations where we had gaps.
6
The GHDx consists of 21 sub-regions. We combined some of these due to lack of data. We used 15 regions, grouping
the 4 Sub-Saharan African regions together (Western, Southern, Eastern and Central) and created a new Western
Pacific sub-region, which combined Australasia, High Income Asia Pacific and South-East Asia
16The estimated number of people with MS in populations where
data was missing were added to the 2.6 million figure calculated
from the 123 countries where data was reported or gathered.
This provided a global estimate of 2.8 million people with MS.
Prevalence data was used to calculate
the number of people with MS per
100,000 for each sub-region
Sub-region prevalance applied to the
missing populations to determine the
number of people with MS in populations
/countries where data was not available
The missing population estimates were added
to the 2.6 million figure calcuated from the
reported/gathered data from 123 countries,
providing a global estimate of 2.8 million people
A snapshot of some of the people with MS from around
the world who feature in the ‘Global faces of MS’ video.
17Limitations
The Atlas of MS is one of the most accurate global data sources
on the epidemiology of MS, but it still has some limitations.
In the majority of countries, the data was provided by a single contact:
• In 71 countries out of the 115 answering the epidemiology
survey, a single key person provided the information. Although
most people had access to numerous official and unofficial
sources of information and were able to consult other experts
in the country, others were only able to provide best estimates.
• In spite of these limitations, the data should be still be considered
as reasonably, but not completely, reliable and accurate.
• We developed a confidence-coding tool to measure
the strength of the evidence provided and to improve
confidence in the reported data.
Direct comparisons with previous data are difficult:
• Our global prevalence calculation methods have varied
across editions as we strive to improve the accuracy.
• The number of countries participating varies, as does the
proportion of the population covered in each region/income band.
Although there are improvements in the number of countries
providing data, there are still significant gaps in our knowledge.
We hope that the Atlas of MS will stimulate new and rigorous
surveillance within countries and across the globe.
• The Atlas of MS lacks data from the
African region and low income countries.
• Not all responding countries were able to provide the key data;
the largest gaps centre around data for incidence, disease type
and pediatric data – but even for prevalence, where we had the
most comprehensive data reported, only 104 countries out of
115 responding countries provided data.
• The quality of the data is also variable. Some countries have
limited information – or only have fragmented data (by region,
or hospital/clinic) or lack up-to-date statistics. Methodologies
for epidemiology studies also vary which makes comparison
between countries and regions difficult.
• Even within countries, studies calculating prevalence
and incidence are not always conducted with consistent
methodologies or over the same time period, which can
make it difficult to compare.
18Main findings
The number of people with MS around the world (prevalence of MS)
2.8m 1 in 2.3m
3,000
There are 2.8 million Prevalence has
This means that 1 in Global prevalence
people living with increased in all WHO
every 3,000 people has increased since
MS in the world regions since 2013
worldwide has MS the estimate of 2.3
million in 2013
The global prevalence of MS is estimated at 36 people per
100,0007 people, which means there are 2.8 million people
living with MS worldwide. This equates to 1 in every
3,000 people living with the disease.
This global estimate has increased from 2.3 million
people in 2013, which is consistent with stated increases
in national prevalence in some countries8 over this time.
The literature points to several factors that are likely to
play an important role in explaining the increase, including
improvements in counting methods nationally and globally
since 2013, as well as better diagnosis9, people with MS living
longer10 and global population growth (9%11 since 2013).
These factors are supported by the country experts who
were asked to indicate possible causes for change in their
prevalence estimates since 2013. The three most common
reasons provided by 73 country experts were:
• An improvement in MS diagnosis (60%)
• Improved MS treatment and support (56%)
• Improved ability to count the numbers of people with MS (53%)
7
A 95% confidence interval was calculated around our estimated prevalence figure of 35.91 and we can be 95%
confident that the estimated prevalence is between 35.87 and 35.95 per 100,000
8
A UK study in 2018, showed an increase of 30% - MS Society UK, MS Prevalence Report January 2020. URL: www.mssociety.org.uk/care-and-support/resources-and-publications/
publications-search/ms-in-the-uk and a US study has shown estimates double: Wallin M, et al, The prevalence of MS in the United States - A population-based
estimate using health claims data, Neurology. March 2019, 92 (10) e1029-e1040; doi: 10.1212/WNL.0000000000007035 https://n.neurology.org/content/92/10/e1029.
Additionally, the EMSP’s European Multiple Sclerosis’ Barometer of MS has reported interim results showing a 35% increase in the number of people with
MS in Europe since 2017. The data when finalised will be published here: www.emsp.org/projects/ms-barometer
9
Schwenkenbecher P, Wurster U, Konen FF, et al. Impact of the McDonald Criteria 2017 on Early Diagnosis of Relapsing-
Remitting Multiple Sclerosis. Front Neurol. March 2019:10:188. doi:10.3389/fneur.2019.00188
10
Kingwell E, Leray E, Zhu F, Petkau J, Edan J, Oger J, Tremlett H, Multiple sclerosis: effect of beta interferon treatment on
survival, Brain, Volume 142, Issue 5, May 2019:1324–1333, https://doi.org/10.1093/brain/awz055
Global population used in the 2013 Atlas was 7,080,072,000 (UN projections for 2013 medium growth) vs. 7,713,468,205 (2019 UN population prospects)
19
11Comparing the global
number with the 2013 estimate
In 2013, the global estimate of 2.3 million people was derived
from a more simplistic calculation. The median prevalence per
100,000 people for the world was calculated from the country data
provided, and was used to estimate the number of people with
MS living in countries where prevalence data was missing.
If we were to use this same methodology for 2020 we would
estimate 3 million people to be living with MS globally; an increase
of 30% since 2013. This figure is higher than our current estimate,
because our new calculation takes into account that the gaps
in our data collection centre around lower prevalence regions
such as Central Asia and Africa. Applying the median prevalence
to these countries would therefore inflate the estimates.
It is important to recognise that whatever calculation method
is used to determine the global number of people with MS, it is
likely to be an underestimate due to the lack of up-to-date or
complete surveillance data, the complexities of diagnosis and
other inequalities and barriers to accessing healthcare.
A snapshot of some of the people with MS from around
the world who feature in the ‘Global faces of MS’ video.
20The prevalence of MS varies
considerably around the world
We have calculated the number of people living with MS as a
prevalence number per 100,000 people. This allows comparison
between nations and regions irrespective of their population size.
The estimate of 2.8 million people living with MS around the world
is represented by the prevalence of 36 per 100,000 people.
In line with previous editions of the Atlas, MS is present in all regions of
the world but is noticeably higher in the European and Americas regions.
There are some limitations in being able to compare prevalence
across diverse and different populations with confidence.
Nevertheless, prevalence clearly varies considerably within regions.
For example, in the European region, San Marino (337 per 100,000),
Germany (303 per 100,000) and Denmark (282 per 100,000) have the
highest levels of people with MS. In fact San Marino and Germany
have the highest prevalence in the world, followed by the USA
(288 per 100,000). In contrast, there are several countries with
prevalence figures below 40 per 100,000 in the European region.
Number of people with MS (per 100,000) - WHO region
Europe 133
Americas 112
Eastern Mediterranean 30
South-East Asia 9
Africa 5
Western Pacific 5
Global = 36
Limitations of comparing prevalence are due to a multitude of factors including:
different ethnic and demographic profiles of countries as well as barriers to diagnosis,
differences in the epidemiological study methodologies (choice of diagnostic criteria,
year of collection and the size of the population included in the study).
21When we compare a sub-set of our data focusing on the 81 countries
from which prevalence data was provided in both the 2013 and 2020
editions of the Atlas, we see increasing prevalence in all 6 WHO regions.
The greatest uplift is in the Americas region, which has almost doubled.
In fact, 86% of the 81 countries reporting at both time points have
increasing prevalence. Supporting this finding, many countries have
published new epidemiological studies that have uncovered increases
in the prevalence of MS, primarily due to better counting methods,
increased awareness and improved diagnosis.
A few notable examples where the reported prevalence has doubled
or even tripled include: Argentina, China, Egypt, Germany, Iraq, Israel,
Libya, the Palestinian Authority, Serbia, Sri-Lanka, Thailand and the
United States.
Number of people with MS (per 100,000) - comparison of a sub-set
of countries from which data was provided at both time-points
2013 2020
Global
29
44
Europe
108
143
Americas
63
118
Eastern Mediterranean
24
33
South-East Asia
5
9
Africa
6
9
Western Pacific
4
5
Data based on 81 countries that provided prevalence data for both 2013 and 2020
22Several studies have shown the prevalence of MS has a link with
latitude12, with people living in countries closer to the equator being
at lower risk of MS, whilst those living in countries at higher latitudes
(closer to the north/south poles) being at greater risk. It is thought
that people who live in higher geographical latitudes may receive
lower levels of sunlight, and therefore have lower vitamin D levels,
which may explain the latitude relationship. The data reported to
the Atlas and shown visually in the map below supports this.
Number of people with MS - prevalence per 100,000 people
Number of people with MS,
Prevalence per 100,000 people
Unknown
0 - 25
26 - 50
51 - 100
101 - 200
> 200
This latitude effect is also seen within many countries. For example,
in Australia13, people living in the southern most part of the country
(and furthest away from the equator) - Tasmania - are almost twice
as likely to develop MS than those in the northern state of Queensland
(139 per 100,000 people in Tasmania compared with 75 per 100,000
for Queensland).
12
Simpson S Jr, Wang W, Otahal P, Blizzard L, van der Mei IAF, Taylor BV. Latitude continues to be significantly
associated with the prevalence of multiple sclerosis: an updated meta-analysis. J Neurol Neurosurg Psychiatry.
2019: 90(11):1193-1200. doi:10.1136/jnnp-2018-320189 https://pubmed.ncbi.nlm.nih.gov/31217172/
Tao C, Simpson S, van der Mei I on behalf of the MSBase Study Group, et al, Higher latitude is significantly associated with an earlier age of
disease onset in multiple sclerosis. Journal of Neurology, Neurosurgery & Psychiatry. 2016:87:1343-1349. http://dx.doi.org/10.1136/jnnp-2016-314013
13
MS Research Australia, Health Economic Impact of MS in Australia 2017. 2017:15.
URL: www.msra.org.au/wp-content/uploads/2018/08/health-economic-impact-of-ms-in-australia-in-2017_ms-research-australia_web.pdf
23Who gets MS and how does
this vary across the globe?
Gender
As shown in the previous Atlas editions, there are at least twice
as many females (69%) with MS as there are males (31%).
This skew towards females is even greater in the Western
Pacific and South-East Asia regions where there are
more than three times as many females to males.
Within regions, there is variation in the gender ratio. For example
in the Eastern Mediterranean region, the average ratio is 2 females
to every male but there are several countries where females with
MS outnumber males on a ratio of 3 or even 4 to 1. Examples
include: Egypt, Iran, the Palestinian Authority and Sudan.
In some countries, this gender skew is increasing. For example,
in Egypt and the Palestinian Authority, the proportion
of females has doubled since reporting in 2013.
Percentage of people with MS who are female - WHO region
Western Pacific 78%
South-East Asia 76%
Americas 71%
Europe 69%
Africa 67%
Eastern Mediterranean 66%
n = 91 countries,
% of population represented by reporting countries (Western Pacific 85%,
SE Asia 89%, Americas 96%, Europe 85%, Africa 31%, Eastern Mediterranean 60%)
The reasons for the difference in risk between males and females
are unknown but a variety of factors are likely to be influencing it
such as hormonal14 and genetic15 differences, as well as differing
social, lifestyle and environmental exposures between the sexes.
14
Russi AE, Ebel ME, Yang Y, Brown MA, IL-33 and sex-dimorphic immune responses. Proceedings of the National Academy of
Sciences. Feb 2018:115 (7) E1520-E1529; doi: 10.1073/pnas.1710401115 https://www.pnas.org/content/115/7/E1520.short?rss=1
15
Voskuhl RR, Sawalha AH, Itoh Y. Sex chromosome contributions to sex differences in multiple sclerosis susceptibility and
progression. Multiple Sclerosis. 2018:24(1):22-31. doi:10.1177/1352458517737394 https://pubmed.ncbi.nlm.nih.gov/29307297
24• More research is needed to understand how genetics, environment
and other factors increase a woman’s chances of developing MS -
this could potentially reveal new ways to treat or even prevent MS.
• It is important that national healthcare systems, registries,
researchers and MS organisations collect data by gender to
help provide real-world evidence on these differences.
• It is vital that if any gender inequalities and barriers16
to accessing healthcare within countries exist, they
are reviewed to ensure that females have access to
prompt and affordable diagnosis and treatment.
Age
MS can occur at any age, but the average age of an MS diagnosis
globally is 32 years. There is no cure for MS, which means that people
are living with the disease for many decades. This differentiates MS
from other neurological conditions such as dementia and stroke, which
predominantly affect people later in their lives (aged 65 years or more17).
MS is the most common neurological cause of disability for young adults.
The average age of diagnosis is relatively consistent across the regions
of the world (ranging from 30-33 years across the six WHO regions).
However, we see greater variation in the average age of diagnosis across
individual countries, ranging from 20 years up to 50 years. This is another
aspect where data is lacking, with only 72 countries providing data.
• As this is an age where many people might be finding a long-term
partner, having children, and forging careers, it is important that
support mechanisms are available (financial, social, legislation)
to enable people with MS to achieve good quality of life.
• It is important that governments, national healthcare systems,
employers and legislation enable people with MS to achieve a
quality of life. This includes diagnosing and treating the disease
early to stave off relapses, and prevent progression of disability,
alongside protective legislation to enable people to access
affordable treatment as well as remain in employment.
16
Gender inequalities in accessing healthcare exist in many countries as illustrated by these two different examples: 1) Socías ME, Koehoorn M,
Shoveller J, Gender Inequalities in Access to Health Care among Adults Living in British Columbia, Canada. Women’s Health Issues. Sept 2015.
https://doi.org/10.1016/j.whi.2015.08.001, 2) Kapoor M, Agrawal D, Ravi S, et al Missing female patients: an observational analysis of sex
ratio among outpatients in a referral tertiary care public hospital in India. BMJ Open. 2019;9:e026850. doi: 10.1136/bmjopen-2018-026850
https://www.bmj.com/company/newsroom/extensive-gender-discrimination-in-healthcare-access-for-women-in-india/
17
https://www.alz.co.uk/info/faq#:~:text=Up%20to%20the%20age%20of,to%201%20person%20in%205. Dementia primarily affects older people.
Up to the age of 65, dementia develops in only about 1 person in 1000. The chance of having the condition rises sharply with age to 1 person in 20
over the age of 65. Over the age of 80, this figure increases to 1 person in 5. https://www.stroke.org.uk/sites/default/files/state_of_the_nation_2017_final_1.pdf
In England, Wales & Northern Ireland the average age for men to have a stroke is 74 and the average age for women to have a stroke is 80
25Children and MS
MS not only affects adults; at least 30,000 children and teenagers under
the age of 18 years are living with MS (1.5% of the total number of people
with MS in the countries reporting pediatric prevalence data).
Although this is likely to be an underestimate due to a high proportion
of countries being unable to provide data, this is an increase on the 7,000
reported in 2013. This is likely to be a reflection of a number of childhood
prevalence studies18 published since the previous Atlas edition.
Recognition and surveillance of pediatric MS appears to be increasing, with
experts in 47 countries reporting this data compared to only 34 countries in
2013. However, there are still significant gaps in our understanding; only 20
experts were able to provide the pediatric prevalence per 100,000 people for
their country. Calculating the number of children with MS brings additional
challenges as they transition to become adults. Some children included
in the reported prevalence figures may well now be over 18 years.
• These gaps in data need to be addressed to ensure we can
more accurately estimate and understand the prevalence
of MS amongst children and teenagers in the future.
Diagnosing MS in children is more challenging than in adults due to the
frequency of other childhood disorders with similar symptoms and characteristics.
Pediatricians may not be familiar with MS because they are not expecting to
see it in children. Furthermore, under 18s have different treatment and support
needs. The International Pediatric Multiple Sclerosis Study Group (IPMSSG)
www.ipmssg.org is a network of adult and pediatric neurologists, researchers,
and others. The group – which was funded by MSIF and our members for
many years – aims to improve diagnosis and treatment of pediatric MS.
• We call on MS organisations, governments, and health
systems to increase awareness of pediatric MS amongst
the general public and healthcare professionals to enable
prompt diagnosis and treatment as well as ensure that
people under 18 with MS are not disadvantaged.
18
Some example new studies include: a) Alroughani R, Akhtar S, Ahmed SF, Behbehani R, Al-Abkal J, Al-Hashel J. Incidence and prevalence of
pediatric onset multiple sclerosis in Kuwait: 1994-2013. J Neurol Sci. 2015:353(1-2):107-110. doi:10.1016/j.jns.2015.04.025 b) Marrie RA, O’Mahony J,
Maxwell C, Ling V, Yeh EA, Arnold DL, Bar-Or A, Banwell B, Incidence and prevalence of MS in children, A population-based study in Ontario, Canada,
for the Canadian Pediatric Demyelinating Disease Network, Neurology Oct 2018, 91 (17) e1579-e1590; doi: 10.1212/WNL.0000000000006395
26Types of MS
85% of people with MS around the globe are initially diagnosed with
relapsing-remitting MS and 12% with progressive MS. The remaining 3%
are given an unknown disease type on diagnosis. This pattern is consistent
with that seen in the 2013 Atlas. Given the low number of experts providing
this information (64 countries) and particularly the gaps in the African and
Western Pacific regions (data only represents 11% and 5% of these populations
respectively) it is not possible to comment on regional differences.
The International Advisory Committee on Clinical Trials of MS published a paper
in 201319 highlighting the need to include descriptors to describe the ‘activity’ and
’progression’ within the different types of MS. Neurologists in two-thirds (66%)
of the 98 countries providing data, were using these additional descriptors.
There was considerable variation by region however, with less than half of the
reporting countries in the Americas and African regions using the descriptors,
compared to almost universal use in the Eastern Mediterranean region.
Percentage of countries in each region where
neurologists classify MS by activity and progression
Eastern Mediterranean 88%
Europe 77%
Western Pacific 67%
South-East Asia 57%
Americas 47%
Africa 29%
n = 98 countries,
% of population represented by reporting countries (Eastern Mediterranean 84%,
Europe 71%, Western Pacific 85%, SE Asia 99%, Americas 96%, Africa 15%)
19
Lublin FD, Reingold SC, Cohen JA, et al. Defining the clinical course of multiple sclerosis: the 2013 revisions. Neurology.
2014:83(3):278-286. doi:10.1212/WNL.0000000000000560. https://www.ncbi.nlm.nih.gov/pmc/articles/PMC4117366/
27The number of new cases of MS diagnosed each year (incidence)
Incidence data is lacking in many countries across the globe – experts
in only 75 countries were able to provide this data (65% of the 115
responding countries). Incidence data measures the number of new
cases diagnosed in the country over a year and is therefore vital to
help us understand if the risk of MS is increasing over time.
5
EVERY
someone,
somewhere
is diagnosed
minutes with MS
107,000 people were diagnosed with MS per year across the 75 reporting
countries. This equates to almost 300 people diagnosed each day, which means
that every 5 minutes, someone, somewhere in the world is diagnosed with MS.
This incidence number is an underestimate, as we do not have data
from every single country.
An average incidence rate of 2.1 per 100,000 people per year was calculated
across the 75 reporting countries. This rate cannot be applied to the total
global population due to the gaps in the data and the fact that incidence data
is more likely to be reported in high-income and higher prevalence countries.
Positively, the number of countries with incidence statistics has increased
since 2013 when experts in only 52 countries provided data. However, the
inconsistency in the reporting countries, together with the lack of data in
some regions, means that we cannot compare global incidence data over
time. Additionally, incidence data has similar limitations to prevalence data,
making it difficult to compare across countries or regions with confidence.
28How common are national registries?
A new objective for the 3rd edition of the Atlas was to ascertain the availability
of MS registries. The following descriptor was used to define registries:
‘A registry is a systematic, ongoing collection of data to evaluate specified
outcomes for a defined population in order to serve one or more predetermined
scientific, clinical or policy purposes. Registries differ from studies in that
the collection of data is ongoing rather than time-limited. However the data
collected as part of registries may be utilised for individual studies.’
37% of the 102 countries in which this question was answered, had a national
registry covering the whole country, a further 14% had a registry covering a
regional or local population. It must be noted that a national register does not
necessarily include the whole population of people with MS in the country.
Perhaps not unexpectedly, registries are more prevalent in high-income
countries. 52% had a national registry compared with 35% of upper middle
income, 20% of lower middle income and 0% of the low income countries.
Across the regions, none of the countries in the South-East Asia region
had registries compared to 20% and 22% of the African and Western Pacific
regions. The regions with the highest proportion of countries with registries
are the Americas (47%), Europe (46%) and Eastern Mediterranean (38%).
Percentage of countries in each category
who have a national MS registry
Global 37%
World Bank
High Income 52%
Upper Middle Income 35%
Lower Middle Income 20%
Low Income 0%
WHO Region
Americas 47%
Europe 46%
Eastern Mediterranean 38%
Western Pacific 22%
Africa 20%
South-East Asia 0%
n = 102 countries,
% of population represented by reporting countries (High income 93%, Upper middle
income 91%, Lower middle income 80%, Low income 15%, SE Asia 99%, America 96%,
Western Pacific 85%, Eastern Mediterranean 84%, Europe 73%, Africa 19%)
29Concluding remarks
The 3rd edition of the Atlas of MS brings increased rigour to the
estimates of the number of people with MS around the world. Although
we have seen improvements in the number of countries able to provide
epidemiological data, we still have large gaps, particularly around
incidence, pediatric data and in low income and African countries.
This data is vital to help us understand whether MS is increasing
and to have a better picture of how MS varies across the globe.
Additionally, robust epidemiological data is vital evidence to
inform decision making regarding policies and healthcare
interventions to best meet the needs of people with MS. It’s also
crucial for monitoring these interventions, such as the impact
of new disease modifying therapies on disease progression.
We hope that the MS movement will use the data from the Atlas
of MS to uncover new insights and to evidence advocacy efforts to
ensure that people affected by MS can achieve good quality of life.
Our next report on the clinical management of MS looks at access to
diagnosis, healthcare professionals and disease modifying treatments.
We look forward to sharing this with you in early 2021. You can sign up to
receive notifications of its release on the website (www.atlasofms.org).
30Collaborators and acknowledgements
The Atlas of MS relies on extensive collaboration and support
from MS organisations, clinicians, researchers, people
affected by MS and other experts from around the world.
We are thankful to the Atlas of MS working group and expert
advisors, who have been instrumental in guiding the development
of the project, including the questionnaire, analysis and reporting:
Working Group
• María José Wuille-Bille (Argentina) • Aoife Kirwan (Ireland)
• Andrew Giles (Australia) • Prof. Mario Battaglia (Italy)
• Nora Kriauzaitè (Belgium) • Magdalena Fac-Skhirtladze & Marta
Szantroch (Poland)
• Benjamin Davis (Canada)
• Prof. Riadh Gouider (Tunisia)
• Lasse Skovgaard (Denmark)
• Arwenna Davis (UK)
• Anna-Lena Roper (Germany)
• Dr. Tim Coetzee (USA)
• Renuka Malaker (India)
Expert Advisors
• Prof. Ingrid van Der Mei (Australia) • Prof. Bernard Uitdehaag (Netherlands)
• Prof. Ruth Ann Marrie (Canada) • Dr. Mona Alkhawajah (Saudi Arabia)
• Prof. Emmanuelle Leray (France) • Prof. Neil Robertson (UK)
• Dr. Joanna Laurson-Doube (Hong Kong) • Dr. Nick La Rocca (USA)
• Prof. Kazuo Fujihara (Japan) • Dr. Mitchell T Wallin (USA)
We would also like to thank epidemiology experts: Dr. Wendy Kaye
and Dr. Lindsay Rechtman of McKing Consulting Corporation, in
helping us administer the survey, conduct the analysis and in aiding
our endeavours to improve the robustness and quality of the data.
The key MS International Federation staff who contributed to the Atlas
project were: Rachel King, Peer Baneke, Nick Rijke, Ceri Angood Napier,
Clare Walton, Anne Helme, Victoria Gilbert, Zoe Burr and Sarah Dobson
MSIF extends its thanks to the World Health Organization
and the European MS Platform (EMSP) for their contribution
to the initial edition of the Atlas of MS.
We are also grateful to Red Bullet for the website/analytical tool
and Osomi for the design of the logo, report and social media materials.
31We are most grateful to the following country coordinators
and their colleagues for taking the time and effort to gather
the information and data published in the Atlas:
Albania Prof. Jera Kruja Germany Prof. Peter Flachenecker
Algeria Prof. Smail Daoudi Ghana Dr. Albert Akpalu,
Argentina Prof. Adriana Carrá Dr. Patrick Adjei,
Dr Fred Sarfo
Australia Andrew Giles, Bea Beswick,
Dr. Julia Morahan, Greece Dimitra Kalogianni,
Ass. Prof. Ingrid van der Mei Eva Ioannidou,
Kostas Mihalakis,
Austria Dr. Fritz Leutmezer Anastasios Orologas
Bangladesh Prof. Nirmalendu Guatemala Freddy Girón
Bikash Bhowmik
Haiti Dr. Jude Hassan Charles
Belarus Art Taradeiko
Honduras Dr. N. Eunice Ramírez S
Bhutan Dr. Farrah Mateen
Hong Kong Dr Richard Li
Bosnia and Herzegovina Prof. Jasminka
Hungary Dr. Cecilia Rajda,
Đelilović – Vranić
Prof. Samuel Komoly
Brazil Alice Estevo Dias
India Prof. Kameshwar Prasad
Burundi Dr. Prosper Masabarakiza
Indonesia Dr. Riwanti Estiasari,
Cabo Verde Dr. Albertina Lima Dr. Hendro Birowo, Sucipto,
Cameroon Dr. Gams Massi Daniel Arthur H.P. Mawuntu
Canada Prof. Helen Temlett, Iran, Islamic Republic of Dr. Reza HabibiSaravi,
Dr. Ruth Ann Marrie Ass. Prof. Hamed
Cheraghmakani, Ass.
Central African Republic Dr. Yangatimbi Emmanuel
Prof. Mahmud Abedini,
Chile Francisca Moreira G, Fariba Ghasemihamedani,
Verónica Cruchet Muñoz Ass. Prof. SM Baghbanian
China Prof. Wei Qiu, Wenjing Luo, Iraq Prof. Hayder K. Hassoun,
Xiaonan Zhong, Chunxin Prof. Akram Al Mahadawi,
Liu, Jingqi Wang, Cong Li Dr. Sara Mahmod,
Dr. Amanj Jamal Khidhir,
Croatia Tanja Malbaša
Dr. Nawfal Shaheed Madhi
Cuba Margarita Ruiz Peraza
Ireland Aoife Kirwan
Cyprus Prof. Marios Pantzaris
Israel Dr. Daniel Golan,
Denmark Dr. Melinda Magyari Dr. Idit Lavi, Chen Segman,
Djibouti Dr. Moulid Ali Maidal Nuriel Burak, Merzon
Eugene, Green Ilan
Dominican Republic Dr. Raul Comme Debroth,
Dr. Deyanira Ramirez, Italy Prof. Mario Alberto
Dr. Blanca Hernandez, Battaglia
Dr. Biani Santos, Japan Dr. Noriko Isobe,
Dr. Awilda Candelario, Prof. Kazuo Fujihara
Dr. Armando Guirado Kenya Dr. Dilraj Singh Sokhi
Ecuador Dr. Correa Diaz Edgar Kosovo Ass. Prof. Kamber Zeqiraj,
Patricio, Dr. Jacome Ema Zeqiraj, Valon Kryeziu
Sanchez Elisa Carolina, Kuwait Dr. Raed Alroughani,
Dr. Ortiz Yepez Maria Dr. Samar Ahmed
Angelica, Dr. Torres Herran Kyrgyzstan Dr. Kunduz Karbozova,
Germaine Eleanor, Dr. Dzhaparalieva Nurzhan
Dr. Barrera Madera Raul
Lao, People's Democratic Dr. Southanalinh
Egypt Prof. Nevin M Shalaby
Republic of Keovilayhong,
Finland Prof. Juhani Ruutiainen, Dr. Ketmany Phetsiriseng,
Prof. Merja Soilu- Dr. Somchit Vorachit,
Hänninen, Matias Viitala Dr. Saysavath Keosodsay,
Georgia Prof. Maia Beridze, Dr. Natia Dathsada Souvanhnalath,
Thatsaphone
Merlan, Giorgi Chikvanaia,
Keophanthouvong
Prof. Nana Tatishvili, Ass.
Prof. Sopia Bakhtadze
32Lebanon Dr. Bassem Yamout, San Marino Dr. Susanna Guttmann
Dr. Maya Zeineddine Saudi Arabia Prof. Mohammed Al Jumah
Libya Dr. Souad Ahmad Zoubi Serbia Prof. Tatjana Pekmezovic,
Lithuania Prof. Rasa Kizlaitiene Prof. Jelena Drulovic
Malawi Dr. Yohane Gadama Singapore Ass. Prof. Kevin Tan, Ass.
Prof. Terrence Thomas,
Malaysia Dr. Shanthi Viswanathan
Ass. Prof. Simon Robert
Malta Dr. Josanne Aquilina Ling, Dr Derek Soon Tuck
Mexico Prof. Jose Flores-Rivera, Loong, Dr Amy Quek
Dr. Veronica Rica-Alonso May Lin, Dr Furene Wang
Sijia, Dr Yong Kok Pin
Moldova, Republic of Prof. Vitalie Lisnic,
Dr. Olesea Odainic Slovenia Dr. Beatrika Končan Vračko
Montenegro Dr. Jevto Erakovic, South Africa Dr. Dominic Giampaolo
Dr. Ljiljana Radulovic Spain Dr. Alfredo Rodriguez
Myanmar Dr. Ohnmar Ohnmar, Antigüedad, Pedro
Carrascal
Dr. Htet Htet Lin, Khine
Yee Mon, Kyawt Oo Kay Sri Lanka Dr. Bimsara Senanayake
Thi Htay, Chaw Su Hlaing Sudan Dr. Mohammed Gasm
Nepal Dr. Raju Paudel Elseed Mohammed
Elmahal, Dr. Eetidal Ahmed
Netherlands Dr. Rinze F. Neuteboom
Sweden Kelsi Alexandra Smith, ,
New Zealand Dr. Deborah F Mason Prof Scott Montgomery,
Nicaragua Dr. Jorge Alberto Peter Alping, Leszek
Martínez Cerrato, Stawiarz, Jan Hillert
Dr. Luis Garcia Valle, Switzerland Dr. Viktor von Wyl,
Dr. José Giroud Benitez Marco Kaufmann
Niger Dr. Sidibe H. , Dr. Syrian Arab Republic Bassim Haik
Assadeck Hamid Taiwan Dr. Chih- Chao Yang
North Macedonia Ass. Prof. Igor Kuzmanovski, Thailand Dr. Sasitorn Siritho
Dr. Bojan Boshkovski
Togo Prof. Komi Assogba,
Oman Dr. Abdullah Al-Asmi Dr Kossivi Apetse
Pakistan Prof. Mohammad Wasay Tunisia Prof. Riadh Gouider, Ass.
Palestinian Authority Dr. Taleb El-Debas Prof. Saloua Mrabet
Panama Dr. Fernando Gracia, Ukraine Dr. Olga Shulga, Prof.
Dr. Blas Armien Tamara Mishchenko,
Dr. Oksana Zheshko
Paraguay Prof. Fernando Hamuy
Diaz de Bedoya United Arab Emirates Prof. Jihad Inshasi
Peru Dr. Darwin Vizcarra- United Kingdom Prof. NP Robertson
Escobar, Dr. Edgar United States of America Dr. Nicholas G. LaRocca,
Rojas-Huerto Dr. Mitchell Wallin,
Prof. Ruth Ann Marrie,
Poland Prof. Brola W.
Dr. Annette M. Langer-Gould,
Portugal Prof. Ana Martins da Silva Dr. Timothy Coetzee
Puerto Rico Dr. Angel R. Chinea, Dr. Uruguay Prof. Carlos N. Ketzoian,
Ivonne Vicente, Astrid Diaz, Prof. Carlos Oehninger
Lourdes Fernandez, Carlos
Venezuela Dr. Miguel Ángel Romero C.,
Rios-Bedoya, Cristina Rubi
Dr. Geraldine
Romania Prof. Ovidiu Alexandru Orozco Escobar
Bajenaru
Yemen Giyab Ali Abdullah
Russian Federation Prof. Alexey Boyko Al-Ghalabi
Zambia Dr. Deanna Saylor
We would also like to thank those coordinators who
provided data but who wished to remain anonymous.
33You can also read