Investigating the Effects of Rainfall on Traffic Operations on Florida Freeways
←
→
Page content transcription
If your browser does not render page correctly, please read the page content below
UNF Digital Commons
UNF Graduate Theses and Dissertations Student Scholarship

2019

Investigating the Effects of Rainfall on Traffic
Operations on Florida Freeways
Lucia Andrew
University of North Florida

Suggested Citation
Andrew, Lucia, "Investigating the Effects of Rainfall on Traffic Operations on Florida Freeways" (2019). UNF Graduate Theses and
Dissertations. 904.
https://digitalcommons.unf.edu/etd/904

This Master's Thesis is brought to you for free and open access by the
Student Scholarship at UNF Digital Commons. It has been accepted for
inclusion in UNF Graduate Theses and Dissertations by an authorized
administrator of UNF Digital Commons. For more information, please
contact Digital Projects.
© 2019 All Rights Reserved
INVESTIGATING THE EFFECTS OF RAINFALL ON TRAFFIC OPERATIONS ON

 FLORIDA FREEWAYS

 By

 Lucia Andrew

 A thesis submitted to the Department of Civil Engineering
 In partial fulfillment of the requirements for the degree of
 Master of Science in Civil Engineering

 UNIVERSITY OF NORTH FLORIDA

 COLLEGE OF COMPUTING, ENGINEERING, AND CONSTRUCTION

 July 2019
The thesis “Investigating the Effects of Rainfall on Traffic Operations on Florida Freeways”

submitted by Lucia Andrew in partial fulfillment of the requirements for the degree of Master of

Science in Civil Engineering has been

Approved by the thesis committee: Date:

Dr. Thobias Sando,
Thesis Advisor and Committee Chairperson

Dr. Akan Cigdem,
Committee Member

Dr. Brian Kopp,
Committee Member

Accepted for the School of Engineering:

Dr. Osama Jadaan,
Director

Accepted for the College of Computing, Engineering, and Construction:

Dr. William Klostermeyer,
Dean

Accepted for the University of North Florida:

Dr. John Kantner,
Dean of the Graduate School

 ii
DEDICATION

Special dedication to the Almighty God. It was only by his grace that I could reach this far.

 iii
ACKNOWLEDGEMENTS

I am so grateful for managing to complete this thesis. Accomplishment to this point is a product

of endless efforts and support of so many individuals. I am overwhelmed to thank all who

participated to make this work a success.

 I cannot express enough thanks to my supervisor, Dr. Thobias Sando, for the opportunity

to pursue my graduate studies. I will always cherish his unconditional support, patience,

encouragement, and dedication throughout my study time at UNF. My heartfelt appreciation, you

are truly a nice person; may God bless you abundantly.

 Sincere appreciations to the committee members, Dr. Akan Cigdem and Dr. Brian Kopp

for the learning opportunity that you have provided. Your time, reviews, and comments are greatly

appreciated. You took my work to Mars!

 To all my classmates, this project could not have been accomplished without your support.

Together with the CECC IT team, your outstanding service whenever needed is highly recognized.

Special thanks to Mr. Richardson Robert for his phenomenal help in this project.

 My deepest gratitude to my lovely family and friends, for the care, love, and support. To

Petro, Peter, Jimoku, and Mike, thank you for always being there for me. Your encouragement

during the rough times is highly appreciated.

 Above all, I thank God the father – through him all things are possible!

 iv

TABLE OF CONTENTS

DEDICATION ............................................................................................................................... iii

ACKNOWLEDGEMENTS ........................................................................................................... iv

LIST OF TABLES ....................................................................................................................... viii

LIST OF FIGURES ....................................................................................................................... ix

ACRONYMS .................................................................................................................................. x

ABSTRACT ................................................................................................................................... xi

CHAPTER 1: INTRODUCTION ................................................................................................... 1

 Background ................................................................................................................................. 1

 Problem Statement ...................................................................................................................... 3

 Objective ..................................................................................................................................... 5

 Significance of the study ............................................................................................................. 5

 Organization of the Manuscript................................................................................................... 5

CHAPTER 2: LITERATURE REVIEW ........................................................................................ 6

 Effect of weather on safety.......................................................................................................... 6

 Rainfall Impact on Freeway Traffic Speed ................................................................................. 6

 Headway ...................................................................................................................................... 9

 Weather Radar in Traffic Studies ................................................................................................ 9

 Regression Analysis .................................................................................................................. 11

CHAPTER 3: METHODOLOGY ................................................................................................ 13

 v
Site Selection ............................................................................................................................. 13

 Data Collection .......................................................................................................................... 14

 Rainfall Data ............................................................................................................................. 14

 Limitations of a Radar Method of Estimating Rainfall Rate ................................................. 16

 Data Acquisition Procedure ................................................................................................... 17

 Radar Data Extraction and Processing .................................................................................. 17

 Reflectivity Rainfall Relationship ......................................................................................... 18

 Traffic Data ............................................................................................................................... 21

 Data Reduction .......................................................................................................................... 23

CHAPTER 4: DATA ANALYSIS ............................................................................................... 24

 Variable Description ................................................................................................................. 24

 Variable Selection ..................................................................................................................... 25

 Data Distribution ....................................................................................................................... 29

 Relationship between Radar and Conventional Weather Station Rain Data ............................ 29

 Speed and Headway Modeling .................................................................................................. 33

 Logarithmic Transformation ..................................................................................................... 34

CHAPTER 5: RESULTS AND FINDINGS................................................................................. 35

 Traffic Characteristics ............................................................................................................... 35

 Descriptive Analysis ................................................................................................................. 37

 Model Results............................................................................................................................ 38

 vi
Speed Model .............................................................................................................................. 39

 Headway Model ........................................................................................................................ 41

 Findings ..................................................................................................................................... 43

CHAPTER 6: CONCLUSIONS ................................................................................................... 44

 Study Limitations ...................................................................................................................... 44

 Recommendations ..................................................................................................................... 45

REFERENCES ............................................................................................................................. 48

 vii
LIST OF TABLES

Table 1: Summary of the Effects of Rainfall on Speed and Capacity from Different Studies ....... 8

Table 2: Typical Observed Radar Reflectivity Factors for Varying Precipitation Rates ............. 19

Table 3: Rainfall Intensity Classification by Different Agencies ................................................. 21

Table 5: Descriptive Statistics for Southbound Variables ........................................................... 27

Table 6: Example of Block-Treatment Matrix.............................................................................. 30

Table 7: Radar Rainfall Data versus Conventional Rainfall Data ................................................ 32

Table 8: Friedman Results for Radar and Conventional Rainfall Data ........................................ 32

Table 9: Traffic Parameters Statistical Summary for Northbound and southbound ..................... 38

Table 10: Linear Regression Results for Speed - Northbound ..................................................... 40

Table 11: Linear Regression Results for Speed - Southbound ..................................................... 41

Table 12: Regression Analysis for Headway - Northbound ........................................................ 42

Table 13: Regression Analysis for Headway - Southbound ........................................................ 42

Table 14: Speed Reduction and Headway Increase per Rain Category........................................ 42

 viii
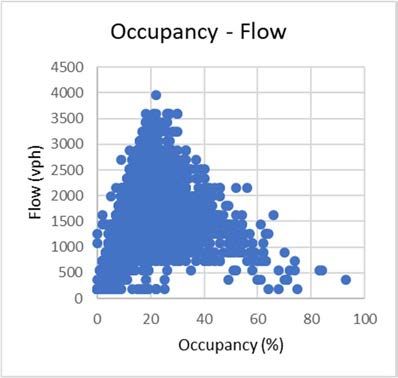
LIST OF FIGURES

Figure 1: Radar and Conventional Weather Stations Coverage ..................................................... 4

Figure 2: Study Location along I-95 in Jacksonville, Florida ...................................................... 13

Figure 3: Radar Sites ..................................................................................................................... 15

Figure 4: Spatiotemporal Effect of Rainfall.................................................................................. 18

Figure 5: Rainfall Data Extraction Process ................................................................................... 20

Figure 6: Network of Detectors in RITIS ..................................................................................... 22

Figure 6: Variable Correlation Model........................................................................................... 28

Figure 7: Speed Distribution ......................................................................................................... 29

Figure 8: Rainfall Amount for Radar and Conventional Station .................................................. 33

Figure 9: Traffic Flow Characteristics .......................................................................................... 36

 ix
ACRONYMS

AMS American Meteorological Society

ASOS Automated Surface Observing System

FDOT Florida Department of Transportation

FHWA Federal Highway Administration

GIS Geographic Information System

HCM Highway Capacity Manual

ID Identification

JIA Jacksonville International Airport

KJAX Radar site at Jacksonville International Airport

NAS Jax Naval Air Station Jacksonville

NEXRAD Next Generation Radar

NCDC National Cimatic Data Center

NOAA National Oceanic and Atmospheric Administration

NWS National Weather Service

RTMS Remote Traffic Microwave Sensors

RWIS Road Weather Information Systems

RWMP Road Weather Management Program

UK NWS United Kingdom National Weather Service

U.S. NWS United States National Weather Service

VSL Variable Speed Limits

WCT NOAA Weather Climatic Toolkit

WSR Weather Surveillance Radar

 x
ABSTRACT

Rainfall affects the performance of traffic operations and endangers safety. A common and

conventional method (rain gauges) for rainfall measurements mostly provide precipitation records

in hourly and 15-minute intervals. However, reliability, continuity, and wide area coverage pose

challenges with this data collection method. There is also a greater likelihood for data

misrepresentation in areas where short duration rainfall is predominant, i.e., reported values may

not reflect the actual equivalent rainfall intensity during subintervals over the entire reporting

period. With recent weather and climate patterns increasing in severity, there is a need for a more

effective and reliable way of measuring rainfall data used for traffic analyses. This study deployed

the use of precipitation radar data to investigate the spatiotemporal effect of rainfall on freeways

in Jacksonville, Florida. The linear regression analysis suggests a speed reduction of 0.75%,

1.54%, and 2.25% for light, moderate, and heavy rainfall, respectively. Additionally, headways

were observed to increase by 0.26%, 0.54%, and 0.79% for light, moderate, and heavy rainfall,

respectively. Measuring precipitation from radar data in lieu of using rain gauges has potential for

improving the quality of weather data used for transportation engineering purposes. This approach

addresses limitations experienced with conventional rain data, especially since conventional

collection methods generally do not reflect the spatiotemporal distribution of rainfall.

Key words: precipitation radar data, adverse weather, freeway operation

 xi
CHAPTER 1: INTRODUCTION

Background

Adverse weather conditions, specifically rainfall, affect the performance of traffic operations and

reduces highway safety. Rainfall influences traffic operations by affecting pavement conditions,

vehicle performance, and driver behavior. Consequently, three primary aspects of traffic

operations are negatively impacted: traffic safety, mobility, and efficiency (Hammit,

Ghasemzadeh, Ahmed, & Young, 2017).

 The characteristics and behavior of road users are among the most important elements that

influence the task of driving. The driving task involves performing several activities, such as

guiding the vehicle within the road, detecting other vehicles, detecting other motorized and non-

motorized users, judging the speed, position, and possible behavior of other road users, and

reacting accordingly (Chakrabarty & Gupta, 2013). Inclement weather affects the driving

conditions by either reducing the friction between the tires and pavement surface, impairing driver

visibility, and/or making vehicle handling difficult. Reduction in friction is caused by the

hydroplaning effect due to the formation of a thin layer of water on the roadway which may lead

to skidding. Road user perception of risk influences their behavioral responses to not only natural

changes in weather conditions, but road surface conditions as well.

 Inclement weather may disturb a driver’s comfort of driving. Weather conditions, such as

rainfall, snow, and fog, require drivers to adjust their driving behavior to reduce the associated

risks with each condition. These adjustments vary from trip cancellation to on-road adjustments,

such as increased driver attention, speed reduction, and greater gap distances between other

vehicles. However, some of these adjustments have been insufficient in alleviating the hazards

posed by inclement weather (Andrey, Hambly, Mills, & Afrin, 2013).

 1
It is well known that the performance of any transportation system is gaged primarily by

the traffic flow characteristics. Traffic performance indicators, such as speed, flow, and capacity

are affected by rainfall and other adverse weather conditions (Ibrahim & Hall, 1994; Li,

Elefteriadou, & Kondyli, 2014; Maze, Agarwai, & Burchett, 2006). Drivers’ response to inclement

weather affects traffic operations in terms of speed, reaction time, lane maintenance, and visibility,

since drivers tend to be more cautious. Moreover, weather and traffic conditions were found to be

the most significant factors contributing to driver behavior (Chakrabarty & Gupta, 2013)

 Rainfall is spatiotemporal by nature, i.e., it varies with respect to time and area.

Consequently, this implies that the effect of rain at a given time in a given area may differ. The

spatiotemporal impact of rainfall on traffic operations is of interest in transportation research,

planning, and management. Previous studies have examined the spatiotemporal effects of rain on

traffic by analyzing the changes in speed and flow patterns due to rain using available radar map

and rainfall data from hydrological stations (Dhaliwal et al., 2017).

 A study by Tsapakis et al. (2013) examined the spatiotemporal correlation of rainfall in

Greater London using hourly rainfall data from weather stations. The study found that weather

effects on speeds and travel times vary considerably, depending on the target area, geometric,

traffic, and driver characteristics, socioeconomic factors, roadway functional class, the season of

the year, and the climate of the examined region (Tsapakis, Cheng, & Bolbol, 2013). However,

despite the informative findings by Tsapakis et al. (2013) on variations of the effects of rainfall

with different factors, the study based the analyses on hourly data, and excluded sub-hourly

variations in weather, which are essential in gaining a full understanding of the effects of rainfall

on traffic operations. Similar studies also used hourly data (Maze et al., 2006); (Gillette,

Fitzpatrick, & Raul, 2017); (Angel, Sando, Chimba, & Kwigizile, 2014).

 2
The analysis of weather impacts on traffic flow where Automated Surface Observing

System (ASOS) was used for measurement of hourly rainfall reported some data issues associated

with ASOS, whereby some observations were missing in the dataset. Authors also pointed out that

study sites were located as far as 25 miles from the weather stations at three airport stations, which

implies that they could not capture the roadway weather conditions fully ever since weather could

vary throughout the road segment (Stern, Vaishal, Goodwin, & Pisano, 2002).

Problem Statement

Precipitation values that are frequently reported in hourly intervals may not reflect the rainfall

intensity throughout the entire 60-minute duration. For example, in Florida, short duration rainfall

events are common, where heavy rain may occur for 10 minutes or less, followed by sunny

conditions for the remainder of the hour. Consequently, hourly rainfall data may not correspond

to actual real-time rain conditions used in conjunction with other variables used for analysis.

 Typically, stations used to collect rainfall data are sparsely spaced. For example, in

Jacksonville, Florida, with a total land area of 875 square miles, there are only two reliable rainfall

stations: Naval Air Station Jacksonville (NAS Jax) and Jacksonville International Airport (JIA).

These stations cover not only a large area, but also are subject to mechanical breakdown, either

due to physical damage (natural or manmade), mechanical wear, or severe icing during winter

weather, requiring repair or replacement. During these system outages, some data may be

unavailable or physical observations may be misinterpreted.

 Changes in weather patterns and extreme climate events may contribute to heavy

precipitation events in some areas. It has also been suggested that the frequency and intensity of

heavy precipitation has increased in North America and Europe (Pachauri & Meyer, 2014).

 3
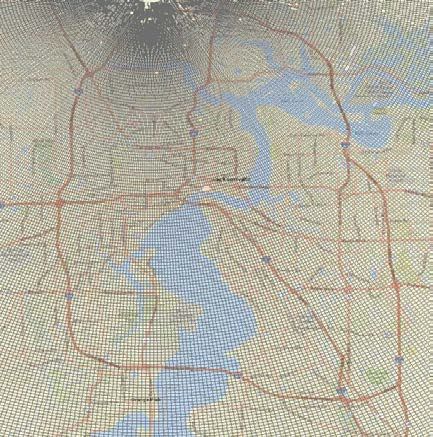
Therefore, developing a rainfall quantification approach that facilitates the effectiveness of

spatiotemporal analysis on issues relating to transportation systems is essential, especially in

anticipation of future extreme weather effects (Pachauri & Meyer, 2014).

 Radar data provide the spatial temporal distribution of rainfall over the road network. It

also offers a higher resolution data (Stern et al., 2002). Radar data is available in short time

intervals of 4.5, 5, 6 and 10 minutes. The availability of radar data in such small-time intervals

provides an opportunity to associate rainfall data with real-time traffic data, which is available in

small time intervals as well. With these benefits of radar data, it can be well exploited and applied

in quantification of the impact of rainfall on the transportation system. Figure 1 below shows the

coverage of radar station and that of conventional weather stations. Conventional weather stations

do not provide full coverage over the entire area, hence radar can be used to fully capture the effect

of rainfall on road networks.

 NOAA Radar Data from KJAX Underground Weather Stations 1

 Figure 1: Radar and Conventional Weather Stations Coverage

1
 Reprinted from Weather Underground (2019). Retrieved from:
https://www.wunderground.com/dashboard/pws/KFLJACKS129

 4
Objective

Quantifying the effect of weather on driver response is important in the evaluation of traffic

operations (Angel et al., 2014). A common practice for quantifying rainfall uses data collected by

surface meteorological stations which typically represent a wide area. The recent availability of

improved quality radar-based precipitation data is providing a momentum for better and relevant

quantification of rainfall in a spatial context, which can be helpful in analyzing the impact of

rainfall on traffic operations. Additionally, radar provides an opportunity for estimating shorter

durations of rainfall based on reflectivity data records of four to six minutes intervals, considering

the sub-hourly variations. This study presents an approach for quantifying rainfall using weather

radar data to examine the effects of rainfall on traffic operations along freeways, including short

rainfall events common in Florida, and reports the spatiotemporal effects on traffic parameters.

Significance of the study

Evaluating the spatiotemporal effects of rainfall on freeway traffic operations will be useful for

weather responsive management of transportation networks. This analysis can better establish the

actual effects of rainfall on freeway operations, thus allowing for appropriate response measures

based on the need.

Organization of the Manuscript

After identifying the knowledge gap and potential benefits of this study, the following section,

Chapter 2, provides a thorough review of relevant past studies related to the effect of rainfall on

traffic safety, freeway traffic operations, and the deployment of weather radar for traffic studies.

The methodology framework for this study is presented in Chapter 3. Chapter 4 discusses the

analysis of speed and headway, and model evaluation is presented in Chapter 5. Chapter 6 presents

the summary of the study, conclusions, and recommendations for future work.

 5
CHAPTER 2: LITERATURE REVIEW

The effects of rainfall on traffic operations has been discussed by different scholars in the past.

Additional research is still ongoing, primarily due to climatic changes leading to uncertainties,

unresolved issues, advancements in technology impacting analysis methods, and previous research

findings inspiring further investigation. This chapter explores different works related to the effects

of rainfall on traffic operations and is divided into six sections.

Effect of weather on safety

Precipitation can greatly affect transportation safety. Previous studies reported an increase in

collision rates, typically by 50-100%, resulting in serious injury or fatality under inclement weather

conditions. Many weather-related crashes occur during rainfall events and/or when the pavement

is wet (Hjelkrem & Ryeng, 2016). The U.S. Federal Highway Administration (FHWA) reported

that on average, more than 573,784 and 907,831 weather-related vehicle crashes occur each year

in United States (U.S.), due to rain and wet pavement respectively, resulting in property damage,

injuries and fatalities. About 74% and 46% of weather-related crashes in U.S. occur during wet

surface conditions and rainfall, respectively (Federal Highway Administration, 2018). Also, a

study in China reported that weather-related crashes account for 25% of total vehicle crashes (Shi,

2015).

Rainfall Impact on Freeway Traffic Speed

Vehicle speed is one of the key parameters in determining traffic performance of a transportation

system. Speed reduction is cited as a primary response to inclement weather, as drivers attempt to

compensate for the negative effects on the driving task, such as insufficient time for appropriate

response to unexpected situations. Relative to the number of trips, driving below the posted speed

limit has been observed more often during heavy rainfall, compared to light rain and clear weather,

 6
by 85.2%, 65.2%, and 37%, respectively (Ahmed, Mohamed M.; Ghasemzadeh, 2015). Studies on

the impact of rain on highway and freeway traffic flows revealed that reduction in vehicle speed

increases travel time and traffic delays significantly, resulting in increased traffic congestion

(Smith, Brian L.; Byrne, Kristi G.; Copperman, Rachel B.; Hennessy, Susan M.; Goodall, 2003;

Zhou, 2016). Furthermore, under inclement weather conditions, the associated risks increase as

the posted speed limit increases (Andrey et al., 2013). To account for speed reductions under

adverse weather conditions, such as medium and heavy rainfall, speed adjustment factors are

presented for facility free flow speed (Highway Capacity Manual, 2016; Zegeer et al., 2013).

 Several studies reported the impact of rainfall on traffic speed as a function of the rain

intensity, thus, speed reduction increases as the intensity increases. Table 1 briefly summarizes the

results of several studies on the impact of rainfall on traffic speeds.

 7
Table 1: Summary of the Effects of Rainfall on Speed and Capacity from Different Studies

 Facility type &
 Rain Intensity Level Speed reduction
 Location
 Light 3%-5%
 (Ibrahim & Hall, 1994) Freeway
 Heavy 14%-15%
 -
 Dry condition
 (Brilon & Ponlet 1996) Freeway 6mph–four-lane
 Wet condition
 7.5mph-Six-lane
 Light rain 10km/hr
 (HCM, 2000) Freeway
 Heavy Rain 19km/hr
 (Smith, Brian L.; None < 0.01 in/hr No speed reduction
 Byrne, Kristi G.; Light 0.01-0.25 in/hr 5%-6.5%
 Freeway
 Copperman, Rachel B.;
 Hampton, Virginia
 Hennessy, Susan M.; Heavy > 0.25 in/hr 5%-6.5%
 Goodall, 2003)
 Trace < 0.01 in/hr 1%-2%
 (Agarwal, Maze, & Freeway-Minneapolis,
 Light 0.01-0.25 in/hr 2%-4%
 Souleyrette, 2005) Minnesota
 Heavy > 0.25 in/hr 4%-7%
 Light ≤ 0.1 in/hr
 (Rakha, Farzaneh, 2%-3.65%
 Freeway Medium 0.1-0.25
 Arafeh, & Sterzin, -
 Minneapolis, Minnesota in/hr
 2008) 6%-9%
 Heavy>0.25 in/hr
 Light 3%-5%
 Heavy 14%-15%
 (HCM, 2016) Freeway 0-0.01 in/hr -
 0.1-0.25 in/hr -
 >0.25 in/hr -
 (Akin, Sisiopiku, &
 Freeway (Istanbul) Rainy conditions 8%-20%
 Skabardonis, 2011)
 Light
 Freeway 1.8-2.5mph for I-295
 (Angel et al., 2014) Medium
 Jacksonville, Florida 1.5-3.5mph for I-95
 Heavy
 Freeway & Arterial
 section Tallahassee, Light 6%
 (Li et al. (2014)
 Orlando and Miami, Heavy 12%
 Florida
 Light 8.65
 (Dhaliwal et al., 2017) Freeway (Los Angeles) Medium 17.4%
 Heavy 15.34%
 Light 4.4%,
 Expressway
 (Wang & Luo, 2017) Moderate 7.3%
 Hainan, China
 Heavy 10.6%

 8
Headway

Driver behavior affects the driving task. Headway selection depends on the driver’s ability to see

objects (the dynamic visual acuity) and the reaction process, both of which influence the driving

task. During inclement weather, it is important for drivers to keep greater than the minimum safe

vehicle gap. As such, drivers tend to keep longer following distances during rainfall events.

Adverse weather conditions, such as rainfall, reduces visibility, as brightness decreases and the

glare increases. Consequently, a drivers’ perception reaction time increases to compensate for the

increased risk (Ahmed, Mohamed M.; Ghasemzadeh, 2015; Andrey et al., 2013).

 Wet pavement during and after rainfall events reduces the traction between the pavement

surface and the vehicle tires, causing slippery conditions and difficulty braking. Weather related

crashes in China contribute to nearly 25 percent of total vehicle crashes, one-third of which are

rear-end, which are more likely to occur on rainy days (Shi, 2015). Two primary reasons for this

are increased driver perception response times due to reduced visibility and less pavement friction,

both affecting the minimum safe gap typically required between vehicles.

 The fact that human error and driver behavior have been identified as key factors

contributing to more than 60% of crashes, the general nature of headway selection can have a

significant effect on freeways in terms of safety and operational performance (Ahmed &

Ghasemzadeh, 2015). Therefore, it is important to examine the impact of rainfall on headways.

Weather Radar in Traffic Studies

Although few, several researchers (Hooper et al., 2007; Jaroszweski & McNamara, 2014) have

attempted to examine spatiotemporal aspects of rainfall on traffic issues using weather radar data.

A study by Hooper et al. (2007) was conducted on United Kingdom (UK) motorways to determine

the impact of precipitation on traffic speeds in an effort to establish failure precipitation thresholds.

 9
Precipitation data was obtained after creating a geographic information system (GIS) map using

weather data and motorway links. Speed data were collected at 15-minute intervals, while the

precipitation data were in five-minute intervals. Higher speeds were observed in periods without

rain, and a decrease in speeds were reported when precipitation was present. However, the analysis

did not include several important factors, such as traffic flows (volume) and precipitation

durations, which are significant factors required to gain a better understanding of the impacts of

precipitation on travel speeds (Hooper et al., 2007).

 Another UK study by Jaroszweski and McNamara (2014) incorporated weather radar

images in the accident analyses. The study used a 3-hour rainfall event and superimposed the

weather radar images onto an urban area map. The effect of rainfall was expressed in relative

accident rates, the ratio of accidents recorded during precipitation to those that occurred during

normal conditions. Study findings revealed that the matching analysis of weather radar images

onto urban areas produced a more representative measure of rainfall than the station-based data

approach. However, the metrics to support this argument were not provided.

A study conducted in Washington DC, used radar data to compliment weather data for the missing

ASOS data in the analysis of weather impact on traffic flow. Level III reflectivity data we used

from the National Climatic Data Centre (NCDC). Correlation of radar data on road segment was

done by overlaying radar on road network through Geographic Information system (Stern et al.,

2002).

A report on weather integration by (Federal Highway Administration, 2006) for weather stated

that weather integration in Traffic Management Centers (TMC) will enhance operators ability to

manage traffic in a more responsive and effective way. The improved weather integration within

TMCs will help reduce the effects of weather on transportation systems. Integration of current and

 10
future weather information in a TMC depends on the institutional landscape, weather exposure,

transportation infrastructure, and weather information need in the state or region, hence it is

expected to vary from one center to another. Weather information requires a comprehensive

understanding of weather data and forecast accuracy so as to be useful in decision making in the

TMCs . Weather radar images is among the operational strategies in use, which provides a visual

access for operators to see where adverse weather may be developing (Federal Highway

Administration, 2006). Apart from the weather images for visualization, weather radar data, can

be effectively quantified as well as the corresponding traffic parameters for better management of

the transportation systems.

 In summary, rainfall affects freeway traffic flow in various ways, both at the micro level

and the macro level. This study focuses on the micro level, whereby two parameters, speed and

headways, will be examined.

Regression Analysis

Previous studies have applied different approaches to model the effects of rain on traffic

operations, such as analyzing vehicle speeds before, during, and after a rain event, or utilizing

binary logistic regression to determine factors affecting the speed variance during and after rain

events. Wang and Luo (2017) used a linear regression analysis to develop weather influence factors

for traffic flow parameters. Another study by Shi et al. (2011) explored the effects of rainfall and

road environmental factors on urban freeway traffic using the same approach.

 To understand driver behavior under different rain and traffic conditions, Ahmed and

Ghasemzadeh (2015) used the ordered probit model to model speed and headway. A multiple

regression approach was used by Ibrahim and Hall (1994) to study speed reduction during rain and

snow conditions. Shi (2015) investigated the effects of rain on the average vehicle gap using a

 11
quadratic regression model, and a stepwise regression analysis was performed by Rakha et al.

(2012) to study the impact of weather on traffic stream behavior. Findings of these studies are

briefly summarized in Table 1.

 12
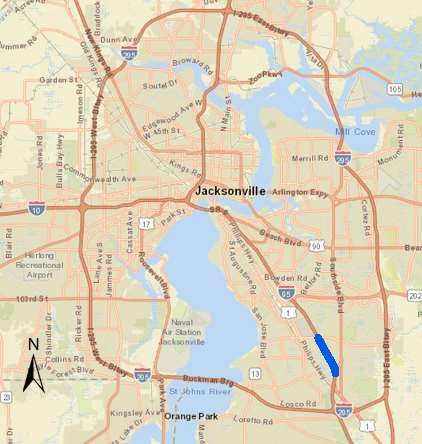
CHAPTER 3: METHODOLOGY

Site Selection

The study location was selected based on the availability of traffic detectors for traffic data and

within radar range for rainfall data. A segment along the I-95 corridor, a north-south freeway that

travels through Jacksonville, Florida was selected for study. As shown in Figure 1, the selected

segment is located between Southside Boulevard and Baymeadows Road, south of downtown, and

spans approximately two miles in length. This segment of I-95 is a 6-lanes facility with a posted

speed of 65 mph. Both traffic directions of travel were considered in this study.

 Figure 2: Study Location along I-95 in Jacksonville, Florida

 13
Data Collection

Data were collected for eight rainy days in 2018: June 12, June 28, July 05, July 17, October 10,

December 03, December 14, and December 20. These days were selected based on previous video

recordings and historical weather information from websites that provide archived weather data,

such as Weather Underground (Weather Underground, n.d.). Data for eight days in 2018 where

the weather condition was dry also collected: June 05, June 07, July 12, July 10, October 03,

December 17, December 28, and December 13. These dates were selected based on the time-period

that coincided with the rain event days in terms of day of the week, and one or two weeks before

or after the rain event, as suggested by other studies (Andrey et al., 2013; Dhaliwal et al., 2017).

This was accomplished through accessing archived weather records available online (Weather

Underground, n.d.).

 Data were collected between 7:00 AM to 7:00 PM for each date included in the study.

Holidays, such as New Year’s Day, Christmas Day, Independence Day, and Thanksgiving were

avoided and not included in the dataset. Additionally, weekend days (Saturday and Sunday) were

not included in the analyses to avoid the possible effect of non-weekday traffic patterns.

Rainfall Data

Areas such as Jacksonville experience short rain events which may last for only few minutes. This

study used radar data to capture short duration and location-specific (spatiotemporal) rainfall data

at the freeway study segment.

 Weather radar data available from the National Weather Service (NWS), a division of the

National Oceanic and Atmospheric Administration (NOAA), was reviewed to obtain the

spatiotemporal rainfall data. Radar is a detection system that uses radio waves to determine the

range, angle, or velocity of objects for different purposes such as the detection of aircraft, ships,

 14
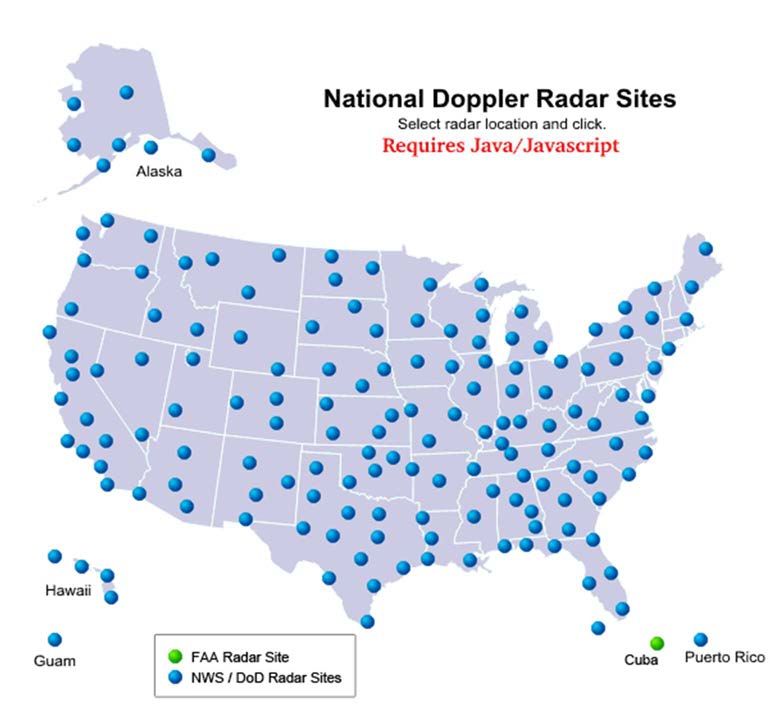
spacecraft, guided missiles, motor vehicles, weather formations, and terrain, and has been used to

estimate rainfall amounts since 1960. There are several weather radars around the world. For this

study, the preferred weather radar was determined to be Weather Surveillance Radar 88-Doppler

(WSR 88-D), also known as Next Generation Radar (NEXRAD). Figure 2 shows the general

location of Doppler radar sites in U.S., with one NEXRAD site located in Jacksonville at the

Jacksonville International Airport (JIA), and called KJAX. These weather radars can locate and

follow precipitation within a range of 127.274 to 248.548 miles (200-400 km) (Teegavarapu &

UNESCO, 2012).

 Figure 3: Radar Sites
 (National Oceanic and Atmospheric Administration [NOAA], n.d.)

 15
Radiations emitted by radar are detected and reflected by the precipitation targets. The degree of detection depends on atmospheric conditions between the radar and the target, the distance from the radar to the target, target characteristics, and radar characteristics. The measure of efficiency of a target in intercepting and returning radio frequency energy is referred to as reflectivity. Reflectivity can simply be defined as a measure of fractions of radiations reflected by a given surface, and expressed as the ratio of the radiant energy reflected to the total amount of energy incident upon that surface (National Weather Service Training Centre, n.d.). Limitations of a Radar Method of Estimating Rainfall Rate When using weather radar, underestimation of rainfall data may occur in case of: Distant targets, small targets, and wide radar beams directly resulting from the target and not filling the radar beam. Sub-refraction of the beam, attenuation by intervening targets, and wet radomes (protective domes). Sub-refraction is caused when the radar beam may be "bent", causing the energy to propagate over a target. Attenuation factors depend upon the extent (and intensity) of precipitation between the radar and the desired target. Radome wetness attenuation is usually small, but may become significant if the exterior of the dome is not well maintained (National Weather Service Training Centre, n.d.). In regions where echo contains mixed phase particles. The physical interpretation of radar reflectivity factors is more complicated than in regions containing mixed precipitation, such as mixed snow and rain than in regions with exclusive snow or rain. These limitations can be avoided through frequent calibration and maintenance of the radar. Well maintained radar equipment is necessary for accurate radar estimations. 16
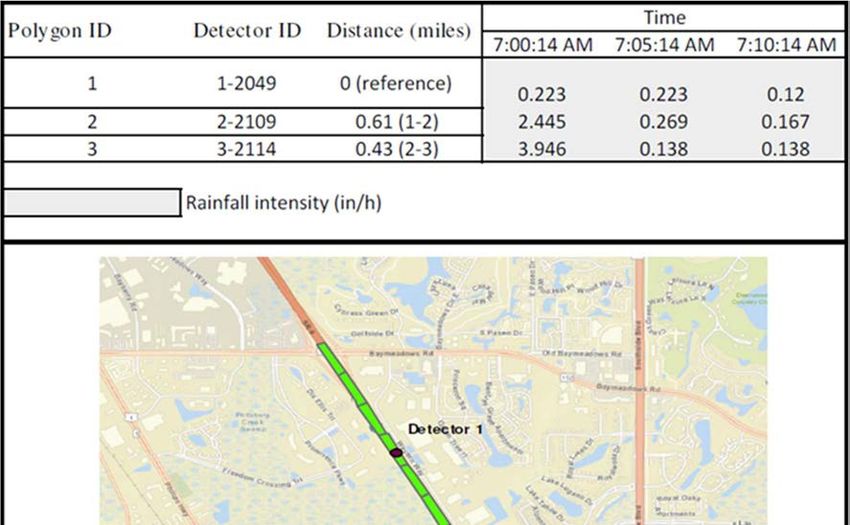
Data Acquisition Procedure

Data was requested from the NOAA website using the following steps:

 1. Go to weather website (NOAA, n.d.).

 2. Select the site, either by map (KJAX) or by city, county, or zip code.

 3. Choose time of event and the radar product required-base data.

 4. Enter an email address and order the data.

 5. Once the application is completed, an order confirmation and the product code number

 will be sent to the email entered. When data processing is complete, the data will be sent

 to the email entered (Duda, 2005).

Alternatively, one can directly download data by simply writing a script using java or python

programming language to obtain data from the NOAA website.

Radar Data Extraction and Processing

Since NEXRAD level II files come in binary file format, the data was extracted and processed

using the NOAA weather climatic toolkit (WCT). The WCT enables conversion and visualization

of NEXRAD files into various file formats. Each file contains reflectivity, mean radial velocity,

and spectrum width data collected for the entire range of the radar station. Data files are available

for the intervals of four, five, six, or ten minutes.

 To obtain the spatial distribution data, the extracted arc polygon files were exported to

ArcGIS, and a layer for the road polygon was created for the study site using the imagery base

map. This segment was further divided into sub-polygons. Arc polygon files from NOAA were

combined with the road polygon to obtain a joint file providing reflectivity data (from which

rainfall was derived) for every sub-polygon, in tabular form. Figure 3 shows a map extracted from

ArcGIS with rainfall data in in/h for different locations along the I-95 study segment.

 17
Figure 4: Spatiotemporal Effect of Rainfall

Reflectivity Rainfall Relationship

Reflectivity is also referred to as the sixth power of the diameter of rain drops (mm 6) per cubic

meter of atmosphere. The relationship between reflectivity and rainfall rate is through the drop

size distribution, and is given by two parameters in a Z-R relationship as follows:

 = (1)

where, Z is the reflectivity (mm6/m3),

 R is the rainfall rate (mm/hr), and

 18
a and b are fitting coefficients.

 The coefficient a varies between 100 and 900, and exponent b varies between 1 and 2. In

practice, specifically in the U.S., reflectivity values (Z) are reported as decibels of reflectivity

(dBZ), and the reflectivity can range over many orders of magnitude. For operational use, Z is

converted to decibels (Equation 2) (Teegavarapu & UNESCO, 2012). Note that anytime Z is less

than 1 mm6/m3, dBZ becomes negative, which implies that the radar is detecting very small

hydrometeors.

 = 10 log (2)

Table 2: Typical Observed Radar Reflectivity Factors for Varying Precipitation Rates

 (https://www.weather.gov/jetstream/refl)
 Rain Rate Rain Rate
 dBZ
 (in/hr) (mm/hr)
 65 16+ 420+
 60 8 205
 55 4 100
 50 1.9 47
 45 0.92 24
 40 0.45 12
 35 0.22 6
 30 0.1 3
 25 0.05 1
 20 0.01 Trace
 < 15 No rain No rain

 For Jacksonville, with a sub-tropical climate, the Z-R relationship was computed using

Equation 3, as follows:

 Z = 250 . (3)

 19
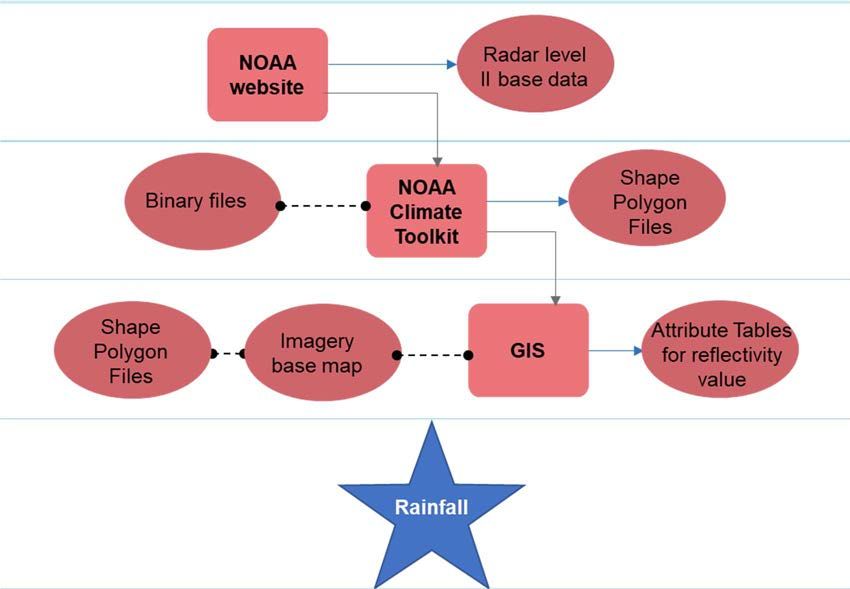
The conversion of reflectivity to rainfall rate was computed as follows:

 = (4)

Figure 4 illustrates the data extraction process used to obtain the rainfall rates used in the analyses.

 Figure 5: Rainfall Data Extraction Process

 In addition, weather station data was also obtained from the Weather Underground weather

forecasting website (Weather Underground, n.d.) for the rainfall intensity classifications shown in

Table 3. Rainfall intensity rates defined by the American Meteorological Society (AMS) for Light,

Moderate, and Heavy rain classifications were adopted in this study for comparison with findings

from previous studies. The intensity range for each category is listed in Table 3, with comparative

ranges used by other agencies and resources.

 20
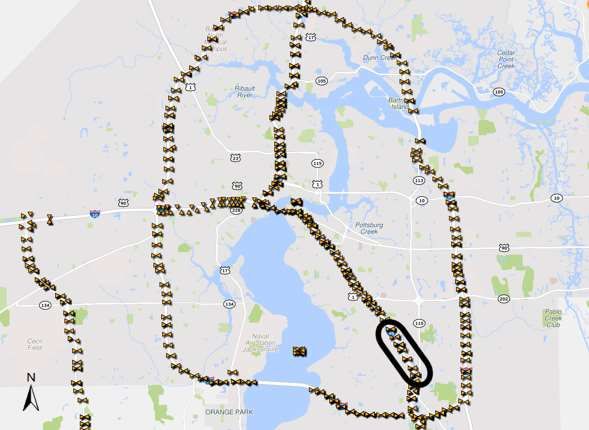
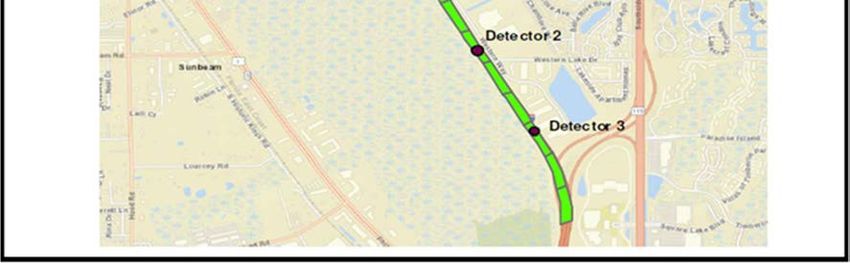
Table 3: Rainfall Intensity Classification by Different Agencies

 (Angel et al., 2014)
 Rain Category
 AMS U.S. NWS HCM Canada UK NWS
 (in/h)
 Light Trace - 0.10 > 0.11 - 0.20 > 0-0.10 ≤ 0.1 > 0-0.08
 Moderate 0.10 - 0.30 0.21 - 0.50 > 0.10-0.25 > 0.10-0.30 > 0.08-0.39
 Heavy > 0.30 > 0.50 > 0.25 > 0.30 > 0.39-1.96
Note: American Meteorological Society (AMS), United States National Weather Service (U.S.
NWS), United Kingdom National Weather Service (UK NWS), Highway Capacity Manual (HCM)

Traffic Data

For this study, traffic information was obtained from the Regional Integrated Transportation

Information System (RITIS), which provides data gathered by Remote Traffic Microwave Sensors

(RTMSs). RITIS is a database that collects traffic information from a network of detectors located

along the freeways. Figure 5 shows the location of traffic detectors installed along freeways in

Jacksonville, including the I-95 study segment, as they appear in RITIS. Mounted on road-side

poles for traffic detection, RTMSs are small radar sensors that operate in a microwave band. The

detection principle is based on the detector sending (emitting) radio frequency waves. Once these

waves hit a vehicle(s), they are reflected back to the detector, and information is recorded, such as

vehicle speeds. Data from these detectors are then archived in the RITIS database (Regional

Integrated Transportation Information System [RITIS], n.d.).

 Information provided by RTMS sensors include per-lane presence indication, volume,

occupancy, vehicle speed, and classification information for up to eight lanes or detection zones.

For the I-95 study site, six traffic sensors (three for each travel direction) were available for

capturing traffic information. At the study site, northbound detectors with RITIS identification

(ID) numbers 2049, 2109, and 2114 were used, and detectors, ID-2050, 2010, and 2115, were used

for the southbound travel direction. The sensor data collected was aggregated in 20-second

 21
intervals. From the primary speed, volume, and occupancy data, other traffic variables, such as

density, headway, and traffic flow can be derived. Traffic flow was aggregated into 15-minute

intervals and then converted to hours for computation purposes. Equations 3 and 4 were used to

calculate headway and density, respectively, as follows:

 3600 (3)
 Headway (s) =
 Flow (vph)

 Flow (vph) (4)
 Density (veh/mi/ln) =
 Speed (mi/h)

 Figure 6: Network of Detectors in RITIS
 (RITIS, n.d.)

 22
Data Reduction

Both the collected traffic and rainfall data were obtained in form of Excel files. Since the traffic

data obtained from RITIS were in 20-second intervals, and rainfall data were in 4- to 6-minute

intervals, the two datasets had to be carefully merged for the traffic condition parameters to

correlate with the rainfall intensity data. Therefore, each 5-minute interval for each rainfall

intensity category (Light, Moderate, and Heavy) was carefully matched with the corresponding 5-

minute traffic data interval, aggregated from the 20-second data delivered in the Excel file.

 Outliers and other data discrepancies, such as missing data and rainfall intensity greater

than 3.95 in/hr were removed from the dataset. After merging the traffic and rain data, the final

dataset used for analysis contained a total of 69,546 and 67,526 data points in 20 seconds interval

for northbound and southbound, respectively, at the I-95 study site.

 23
CHAPTER 4: DATA ANALYSIS

Variable Description

In this study, data were grouped into two main groups: categorical variables and continuous

variables. Categorical variables included time of day, lane position (lane ID), and rainfall category.

Continuous variables included traffic volume, occupancy, speed, density, traffic flow, headway,

and rainfall intensity. Categorical variables were further subcategorized, as shown in Tables 4 and

5, and descriptive statistics for both variable groups are also presented.

 Zone identification (zone ID) was also included in the analyses as a categorical variable.

Zone depicts the locations where traffic detectors are located within the study segment (see Figure

3). Information on the direction of travel, northbound or southbound, was determined for each

zone ID.

 The study site selected along I-95 is a 6-lane section with three lanes in each direction of

travel. Therefore, each lane position (i.e., innermost, middle, and outermost lane) was considered

in the analyses to incorporate common trends of different vehicle speeds in different lanes. In

general, vehicles are expected to exhibit different behavior with respect to lane position. Higher

speeds are typically observed in the innermost lane (adjacent to the median) compared to the

middle lane and outermost lane (adjacent to the shoulder). The outermost lane, also referred to as

the shoulder lane, is characterized with lower speeds, especially in merging areas, such as at

interchanges, where vehicles are entering or exiting the freeway. Vehicles in this lane must adjust

their speeds to accommodate these scenarios. Average speeds shown in Table 4 corroborate this

speed-lane phenomenon typically observed on freeways.

 Data was also categorized with respect to the rain intensity using the AMS classification

system (see Table 3). Four subgroups were analyzed within the rainfall category: no rain, light

 24
rain, moderate rain, and heavy rain. Traffic parameters were analyzed with respect to the time of

a day for peak and off-peak traffic conditions. Peak travel time was assigned to the hours of 0700

to 1000 for morning peak and 1500 to 1900 hours for the evening peak. However, the

categorization did not specify the type of peak (morning or evening).

 The traffic volume continuous variable was collected by the detector as the number of

vehicles passing in 20-second intervals. Occupancy, also collected by the detector, refers to the

amount of time a detector is occupied by vehicles, and is expressed as a percentage. Traffic flow

was derived from the traffic volume value, an hourly equivalent to the number of vehicles passing

through a detector in a 20-second interval. The headway was obtained by reciprocating the flow,

and density was also derived from the computed traffic flow.

Variable Selection

A correlation coefficient analysis was conducted using R programming language to check the

correlation between rainfall and traffic variables. The variables used to examine the correlation

included speed, volume, headway, flow, occupancy, density, zone ID, and lane ID (lane position).

The resulting correlation coefficients are shown in Figure 6.

Interpretation of correlation coefficient differs greatly in different research areas. There are no

absolute rules for interpreting their strength, and it is unclear where a relationship changes from

good to strong (Akoglu, 2018). However, some highly correlated factors were observed from the

correlation model. A threshold of 0.8 was adopted, based on correlation thresholds presented in a

study by Shi et al. (2011), where the correlation coefficient, r, was defined as follows: | |≤0.3

indicates a weak correlation, 0.3
Table 4: Descriptive Statistics for Northbound Variables

 Average SD Min Max
 Categorical Variable Factor Count
 (mph) (mph) (mph) (mph)

 68.14 8.15 26 90
 Off Peak 32357
 (4.61) (3.76) (1) (20)
 Time-of-day
 62.46 15.38 10 90
 Peak 37189
 (4.04) (3.33) (0.91) (20)

 70.01 12.74 10.00 90.00
 Innermost 23264
 (3.97) (3.1) (0.91) (20.00)
 65.00 11.82 10.00 88.00
 Lane position Middle 23455
 (3.08) (1.60) (1.05) (20.00)
 60.21 12.01 10.00 90.00
 Outermost 22827
 (5.91) (4.65) (1.00) (20.00)
 69.98 8.05 10.00 90.00
 No rain 33228
 (4.08) (3.46) (0.91) (20.00)
 62.18 14.00 10.00 90.00
 Light 25625
 (4.48) (3.60) (1.05) (20.00)
 Rainfall Category
 57.33 16.59 10.00 89.00
 Moderate 6142
 (4.50) (3.63) (1.25) (20.00)
 56.46 14.19 10.00 86.00
 Heavy 4551
 (4.73) (3.70) (1.25) (20.00)

 Continuous Variable N Mean SD Min Max
 Volume (veh/20 sec) 69546 7 3 1 22
 Occupancy (%) 69546 9 7 0 96
 Rainfall Intensity (in/h) 69546 0.09 0.31 0 3.95
 Density (veh/mi/ln) 69546 20 13 2 165
 Flow(veh/h) 69546 1165 542 180 3960
 Headway (sec) 69546 4.3 3.5 0.9 20
 Speed (mph) 69546 65.10 12.86 90 10
Note: For categorical variables, values in brackets represent headway in seconds.

 26
Table 5: Descriptive Statistics for Southbound Variables

 Average SD Min Max
 Categorical Variable Factor Count
 (mph) (mph) (mph) (mph)

 71.12 8.05 24 90
 Off Peak 31330
 (4.61) (3.76) (1) (20)
 Time of a day
 66.18 13.12 10 90
 Peak 36196
 (4.04) (3.33) (0.91) (20)
 72.88 10.89 10.00 90.00
 Innermost 22850
 (4.59) (3.31) (1.11) (20.00)
 67.37 10.73 10.00 90.00
 Lane position Middle 21869
 (3.42) (2.04) (1.05) (20.00)

 65.10 10.91 10.00 90.00
 Outermost 22807
 (4.06) (3.69) (0.91) (20.00)
 72.40 9.00 10.00 90.00
 No rain 30895
 (3.86) (2.98) (0.91) (20.00)
 66.16 11.94 10.00 90.00
 Light 25879
 (4.08) (3.17) (1.05) (20.00)
 Rainfall Category
 64.57 11.34 10.00 90.00
 Moderate 6194
 (4.36) (3.37) (1.18) (20.00)

 60.20 12.02 15.00 90.00
 Heavy 4558
 (4.52) (3.68) (1.33) (20.00)

 Continuous Variable N Mean SD Min Max
 Volume (veh/20 sec) 67526 7 4 1 22
 Occupancy (%) 67526 10 6 0 93
 Rainfall Intensity (in/h) 67526 0.09 32 0 3.95
 Density (veh/mi/ln) 67526 19 12 2 252
 Flow(veh/h) 67526 1212 559 180 3960
 Headway (sec) 67526 4.03 3.15 0.91 20
 Speed (mph) 67526 68.47 11.33 90 10

 27
From the correlation analysis, two sets of variables revealed a correlation greater than 0.8.

Occupancy and density had a high correlation coefficient (0.9), while the correlation coefficient

between lane ID and zone was 1.0, as shown in Figure 6. Therefore, only one variable from each

was selected for analysis based on parameter importance. A high correlation (0.9) was found

between flow and volume. This was expected since flow and volume are derivative of one another.

The final variables selected for modeling were flow, density, lane position (lane ID), rainfall

intensity, speed, and headway.

 Figure 6: Variable Correlation Model

 28
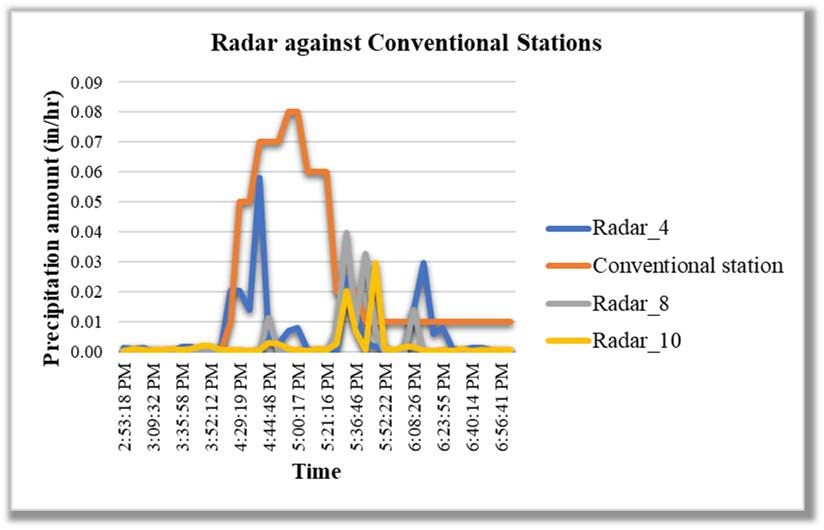
Data Distribution

Using Minitab software, speed and headway data were plotted to determine the data distribution,

one of the factors guiding the selection of a suitable model. As illustrated in Figure 7, the speed

data distributions were observed to follow a 3-parameter Weibull distribution.

 Histogram of speed
 Smallest Extreme Value
 3500 Loc 70.22
 Scale 8.806
 N 65535
 3000

 2500
 Frequency

 2000

 1500

 1000

 500

 0
 11 22 33 44 55 66 77 88
 speed (mph)

 Figure 7: Speed Distribution

Relationship between Radar and Conventional Weather Station Rain Data

As expected, the Minitab software analysis revealed that the rainfall data was non-parametric, as

they are not normally distributed. For this reason, an Analysis of Variance (ANOVA) test, which

works under the assumption that the data is normally distributed, was not suitable for the

comparison of weather radar data and rainfall data obtained from conventional collection stations

(i.e., sites that utilize rain gages). The application of ANOVA for non-normal distributions may

 29
result in false results; however, several previous studies have found that when the sample size is

large, the test is not very sensitive to moderate variations from normality (Dhaliwal et al., 2017;

Glass et al., 1969). Therefore, a more suitable test to analyze the rain data was determined to be

the Friedman non-parametric test. The Friedman test is a non-parametric alternative to a two-way

ANOVA test. Similar to other non-parametric tests, the Friedman test does not assume data to

follow any specific distribution.

 The Friedman test requires data to have two categorical factors: experimental treatments

and blocks. These two factors determine the test statistic S, which is used to compute the p-value.

Another requirement for the Friedman test is for the number of experimental treatments (k) to be

greater than or equal to two (k ≥ 2). The blocks (n) are normally used to display the observations,

and are randomly assigned to each treatment. Also, only one observation for each treatment and

block observation is required. Table 6 illustrates the block-treatment matrix for the Friedman test

(Hollander et al., 2013).

Table 6: Example of Block-Treatment Matrix

 Treatments
 Blocks
 1 2 ... K

 1 X11 X12 ... X1k

 2 X21 X22 ... X2k

 3 X31 X32 ... X3k

 ... ... ... ... ...

 n Xb1 Xb2 ... Xbk

 Note that the response variable should be continuous or ordinal and for the approximation

of the Friedman test statistic S to be accurate, and the randomized block design should have at least

five blocks or treatments. Hypotheses tested using the Friedman test are:

 30
You can also read