Climate Change Risks for European Aviation 2021 - Annex 5: Impact of changes in wind patterns on flight operations - Eurocontrol
←
→
Page content transcription
If your browser does not render page correctly, please read the page content below
Climate Change Risks for
European Aviation 2021
Annex 5: Impact of changes in wind patterns
on flight operations

Final Report

SUPPORTING EUROPEAN AVIATION
EUROCONTROL’s Climate Change Risks for European Aviation study 2021
Impact of changes in wind patterns on flight operations
Technical report

Table of contents
Executive Summary ....................................................................................................................................................................6
       Introduction ........................................................................................................................................................................9
   1.1 Purpose of this document ............................................................................................................................................................. 9
   1.2 Study drivers and Scope ................................................................................................................................................................ 9
   1.3 Document Structure ........................................................................................................................................................................ 9
       Background ........................................................................................................................................................................11
       Methodology .................................................................................................................................................................... 15
   3.1 Approach ............................................................................................................................................................................................ 15
       3.1.1 Link to historic operational data ....................................................................................................................................... 18
   3.2 Data sources and models ............................................................................................................................................................ 19
   3.3 Assumptions ..................................................................................................................................................................................... 20
       Impact of changes in wind patterns .......................................................................................................................... 22
   4.1 Historical flight times and their relation to weather patterns ....................................................................................... 22
       4.1.1 Impact of days with strong headwinds or tailwinds on flight performance ................................................... 25
   4.2 Projected changes in weather patterns and the implications for flight times ........................................................ 27
   4.3 Projected changes in flight times from application of the TP algorithm to climate model output............... 29
       4.3.1 North Europe-Canaries ......................................................................................................................................................... 29
       4.3.2 Europe-Asia ............................................................................................................................................................................... 32
       4.3.3 Europe-North America ......................................................................................................................................................... 37
       4.3.4 Estimated future operational impacts ............................................................................................................................ 45
   4.4 Projected changes in surface winds ........................................................................................................................................ 48
       Discussion ......................................................................................................................................................................... 53
       Conclusions ...................................................................................................................................................................... 56
Appendix ................................................................................................................................................................................... 59
References ................................................................................................................................................................................ 73
Glossary ..................................................................................................................................................................................... 74
Contributions ........................................................................................................................................................................... 75

                                                                                                                                                                                           Page 2 of 75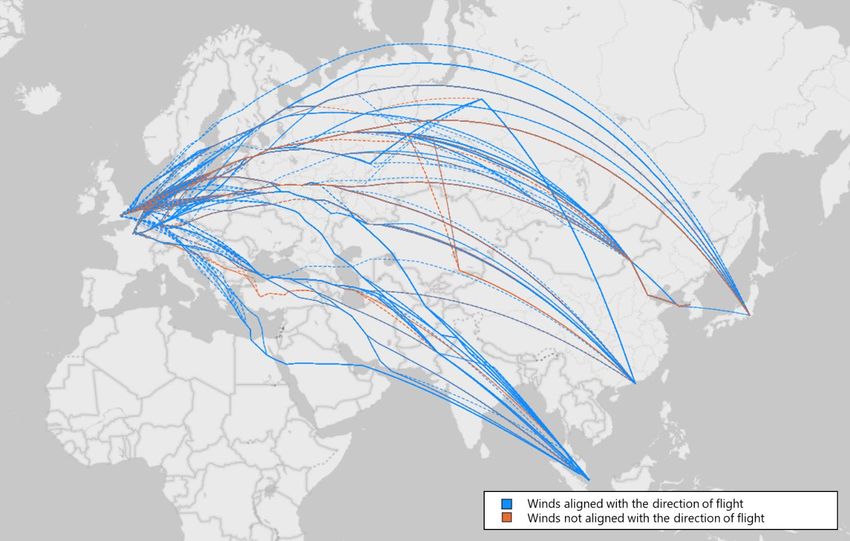
EUROCONTROL’s Climate Change Risks for European Aviation study 2021
Impact of changes in wind patterns on flight operations
Technical report
List of figures
Figure 1: Schematic showing the basics of the node-based pathfinding technique.. ........................................................................................................ 15
Figure 2: Case study highlighting the difference in time-optimal routes predicted by the traditional method (red) and node-based TP
technique (blue)......................................................................................................................................................................................................................................... 16
Figure 3: Same as Figure 2 but for a EGLL to KORD flight. .......................................................................................................................................................... 16
Figure 4: Simplified high-level diagram of the approach taken ................................................................................................................................................ 19
Figure 5: The occurrence of fast (left) and slow (right) flights between Europe and North America in winter (top) and summer (bottom). .. 23
Figure 6: The occurrence of fast (left) and slow (right) flights between Europe and North Asia in winter (top) and summer (bottom). ......... 24
Figure 7: Distance vs flight duration on fast and slow days for flights travelling from Europe to North America.................................................... 26
Figure 8: Ground speed vs flight duration on fast and slow days for flights travelling from Europe to North America......................................... 26
Figure 9: Fuel burn vs flight duration on fast and slow days for flights travelling from Europe to North America. ................................................. 27
Figure 10: Winter (top) and summer (bottom) ensemble median percentage change in the frequency of each weather pattern for 2036-
2065, relative to 1981-2010, for both the PPE-15 (blue crosses) and CMIP-13 (yellow crosses) ensembles in the RCP8.5 emissions scenario.
......................................................................................................................................................................................................................................................................... 28
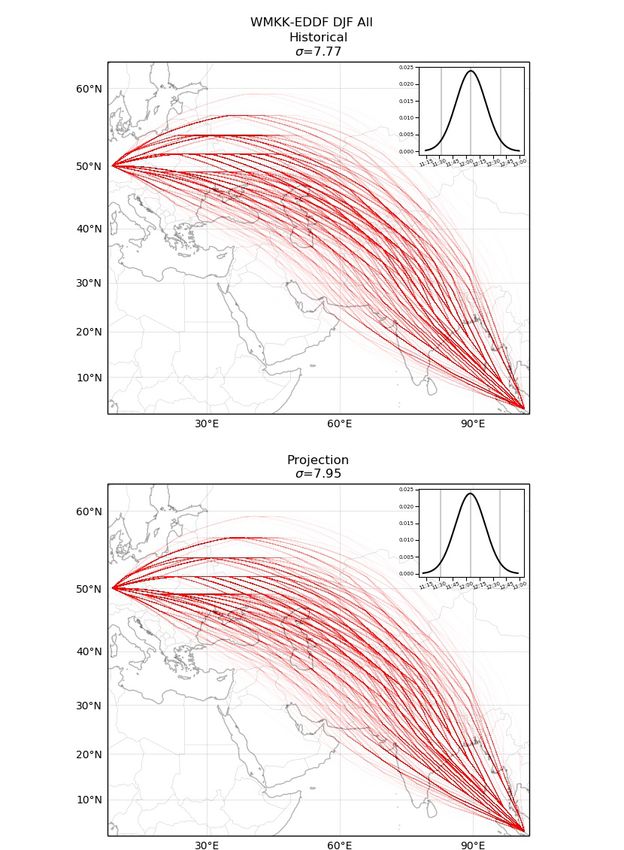
Figure 11: Spaghetti plot of optimal flights paths from EDDL to GCTS during 1991-2000 (top) and 2046-2055 (bottom) for winter (DJF). .. 31
Figure 12: Illustrations show how σ relates to the geospatial spread of trajectories.......................................................................................................... 32
Figure 13: Zonal mean (averaged over a latitude circle) zonal wind as a function of latitude for periods 1991-2000 (red) and 2046-2055
(red). .............................................................................................................................................................................................................................................................. 33
Figure 14: Same as Figure 11 but for WMKK-EDDF. ...................................................................................................................................................................... 36
Figure 15: PDFs of flight durations for KJFK-EGLL flights during 1991-2000 (top) and 2046-2055 (middle) for winter. ........................................ 38
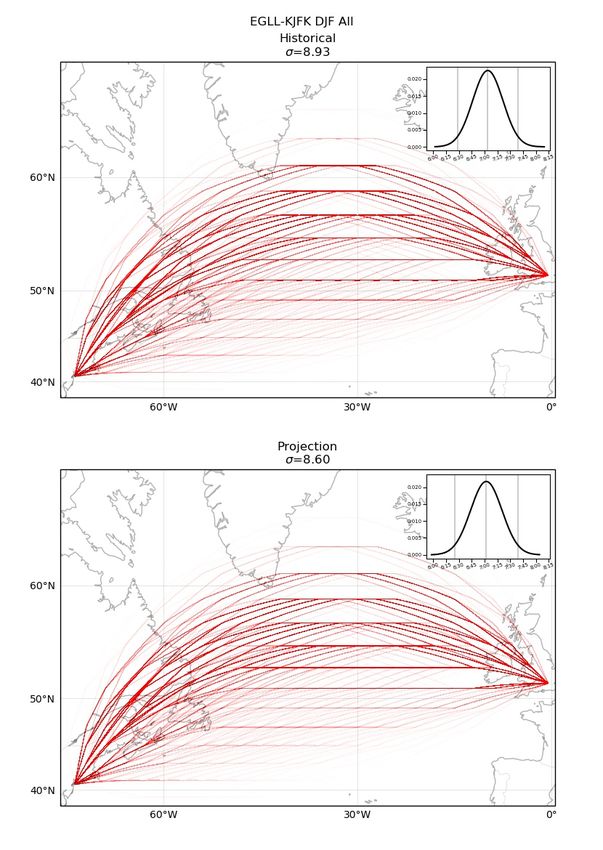
Figure 16: Same as Figure 11 but for KJFK-EGLL............................................................................................................................................................................. 39
Figure 17: Same as Figure 15 but for EGLL-KJFK. ........................................................................................................................................................................... 41
Figure 18: Same as Figure 11 but for EGLL-KJFK. ........................................................................................................................................................................... 42
Figure 19: Graphical illustration of how eastbound and westbound flights between EGLL and KJFK change in response to climate in winter
(DJF). .............................................................................................................................................................................................................................................................. 43
Figure 20: Same as Figure 19 but for summer (JJA). ..................................................................................................................................................................... 44
Figure 21: Projected operational impacts of changing wind patterns ..................................................................................................................................... 47
Figure 22: The location of the 5 airports considered in the surface winds analysis; EIDW (Dublin), LEBL (Barcelona), EHAM (Amsterdam),
LHBP (Budapest) and LTFM (Istanbul). ............................................................................................................................................................................................... 48
Figure 23: Wind roses for Dublin (EIDW) for each of the eight weather patterns. .............................................................................................................. 49
Figure 24: As for Figure 23 but for Barcelona (LEBL). .................................................................................................................................................................... 49
Figure 25: As for Figure 22 but for Budapest (LHBP). .................................................................................................................................................................... 50
Figure 26: Definitions for the reduced set of eight weather patterns in ERA5...................................................................................................................... 59
Figure 27: The occurrence of fast (left) and slow (right) flights between Europe and South Asia in winter (top) and summer (bottom)......... 61
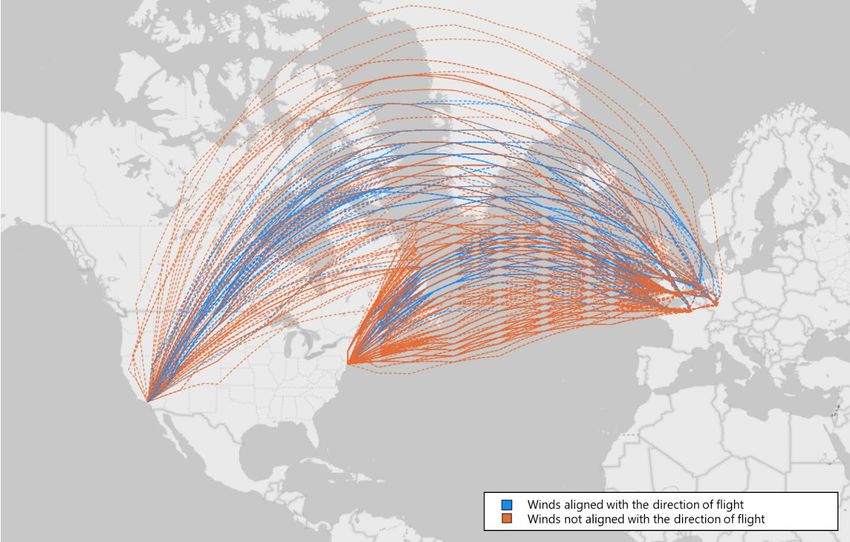
Figure 28: Europe to North America, historic trajectories on days with strong headwind (orange) and strong tailwind (blue). ......................... 62
Figure 29: North America to Europe, historic trajectories on days with strong headwind (orange) and strong tailwind (blue). ......................... 62
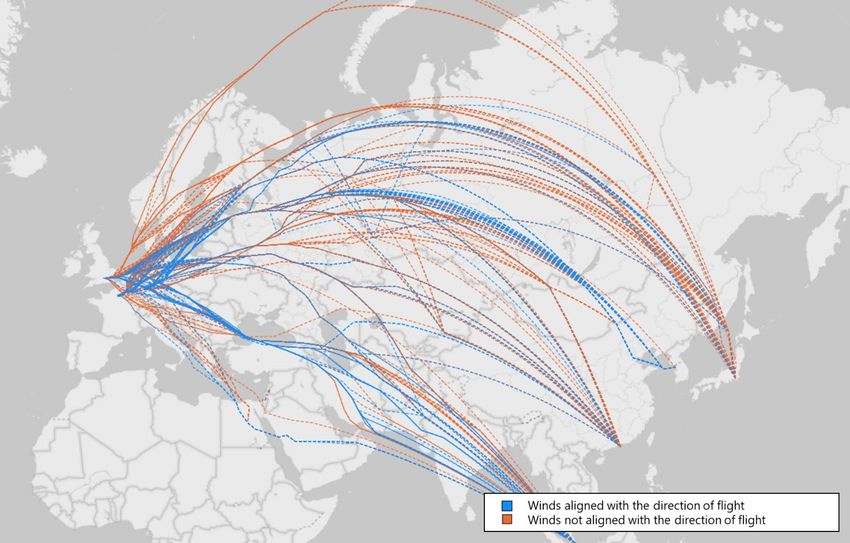
Figure 30: Europe to Asia, historic trajectories on days with strong headwind (orange) and strong tailwind (blue). .............................................. 63
Figure 31: Asia to Europe, historic trajectories on days with strong headwind (orange) and strong tailwind (blue). .............................................. 63
Figure 32: North Europe to Canaries, historic trajectories on days with strong headwind (orange) and strong tailwind (blue).......................... 64
Figure 33: Canaries to North Europe, historic trajectories on days with strong headwind (orange) and strong tailwind (blue).......................... 64
Figure 34 Distance vs flight duration, 2015-2018, Summer period. ......................................................................................................................................... 65
Figure 35 Distance vs flight duration, 2015-2018, Winter period. ............................................................................................................................................ 66
Page 3 of 75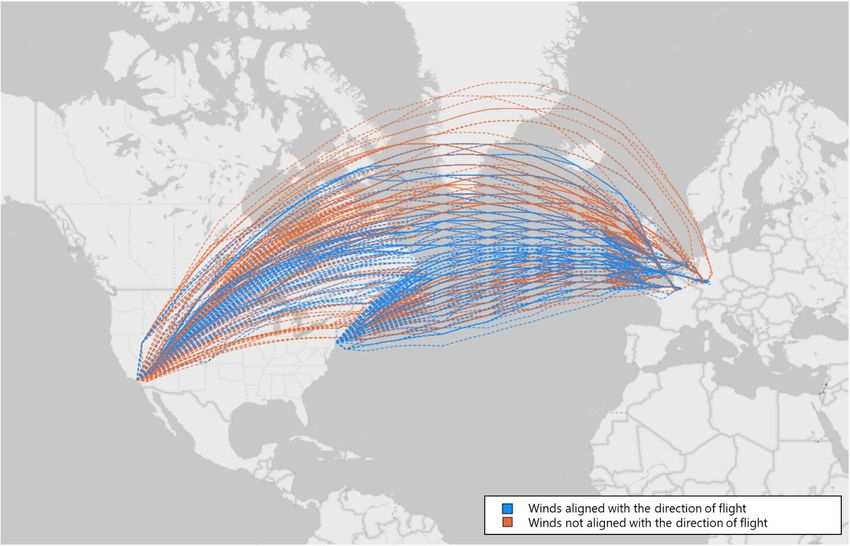
EUROCONTROL’s Climate Change Risks for European Aviation study 2021
Impact of changes in wind patterns on flight operations
Technical report

Figure 36 Ground speed vs flight duration,2015-2018, Summer period. ............................................................................................................................... 67

Figure 37 Ground speed vs flight duration, 2015-2018, winter period. .................................................................................................................................. 68

Figure 38 Fuel burn vs flight duration, 2015-2018, Summer period. ....................................................................................................................................... 69

Figure 39 Fuel burn vs flight duration, 2015-2018, Winter period. ........................................................................................................................................... 70

Figure 40: As for Figure 22 but for Istanbul (LTFM). ...................................................................................................................................................................... 72

Figure 41: As for Figure 22 but for Amsterdam (EHAM). ............................................................................................................................................................. 72

List of tables
Table 1: Airport pairs ................................................................................................................................................................................................................................ 17

Table 2: Expected duration for Canaries to North Europe flights.............................................................................................................................................. 30

Table 3: Same as Table 2 but for North Europe to Canaries flights. ......................................................................................................................................... 30

Table 4: Same as Table 2 but for Europe to Asia flights. .............................................................................................................................................................. 34

Table 5: Same as Table 2 but for Asia to Europe flights. .............................................................................................................................................................. 35

Table 6: Same as Table 2 but for North America to Europe flights. ......................................................................................................................................... 45

Table 7: Same as Table 2 but for Europe to North America flights. ......................................................................................................................................... 45

Table 8 Fuel and emissions that can be saved by taking advantage of changes to the jet stream on the traffic flows analysed ....................... 46

Table 9: A description of what the eight weather patterns mean for the flow of air and potential weather across Europe. ................................ 60

Table 10: Projected operational impacts of changing wind patterns....................................................................................................................................... 71

The designations employed and the presentation of the material on maps, videos and animations do not
imply the expression of any opinion whatsoever on the part of EUROCONTROL concerning the legal status
of any country, territory, city or area or of its authorities, or concerning the delimitation of its frontiers or
boundaries.

                                                                                                                                                                                                                                  Page 4 of 75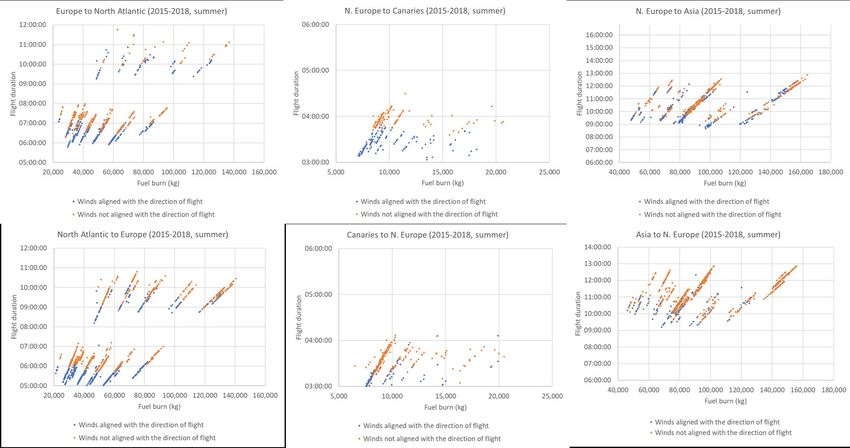
Executive Summary
EUROCONTROL’s Climate Change Risks for European Aviation study 2021
Impact of changes in wind patterns on flight operations
Technical report

Executive Summary

This work considers the effect of high-altitude winds on flights to, from and within Europe. The day-to-day
variability of high-altitude winds has a considerable influence on the time-optimal routes of aircraft (the routes
with the shortest flight times) and any projected changes in high-altitude winds could lead to shorter or
longer flight times. This has been considered in the existing literature for transatlantic flights but here an
analysis of intra-European routes is made, as well as Europe-Asia routes. This reflects the importance of these
routes for the European aviation sector. The jet stream is a high-altitude wind that has a strong influence on
flights, especially transatlantic flights. The jet stream is projected to strengthen and shift poleward under
climate change, impacting transatlantic flight routings and duration. Meanwhile, surface winds have an impact
on airport operations. This study also analyses potential changes in surface winds for a subset of European
airports.
The historical flight times are calculated for every day in the 2010-2019 period, using a state-of-the-art
trajectory prediction (TP) algorithm. These days are each categorised into one of eight weather patterns and
the relationship between fast / slow days and weather pattern calculated. Given this relationship the projected
changes in weather patterns by 2050 in climate models are used to infer potential changes in flight duration
out to 2050. The effect of weather pattern on flight duration, using historical data, is strongest in winter and
weakest in summer, reflecting changes in the jet stream strength by season. However, the robust projected
changes in weather pattern occurrence out to 2050 are seen in the summer, while little change is projected in
winter, making inference on potential changes in flight duration difficult.
In an extended analysis, the TP algorithm is applied directly to historical and future climate model data, to
calculate flight duration changes. The sample of climate models used indicates that flight durations from the
Canaries to North Europe (northbound) are projected to decrease (irrespective of season), while there is an
indication that flight durations from North Europe to the Canaries (southbound) could decrease in summer
and increase in winter. Meanwhile, flight durations are also projected to decrease for flights from Europe to
Asia, and for Asia to Europe in summer. These projected changes, where possible, are related to changes in
high-altitude winds, which are strongest over the North Atlantic. For transatlantic routes, flight durations will
decrease in both westbound and eastbound directions, for both summer and winter, which can be related to
the changes in high-altitude winds indicated in the models.
The impacts of changing winds aloft on average flight duration, ground speed and fuel burn are presented.
While there is a noticeable difference in operational performance on fast and slow days, and this difference is
likely to remain roughly the same in the future, the anticipated future changes in flight duration due to
changing wind patterns are small. Nonetheless, the combined impact of all flights operating on the traffic
flows considered in this study is notable; the overall reduction in flight times, as a result of projected changes
in high-altitude winds, is likely to bring savings of more than 55,000t of aviation fuel per year, which
corresponds to roughly 175,000t of CO2 emissions saved each year, with the greatest reduction expected on
routes to and from Asia. These figures assume current fleet mix, aircraft performance and pre-pandemic traffic
levels. Traffic, fuel burn and emissions are forecast to increase substantially from 2019 to 2050. The fuel and
emissions that can be saved by taking advantage of changes to the jet stream on the traffic flows analysed
should therefore also increase.
For surface winds there are distinct differences in the wind direction by weather pattern for a sample of five
European airports. The projected changes in weather patterns for 2050 indicate that northerly winds will
become relatively more common in the summer, while southerly winds will become relatively less common.
There is expected to be little change in surface winds at airports by 2050, beyond a potential tendency for
days with winds with a northerly direction occurring more often than they occur today.
EUROCONTROL’s Climate Change Risks for European Aviation study 2021
Impact of changes in wind patterns on flight operations
Technical report

The results from the application of the TP algorithm to the climate model output presented here contrast
somewhat with those in recent academic literature. This is likely to be due to differences in the approach and
method. The most apparent difference with other work is the use of a different TP algorithm and the extension
to considering a larger sample of climate models, but other subtle differences in the approaches may also
explain the results. From the high-altitude wind analysis, savings of a few minutes are obviously small in the
context of multi-hour flights. This is also small relative to other potential time savings, such as removing the
constraint of the current organised North Atlantic Track System (to be achieved through complete satellite-
based surveillance coverage). This work supports the need for further studies to build consensus and should
not be interpreted as a definitive answer. However, it is an important step in challenging and expanding
current understanding.
1. Introduction
EUROCONTROL’s Climate Change Risks for European Aviation study 2021
Impact of changes in wind patterns on flight operations
Technical report
Introduction
1.1 Purpose of this document
This is Annex 5 of EUROCONTROL’s Climate Change Risks for European Aviation study 2021. Annex 5
investigates the potential impact that changes in wind patterns might have on flight operations.
This document forms one of the five technical reports produced as annexes to EUROCONTROL’s Climate
Change Risks for European Aviation study 2021. The overriding aim of the study is to quantify the risks that
climate change could pose for European aviation. This ultimately aims to raise awareness amongst European
aviation stakeholders and decision makers of the level of impact these emerging climate change risks could
pose, and the need to take early action to prepare for and adapt to them.
As part of the study, the changes in high-altitude winds and surface winds were investigated for historical and
future periods. Subsequently, impacts on aviation were quantified using a set of operational metrics.
This report presents a technical summary of the methodology, results and conclusions drawn from the work.
1.2 Study drivers and Scope
This work utilises the approach from both Annex 1 "An overview of short-term weather impacts on European
aviation" and Annex 2 "Impact of changes in storm patterns and intensity on flight operations" to understand
the impacts on flight operations from changing wind patterns. Whilst an impact of transatlantic wind patterns
on flight operations is widely expected, the impact on trans-European flight routes has had less attention and
is explored in more detail in this study. As the winds aloft and at the surface often differ, the work conducted
in this annex is complemented with an assessment of predicted changes in surface winds over the coming 30
years for several major airports that serve as the point of arrival/departure for these routes. In addition to an
analysis of general trends across the years, the impacts of both the winds aloft and those at the surface are
assessed for summer and winter seasons separately to account for seasonality of weather.
1.3 Document Structure
The structure of the Annex 5 report is as follows:
Section 1: Introduction.
Section 2: Background; this section provides an overview of the impacts that both high-altitude
winds and surface winds have on aviation in Europe.
Section 3: Methodology; this section describes the approach, data, models, and assumptions used
to carry out this study.
Section 4: Impact of changes in wind patterns; this section contains the key findings from this
study, for both winds aloft and surface winds.
Section 5: Discussion;
Section 6: Conclusions;
Appendix.
30/07/2021 Page 9 of 75
Version 2.2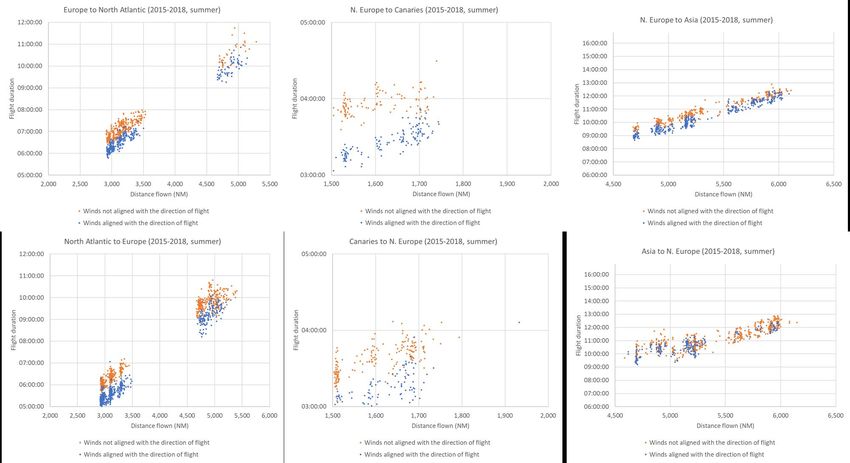
2. Background
EUROCONTROL’s Climate Change Risks for European Aviation study 2021
Impact of changes in wind patterns on flight operations
Technical report
Background
This work considers the effect of high-altitude winds on flights to, from and within Europe. The day-to-
day variability of high-altitude winds has a considerable influence on the time-optimal routes of
aircraft (the routes with the shortest flight times) and any projected changes in high-altitude winds
could lead to shorter or longer flight times. This has been considered in the existing literature for
transatlantic flights but here an analysis of intra-European routes is made, as well as Europe-Asia
routes. This reflects the importance of these routes for the European aviation sector. It is helpful to
relate changes in flight duration on these routes to the jet stream. This is a particularly prominent
feature of high-altitude winds that has a strong influence on flights, especially transatlantic flights. The
jet stream is projected to strengthen and shift poleward under climate change, presenting potential
opportunities and challenges for the European aviation sector. Meanwhile, surface winds have an
impact on airport operations. This study also analyses potential changes in surface winds for a subset
of European airports.
The effect of climate change on European aviation operations has been considered in depth throughout this
work. Annex 1 used a holistic weather pattern approach to understand the relationship between large scale
surface pressure patterns and ATFM delays across the European network, analysing what this means for
potential short-term changes in delay (out to 2025). Annex 2 looked in detail into the relationship of both
convective weather and windstorms with European ATFM delays, again considering the effect of climate
change on these storms, by a time horizon of 2050. Annex 3 considered the impact of sea-level rise on
European airports under climate change. Finally, Annex 4 looked at the relationship between climate and
European tourism and how climate change might affect destination favourability and, in turn, intra-European
aviation by the mid-21st century.
This work considers:
The effect of high-altitude winds on inter- and intra-continental flight duration, using
a state-of-the-art trajectory prediction (TP) algorithm.
An analysis of surface winds at a sample of European airports.
The TP algorithm used here determines the optimal flight track between an airport pair on a particular day,
given the high-altitude winds. Such algorithms are run operationally to determine the best flight tracks to take
on a daily basis. The tracks are then decided through a collaborative process between air navigation service
providers (ANSPs) and airlines. While the safety of aircraft movements is of paramount concern, it is also of
great importance to optimise tracks to take advantage of, or avoid, favourable or unfavourable (respectively)
high-altitude winds. This means that aircraft do not always follow the shortest distance between an airport
pair, known as the great circle route, because the aim is to shorten flight time rather than distance. For
example, a flight that could experience a strong high-altitude headwind, if following the great-circle route,
could arrive at its destination sooner by taking a longer-distance route. Likewise, a flight might benefit from
taking a different route (to the great circle route) to utilise a strong high-altitude tailwind, thus arriving at its
destination sooner.
High-altitude winds are closely associated with the jet stream. The polar jet stream (also known as the ‘eddy-
driven jet’) is a narrow region of strong winds, with the strongest regions of the jet at an altitude of 8 to 11
30/07/2021 Page 11 of 75
Version 2.2EUROCONTROL’s Climate Change Risks for European Aviation study 2021
Impact of changes in wind patterns on flight operations
Technical report
km 1. The jet stream is of particular importance for transatlantic flights since its location (usually summarised as
its latitude) and strength directly impact flights at cruising altitude between Europe and North America. It also
has an impact, albeit a reduced one, on other inter- and intra-continental flights (flights between Europe and
Asia, and within Europe). While the jet stream behaviour varies on seasonal time scales (it is strongest in the
winter) and interannual time scales, its potential changes due to projected global warming have been the
subject of much research.
Here, the jet behaviour over the North Atlantic and European region is considered because it has most
relevance to the routes used in the TP. Although the behaviour of the North Atlantic jet is complicated – it has
three preferred positions (Woollings et al., 2012) – there has been a broad consensus over the last decade for
the jet (on average) to move poleward and strengthen in response to future global warming (Harvey et al.,
2020). These shifts have been indicated by increasingly complex and high-resolution climate models over this
period (McSweeney and Bett, 2020). The latest models tend to reduce the bias (when evaluated against
reanalysis datasets) in the representation of the North Atlantic jet (Oudar et al., 2020). As a general rule, the
greater the representation of the observed behaviour of a feature of the climate system, the greater the
confidence in its projected changes. Confidence is also gained by seeing a level of agreement between
different climate models, as has generally been the case in the literature mentioned. While not all climate
models are in complete agreement as to the direction and magnitude of changes in the jet stream, the
average across multiple models (known as an ensemble) indicates that these future trends are increasingly
likely.
A simple increase in the speed of the North Atlantic jet, with all other factors remaining constant, would lead
to a shortening of the duration of eastbound flights and lengthening of the duration of westbound flights.
However, the complex variability of the jet, and its response due to climate change, means that such a
straightforward interpretation is not possible. A stronger but northward shifted jet could offer opportunities to
both utilise the jet when travelling eastbound but to avoid the jet more often when travelling westbound.
Although this is a very simplistic way of considering changes, and real-world changes are often very complex,
it shows that unpicking the impact of jet changes on flights at cruising altitude is not simple.
A key component of this work is the application of the TP algorithm to North Europe-Canaries routes. This
offers original insight into potential changes in flight duration on these popular tourism routes in the future.
However, it is more difficult to explain these changes through behaviour of the jet stream alone. This is
because the jet stream has its greatest impacts on eastward/westward travelling flights, whereas North
Europe-Canaries flights predominantly concern the northward/southward direction. That’s not to say that
changes in the jet stream will not have an impact on these routes. The jet stream is capable of significant
northward/southward departures, known as ‘meandering’. There is some suggestion in the literature that this
meandering is becoming more pronounced as a result of enhanced warming over the poles (Francis and
Vavrus, 2012) but more recent research has thrown doubt on this and not found causal evidence (Blackport
and Screen, 2020). Therefore, it is difficult to predict how a climate response might impact flight times here.
Certainly, a meandering jet can have a significant impact on northward/southward flights on a given day, but it
is less obvious how changes in the jet averaged over multiple years will impact these flights.
At the surface, wind speed and direction are of high importance for airport operations. Wind speeds
exceeding a certain threshold can lead to delays both en-route and at the airport. However, the same wind
speed can have different impacts depending on its direction. When the wind is perpendicular (or close to
1
https://www.metoffice.gov.uk/weather/learn-about/weather/types-of-weather/wind/what-is-the-jet-stream
30/07/2021 Page 12 of 75
Version 2.2EUROCONTROL’s Climate Change Risks for European Aviation study 2021 Impact of changes in wind patterns on flight operations Technical report perpendicular) to the runway centre line, such that crosswind landings are required, impacts are greatest. Depending on the crosswind component, aircraft performance, runway condition, airline operating procedures and pilot experience, some aircraft may have to divert to an alternate aerodrome with more favourable wind conditions. This scenario is typical for small and medium-sized single runway airports with a fleet mix of smaller aircraft more susceptible to higher crosswinds. For future changes in surface wind – direction and speed – there is no indication that either will fall outside the range seen in the historical period, as covered in Annex 2 for wind speed at a number of European airports. For example, Ruosteenoja et al. (2019) found that there was little change in average and extreme wind across the North Atlantic and European area in the future due to climate change. Some studies indicate some changes over certain regions of Europe, but the sign of changes (positive or negative) appears to be dependent on the models and approach considered. Generally, such a lack of scientific consensus indicates that the models are not accurate enough in the representation of surface wind, or (perhaps more likely) that no change will be seen outside of the range of historical observed variability. In other words, the conditions (both the average and variability) that exist now will persist into the future. This is consistent with the findings from the Met Office for the United Kingdom alone. The UK Climate Projections 2018 (UKCP18) indicate that changes in wind speed are dominated by natural variability and little long-term trend is evident (Lowe et al., 2018). In other words, the uncertainty in the projections is considerable and the range of wind projections span zero change. In the absence of literature suggesting otherwise, there is unlikely to be a strong signal in either wind direction or speed across Europe in the latest climate models. In the remainder of this report, both high-altitude and surface winds are related to weather patterns, with some comment on what this means for wind conditions in the future, based on the projected weather pattern trends covered in Annex 1 "An overview of short-term weather impacts on European aviation" and Annex 2 "Impact of changes in storm patterns and intensity on flight operations ". For the future (relative to the historical period) changes in high-altitude winds and, in turn, the changes in flight duration, the state-of-the- art TP algorithm is run directly on climate model data to complement the weather pattern analysis. Finally, the changes in flight duration indicated by the TP algorithm are combined with historical flight operations records to estimate potential impacts on flights operating between selected city pairs. 30/07/2021 Page 13 of 75 Version 2.2
3. Methodology
EUROCONTROL’s Climate Change Risks for European Aviation study 2021
Impact of changes in wind patterns on flight operations
Technical report

     Methodology

    3.1 Approach
The TP algorithm used in this study uses a node-based technique, rather than the traditional method of
other studies. This is shown to better represent the actual route flown for two individual case studies.
This TP algorithm is applied to both historical observed data, and historical and future climate model
data to understand past and future patterns in flight duration. The historical observed flight times are
classified into one of eight weather patterns, with future changes in flight times inferred through the
projected changes in the weather patterns. Meanwhile, the future changes in flight times are also
calculated directly using the output from a set of eight climate models. Finally, wind roses are plotted
for a sample of European airports and linked to the eight weather patterns, with comment again on
what the projected changes in weather patterns mean for future changes in wind direction.
There has been growing interest in the impact of climate change on aviation over the last decade. While the
general consensus is that there will be changes to high-altitude winds in response to projected future
warming, it is not immediately obvious how these changes translate into aspects like flight duration, fuel burn
and optimal flight paths which concern the aviation industry the most.
The topic has been explored in studies such as Williams (2016) and Irvine et al. (2016), with a focus on
transatlantic flights. Both studies report faster eastbound flights and slower westbound flights as a result of a
stronger jet stream in their respective climate projection experiments. These studies adopt the so-called
‘shooting method’ of Kim et al. (2015), as described in Sawyer (1950) and Lunnon and Marklow (1992),
hereafter referred to as the traditional method. Given an initial heading, the algorithm would iteratively avoid
the strongest head winds or utilise the strongest tail winds at each timestep until the destination is reached or
the maximum number of timesteps is exceeded and no solution is found. The process is repeated with
different initial headings and the one with shortest flight duration is considered as the ‘time-optimal’ path.
In contrast to the traditional method, node-based pathfinding techniques like Dijkstra (1959) guarantee a true
optimal solution. Given a network of nodes, the total cost of travelling is iteratively calculated for all possible
combinations of paths connecting the nodes. Figure 1 shows a simple example of how the optimal path from
node A to node F can be determined. For illustrative purposes, three paths are identified, namely ABCF, ADCF
and ADEF. The total ‘costs’ (where costs here represent time) of travelling down these paths is worked out to
be 3+3+2=8, 3+1+2=6 and 3+2+2=7, respectively, and in this case, ADCF is the optimal path.

Figure 1: Schematic showing the basics of the node-based pathfinding technique. The numbers represent the costs of
travelling from one node to another. The arrows show all possible paths between the origin node A and destination F. The
solution is shown in red.

Figure 2 and Figure 3 show examples where the traditional method fails to return a true time-optimal path in
the context of commercial flight planning, using transatlantic flights as examples. It is observed that the
optimal flight paths (blue), determined by the node-based TP technique, resemble those of the actual flown

30/07/2021                                                                                                     Page 15 of 75
Version 2.2
EUROCONTROL’s Climate Change Risks for European Aviation study 2021 Impact of changes in wind patterns on flight operations Technical report paths, with comparable flight durations to the actual. In contrast, the traditional method yields completely different flight paths (red) that take 35-45 minutes extra to fly in the case studies shown. Figure 2: Case study highlighting the difference in time-optimal routes predicted by the traditional method (red) and node- based TP technique (blue). Data shown is for a EGLL to CYYZ flight on 8th December 2014. The actual flight path flown (adapted from FlightAware) is shown on the right with a duration of 7 hours 51 minutes. Figure 3: Same as Figure 2 but for a EGLL to KORD flight. The actual flight duration was 8 hours 42 minutes. The cost function in the TP algorithm is configured to provide time-optimal solutions so that the results are comparable with Williams (2016) and Irvine et al. (2016). For simplicity, we assume a cruise altitude at 250 hPa (corresponding to typical aircraft cruise altitudes of around 34,000 ft), with no ascend / descend, and a constant airspeed of 0.82 Mach for all TP runs in this study. Note that while these assumptions imply an underestimate of flight durations, the error is systematic across the two periods and therefore need not be corrected as in Cheung (2018). For consistency, all climate models are processed to be on the same grid with TP nodes assigned to the grid points of the resulting grid. The resolution of the TP grid is determined by the relative coordinates of the origin and destination following Cheung (2018), which is configured to ensure there are at least 25 grid points between the airport pair in either the longitudinal or latitudinal direction. It also gives the best balance between optimality and computing time as recommended by Cheung (2018). While the majority of literature to date has considered the influence of weather and climate on transatlantic routes (Europe-North America), other routes are considered here: transcontinental (Europe-Asia) and intra- continental (North Europe-Canaries). The airport pairs on which the TP is run are given in Table 1. Horizontal wind data (broken down into the eastward, also known as zonal, and northward, also known as meridional, components of wind), taken from the reanalysis and climate models described in Section 3.2, are used as inputs to the TP algorithm. Analyses are split into winter (December-January-February; DJF) and summer (June-July-August; JJA). 30/07/2021 Page 16 of 75 Version 2.2
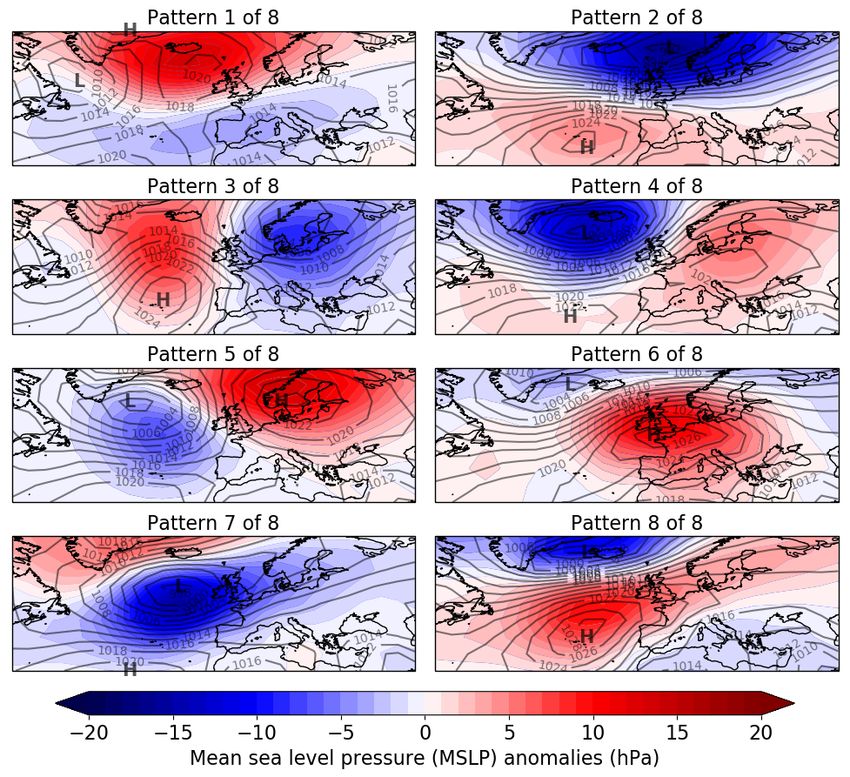
EUROCONTROL’s Climate Change Risks for European Aviation study 2021
Impact of changes in wind patterns on flight operations
Technical report

EDDF - Frankfurt am Main International Airport
EDDL - Düsseldorf International Airport
EGCC - Manchester Airport
EGKK - London Gatwick Airport
EGLL - London Heathrow Airport
EHAM - Amsterdam Airport Schiphol
GCLP - Gran Canaria Airport
GCTS - Tenerife South Airport
KJFK - John F Kennedy International Airport
KLAX - Los Angeles International Airport
LFPG - Charles de Gaulle International Airport
RJTT - Tokyo Haneda International Airport
RKSI - Incheon International Airport
VHHH - Chek Lap Kok International Airport
WMKK - Kuala Lumpur International Airport
WSSS - Singapore Changi Airport

Table 1: Airport pairs

Firstly, the TP is run on the historical period, here defined as 2010-2019. This period is chosen to be consistent
with Annex 1 "An overview of short-term weather impacts on European aviation" and Annex 2 "Impact of
changes in storm patterns and intensity on flight operations" since it is the period over which the most
detailed ATFM delay information is available. This helps to identify a set of representative days when the wind
direction and strength were more favourable with the direction of the air traffic flow, and a set of
representative days when the wind direction was less favourable. Here, the optimal flight paths / times yielded
by the TP approach are intended to serve as a metric for discriminating between advantageous or
disadvantageous winds aloft, with longer duration routes indicative of a prevalence of head winds and shorter
duration routes indicative of a prevalence of tail winds.
These representative days will, in turn, be matched to the weather patterns to which the European component
of their journey is associated. The weather patterns (Figure 26 and Table 9 in the Appendix) were trained on
European mean sea level pressure (MSLP) data, using a machine learning approach to calculate the dominant
patterns, as detailed in Annex 1 "An overview of short-term weather impacts on European aviation". The

30/07/2021                                                                                            Page 17 of 75
Version 2.2
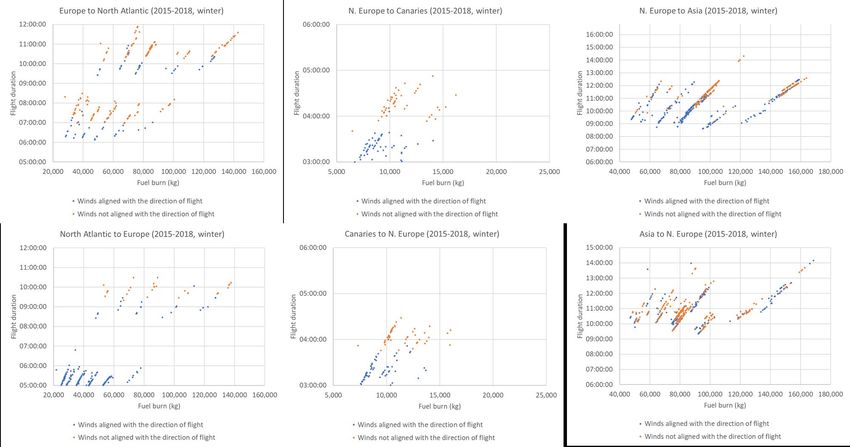
EUROCONTROL’s Climate Change Risks for European Aviation study 2021
Impact of changes in wind patterns on flight operations
Technical report

weather patterns, as presented here over the North Atlantic-European area, will also be correlated to patterns
over the North American and Asian continents, but the pattern here will be less well defined. For example,
weather pattern 2, which represents the positive phase of the North Atlantic Oscillation (NAO), is often
associated with lower-than-normal pressure over the North Pacific-Arctic, as well as the North Atlantic-Arctic
shown in Figure 26. In this situation, low pressure anomalies exist over most of the Arctic region and the polar
jet stream is strengthened around much of the Northern Hemisphere. This means that weather pattern 2
would be expected to have some impact on Europe-Asia flights, but since the classification into weather
patterns is based on the North Atlantic-European area only, the influence of the jet stream is guaranteed to be
stronger for flights in this region. The projected changes in weather patterns out to 2050 will then be
considered with an assessment of what this might mean for changes in flight times, given the relationship
between weather patterns and flight times in the historical period.
However, to complement the historical TP / network performance impacts analysis, the TP algorithm is
additionally run for a future time period (centred on 2050) on climate model data directly. This allows
presentation of a histogram of changes in flight time for a chosen flight-level, as well as associated spatial
plots to visualise any potential future changes in predicted average trajectory. Any trends that emerge from
this analysis are linked to the jet stream by considering the related zonal mean zonal wind at high-altitude.
Changes in these high-altitude winds are related to the literature on projected changes in high-altitude winds
/ the jet stream, covered in Section 2.
For the surface wind analysis at five European airports, wind roses are plotted by the historical weather pattern
under which they occurred. This essentially gives an average distribution of winds (or a climatology) for each
weather pattern. Given that the direction will not change noticeably by season, for a given weather pattern,
this analysis considers all seasons together, rather than individual seasonal analyses. This allows comment on
which wind roses, at each airport, may be expected to become more / less common, based on their relation to
the weather pattern trends (as identified in previous work and used in the high-altitude wind analysis). The
proposed framing (in terms of past observations) is preferred to direct application of climate model output,
due to the fact that wind is often poorly represented in models and there is little indication for a strong
change in wind speed or direction in response to future climate change (Section 2). Therefore, an analysis on
changes in wind direction, using the projected changes in weather patterns, has equal merit. However, the
projected changes in occurrence of weather patterns will be quantified.

   3.1.1 Link to historic operational data

In order to link the methodology described in previous sections to historic data for the purpose of
quantification of operational impacts, a sample of real flight trajectories is extracted for all city pair
combinations in this study using EUROCONTROL’s R&D Archive. The extraction is done for a sample of
representative days across the 2015-2018 period when the wind direction was aligned with the direction of the
traffic flow and when it was against it (see Figure 28 to Figure 33 in Appendix). Sampling of trajectories is done
for summer and winter seasons separately. Historic trajectory data, as well as associated flight performance
records are used to quantify differences in flight performance depending on alignment of winds with flight
trajectory. This represents assessment of current impacts of changing wind patterns. In order to quantify
impacts of projected future changes in wind speed and direction, the change in flight duration calculated by
the trajectory prediction algorithm is used in combination with historic records to estimate potential future
impacts. As the ATM system (and aviation in general) in 2050 is expected to be substantially different to the
current system, it is not possible to judge how future changes in technology and operating procedures might
influence flight duration. Therefore, for the purpose of quantification of future impacts of winds aloft on flight
performance, we have assumed the parameters of the existing aviation system today.

30/07/2021                                                                                            Page 18 of 75
Version 2.2
EUROCONTROL’s Climate Change Risks for European Aviation study 2021
Impact of changes in wind patterns on flight operations
Technical report

    3.2 Data sources and models
For the historical analysis, on the period 2010-2019, this work takes daily horizontal wind at a pressure level of
250 hPa (corresponding to typical aircraft cruise altitudes of around 34,000 ft) from the fifth generation of the
European Centre for Medium-Range Weather Forecasts (ECMWF) atmospheric reanalyses of the global climate
(ERA5). ERA5 spatial coverage is global. Each day is then run through the TP algorithm.
The weather patterns calculated in Annex 1 "An overview of short-term weather impacts on European
aviation" are used again in the present work, using the ERA5 reanalysis to cover the historical period and the
global climate model projections from UKCP18 to determine future changes. The global climate model
simulations include two ensembles, the perturbed physics ensemble (PPE) (referred to as PPE-15) and the
Coupled Model Intercomparison Project 5 (CMIP5 2) ensemble (referred to as CMIP-13; the 13 indicates the
number of models that make up the ensemble).
The application of the TP algorithm directly to climate model data uses eight models from the CMIP-13
ensemble. Using daily output from these eight models (ACCESS1-3, CMCC-CM, CNRM-CM5, CanESM2, GFDL-
ESM2G, IPSL-CM5A-MR, MPI-ESM-MR, MRI-CGCM3), again using the 250 hPa pressure level, the TP system
described in Cheung (2018) is run over both historical and future periods, namely 1991-2000 (historical;
centred on 1995) and 2046-2055 (future; centred on 2050), producing daily output for each of the airport pairs
in Table 1. These models were run under the RCP8.5 emissions scenario, which represents a high-end no-
policy emissions scenario (or a world where the warming impact of GHG emissions is higher than the current
best guess). The increase in global temperature associated with RCP8.5 differs more from that associated with
lower emissions scenarios, such as RCP4.5, after 2050, and differences in climate impacts for each emissions
scenario are smaller in 2050. However, using the RCP8.5 scenario still allows for simulation of the maximum
likely changes to the jet stream by the mid-21st century. More detail on these models from the CMIP-13
ensemble can be found in Lowe et al. (2018).
For surface winds, the wind direction is calculated from the ERA5 reanalysis, with the surface horizontal wind
components extracted from grid cells in which airports are located. The wind direction is then calculated as a
daily average from the hourly values in ERA5. Again, this is calculated for 2010-2019.
A high-level simplification of the approach is provided in Figure 4 below, and described in the following
sections.

Figure 4: Simplified high-level diagram of the approach taken

2
  CMIP5 was a major coordinated international modelling effort using (at the time) the latest global climate
models and contributing to the Intergovernmental Panel on Climate Change (IPCC) Fifth Assessment Report
(AR5).
30/07/2021                                                                                            Page 19 of 75
Version 2.2
3.3 Assumptions The TP algorithm was run on 10-year periods for the historical and future periods, due to the computational expense in running this algorithm. Usually, 20-30-year periods are used to represent both historical and future periods. Instead, using multiple climate models was considered a better use of computing resource to ensure the results were robust (not just the response from one climate model, which could fall at the extreme end of responses across a larger sample of climate models). There could be some impact from internal variability (natural climate variability) over 10-year time periods. For example, if the NAO, a mode of surface pressure variability, was in a particular phase in a climate model over either the historical 10-year period or the future 10-year period, it could skew the average towards shorter or longer flight times. The effect of the NAO phase on transatlantic flight times was shown in the work of Kim et al. (2020). Usually 20-30-year averages are taken to represent the average climate but that was not feasible here due to the computational constraints. Another way of reducing the influence of internal variability is by using multiple climate models. This is achieved here by considering an ensemble of eight models. This is considered favourable (relative to using 30-year periods from one or two models), because it also tests the uncertainty across different models. There are known to be uncertainties relating to the design of the model, which it is prudent to test, and this should help to make this analysis as robust as possible. The TP algorithm shows the optimum routes determined by the meteorology, regardless of actual operational constraints. A key constraint to present-day operations is the limited tracking of flights, particularly in the mid- North Atlantic. However, this will become less of an issue in future years as full satellite surveillance coverage is achieved. This means that flights will be able to take more optimum routes, with more flexibility in taking advantage of the high-altitude winds. A study by Wells et al. (2021) showed that removing the constraint of the current organised track system (achieved through complete satellite coverage) and allowing aircraft to follow optimised routes more closely, could allow air distance savings of up to around 16% when flying east. The distance savings, and in turn the associated time savings (which ultimately determines fuel burn), from removing these operational constraints are probably greater than those achieved through potential changes in the strength of the jet stream and high-altitude winds. Further, routing flights more efficiently, independent of changes in high-altitude winds, could achieve time savings in the short-term, whereas any change to high- altitude winds due to the effect of climate change may not be realised for several decades to come. This application of the TP algorithm on direct climate model output (CMIP5) only considers the year 2050, so it is not possible to comment on the time horizons on which these changes emerge (i.e., whether they are apparent in, say 2030) or whether they become more pronounced towards the end of the 21st century. It is expected that changes are gradual in the first half of the 21st century but could change beyond 2050. There could be non-linearities in the climate system which mean the jet response to warming actually changes under a greater level of warming (Manzini et al., 2018). This is because of projected decreases in Arctic sea ice due to global warming. Arctic sea ice can have a considerable impact on the jet through influencing the temperature gradient between the equator and the pole and also through a causal effect on the polar vortex, which can feedback on the jet stream. This shows that the influence on the jet is not entirely straightforward.
You can also read