Community attitudes towards gene technology - PP - Date: OGTR
←
→
Page content transcription
If your browser does not render page correctly, please read the page content below
PP

Community attitudes towards
gene technology

 Date:           July 2019
 Prepared for:   Office of the Gene Technology Regulator
 Consultants:    Craig Cormick, Rob Mercer
 Reference:      J2853

                                            1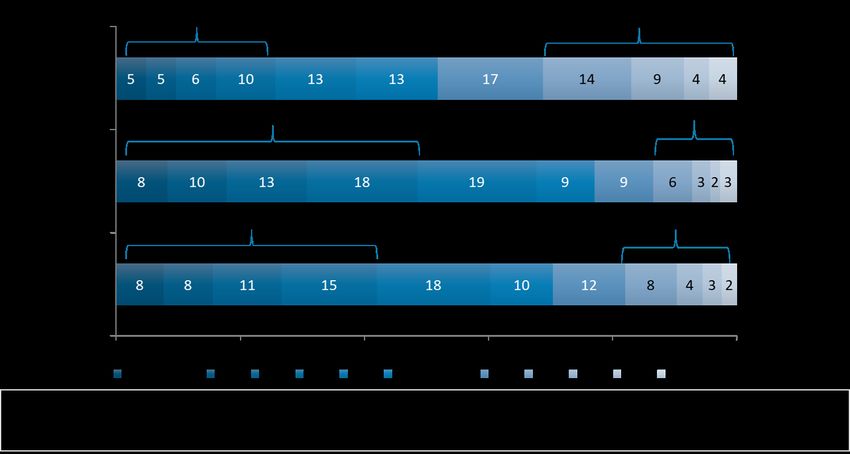
SYDNEY                   LONDON                    CANBERRA
Level 1, 420 Elizabeth   Suite 1,                  103/11 Trevillian Quay,
Street, Surry Hills      7 Ridgmount Street        Kingston
NSW, 2010 Australia      WC1 E7AE United Kingdom   ACT, 2604 Australia

+61 (2) 9283 2233        +44 (0) 203 355 4454      +61 (2) 6231 0350
Contents
CONTENTS ................................................................................................................................... 3
1.    EXECUTIVE SUMMARY .......................................................................................................... 7
2.    BACKGROUND, OBJECTIVES AND METHODOLOGY ................................................................. 9
      Objectives ............................................................................................................................ 9
      Methodology ...................................................................................................................... 10
3.    SUMMARY OF FINDINGS ..................................................................................................... 13
      Awareness and understanding of biotechnologies ...................................................................................... 13
      Attitudes by states and territories ............................................................................................................... 14
      Beliefs about GM foods ................................................................................................................................ 14
      Awareness of organisations responsible for regulation of GM .................................................................... 15
      Trust in what organisations say about gene technology.............................................................................. 15
      Attitudes and beliefs towards government involvement ............................................................................ 16
      Sources of information and trust in them .................................................................................................... 16
      Values based segmentation ......................................................................................................................... 17
4.    LITERATURE REVIEW ........................................................................................................... 18
5.    KEY FINDINGS ..................................................................................................................... 20
      Awareness and understanding of biotechnologies ............................................................... 20
      Perceptions of whether GM technologies will improve our way of life ....................................................... 22
      Levels of support for GMOs and gene technology ....................................................................................... 23
      Perceptions towards science and technology .............................................................................................. 27
      Attitudes and beliefs ........................................................................................................... 29
      Confidence in food and the influence of GM on food consumption ........................................................... 29
      Genetic modification in Australia ................................................................................................................. 36
      Modifying genes of plants to produce food ................................................................................................. 37
      GM in food production................................................................................................................................. 37
      GM crops in your state or territory .............................................................................................................. 41
      Awareness of GM crops grown in states and territories.............................................................................. 43
      Support for growing GM crops in your state/territory ................................................................................ 46
      Public opinion on using GM technology to produce food............................................................................ 48
      Reasons for being in favour of or against gene technology ......................................................................... 49
      The value placed on the different objectives for GM plants for food.......................................................... 52
      Attitudes to GM for industrial or therapeutic uses ...................................................................................... 54
      Information and trust ......................................................................................................... 55
      What people want to know to be assured GM crops and food are safe ..................................................... 55

                                                                              3
Awareness of organisations responsible for regulation of GM .................................................................... 57
Trust in what organisations say about gene technology.............................................................................. 59
Attitudes and beliefs towards government involvement ............................................................................ 61
Sources of information and trust in them .................................................................................................... 62
Attitudes towards information and ideas .................................................................................................... 66
Main driver underpinning decisions about GM foods and crops ................................................................. 68
Support for GM sciences and technologies ................................................................................................. 68
Value based segmentation .................................................................................................. 69
6. CONCLUSIONS .................................................................................................................... 83
7. APPENDIX 1 – SAMPLE PROFILE........................................................................................... 85
8. REFERENCES ....................................................................................................................... 87
4List of figures
Figure 1: Awareness and understanding of biotechnologies................................................................ 20
Figure 2: Perceptions of whether technologies will improve our way of life ....................................... 22
Figure 3: Support for gene technology in food and crops .................................................................... 23
Figure 4: Means - Support for gene technology in food and crops by gender ..................................... 25
Figure 5: Levels of support for GMOs and gene technology ................................................................ 26
Figure 6: Levels of support for other GMOs and gene technology....................................................... 27
Figure 7: Attitudes towards science and technology............................................................................ 28
Figure 8: Attitudes towards science and technology............................................................................ 29
Figure 9: Willingness to eat GM food ................................................................................................... 31
Figure 10: Willingness to eat GM food by age ...................................................................................... 32
Figure 11: Willingness to eat GM food by gender ................................................................................ 33
Figure 12: Willingness to eat products from GM animals and animals fed GM food - by state and
territory ................................................................................................................................................. 34
Figure 13: Confidence in GM foods - by state and territory ................................................................. 34
Figure 14: Confidence in GM food and organic food - by state and territory ...................................... 35
Figure 15: Confidence in food grown with pesticides and preservatives - by state and territory ....... 35
Figure 16: Attitudes towards genetic modification in Australia ........................................................... 36
Figure 17: How acceptable it is to modify the genes of plants to produce food.................................. 37
Figure 18: Attitudes to GM in food production .................................................................................... 38
Figure 19: Historic changes in attitudes towards different types of genetic modification .................. 39
Figure 20: Attitudes to different types of modification by age ............................................................ 40
Figure 21: Attitudes to different types of modification by gender....................................................... 41
Figure 22: Attitudes to different types of modification by state/territory ........................................... 42
Figure 23: Awareness of GM crops being grown in respondents' states - by state/territory .............. 44
Figure 24: Awareness of GM crops grown in the state/territory - state/territory comparison ........... 45
Figure 25: Awareness of specific GM crops grown in their state/territory .......................................... 45
Figure 26: In favour of growing GM crops in their state/territory - comparison by state/territory .... 47
Figure 27: Whether those opposed would be in favour if they knew the following existed ............... 48
Figure 28: Attitudinal category in using GM technology to produce food ........................................... 49
Figure 29: Why people are in favour of GM foods ............................................................................... 51
Figure 30: Why people are opposed to GM foods................................................................................ 51
Figure 31: Attitudes to GM traits in plants ........................................................................................... 53
Figure 32: Attitudes to genetic modification for industrial or therapeutic uses .................................. 55
Figure 33: What people want to hear from the Regulator ................................................................... 56
Figure 34: What people want to know from the Regulator.................................................................. 57
Figure 35: Organisation/s they believe are responsible for the regulation of genetic modification in
Australia ................................................................................................................................................ 57
Figure 36: Awareness of organisations ................................................................................................. 58
5Figure 37: Trust in what certain organisations say about GM and gene technology ........................... 60
Figure 38: Awareness and trust in OGTR over 20 years ....................................................................... 61
Figure 39: Attitudes and belief in government rules and regulation ................................................... 62
Figure 40: Sources of information ........................................................................................................ 63
Figure 41: Trust in sources of information............................................................................................ 64
Figure 42: Sources of information - by attitudes to GM food segments .............................................. 65
Figure 43: Attitudes and behaviours towards sources of information ................................................. 66
Figure 44: Sources of information used - by attitudes towards information ....................................... 67
Figure 45: Acceptance of GM technologies - by attitudes towards information ................................. 67
Figure 46: Attitudes towards how decisions about GM foods and crops should be made .................. 68
Figure 47: Support for biotechnology sciences and technologies ........................................................ 69
Figure 48: Awareness of terminology and understanding - by values segments ................................. 75
Figure 49: How technologies will impact our way of life - by values segments ................................... 76
Figure 50: Support for uses of genetic modification or gene technology - by values segments .......... 77
Figure 51: Perceptions towards scientific technology - by value segments ......................................... 78
Figure 52: Awareness of organisations responsible for regulation of GM - by values segments......... 79
Figure 53: Familiarity with organisations responsible for gene technology in Australia - by values
segments ............................................................................................................................................... 79
Figure 54: Trust in what organisations say about gene technology - by values segments................... 81
Figure 55: GM rules and regulation and whether they are rigorous and complied with - by value
segments ............................................................................................................................................... 82
List of tables
Table 1: Awareness of GMOs ................................................................................................................ 21
Table 2: Definitions provided in the survey .......................................................................................... 21
Table 3: Support for GM food - analysis over time ............................................................................... 24
Table 4: Support for GM use generally - by age ................................................................................... 25
Table 5: Ranking of willingness to eat GM foods compared with those produced using pesticides and
preservatives ......................................................................................................................................... 30
Table 6: Ranking of lack of willingness to eat GM foods compared with those produced using
pesticides and preservatives ................................................................................................................. 30
Table 7: Ranking of willingness to eat GM in foods between 2012, 2015, 2017 and 2019 .................. 32
Table 8: Whether the objectives of genetically modifying plants to produce food is valuable ........... 54
Table 9: Comparison between who was thought responsible for regulation and prior awareness .... 59
Table 10: Sources of information and trust in the source .................................................................... 65
61. Executive summary
The overall finding of the 2019 survey is that attitudes to genetically modified organisms (GMOs)
have moved more towards neutral middle positions, as well as an increase in those who aren’t sure
or don’t know, and some reduction in those with stronger views.
Those most strongly opposed to GMOs, however, have stayed constant at about 13% of the
population across different measures (Figure 3), and these respondents stood out as having more
extreme attitudes to food and agriculture than any other group, as well as low overall trust.
We can see a trend emerge whereby the proportion of those who are less supportive of GMOs has
declined since 2015, and the proportion of respondents who are neutral has increased significantly
(Figure 3). Support for GMOs is more varied and cannot be given just one figure because it is so
often conditional, based on regulation and safety being ensured, and the type of modification and its
purpose. For example, there is a wide difference in support for GMOs in medical (58%), industrial
(53%), and food and crops (35%), (Figure 5).
The support for growing GM crops overall was similar to previous years, with 36% in favour and 32%
opposed, however we have seen a gradual significant increase in the proportion of ‘don’t know’
responses from 26% in 2015 to 32% in 2019. The data also indicates a reduction in those who are
opposed to growing GM crops in their state or territory, from 36% in 2017 to 32% in 2019, with
more now in favour than opposed (Figure 26).
Of note, the don’t know or unsure ratings were high across almost all questions.
Awareness of the Office of the Gene Technology Regulator (OGTR) as an organisation remains on par
with previous years at 13% (Figure 36), there was still a high level of trust in the organisation relative
to other regulators surveyed. The findings were clear about the issues that most people want to
hear from the regulator—health effects, transparency, proper testing and evidence of no long-term
impacts on people or the environment.
Responses on sources of information indicated that television remains very popular, ranking as the
2nd, 3rd and 4th most likely source of information (Figure 40). The number one source stated was a
general Google search. However, there has been a general drop in key sources of media being cited
as sources for information on gene technology (documentaries, news stories, current affairs
specifically).
Looking at trust in information sources saw TV documentaries and friends and family ranked the
highest, followed by specific news website, Wikipedia and current affairs shows. Social media and
Facebook rated very poorly for both information and trust.
7Other key findings included:
• Knowledge about what foods in Australia were genetically modified is generally poor.
• Over time the trend is that those opposed to GM foods and to modifying the genes of plants
to produce food is diminishing (Table 3 and Figure 17).
• As has repeatedly been shown in previous studies, people have different attitudes towards
different genetic modifications, and there is more support for modifications that are
perceived to be less radical (Figure 18).
• Awareness of whether GM crops were grown in a respondent’s state was generally not high,
varying between 13% and 35% correctly stating whether or not GM crops were grown in
their state (Figure 24).
• Those organisations thought to be regulators of GM included the Department of Agriculture
(40%), CSIRO (38%), Food Standards Australia New Zealand (32%), the Department of Health
(31%), the Office of the Gene Technology Regulator (27%), state governments (27%), the
National Health and Medical Research Council (23%), the Therapeutic Goods Administration
(20%), and the Australian Pesticides and Veterinary Medicines Authority (18%) (Figure 35).
• When asked about the rules and regulations relating to GM and whether they were
sufficiently rigorous and complied with, there was majority agreement but also a significant
number of don’t know responses (25% don’t know for both rules and regulations being
sufficiently rigorous, and for being complied with) (Figure 39).
• Most respondents (62%) felt that biotechnology would improve our way of life in the future,
while only 45% felt that GMOs would improve our way of life in the future (Figure 2).
• Although only 41% of people had any awareness or knowledge of synthetic biology, there
was moderate to strong support for it (once given a definition) with 48% of respondents
stating they felt it would improve our way of life in the future (which was, however, a
significant drop from the strong 2017 response of 62%) (Figure 2).
• Significantly more than half the respondents (61%) stated they were aware of gene editing
and 52% thought it might improve our way of life in the future, but 19% thought it might
make things worse. Gene editing received quite high acceptance (36%) relative to other
techniques, when asked about making a small change to an existing gene within a plant, as
is done in gene editing, despite a drop from the 2017 level of 42% acceptance (Figure 18).
82. Background, objectives and methodology
The Gene Technology Regulator (the Regulator) administers the Gene Technology Act 2000 to
protect the health and safety of people and the environment by identifying risks posed by or as a
result of gene technology, and managing those risks by regulating certain dealings with genetically
modified organisms (GMOs).
Gene technology is a form of biotechnology. Biotechnology describes the use of biology in agriculture,
environmental concerns, and pharmaceutical development. It also refers to the production of GMOs
and the manufacture of products from them. Much of the newer activity in biotechnology involves
directly modifying the genetic material of living things, referred to as genetic modification,
recombinant DNA technology, or genetic engineering. Other types of biotechnology include using
enzymes and bacteria in applications such as waste management, industrial and food production, and
remediation of contaminated land. The largest sub-sector of biotechnology companies in Australia is
involved in human therapeutics, including both pharmaceutical development and medical procedures.
Other major sub-sectors are agricultural applications, and diagnostics.
Community attitudes are crucial to the development of the Australian biotechnology sector. If
Australians are not in favour of a particular technological application, research and development in
this area will be constrained and a host of potential benefits in fields ranging from medicine to
textiles are likely to be missed, resulting in a lost opportunity for individuals, industry and the nation
as a whole. Public attitudes help shape both industry uptake of emerging technologies and the
underlying regulatory framework for them.
Over recent years, there have been a number of surveys of community attitudes towards
biotechnology that have helped gauge the state of Australian public awareness, identify knowledge
gaps and track changes in awareness and attitudes over time. The findings have been used to
develop strategies to engage with the community on these issues including increasing public
awareness of developments in emerging technologies. This study continues to track those
community attitudes and behaviours.
Objectives
The research objectives for this study were:
• Explore current awareness, attitudes and understanding towards general
science and technology, specific biotechnology issues and specific applications
and controllers of the technology
• Explore differences in awareness, perceptions and attitudes according to key
demographic variables such as age, gender, location and education, and in terms of
mindsets to determine segments in the community.
9Methodology
This research used a mixed methodology of both quantitative and qualitative approaches. In
summary:
Stage 1 – Inception, planning and review of existing literature
An initial meeting was held with the Office of the Gene Technology Regulator (OGTR) to define the
outcomes being sought and assess the best options to deliver the project in the timeframe specified.
OGTR shared the existing body of knowledge about past and current community attitudes and areas
of concern, including past and current strategies and initiatives, and the effectiveness of these.
External factors affecting perceptions of gene technology, innovations and its regulation and also the
social, technological, political, economic and legislative contexts affecting these were discussed.
Survey methodology was agreed upon, replicating the survey methodologies of previous years and
eliminating the impact of externalities.
Stage 2 – Survey design
Survey questions ensured accurate and reliable tracking from previous years and additional
questions were asked based on new data from the literature review. Care was taken in the survey
design to manage the tendency of respondents to favour a ‘risk’ response which could easily distort
findings and make concerns appear higher than they actually are.
10The survey covered the following areas:
Cognitive testing of the draft survey was undertaken to ensure respondents understood what they
were being asked. The final survey was approved by OGTR.
Stage 3 – Survey fieldwork
The roughly 15-minute survey was completed in June 2019 using an online survey and with booster
CATI (phone) interviews to ensure a nationally representative sample of 1248 Australians (with
appropriate representation from Tasmania, NT and the ACT). Quotas were set for states and
territories, rural and metropolitan, and gender. Recruitment for the online survey was taken from a
reputable research-only panel.
The male to female ratio was 48:52 with 593 males and 655 females and represented a similar age
profile to that of the 2017 study. The combination of a representative national sample with quotas
and weighting, delivered a sample that could be directly compared to the previous research and
accurately identify changes in the views and attitudes of the Australian community.
While the people sampled in this survey were not the same individuals sampled in previous surveys,
they were drawn from similar demographic areas, so the responses obtained, while not indicating
individual changes of attitudes, captured the movement of attitudes across the broader population.
11Stage 4 – Survey analysis and reporting
Data cleaning and coding was conducted on the survey responses. The results were weighted to the
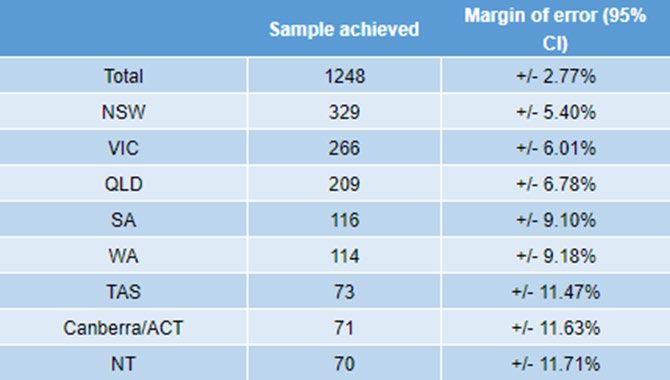
Australian population based on 2016 ABS data by State/Territory, age and gender. The unweighted
state/territory sample was: NSW-329, ACT-71, VIC-266, TAS-73, QLD-209, SA-116, NT-70, WA-114.
Appendix I provides the sample profile in detail. The analysis included frequency counts and cross
tabulations, significant testing, mean calculations and cluster analysis. The survey results were
presented to the OGTR.
Weighting of the data – The actual sample profile provides the unweighted responses. The results
presented in the rest of the report are weighted to the Australian population based on 2016 ABS
data by state/territory, age and gender.
Statistical significance – 5% at 95 percent level of confidence – All tests for statistical significance
have been undertaken at the 95 percent level of confidence, and unless otherwise noted, any
notation of a ‘difference’ between subgroups means that the difference discussed is significant at
the 95 percent level of confidence. The report only notes those differences that are statistically
significant, these differences are marked in the graphs and tables by a red or a green circle, where
they are different to the 2017 results. Differences that are statistically different to 2015 are
indicated by an arrow.
Treatment of means – Where responses are scale variables, for example 1 to 5 where 1 is disagree
strongly and 5 is agree strongly, the mean is also calculated with the removal of don’t know and
reported and also compared for statistical significance at the 95% level of confidence.
Rounding of figures – may result in anomalies of +/- 1% - All results have been rounded to the
nearest whole percentage figure and anomalies of about +/- 1% may occur in charts i.e. in the chart
above, total percentages for each bar add to 99%, or 100% or 101% due to rounding error.
Net figures are also rounded, which may also result in anomalies. Net results are also rounded after
summing the separate proportions rather than simply summing two rounded figures (e.g. ‘% total
agree’). For this reason, anomalies of about 1% sometimes occur between net results and rounded
results shown in charts. For example, a proportion of 33.3% ‘agree’ rounds to 33%, and a proportion
of 12.4% ‘strongly agree’ rounds to 12%. However, when combined to derive the total agree (i.e.
agree plus strongly agree), 33.3% plus 12.4% equals 45.7%, which would be rounded to 46%. In this
case, the results would be shown in a chart as 33% agree and 12% strongly agree, but the proportion
reported as ‘total agree’ would be 46%.
Stage 5 – Final reporting
The following provides a final and consolidated report from both the quantitative (survey) and
qualitative research findings.
123. Summary of findings
Awareness and understanding of biotechnologies
There has been a general continued decrease in awareness of the key terms of biotechnology and
genetic modification, and the largest response category to questions about awareness tended to be
those who had heard of an application but knew very little about it. As in 2017, the exception was
for synthetic biology and gene editing which both recorded very high Have NOT heard of it responses
(see figure 1).
Understanding of the term biotechnology dropped significantly, from 17% to 12%, with those who
had not heard of it rising from 20% to 27%. Also of significance, those who responded that they
knew enough about an application to explain it to a friend, dropped over four years quite drastically.
For those who knew enough about biotechnology to explain it, the drop was from 19% in 2015, to
17% in 2017 to 12% in 2019.
Likewise, GMOs and cloning of animals, which had relatively high responses to those who said they
knew enough about them to explain to friends in 2015, suffered strong drops. For GMOs the drop
was from 33% in 2015 to 30% in 2017 and 22% in 2019. And for cloning of animals the drop was
from 39% in 2015 to 35% in 2017 to 23% in 2019.
There has also been a slow drop in the percentage of respondents who felt that biotechnology
would improve our way of life in the future (71% in 2017 to 62% in 2019), but also a slow decrease in
those who felt that GMOs would make things worse in the future (29% in 2015 to 26% in 2017 to
24% in 2019. This is getting close to double the amount of people thinking GMOs or genetic
modification will improve our way of life in the future as those who feel it will make things worse
(45% to 24%) (Figure 2).
Those who felt that synthetic biology would make our lives better dropped overall from 59% in 2015
to 48% in 2019. Given that synthetic biology was the lowest rated application for people know
enough about it to explain to a friend (7% in 2019) or having heard of it but knowing little or nothing
about it (34% in 2019), there is clearly still a strong response based on what a technology sounds like
or feels like rather than what people know about it.
The data shows that 13% are completely against gene technology and 8% are completely in favour of
it (see Figure 3). These figures have not changed much over the years but represent those who tend
to be most active in lobbying for and against gene technologies. When looked at in context of the
overall population, just under a quarter of all people have strong views on the subject. While this is
still a significant number, it is perhaps less than those at polar opposites are perceived to be.
13Data across the age groups (clustered into three age cohorts of 16–30, 31–50 and 51–75) showed a
general trend of younger people being more supportive of GM foods of all kinds, and those aged 51–
75 being the least supportive (Table 4).
Looking at the data by gender confirmed the general trend that males were more supportive of GM
foods than females (Figure 11).
Attitudes by states and territories
GM crops
The support for growing GM crops overall was similar to previous years, with 36% in favour and 32%
opposed, however we have seen a gradual significant increase in the proportion of ‘don’t know’
responses from 26% in 2015 to 32% in 2019. The data indicates a reduction in those who are
opposed from 36% in 2017 to 32% in 2019 (Figure 26).
Across the states and territories New South Wales and Victoria tended to have the highest levels of
support for GM animal related products and GM crops, sitting slightly above the average score and
Queensland, Western Australia and South Australia tended to sit slightly below the national average,
although not statistically significant (Figure 12).
Of interest, in terms of genetic modification, there were a couple of significant differences found:
Victorians were more supportive of ‘introducing the genes of a bacterium’ than any other state, with
a third (32%) finding this acceptable, compared to the national average of 24%. (Figure 22) Whilst
Western Australians were significantly more opposed to introducing the genes of an animal (41%
opposed compared to the national average of 29%). Unlike previous years there were no significant
differences between capital cities and non-capital cities (Figure 22).
Beliefs about GM foods
Using a series of attitudinal statements, respondents were placed in one of four categories related to
attitudes to GM food (Figure 28):
1. Strongly support GM foods (17%)
2. Only if regulations are in place to make sure they are safe (51%)
3. Against until the science proves they are safe (21%)
4. Strong against GM foods (12%)
When the 12% who most opposed to GM foods were measured across other questions asked in the
survey, they were shown to have the lowest levels of trust.
14There was an overall drop in the values that people placed on the different objectives of genetically
modifying plants and foods for particular outcomes (Figure 31). Those seen as very valuable were:
drought resistance (38%); healthier (38%); pest-resistance (31%); frost resistance (27%); ability to
grow in salty soils (24%); to make the food cheaper (32%); to make the food last longer (25%); to
make the food taste better (21%); to make the plants herbicide tolerant (20%); and to make the
plants mature more quickly (16%). While all of these responses represented a diminution of those
who saw the attributes as very valuable, there was not a general corresponding increase in attitudes
that these attributes were not valuable. Rather there was a general increase in the Don’t Know
responses, and a slipping of values from very valuable to somewhat valuable.
For instance, making plants healthier slipped from 43% seeing it as very valuable in 2017 to 38% in
2019, while those who felt it was somewhat valuable rose from 30% to 34%. The combined
responses for not valuable and not at all valuable remained at 17% and those who did not know rose
from 9% in 2017 to 12% in 2019 (Figure 31).
Awareness of organisations responsible for regulation of GM
Survey respondents were shown a list and asked which organisation (or organisations) they believed
was responsible for the regulation of genetic modification in Australia.
Despite having a list to choose from, there was low awareness of the organisations responsible for
the regulation of GM in Australia, with a significant don’t know response (29%). Those organisations
that were most commonly believed to regulate GM were the Department of Agriculture (40%),
CSIRO (38%), Food Standards Australia New Zealand (FSANZ) (32%), Department of Health (31%), the
Office of the Gene Technology Regulator (OGTR) (27%), State governments (27%), the National
Health and Medical Research Council (NHMRC) (23%), TGA (20%), and the Australian Pesticides and
Veterinary Medicines Authority (APVMA) (18%) (Figure 35).
Overall findings of awareness of the agencies that might be responsible for GM regulation were
fairly similar to 2017 results, with no significant differences.
Trust in what organisations say about gene technology
All the regulators polled received considerable levels of trust in relation to the information that they
might produce on gene technology, with trust ratings between 55% and 67% for high trust. Low
levels of trust were only between 5% and 8% (Figure 37).
Industry groups and environmental organisation groups rated much lower for trust though, at 27%
and 35%, and also the highest levels of low trust (17% and 16%).
A new question, asked about overseas regulators, also showed they have very low levels of trust,
with only 19% of high trust and the most pronounced low trust rating of all organisations listed, at
26% (Figure 37).
15Attitudes and beliefs towards government involvement
When asked about the rules and regulations relating to GM and whether they were sufficiently
rigorous and complied with, the majority agreed but there was also a significant don’t know
response (Figure 39).
That the rules regulating the uses of GM in agriculture and food production were sufficiently
rigorous was agreed to by 31% on the top cohort on a Likert scale, and 10% were less sure (and 25%
did not know). That the rules regulating the uses of GM in medical research were sufficiently
rigorous was agreed to by 35%, and 8% were less sure (25% didn’t know).
Sources of information and trust in them
The overall finding was that television and Google ruled information sources. A general Google
search was stated by 44% of respondents, followed by documentaries on television (42%), news
stories on television (31%) and current affairs shows on television (25%). This is similar to other
surveys on sources of information on science issues, which tend to show that across the broad
population, television is still the main source of information (Figure 40).
There were drops in key media sources compared to 2017. Documentaries on TV dropped
significantly from 42% in 2017 to 38% in 2019, current affairs shows on television dropped
significantly from 29% in 2017 to 25% in 2019, and stories in the newspaper dropped significantly
from 23% to 19% (Figure 40).
Those who accept that GM is a safe way to produce foods were more likely to get their information
from Wikipedia, friends and family, and Facebook posts, and less likely from current affairs shows
(Figure 42).
Comparing sources of information to their trust shows that information preferences and trust are
not necessarily closely aligned. The highest rating for trust was television documentaries, with 18%
rating them as very trustworthy. The next closest was friends and family, with 14% rating them as
very trustworthy. Overall most media rated only between 6% and 11% trust, with current affairs
shows on television rating the best of general media at 11%, and news on the radio, TV and
newspapers all rating 8%. Talkback radio rated only 6% very trustworthy (Figure 41).
Wikipedia rated above all the mainstream news media, at 11%, but general social media discussions
and Facebook posts rated the lowest at 5% and 4% respectively.
The most trusted medium for combined trust was for information from documentaries on television
with 18% finding them very trustworthy and 61% finding them somewhat trustworthy (totalling
79%). This was followed by specific news websites (12%) very trustworthy and 56% somewhat
trustworthy, totalling 68%. The third most trustworthy source of information was news on the radio
16(8% very trustworthy and 56% somewhat trustworthy, totalling 64%), rating equally friends and
family (14%) and 50% somewhat trustworthy, totalling 64% trust (Table 10).
Values based segmentation
Of the four segments, the Disciples was the segment that responded most positively to gene
technology in general. This group were more likely to live ‘elsewhere in NSW’ and speak only English
at home.
Although they were not necessarily more aware, more likely to claim to ‘have heard of but know
little about’ many of the technologies compared to other segments, they generally believe that they
will ‘improve our way of life in the future’. They were the segment most likely to be willing to eat
GM related food, more accepting of modifying genes of plants and introducing new genes, and most
likely to be in favour of growing GM crops in their state/territory.
174. Literature review
Over the past twenty years methods of surveying public attitudes has become increasingly
sophisticated and tend to look beyond finding a simple figure for what the public think about the
technology, but why they think this way. Early studies that looked at knowledge as a driver of
attitudes (Bauer, Allum et al, 2007), were replaced by personal risk-benefit perceptions and trust
(Lyndhurst, 2009; Biotechnology Australia, 2005; Gaskell et al., 2006; Hossain et al., 2003).
Looking at different studies it is clear that there is no one easily obtainable figure for public support
or rejection of GM foods and previous studies of public attitudes towards biotechnology in Australia
have shown that the level of support or rejection depends on many things, including the intended
use of the technology, the type of gene being transferred and the objective of the modification, and
the responses may vary depending on how the questions are framed and perceived (Biotechnology
Australia, 2005, 2007).
It has also been shown that a person’s individual values are strong drivers of attitudes to GM foods
and crops, with those who value more healthy eating, for example, being more likely to be
concerned about GM foods (Funk and Kennedy, 2016).
Australian studies have also confirmed the importance of world views being more important in
influencing attitudes than knowledge of the science. A study of women with scientific backgrounds
working either in plant sciences or health science, found stark differences in support for GM foods.
Those who were plant scientists said that lack of any evidence of harm meant to them that GM food
was safe to eat, while the health scientists said that lack of any evidence of safety made them
cautious about eating them. The researchers concluded that attitudes were based more on core
food values and disciplinary background than knowledge of the science (Bray and Ankeny, 2017).
Another key finding in the evolution of studies in attitudes towards GMOs has been segmentation
studies of audiences based on values. Earlier studies that have looked at audience segmentation
generally focused on demographic differences such as age and gender (Bauer et al., 2007; Rollin,
Kennedy and Wills, 2011; Heiman et al, 2011; Qin and Brown, 2007; and Siegrist, 2000). Such
approaches have largely been replaced by segmentations based on values or world views.
Australian studies, such as those carried out by OGTR have been at the forefront of better
understanding of audience segmentation in regard to attitudes to GMOs, continuing the work begun
by Biotechnology Australia (Biotechnology Australia, 2007) in values-based segmentation.
Attitudinal segmentation can provide not only a deeper understanding of what drives public
attitudes, but by unpacking the world views or the values driving them, they can allow for framing
more effective public engagements that align with these world views.
18Recent international trends
International studies into public attitudes towards biotechnologies, conducted over the past few
years, have become much more nuanced and either look in more detail at drivers of attitudes, or
have moved away from GM foods and crops towards human uses of gene technology.
A 2018 study seeking to understand if CRISPR technology would be treated similarly to GMOs,
looked at consumer willingness to purchase different products in North America, France and
Australia, and found similar preferences for both CRISPR and GM technology, although it was stated
that attitudes to CRISPR-produced products was still largely theoretical (Shew et al, 2018).
Two studies that received considerable media attention, that looked at impacts of information flows
and attitudes to GMOs found:
• Teaching people the science behind genetic engineering leads to more positive attitudes
toward GM foods – although it should be pointed out that respondents received a
considerable amount of education over five weeks – significantly longer than can easily be
imparted to members of the public (McPhetres et al, 2019).
• Another study looking at US, France and German data found that the most extreme
opponents of genetically modified foods know the least about the science behind it, but
believe they know the most (Fernback et al, 2019).
Although questions are not directly comparable, the recently released Special Eurobarometer - April
2019 “Food safety in the EU” Report found that genetically modified ingredients in food or drinks
were a concern for 27% of respondents compared to being the fourth issue respondents were most
worried about in the 2010 at 66%. The 2019 survey also found that 60% were aware of genetically
modified ingredients in food or drinks (Kantar for the European Union, 2019).
Wider applications of gene technologies
A major study by the British Royal Society, Report on Genetic Technologies, found the UK public
were cautiously optimistic about genetic technologies. A key finding was the public is not, and
should not be seen as, monolithic, highlighting that top line findings often fail to do justice to the
complexity of public attitudes (van Mil, Hopkins and Kinsella, 2017).
Looking at synthetic biology, a US study found that the public does not generally feel well informed
about it, nor believe it is personally important to them (Akin et al, 2017).
195. Key findings
Awareness and understanding of biotechnologies
The general finding relating to attitudes and awareness was that awareness of most applications has
dropped over the past two years, and the largest response category to questions about awareness
tended to be those who had heard of an application but knew very little about it. As was seen in
2017, the exception was for synthetic biology which recorded very high Have NOT heard of it
responses.
Figure 1: Awareness and understanding of biotechnologies
Understanding of the term biotechnology dropped significantly, from 17% to 12%, with those who
had not heard of it rising from 20% to 27%, and those who knew enough about it to explain it to a
friend dropping from 19% to 12% over four years. This is more likely to be a reflection of the
diminution of biotechnology in public debates and general media coverage, rather than any dumbing
down of the population.
Likewise, there was a strong drop for those who felt they knew enough to explain both GMOs and
cloning of animals. These both had relatively high responses to this in 2015, and GMOs the drop was
from 33% in 2015 to 30% in 2017 and 22% in 2019, and for cloning of animals the drop was from
39% in 2015 to 35% in 2017 to 23% in 2019.
20These were interesting results, indicating that as topics slide off the public agenda so does a person’s
confidence in being able to know enough to explain it to a third person. There were few differences
(no significant differences) in awareness by gender, as shown in the table below.
Table 1: Awareness of GMOs
Awareness Total Males Females
Have NOT heard of it 17% 17% 16%
Have heard of it, but know very little or nothing about 56% 53% 59%
Know enough about it that you could explain it to a friend 22% 23% 20%
Can’t say / Don’t know 5% 6% 4%
After providing a response to the initial question about awareness and knowledge, respondents
were given the ability to select definitions to help them answer question throughout the rest of the
survey.
Table 2: Definitions provided in the survey
Term Definitions provided in the survey
Genetic modification Genetic modification or GM is using laboratory techniques to basically, “cut and
or GM paste” a gene from one living thing to another, or modifying or removing a gene
within an organism. Something that has been modified by GM can be called a
genetically modified organism (GMO).
Gene editing Gene editing also known as genome editing, is a laboratory technique to make
small, targeted changes to the genes of an organism. It does not involve the
transfer of a gene from one living thing to another. One of the most common
techniques used to edit genes is CRISPR (clustered regularly interspaced short
palindromic repeats).
Biotechnology Biotechnology is a broader term that covers the application of the science of
living things, and is used widely in agriculture, beer and wine production, food
processing and medical treatments. Biotechnology sometimes uses genetic
modification, but also includes processes that do not involve the use of genes.
Cloning of animals Cloning of animals another form of assisted reproduction in animal husbandry
which allows livestock breeders to create an exact genetic copy of superior
breeding animals to produce essentially an identical twin for the purpose of
healthier offspring. Cloning does not manipulate the animal’s genetic make- up
nor change an animal’s DNA.
Synthetic Synthetic biology is a new form of biotechnology, where the principles of
biotechnology engineering are used to build new biological structures that might not otherwise
have existed, such as creating new organisms to use in medicines or to clean up
oil spills.
21Nanotechnology Nanotechnology is the manipulation of matter on an atomic, molecular, and
supramolecular scale (nanoscale – which is about 1 to 100 nanometres) to take
advantage of enhanced properties such as higher strength, lighter weight,
increased control of light spectrum, and greater chemical reactivity.
Perceptions of whether GM technologies will improve our way of life
While a clear majority of respondents felt that biotechnology would improve our way of life in the
future, this has dropped since 2017 (71% to 62%).
Gene editing also had more than half (52%) indicating it would improve our way of life in the future,
albeit a drop from 2017 (57%).
Belief that GMOs and cloning of animals would improve our way of life in the future, however,
remained fairly static at 45% and 31% respectively, with cloning of animals having equal numbers
believing it would improve our way of life as believed it would make things worse in future (31% in
2015, 32% in 2017 and 31% in 2019).
Looking at those who felt GMOs would make our life worse in the future, the percentage has
dropped slowly over the past four years from almost 29% to 24%.
Figure 2: Perceptions of whether technologies will improve our way of life
22Levels of support for GMOs and gene technology
Many surveys on agricultural biotechnology ask questions based on simple Yes, No or Don’t Know
options, which don’t accurately reflect the breadth of public attitudes. There will always be
minorities who are either strongly for or strongly against GM foods—and these are important to
understand—but the majority of the population tends to be more moderate in their attitudes and
reflecting this breadth of attitudes is more useful in understanding attitudes.
The data shows that 13% of respondents are completely against gene technology – which has not
changed from 2017, and 8% are completely in favour of it. These figures have not changed much
over the years and represent those who tend to be most active in lobbying for or against gene
technologies. It is important to remember, however, that in the context of the general population
they represent less than a quarter of all people. While this is still a significant number, it is perhaps
fewer than many believe. Those at the polar opposites generally stay there, but those in the middle
are more likely to move back and forward according to different factors, and this is where
movements in the population are best recorded. The mean for those who support the use of gene
technology in food and in crops has dropped a little since 2017, but it is notably higher than it was in
2015 (4.84 in 2015, 5.40 in 2017 and 5.29 in 2019).
Looking at the general trend, it is essentially unchanged over four years, with attitudes moving more
to the middle, and an increase in those who don’t know over 2015 (9% up from 6%).
Figure 3: Support for gene technology in food and crops
23It is worth noting, that similarly to previous years, public attitudes are spread across a wide
spectrum. Attitudes at the two extremes should not be generalised or attributed to a much wider
range of views between the two extremes.
On closer examination of Figure 3, when comparing the ‘Bottom box’ (support values 0-3), ‘Middle
box’ (support values 4-6) and ‘Top box’ (Support values 7-10), we can see a trend whereby the
proportion in the bottom box has declined significantly since 2015, and the proportion in the middle
box has increased significantly since 2015. This pattern is captured in Table 3, indicating a reduction
in respondents with strong attitudes and an increase in more neutral views in 2019, compared to
2015.
Table 3: Support for GM food - analysis over time
Support on a 0-10 scale 2015 2017 2019
Net BOTTOM box (0-3) 23% 18% 16%
Net MIDDLE box (4-6) 33% 38% 41%
Net TOP box (7-10) 33% 38% 33%
Q5. For the following statements, on a scale of 0-10 where 10 is completely supportive and 0 is completely against it, please indicate
how supportive you are for the following uses of genetic modification or gene technology: For use in food and crops
Base: Total sample 2019 n=1248, 2017 n=1255, 2015 n=1160 Significantly different from 2015
Breaking down the responses by gender, there was a clear trend of higher support for GM foods and
crops by males and less by females. Generally speaking, women were more concerned than men
about the possible negative impact and gene technology and older people were more concerned
than younger people.
When looking at attitudes by age the data shows that support for gene technology generally
decreases as one grows older. Those in the 51–75 age group were more likely to indicate a low level
of support for gene technology generally, but those in the 16–30 age group were more likely to
indicate a high level of support for gene technology generally, and for use in foods and crops.
24Figure 4: Means - Support for gene technology in food and crops by gender
Table 4: Support for GM use generally - by age
Support on a 0-10 scale Total 16-30 31-50 51-75
Net BOTTOM box (0-3) 16% 12% 15% 20%
Net MIDDLE box (4-6) 41% 38% 40% 44%
Net TOP box (7-10) 33% 41% 33% 27%
Don’t know/can’t say 10% 9% 11% 10%
Q5. For the following statements, on a scale of 0-10 where 10 is completely supportive and 0 is completely against it, please indicate
how supportive you are for the following uses of genetic modification or gene technology: GM use generally
Base: Total sample 2019 n=1248, 2017 n=1255, 2015 n=1160
Data from an 11-fold response across a Likert scale of support was grouped into three major
response cohorts for ease of reading as shown below (including the can’t say/ don’t know
responses), representing those most in support, those in the middle and those with the least
support.
25Figure 5: Levels of support for GMOs and gene technology
The general results tended to be closer to those from the 2015 survey than they were to 2017
results, with highest levels of support for genetic modification and gene technology being 33% in
2015, 38% in 2017 and 33% again in 2019.
The use of genetic modification for medical uses – which had the highest overall support at 58% in
2019, has seen a significant rise in the middle box score since 2015, from 19% to 27% scoring
between 4 and 6 out of 10.
Likewise, there has been a gradual rise in those whose support for industry use is in the middle box
(from 24% in 2015 to 29% in 2019), accompanied by a decline for those in the bottom box (from 12%
in 2015 to 8% in 2019).
Those who opposed using gene technology in food and crops remained at the 2017 figure of 24%
(having dropped from a high 33% in 2015).
26Figure 6: Levels of support for other GMOs and gene technology
A new component to this question, asked only in 2019, was whether people supported the use of
genetic modification of gene technology for ornamental uses, for livestock (such as modifying feed
to reduce the amount of greenhouse gases/methane produced by those animals, and for livestock
uses (such as vaccines against diseases). The results showed the highest support was for livestock
uses such as developing vaccines that had 50% high support, and 11% low support.
Livestock uses were supported by 41% of respondents with 16% opposing them. Ornamental uses,
which had the lowest support of these new questions, had 31% support and 18% opposed.
Perceptions towards science and technology
Looking at correlations between attitudes towards GMOs and science and technology has provided
valuable insights into the values that drive attitudes. Five key statements were tested across a Likert
scale to gauge public sentiments and to inform values-based segmentation.
The five statements were:
• Not vaccinating children puts others at risk
• People shouldn’t tamper with nature
• Scientific advances tend to benefit the rich more than they benefit the poor
• Science and technology creates more problems than it solves
• Technological change happens too fast for me to keep up with.
27You can also read