Alcohol-Related Harm Profile
←
→
Page content transcription
If your browser does not render page correctly, please read the page content below
Alcohol-Related Harm Profile

Author: Karen Wright, Population Health Team   Counties Manukau Health
This report is available in pdf format on
www.countiesmanukau.health.nz

NOTE: Please read at least the Introduction section of this report before looking at the indicators. It is
important to understand clearly what this report is about, and what it is not.

Acknowledgements

This information was prepared by Dr Karen Wright with analytical support from Dean Papaconstantinou
and Mildred (Ai Wei) Lee. Support and feedback has been gratefully received from Dr Sarah Sharpe, Dr Ann
Sears, Dr Wing Cheuk Chan, Hinewai Pomare and Dr Nicki Jackson.

Disclaimer
Information within the report may be freely used provided the source is acknowledged.

Every effort has been made to ensure that the information in this report is correct.
Counties Manukau Health and the authors will not accept any responsibility for information which is
incorrect, or any actions taken as a result of the information in this report.

Published in 2018

By Counties Manukau Health
Private Bag 94052
South Auckland Mail Centre
Manukau City
New Zealand

ISBN 978-0-9876500-8-5

Suggested citation:

Wright K (2018) Counties Manukau Health Alcohol-Related Harm Profile. Counties Manukau Health.
Auckland: Counties Manukau Health.

July, 2018
Executive summary
Alcohol causes more harm than any other drug in society. Physical, psychosocial, and
economic harms affect individuals, whaanau, and the wider community. Counties Manukau
Health is committed to working together with people, whaanau, families, communities,
health agencies and other partners to equitably reduce hazardous alcohol use and minimise
alcohol-related harm in Counties Manukau. The development of key indicators is central to
achieving this goal.

The following report explores the framing of alcohol-related harm from a Te Tiriti o Waitangi
perspective. The determinants of alcohol-related harm, Maaori models of health, and
domains of alcohol-related harm are explored and utilised to inform a conceptual model of
the relationship between determinants of alcohol consumption and alcohol-related harm.
Although simplistic, this framework provides a structure for indicator development that
supports a broad definition of alcohol-related harm.

Selected indicators, primarily utilising health datasets, are developed to produce a
population-level description of alcohol-related harm in Counties Manukau. Data quality and
completeness issues limit the accuracy of some indicators, so individually they may not
accurately reflect the true burden of alcohol-related harm on the Counties Manukau
community. Yet together, the proposed indicators paint a picture of inequitable distribution
of harms with Maaori, males, youth, and socio-economically deprived populations being
disproportionately burdened.

Interpretation of the selected indicators within the local context supports understanding of
the burden of alcohol-related harm. This report can be used to inform the development of
innovations and healthy public policies that support equitable health outcomes for the
Counties Manukau Health population.

                                              2
Contents
Executive summary ........................................................................................................ 2
List of abbreviations ....................................................................................................... 4
List of tables ................................................................................................................... 5
List of figures .................................................................................................................. 7
1 Introduction .......................................................................................................... 10
   1.1 Alcohol-related harm .................................................................................... 10
   1.2 Counties Manukau Health ............................................................................. 10
   1.3 Purpose.......................................................................................................... 11
   1.4 Structure of the report .................................................................................. 12
2 Alcohol-related harm indicators ........................................................................... 12
   2.1 Framing alcohol-related harm....................................................................... 12
   2.2 Scope and selection of indicators ................................................................. 17
3 Selected alcohol-related harm indicators ............................................................ 18
   3.1 Determinants of alcohol-related harm ......................................................... 18
     3.1.1       Hazardous alcohol use ........................................................................... 18
     3.1.2       Alcohol licence density .......................................................................... 21
   3.2 Hauora ........................................................................................................... 26
     3.2.1       Alcohol-specific mortality ...................................................................... 26
     3.2.2       Alcohol-specific hospital admissions ..................................................... 29
     3.2.3       Alcohol-involved Emergency Department encounters ......................... 34
     3.2.4       Paediatric outpatient appointments and Fetal Alcohol Spectrum
     Disorder (FASD) .................................................................................................... 41
     3.2.5       Alcohol and Drug Team contact and alcohol-specific conditions.......... 42
     3.2.6       Family harm and alcohol ........................................................................ 51
4 Summary ............................................................................................................... 53
References ................................................................................................................... 55
Appendix 1: Alcohol-harm data dictionary of potential indicators using health data
sources ......................................................................................................................... 57
Appendix 2: Metadata for indicators ........................................................................... 62
Appendix 3: ICD code list for alcohol-specific condition categories............................ 74
Appendix 4: Additional tables ...................................................................................... 75

                                                                 3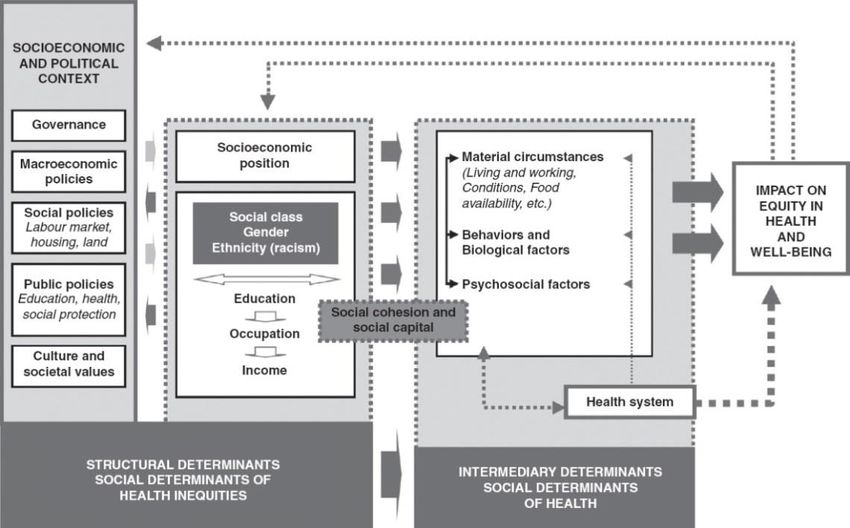
List of abbreviations
AAF      Alcohol attributable fraction
AUDIT    Alcohol Use Disorders Identification Tool
AOD      Alcohol and Other Drug Team
CAU      Census area unit
CM       Counties Manukau
CSDH     Commission on Social Determinants of Health
DHB      District Health Board
ED       Emergency Department
FASD     Fetal Alcohol Spectrum Disorder
IACD     Inter-Agency Committee on Drugs
LBA      Local Board Area
MMH      Middlemore Hospital
MOH      Ministry of Health
MORT     Mortality Collection
NHI      National Health Index
NIA      National Intelligence Application
NMDS     National Minimum Dataset
NZHS     New Zealand Health Survey
NZLC     New Zealand Law Commission
NZP      New Zealand Police
OPA      Outpatients appointment
PRIMHD   Programme for the Integration of Mental Health Data
SIB      Social Investment Board
SNZ      Statistics New Zealand
WHO      World Health Organization

                                     4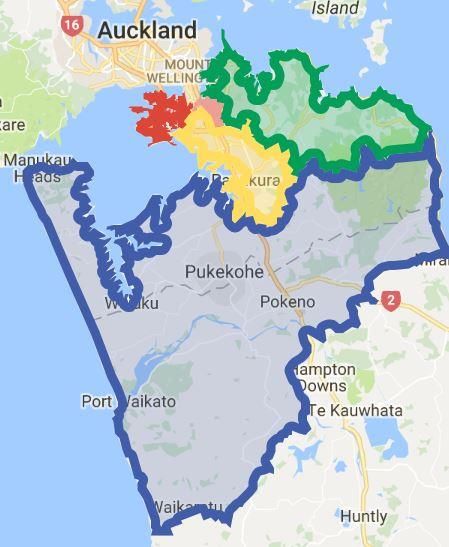
List of tables
Table 1: Land area, population size, and population density for CM localities in 2016.......... 10
Table 2: Overview of Maaori models of health ....................................................................... 14
Table 3: Categorisation of selected examples into proposed alcohol-related harm matrix ... 16
Table 4: List of selected indicators .......................................................................................... 18
Table 5: Number and percentage of licences in CM Health and NZ, by licence type, as at 7
June 2016 ................................................................................................................................ 22
Table 6: Number and percentage of MMH ED encounters by alcohol involvement status, all
ages, October 2017 – January 2018 ........................................................................................ 35
Table 7: Number and percentage of MMH ED encounters by alcohol involvement status, 18
years and over, October 2017 – January 2018 ........................................................................ 35
Table 8: Number and percentage prevalence of unique individuals where an outpatient
appointment was coded with FASD by ethnicity and sex, 2011-2016 .................................... 42
Table 9: Crude prevalence and 95% confidence intervals of hazardous alcohol use, by sex,
aged group, and ethnicity, 2006/07 and 2011-2014 ............................................................... 75
Table 10: Crude prevalence and 95% confidence intervals for hazardous alcohol use, age
group and ethnicity by sex, 2011-2014 ................................................................................... 76
Table 11: Alcohol licence population density (per 10,000 population aged 15 and over), area
density (per 100km2 land area), and proportion of licence type, by CM locality with NZ
comparison, at 7 June 2016 .................................................................................................... 77
Table 12: Number and proportion of CAUs per total licence density quintile (per 10,000
population aged 15 and over) by locality, at 7 June 2016 ...................................................... 78
Table 13: Number and proportion of CAUs per total licence density quintile (per 100km2) by
locality, at 7 June 2016 ............................................................................................................ 78
Table 14: Number, percentage of deaths, and age-standardised mortality rate for alcohol-
specific conditions by sex and year for CM Health with mortality rate for total CM Health and
New Zealand, 2005-2014......................................................................................................... 79
Table 15: Number, percentage of deaths, and age-standardised mortality rate for alcohol-
specific conditions by ethnicity and year for CM Health, 2005-2014 ..................................... 79
Table 16: Number, percentage of deaths, and age-standardised mortality rate for alcohol-
specific conditions by age group and year for CM Health, 2005-2014 ................................... 80
Table 17: Number, percentage of deaths, and age-standardised mortality rate for alcohol-
specific conditions by CM locality and year for CM Health, 2005-2014 ................................. 80
Table 18: Age-standardised rate of alcohol-specific hospital admissions in CM Health, by age
group, sex and year, 2007-2016 .............................................................................................. 81
Table 19: Age-standardised rate of alcohol-specific hospital admissions in CM Health, by
ethnicity, age group and year, 2007-2016 .............................................................................. 82
Table 20: Age-standardised rate of alcohol-specific hospital admissions in CM Health, by
ethnicity, sex and year, 2007-2016 ......................................................................................... 83
Table 21: Number, percent and age standardised rate of alcohol-specific hospital admissions
for CM localities, per year, 2007-2016 .................................................................................... 84
Table 22: Number, percent and age-standardised rate (per 100,000 population) of alcohol-
specific hospital admissions by condition category and year, 2007-2016 .............................. 85
Table 23: Number of alcohol-specific hospital admissions by ethnicity, by residential locality,
2016 ......................................................................................................................................... 87
Table 24: Number of alcohol-specific hospital admissions by age group, by residential
locality, 2016 ........................................................................................................................... 87
Table 25: Number, percent and age standardised alcohol-specific hospital admission rate by
NZDep2013 quintile and sex, CM Health and NZ comparison, 2016 ...................................... 87

                                                                       5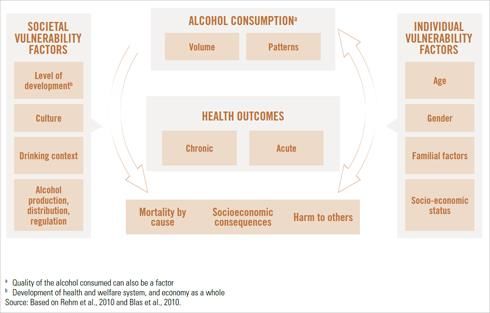
Table 26: Number of MMH ED encounters by sex, age group, ethnicity, NZDep quintile, and
locality, October – December 2017 ......................................................................................... 88
Table 27: Number and percentage of MMH ED encounters by alcohol involvement status,
October 2017 – December 2017 (quarter 2) ........................................................................... 89
Table 28: Number and percentage of MMH ED encounters coded as alcohol involved or
secondary involvement, by ethnicity, October – December 2017 .......................................... 89
Table 29: Number and percentage of MMH ED encounters coded as alcohol involved or
secondary involvement, by encounter outcome, October – December 2017 ........................ 90
Table 30: Number and percentage of MMH ED encounters coded as alcohol involved or
secondary involvement, by NZDep quintile, October – December 2017................................ 90
Table 31: Number and percentage of MMH ED encounters coded as alcohol involved or
secondary involvement, by residential locality, October – December 2017 .......................... 91
Table 32: Number and percentage of MMH ED encounters coded as alcohol involved or
secondary involvement, bysex and age group, October – December 2017 ........................... 91
Table 33: Number and percentage of MMH ED encounters coded as alcohol involved or
secondary involvement, by day of the week, October – December 2017 .............................. 92
Table 34: Number and percentage of FASD coded encounters by age group and NZDep
quintile, 2011-2016 ................................................................................................................. 93
Table 35: Number and percentage of FASD coded encounters by CM Health locality, 2011-
2016 ......................................................................................................................................... 94
Table 36: Number and age standardised rate of CM Health residents that have had contact
with Alcohol and Drug Services per year, by sex, 2009-2016 ................................................. 94
Table 37: Number and age standardised rate of CM Health residents that have had contact
with Alcohol and Drug Services per year, by ethnicity, 2009-2016 ........................................ 95
Table 38: Number and age standardised rate of CM Health residents that have had contact
with Alcohol and Drug Services per year, by age group, 2009-2016 ...................................... 95
Table 39: Number and age standardised rate of unique CM Health residents that have had
contact with Alcohol and Drug Services per year, by locality, 2009-2016 .............................. 96
Table 40: Number of unique CM Health residents that have had contact with Alcohol and
Drug Services by locality and age group, 2016 ........................................................................ 96
Table 41: Number and age-standardised rate of unique CM Health residents that have had
contact with Alcohol and Drug Services by NZDep2013 quintile, 2016 .................................. 97
Table 42: Number of CM Health residents per year that have had contact with Alcohol and
Drug Team services and diagnosis code coverage, 2009 – 2016 ............................................ 97
Table 43: Number of CM Health residents that have had Alcohol and Drug Team contact and
have an alcohol-specific diagnosis, by sex, 2009-2016 ........................................................... 98
Table 44: Number of CM Health residents that have had Alcohol and Drug Team contact and
an alcohol-specific diagnosis, by age group, 2009-2016 ......................................................... 98
Table 45: Number of CM Health residents that have had Alcohol and Drug Team contact and
an alcohol-specific diagnosis, by ethnicity, 2009-2016 ........................................................... 99
Table 46: Number of CM Health residents that have had Alcohol and Drug Team contact and
an alcohol-specific diagnosis, by locality, 2009-2016.............................................................. 99

                                                                       6
List of figures
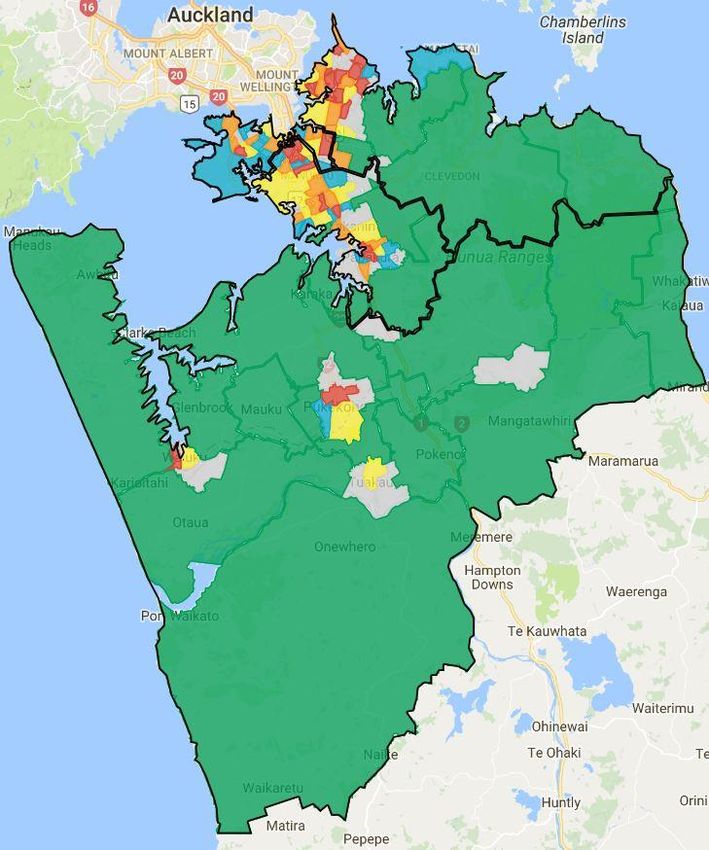
Figure 1: Geographical boundaries for CM Health localities................................................... 11
Figure 2: Commission on Social Determinants of Health conceptual framework .................. 13
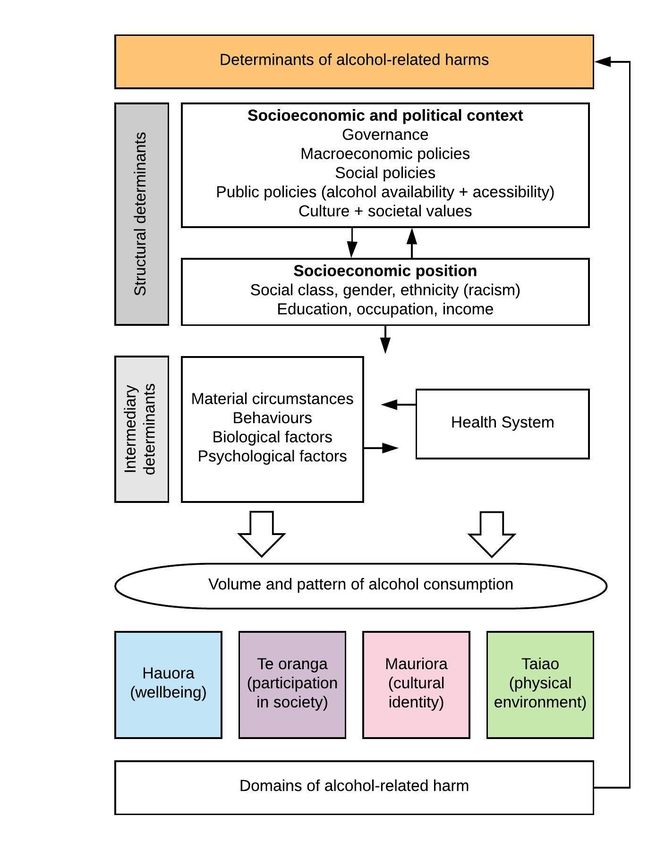
Figure 3: Conceptual causal model of alcohol consumption and health outcomes ............... 13
Figure 4: Conceptual model of relationship between determinants of alcohol and alcohol-
related harms .......................................................................................................................... 15
Figure 5: Crude prevalence of hazardous alcohol use in CM Health, by sex, 2006/07 and
2011-2014................................................................................................................................ 19
Figure 6: Crude prevalence of hazardous alcohol use in CM Health, by age group, 2006/07
and 2011-2014......................................................................................................................... 19
Figure 7: Crude prevalence of hazardous alcohol use in CM Health, by prioritised ethnicity,
2006/07 and 2011-2014 .......................................................................................................... 20
Figure 8: Crude prevalence of hazardous alcohol use in CM Health with 95% confidence
intervals, by sex and age group, 2011-2014............................................................................ 20
Figure 9: Crude prevalence of hazardous alcohol use in CM Health with 95% confidence
intervals, by sex and prioritised ethnicity, 2011-2014 ............................................................ 21
Figure 10: CM Health alcohol licence density per 10,000 adults aged 15 years and over, by
locality and licence type, as at 7 June 2016 ............................................................................ 23
Figure 11: CM Health alcohol licence density per 100km2, by locality and licence type, at 7
June 2016 ................................................................................................................................ 23
Figure 12: Total alcohol licence density per 10,000 adults aged 15 years and over in CM
Health, by CAU quintile ........................................................................................................... 24
Figure 13: Total alcohol licence density per 100km2 in CM Health, by CAU quintile .............. 25
Figure 14: CM Health age-standardised mortality rate for alcohol-specific conditions in CM
Health, by sex and year, with New Zealand age-standardised mortality rate, 2005-2014 ..... 27
Figure 15: Age-standardised mortality rate from alcohol-specific conditions in CM Health, by
ethnicity and year, 2005-2014 ................................................................................................ 28
Figure 16: Age-standardised mortality rate from alcohol-specific conditions in CM Health, by
age group and year, 2005-2014 .............................................................................................. 28
Figure 17: Age-standardised mortality rate for alcohol-specific conditions in CM Health, by
locality and year, 2005-2014 ................................................................................................... 28
Figure 18: Number of deaths from alcohol-specific conditions in CM Health, by NZDep2013
quintile, 2014........................................................................................................................... 29
Figure 19: Age-standardised rate of alcohol-specific hospital admissions by sex and year, CM
Health vs New Zealand, 2007-2016......................................................................................... 31
Figure 20: Age-standardised rate of alcohol-specific hospital admissions in CM Health, by age
group and year, 2007-2016 ..................................................................................................... 31
Figure 21: Age-standardised rate of alcohol-specific hospital admissions in CM Health with
95% confidence intervals, by ethnicity and year, 2007-2016 ................................................. 31
Figure 22: Age-standardised rate of alcohol-specific hospital admissions in CM Health, by
locality and year, 2007-2016 ................................................................................................... 32
Figure 23: Percentage of alcohol-specific hospital admissions in CM Health by category,
2007-2016................................................................................................................................ 32
Figure 24: Alcohol-specific hospital admissions in CM Health, by ethnicity and locality, 2016
................................................................................................................................................. 33
Figure 25: Alcohol-specific hospital admissions in CM Health, by locality and age group, 2016
................................................................................................................................................. 33
Figure 26: Age-standardised rates for alcohol-specific hospital admissions in CM Health, by
sex and NZDep2013 quintile, 2016 ......................................................................................... 33
7Figure 27: MMH ED encounters where alcohol was primarily or secondarily involved, all ages,
by sex, October 2017 – January 2018...................................................................................... 36
Figure 28: MMH ED encounters where alcohol was primarily or secondarily involved, all ages,
by age group, October 2017 – January 2018........................................................................... 36
Figure 29: MMH ED encounters where alcohol was primarily or secondarily involved, all ages,
by prioritised ethnicity, October 2017 – January 2018 ........................................................... 36
Figure 30: MMH ED encounters where alcohol was primarily or secondarily involved, all ages,
by NZDep quintile, October 2017 – January 2018................................................................... 37
Figure 31: MMH ED encounters where alcohol was primarily or secondarily involved, all ages,
by locality, October 2017 – January 2018 ............................................................................... 37
Figure 32: Proportion of MMH ED encounters where alcohol was primarily or secondarily
involved, all ages, by prioritised ethnicity, October - December 2017 ................................... 38
Figure 33: Proportion of MMH ED encounters where alcohol was primarily or secondarily
involved, all ages, by outcome status, October - December 2017.......................................... 38
Figure 34: Proportion of MMH ED encounters where alcohol was primarily or secondarily
involved, all ages, by NZDep quintile, October - December 2017........................................... 39
Figure 35: Proportion of MMH ED encounters where alcohol was primarily or secondarily
involved, all ages, by locality, October - December 2017 ....................................................... 39
Figure 36: Proportion of MMH ED encounters where alcohol was primarily or secondarily
involved, all ages, by sex, October - December 2017.............................................................. 39
Figure 37: Proportion of MMH ED encounters where alcohol was primarily or secondarily
involved, all ages, by age group, October - December 2017................................................... 40
Figure 38: Proportion of MMH ED encounters where alcohol was primarily or secondarily
involved, all ages, by day of week, October - December 2017 ............................................... 40
Figure 39: Number and age-standardised rate of CM Health residents that have had contact
with Alcohol and Drug Team services, by sex and year, 2009-2016 ....................................... 44
Figure 40: Age-standardised rate of CM Health residents that have had contact with Alcohol
and Drug Team services, by ethnicity and year, 2009-2016 ................................................... 44
Figure 41: Age-standardised rate of CM Health residents that have had contact with Alcohol
and Drug Team services, by age group and year, 2009-2016 ................................................. 44
Figure 42: Age-standardised rate of CM Health residents that have had contact with Alcohol
and Drug Team services, by locality and year, 2009-2016 ...................................................... 45
Figure 43: CM Health residents that have had contact with AOD services by age group and
locality, 2016 ........................................................................................................................... 45
Figure 44: Number and age-standardised rate of CM Health residents that have had contact
with AOD services by NZDep2013 quintile, 2016 .................................................................... 46
Figure 45: CM Health residents that have had AOD service contact and have an alcohol-
specific diagnosis, by sex and year, 2009-2016 ....................................................................... 48
Figure 46: CM Health residents that have had AOD service contact and have an alcohol-
specific diagnosis, by age group and year, 2009-2016 ............................................................ 48
Figure 47: CM Health residents that have had AOD service contact and have an alcohol-
specific diagnosis, by ethnicity and year, 2009-2016 .............................................................. 49
Figure 48: CM Health residents that have had AOD service contact and have an alcohol-
specific diagnosis, by locality and year, 2009-2016 ................................................................ 49
Figure 49: Number of CM Health residents that have had AOD contact and have alcohol-
specific diagnoses, by sex and NZDep2013 quintile, 2016 ...................................................... 50
Figure 50: Number of unique individuals involved in a family harm event in CM District by
age group, 3 July 2017 – 21 January 2018............................................................................... 52
Figure 51: Unique family harm individuals vs Counties Manukau population, by ethnicity, 3
July 2017 – 21 January 2018 .................................................................................................... 52
8Figure 52: Prevalence of family harm events with alcohol involved, North and South district
areas, 3 July 2017 – 31 January 2018 ...................................................................................... 52
91 Introduction
1.1 Alcohol-related harm
Alcohol causes more harm than any other drug in society (Nutt, King, & Phillips, 2010).
Hazardous alcohol use contributes to large physical and mental ill-health, social, and
economic burdens in New Zealand (MOH, 2016b) and globally (WHO, 2014). Harm from
alcohol extends beyond the individual and can result in harm to children (including those
exposed to alcohol during pregnancy), whaanau, friends, and the wider community (Connor
& Casswell, 2012). Data describing these harms are limited and frequently absent.
The harmful health impacts of hazardous alcohol use in New Zealand are divided almost
equally between injury and chronic disease outcomes (MOH, 2016b), burdening both
inpatient and outpatient hospital services, and primary care services in the community. In
New Zealand, inequitable outcomes are apparent with men, Maaori, young people, and
those living in more socioeconomically deprived areas at higher risk of alcohol-related harm
(Meiklejohn, Connor, & Kypri, 2012). Although many Pacific people do not drink alcohol at
all, Pacific adults that do drink alcohol are more likely to have a hazardous drinking pattern
than non-Pacific adults (MOH, 2016a).
1.2 Counties Manukau Health
Counties Manukau (CM) Health has an ethnically diverse population: 16 percent Maaori, 21
percent Pacific Peoples, 24 percent Asian, and 39 percent Other ethnic groups1. It is home to
New Zealand’s second largest Maaori population, the largest population of Pacific peoples,
and the second largest Asian population. The CM population is relatively young with 23
percent of the population less than 15 years of age. The population aged 65 and over is
increasing and projected to increase on average almost five percent each year from 2015/16
to 2025/26. At the time of the 2013 Census, 36 percent of the CM population lived in the
most socio-economically deprived quintile in New Zealand. Within the CM district, Maaori
(58%), Pacific Peoples (76%), and 0-14 year olds (45%) are disproportionately represented in
this quintile.
District Health Board (DHB) service delivery is focused on four geographical localities within
the Counties Manukau district – Eastern, Franklin, Manukau, and Mangere/Otara (Figure 1).
Mangere/Otara and Manukau localities, the most densely populated localities (Table 1), are
particularly youthful and the most socio-economically deprived areas in the CM district.
Table 1: Land area, population size, and population density for CM localities in 2016
CM locality Population Area (km2) Population density
(per km2)
Eastern 159,240 431 369
Franklin 72,630 2,168 34
Mangere/Otara 108,820 62 1,755
Manukau 193,580 177 1,094
Total CM Health 534,270 2,838 188
Source: 2016 population projections based on New Zealand Census 2013
1
2016 population projection based on New Zealand Census 2013
10Figure 1: Geographical boundaries for CM Health localities
Legend
Eastern Mangere/Otara
Franklin Manukau
1.3 Purpose
The aim of this report is to present a data profile of alcohol-related harm for the Counties
Manukau population. This work focuses predominantly on the exploration of health data
sources.
Objectives of this work:
1. Develop an alcohol-related harm matrix that is relevant to the New Zealand context
and provides a potential framework for considering the wide range of alcohol-
related harms that could be described/measured as part of a profile of alcohol-
related harm.
2. Explore health data sources to develop a data dictionary describing potential
indicators of alcohol-related harm.
3. Explore selected datasets and identify and/or develop a set of indicators, including
description of the following aspects:
a. Descriptive epidemiology (by ethnicity, age, sex, socioeconomic deprivation,
and residential locality when possible);
b. Potential geographical level of analysis;
c. Opportunities for future development.
111.4 Structure of the report
The introduction in section one has briefly outlined the context of alcohol-related harm in
CM Health and the purpose and objectives of this report. Section two explores the framing
of alcohol-related harm and outlines potential indicators using primarily health data sources.
Selected indicators are described in detail in section 3. Insights from exploring the data and
recommendations for future use are provided for each indicator. Section 4 summarises the
report and provides commentary on strengths, limitations, and aspects that could be
developed further in the future. Supplementary documents and tables are available in the
appendices.
2 Alcohol-related harm indicators
2.1 Framing alcohol-related harm
Causation of alcohol-related harm is complex and multifactorial. The Commission on Social
Determinants of Health (CSDH) conceptual framework addresses the complexity of health
and wellbeing outcomes, and recognises the broad structural and intermediary social
determinants of health (Figure 2). The World Health Organization (WHO) draws on a social
determinants approach and proposes the causal model of alcohol consumption and health
outcomes illustrated in Figure 3. This model includes societal and individual vulnerability
factors and identifies health, mortality, and socioeconomic harms to the individual in
addition to harm to others. Excluded from this model are distal socioeconomic and political
contexts as well as colonisation and racism – important influencers of health inequities in
New Zealand.
In New Zealand Maaori continue to be disproportionately burdened by alcohol-related
harm. Indigenous rights and Te Tiriti o Waitangi obligations necessitate a framework that
recognises te ao Maaori (Maaori worldview) and Maaori perceptions of health. Several
Maaori models of health have been developed, three of which are summarised in Table 2.
Common to these models, is the holistic concept of health and wellbeing. Key domains
include tinana (physical health), wairua (spiritual health), hinengaro (mental health),
whaanau (family health), mauriora (cultural identity), te oranga (participation), and taiao
(the physical environment).
To the best of the author’s knowledge, based on scans of the published and grey literature,
no model exists which specifically details the broad range of alcohol-related harms and
which could be used to ‘frame’ a comprehensive set of indicators describing various harms.
The absence of an alcohol-related harm framework relevant to the New Zealand context has
led to the development by the author of a novel conceptual model (Figure 4). This model
incorporates te ao Maaori and Maaori models of health into a social determinants approach
to alcohol-related harm. Harms result from the volume and pattern of alcohol consumption
and are mediated by the health system. Social determinants shape both alcohol
consumption and the structure of and access to health services. The four proposed domains
of harm (Hauora – physical, spiritual, and psychological wellbeing, Te Oranga – participation
in society, Mauriora – access to te ao Maaori and cultural identity, and Taiao – physical
environment) are experienced at individual, whaanau (family and support networks), and
community levels across a spectrum of severity. Examples of the categorisation of harms are
included in Table 3. As this work is focused on health data sources, and therefore is limited
in scope in terms of describing a complete range of alcohol-related harms, it is important to
frame it as such and not to overlook the broader context.
12Figure 2: Commission on Social Determinants of Health conceptual framework
Source: Closing the gap in a generation: health equity through action on thesocial determinants of
health (CSDH, 2008)
Figure 3: Conceptual causal model of alcohol consumption and health outcomes
Source: Alcohol fact sheet (WHO, 2015)
13Table 2: Overview of Maaori models of health
Model of health Key components
Te Whare Tapa Whaa Four cornerstones of health
(Durie, 1998) Taha Tinana – physical health
A unified theory of Taha wairua – spiritual health
health Taha whaanau - family health and wider social systems
Taha hinengaro – mental health
Te Pae Maahutonga Four key tasks of health promotion
(Durie, 1999) Mauriora – access to te ao Maaori and cultural identity
A model for Waiora – environmental protection
conceptualising Toiora – healthy lifestyles including harm minimisation,
Maaori health targeted interventions, and risk management
promotion Te Oranga – participation in society including the economy,
education, employment, knowledge, and decision making
Two prerequisites
Ngaa manukura – local leadership
Te Mana whakahaere – autonomy and self-determination
Meihana model (Pitama, Seven components of Waka hourua (double-hulled waka)
2014) Patient – identification of self-determined ethnic identity
A guide to facilitate Whaanau – support networks
access to quality Tinana – promoting physical wellbeing of individual and
health services for whaanau
Maaori Hinengaro – psychological and emotional wellbeing
Wairua – beliefs regarding connectedness and spirituality
Taiao – external physical environment including home,
neighbourhood, workplace and health setting
Iwi-Katoa – services and systems that provide support for
individual/whaanau within the health environment
Nga Hau e Wha (the four winds) – impact on journey to
wellbeing
Colonisation, racism, migration, marginalisation
Nga Roma Moana (ocean currents) – aspects of te ao Maaori
that may influence Maaori in clinical settings
Ahua – identification of personal indicators of te ao
Maaori
Tikanga – Maaori cultural principles
Whaanau – relationships, roles and responsibilities of the
patient within te ao Maaori
Whenua – specific genealogical or spiritual connection
between patient/whaanau and land
14Figure 4: Conceptual model of relationship between determinants of alcohol and alcohol-related
harms
Source: Developed by author
15Table 3: Categorisation of selected examples into proposed alcohol-related harm matrix
Hauora – Tinana, hinengaro + Te Oranga Mauriora Taiao
wairua Participation in society Access to te ao Maaori / Physical environment
Wellbeing – physical, mental + cultural identity
spiritual
- Close relationships/support people - Performance in education / work / - Reduced opportunity for access to - Damage to personal property /
- Alcohol-related conditions causing parenting / relationships cultural institutions, social possessions
harm to physical, mental, and - Absenteeism from education/work resources, and language - Sub-optimal housing conditions
spiritual wellbeing - Employment / income (secondary to marginalisation /
Individual - Mortality from alcohol-related - Criminal conviction / stigmatisation related to
conditions imprisonment hazardous alcohol use)
- Alcohol-related drownings - Marginalisation / stigmatisation –
access and quality of healthcare
and other services
- Perinatal conditions: IUGR, FASD, - Productivity (secondary to loss of - Reduced opportunity for whaanau - Damage to whaanau property /
preterm birth, miscarriage sleep, noise disturbance, to access cultural institutions, possessions
- Neglect of children – emotional + emotional distress) social resources, and language - Sub-optimal housing conditions
physical - Current and future income / (secondary to marginalisation /
Whaanau - Developmental / behavioural resources for whaanau stigmatisation related to
disorders related to abuse / - Loss of family member support hazardous alcohol use of whaanau
neglect / FASD (directly from hazardous alcohol member)
- Injury/trauma/violence to use or indirectly through
whaanau + friends incarceration)
- Whaanau quality of life
- Injury/trauma to others - Loss of economic productivity as - Adverse effects at a collective level - Damage to public property /
- Healthcare opportunity costs of consequence of an individual’s on religious and cultural practices amenities
alcohol-related harms to health hazardous alcohol use, and impact - Increased alcohol-related offences
Community and wellbeing on workmates, employers and - Perception of unsafe public
businesses environment
- Opportunity cost of law, justice,
welfare, child protection and
education costs generated from
alcohol-related social harms
Source: Developed by author
162.2 Scope and selection of indicators
This report primarily explores health data sources. A data dictionary of potential indicators is
included in Appendix 1. The data dictionary was compiled based on exploration of health
datasets available in the DHB setting, scoping of a small number of non-health datasets,
advice from DHB colleagues, and information from key informants. It includes numerator
and denominator definitions, measures of frequency, geographical level of data, and brief
comments. It was intended that the data dictionary be used to ‘scope out’ a broad range of
possible indicators from which a small number would be selected for further exploration and
detailed analysis.
Eight indicators were selected and are described in the next section. Six are from health data
sources, while the remaining two, alcohol licence density and family harm, are from non-
health data sources. Indicators were chosen based on the following criteria:
Dataset readily available,
Indicators utilise data from different parts of the health system (e.g. inpatient
services, ED, Alcohol and Drug service),
Indicators reflect a range of severity grades (e.g. alcohol-involved ED encounters,
hospital admissions, deaths),
Indicators contribute towards the development of a complete alcohol-related harm
‘picture’ based on a broad definition of harm.
173 Selected alcohol-related harm indicators
The indicators selected for exploration and detailed analysis are listed in Table 4 and are
described in this section. Each indicator description includes a concise summary of the
definition, rationale, method, and notes for interpretation. Complete and more detailed
metadata for selected indicators is included in Appendix 2. Description of trends and a one
year snapshot has been produced when possible and is followed by a summary of insights
and recommendations.
Table 4: List of selected indicators
Determinants of alcohol-related harm
Hazardous alcohol use
Alcohol licence density
Hauora
Alcohol-specific mortality
Alcohol-specific hospital admissions
Alcohol-involved Emergency Department encounters
Paediatric outpatient appointments and Fetal Alcohol Spectrum Disorder
Alcohol and Drug Team contact
Family harm and alcohol
3.1 Determinants of alcohol-related harm
3.1.1 Hazardous alcohol use
Data sources and methodology
Definition: Prevalence of self-reported hazardous alcohol consumption, 15 years and over
Rationale: Alcohol-related harm is associated with volume and pattern of consumption.
Monitoring of alcohol use is recommended by the WHO (WHO, 2010). The Ministry of Health
(MOH) delivered New Zealand Health Survey (NZHS), a national population-based health
survey with a response rate of around 80%, reports on the prevalence of hazardous alcohol
use in New Zealand. Regional prevalence data is periodically published by the MOH. 2014-
2017 regional results exclude hazardous alcohol use.
Numerator: NZHS: Number of NZHS respondents, aged 15 and over, with Alcohol Use
Disorders Identification Tool (AUDIT) score of 8 or over
Denominator: NZHS: Number of NZHS respondents, aged 15 and over
Methodology: The NZHS includes the WHO developed AUDIT screening tool for adults aged
15 and over. A score of 8 points or more indicates hazardous drinking. District Health Board
(DHB) level data has been released for 2006/07 and 2011-2014. 2011-2014 results are based
on three years of data pooled (2011/12, 2012/13, 2013/14).Crude prevalence data were
extracted from MOH data tables2. Ethnicity was determined using the total response
method and is reported by the MOH as Maaori and non-Maaori at the DHB level.
2
Data tables available from https://www.health.govt.nz/publication/regional-results-2011-2014-new-zealand-
health-survey
18Notes on interpretation:
AUDIT data is self-reported and is a potential source of bias. Self-reported alcohol
consumption may differ from objectively measured data.
Crude prevalence is provided by the MOH and is used for analysis. Adjusted rate
ratios are provided by the MOH for 2011-2014 only.
Survey prevalence provides an estimate of population prevalence and may differ if
the NZHS sample is not representative of the population.
Distribution and trends
In CM Health between 2006/07 and 2011-2014, crude prevalence of hazardous alcohol use
has not significantly changed for males, females, and the total population. Male prevalence
remains more than twice the female prevalence (Figure 5). Hazardous alcohol use
prevalence is greatest in 15-24 year olds, followed by 25-44 year olds (Figure 6). Although
trends suggest a decline in prevalence for 15-24 and 65+ age groups and an increase in the
25-44 and 45-64 age groups, the difference is not statistically significant other than for
females aged 15-24 and 45-65. Prevalence by ethnicity has shown little change with time
(Figure 7)3. Percentage prevalence tables are included in Table 9 in Appendix 4.
Figure 5: Crude prevalence of hazardous alcohol use in CM Health, by sex, 2006/07 and 2011-2014
25
Crude prevalence %
20
15 Total
10 Female
Male
5
0
2006/07 2011-2014
Source: Crude prevalence obtained from NZHS Regional Reports (2006/07 and 2011-14); analysed by
CM Health
Figure 6: Crude prevalence of hazardous alcohol use in CM Health, by age group, 2006/07 and 2011-
2014
30
25
Crude prevalence %
20 15-24
15 25-44
10 45-64
5 65+
0
2006/07 2011-2014
Source: Crude prevalence obtained from NZHS Regional Reports (2006/07 and 2011-14); analysed by
CM Health
3
Differential age structures between Maaori and non-Maaori prevent direct comparison of crude prevalence by
ethnic group
19Figure 7: Crude prevalence of hazardous alcohol use in CM Health, by prioritised ethnicity, 2006/07
and 2011-2014
35
30
Crude prevalence %
25
20
Maaori
15
Non-Maaori
10
5
0
2006/07 2011-2014
Source: Crude prevalence obtained from NZHS Regional Reports (2006/07 and 2011-14); analysed by
CM Health
Hazardous alcohol use snapshot, 2011-2014
In 2011-2014, hazardous alcohol use crude prevalence is greatest in males aged 15-24 and
25-44 and females aged 15-24 (Figure 8). Prevalence is greater in males for both Maaori and
non-Maaori (Figure 9). The age adjusted rate ratio for Maaori vs non-Maaori was 1.95 for
men and 3.57 for women4, thus Maaori men are nearly two times and Maaori women nearly
four times more likely to have hazardous alcohol consumption than non-Maaori. Percentage
prevalence for age group and ethnicity by sex are included in Table 10 in Appendix 4.
Figure 8: Crude prevalence of hazardous alcohol use in CM Health with 95% confidence intervals, by
sex and age group, 2011-2014
50.0
40.0
Crude prevalence %
30.0
20.0
10.0
0.0
15–24 years 25–44 years 45–64 years 65+ years
Total Men Women
Source: Figure obtained from NZHS Regional Reports (2011-14)
4
Both rate ratios are statistically significant
20Figure 9: Crude prevalence of hazardous alcohol use in CM Health with 95% confidence intervals, by
sex and prioritised ethnicity, 2011-2014
70.0
60.0
Crude prevalence %
50.0
40.0
30.0
20.0
10.0
0.0
Māori Non-Māori
Total Men Women
Source: Figure obtained from NZHS Regional Reports (2011-14)
Insights and recommendations
The NZHS provides robust cross-sectional data that can be utilised to estimate
hazardous alcohol consumption.
Unadjusted results estimate the proportion of the population affected. Age-
standardised results are required to compare prevalences by ethnicity and sex over
time, or between different regions.
The release of data by Maaori, Pacific, Asian and Other ethnicity for larger DHBs,
such as CM Health, would enable more meaningful analysis.
Data availability prevents analysis at a more granular geographic level than DHB.
3.1.2 Alcohol licence density
Data sources and methodology
Definition:
Population density: Number of alcohol licences per 10,000 adults aged 15 years and over
Geographical density: Number of alcohol licences per 100km2
Rationale: Increased alcohol outlet density is associated with increased alcohol-related harm
(Connor, 2010). In Manukau City, higher density of alcohol outlets, particularly off-licence,
has been associated with more police events and motor vehicle accidents (Cameron et al.,
2012). The Alcohol Regulatory and Licensing Authority (ARLA) maintains alcohol licence data
providing the opportunity to inform understanding of local alcohol licence density.
Numerator: ARLA: Number of alcohol licences including on-licences, off-licences, and club
licences. Excludes special licences.
Denominator:
Statistics NZ (SNZ): Mid-year population estimates as at 30 June, aged 15 years and over
Land area in square kilometres, excluding area for water bodies
Methodology: Methodology is consistent with that used by healthspace, Massey University5.
Licence data as at 7 June 2016 was cleaned and addresses geocoded by EHI with a 99%
match rate. Crude density rates were calculated by CM Health for the number of total
licences as well as by the main categories of licences – on-licence, off-licence and club
licence. Results were suppressed for CAUs with populations of 30 or less.
5
Indicators and data available at http://www.healthspace.ac.nz/maps/maps_Alcohol.html
21Notes on interpretation:
Estimating alcohol availability from this indicator is not recommended. Licence
density reflects one aspect of alcohol availability and does not consider trading
hours.
Poor data quality limits indicator accuracy and infrequent updates limit the ability to
examine density over time.
Alcohol licence density snapshot
In NZ, CM Health, and the CM Health locality areas, the greatest proportion of alcohol
licences6 are on-licences, followed by off-licences and club licences respectively7. The
distribution of alcohol licence types in CM Health differs from NZ with proportionately more
off-licences in the CM Health geographical area (30%) compared with NZ (24%) (Table 5).
Alcohol licence density varies by licence type, CM locality, and density type (see Table 11 in
Appendix 4). Approximately one third of the total CM licences are located in Eastern and
Manukau localities respectively; however, nearly half (44%) of on-licences are located in
Eastern, over one third (36%) of off-licences in Manukau, and over one third (36%) of club
licences in Franklin.
Population densities by licence type, with the exception of on-licences, are greatest in
Franklin (Figure 10) – a locality with a comparatively large geographical area and small
population (see Table 1 for locality population and land area). Conversely, licence density
per 100km2 is greatest in localities with comparatively smaller geographical areas and larger
populations – such as Mangere/Otara and Manukau (Figure 11).
Table 5: Number and percentage of licences in CM Health and NZ, by licence type, as at 7 June 2016
On-licence Off-licence Club-licence Total licence
Number 371 202 104 677
CM Health
% of total 55% 30% 15% 100%
Number 6625 2727 1830 11182
NZ
% of total 59% 24% 16% 100%
Source: ARLA alcohol licence data from EHI, Massey University; analysed by CM Health
6
Excluding special licences – allows the sale or supply of alcohol to anyone attending an event
7
On-licence – allows the sale or supply of alcohol for consumption on the premises; off-licence – allows sale or
supply of alcohol for consumption off the premises; club-licence – allows the sale or supply of alcohol on club
premises
22Figure 10: CM Health alcohol licence density per 10,000 adults aged 15 years and over, by locality
and licence type, as at 7 June 2016
10,000 population (15+) 25
Licence density per
20
15
On licence
10
Off licence
5
Club licence
0
Total
Source: ARLA alcohol licence data from healthspace, Massey University; analysed by CM Health
2
Figure 11: CM Health alcohol licence density per 100km , by locality and licence type, at 7 June 2016
160
Licence density per 100km2
140
120
100
80 On licence
60
40 Off licence
20 Club licence
0
Total
Source: ARLA alcohol licence data from healthspace, Massey University; analysed by CM Health
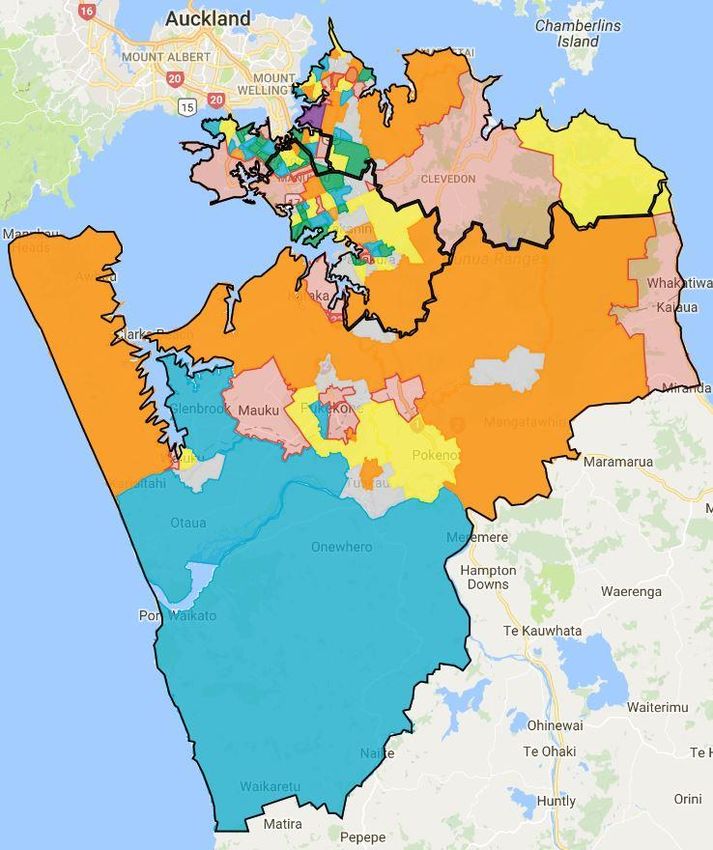
Licence density by census area unit (CAU) has been divided into five approximately equal
groups (quintiles). Quintile 1 contains the lowest fifth of data (least dense), and quintile 5
the highest fifth (most dense). Figure 12 describes licence density by 10,000 population aged
15 and over. An inverse relationship exists between licence density by population and CAU
population size. Average population8 of CAUs in quintile 1 is 3,899 and 2,601 in quintile 5.
Over half of CAUs in quintile 1 are located in Manukau. Nearly a third of CAUs in quintile 5
for licence density by population are located in Franklin (see Table 12 in Appendix 4).
Figure 13 describes CAU licence density by 100km2 land area. An inverse relationship is
apparent between licence density by land area and average CAU land area. Average land
area for CAUs in quintile 1 (114.2km2) is considerably larger than in quintile 5 (1.5km2).
Nearly two thirds of CAUs in quintile 1 are located in Franklin. Nearly half of CAUs in quintile
5 for area density are located in the Eastern locality (48%), particularly centred around East
Tamaki and Botany Downs, and over one third in Manukau (35%) (see Table 13 in Appendix
4).
8
Population aged 15 and over
23Figure 12: Total alcohol licence density per 10,000 adults aged 15 years and over in CM Health, by
CAU quintile
Legend
Density per 10,000
Quintile 1 1.6-4.7 No licence
9
Quintile 2 4.8-9.3 No data
Quintile 3 9.6-19.6
Quintile 4 19.8-35
Quintile 5 35.6-214.3
Source: ARLA alcohol licence data from healthspace, Massey University; analysed by CM Health
9
CAUs with populations less than 30 were excluded from population density calculations
242
Figure 13: Total alcohol licence density per 100km in CM Health, by CAU quintile
Legend
Density per 100km2
Quintile 1 0.4-31.8 No licence
Quintile 2 51.1-116.4
Quintile 3 124.7-202.7
Quintile 4 206.7-378.5
Quintile 5 419.0-1,772.5
Source: ARLA alcohol licence data from healthspace, Massey University; analysed by CM Health
25Insights and recommendations
This indicator is derived from a national dataset and could be produced for DHBs
throughout New Zealand.
Alcohol licence density, as an indicator of alcohol availability, differs considerably
depending on the denominator selection. Density per 100km2 measures the
temporal proximity of licenced premises and so considers geographical accessibility.
Density per 10,000 population measures the number of licences available to a
population and does not reflect geographical accessibility.
It is critical to consider the local context when selecting the licence density
denominator. For densely populated localities, such as Manukau, licence density per
100km2 better describes the spatial abundance of licenced premises surrounding
residents.
This indicator is limited by data quality issues. More complete data, including
address and more frequent updates, would improve indicator accuracy and enable
longitudinal analysis of density over time.
Data is available at CAU level and analysis possible by locality or Local Board Area
(LBA).
3.2 Hauora
3.2.1 Alcohol-specific mortality
Data sources and methodology
Definition: Deaths where alcohol-specific conditions10 are an underlying or contributory
cause, all ages, age standardised rate per 100,000 population
Rationale: Alcohol use is the eighth leading risk factor overall, and leading risk factor in the
15-49 age group, for mortality in New Zealand (IHME, 2016). Alcohol-specific mortality rate
is used internationally to report alcohol-related harm. Mortality data are routinely collected
in New Zealand and include recording one, and only one, underlying cause of death and any
contributory causes.
Numerator: Mortality Collection (MORT) Dataset: Number of deaths where alcohol-specific
conditions are a cause of death (five years pooled) based on underlying and contributory
cause of death registered in the calendar year, all ages
Denominator: SNZ: Mid-year population estimates as at 30 June, five years pooled, all ages
Methodology: Mortality rates have been derived from analysis of encrypted (anonymised)
National Health Index (NHI) event data from MORT, 2005-2014. Deaths with alcohol-specific
conditions coded as the underlying cause of death (diagnosis type D) or selected
contributory cause B1 and B2 (diagnosis type F and G) were extracted and analysed. Small
numbers required the pooling of five years data. Numbers have been suppressed and
excluded when less than five. Ethnicity was determined from the prioritised method11. Direct
age standardisation was based on the WHO World Standard Population. Small numbers
prevented snapshot analysis.
Notes on interpretation:
This indicator estimates the mortality rate from conditions wholly attributable to
alcohol. It is not an estimate of broader alcohol-related mortality. Partially
attributable conditions, such as cancer, are excluded.
10
Alcohol-specific conditions are wholly attributable to alcohol and are defined in Appendix 3
11
A single ethnic group is allocated to each person using a priority system: Maaori, Pacific Peoples, Asian, Other
groups except NZ European, and NZ European)
26You can also read