Data assimilation impact studies with the AROME-WMED reanalysis of the first special observation period of the Hydrological cycle in the ...
←
→
Page content transcription
If your browser does not render page correctly, please read the page content below
Nat. Hazards Earth Syst. Sci., 21, 463–480, 2021
https://doi.org/10.5194/nhess-21-463-2021
© Author(s) 2021. This work is distributed under
the Creative Commons Attribution 4.0 License.

Data assimilation impact studies with the AROME-WMED
reanalysis of the first special observation period of the
Hydrological cycle in the Mediterranean Experiment
Nadia Fourrié, Mathieu Nuret, Pierre Brousseau, and Olivier Caumont
CNRM, Université de Toulouse, Météo-France, CNRS, Toulouse, France

Correspondence: Nadia Fourrié (nadia.fourrie@meteo.fr)

Received: 7 May 2020 – Discussion started: 25 May 2020
Revised: 12 November 2020 – Accepted: 5 December 2020 – Published: 1 February 2021

Abstract. This study was performed in the framework of           the forecast quality, but this impact is not statistically signif-
HyMeX (Hydrological cycle in the Mediterranean Exper-            icant. The assimilation of the Spanish radar data improves
iment), which aimed to study the heavy precipitation that        the 3 h precipitation forecast quality as well as the short-
regularly affects the Mediterranean area. A reanalysis with      term (30 h) precipitation forecasts, but this impact remains
a convective-scale model AROME-WMED (Application of              located over Spain. Moreover, marginal impact from wind
Research to Operations at MEsoscale western Mediter-             profilers was observed on wind background quality. No im-
ranean) was performed, which assimilated most of the avail-      pacts have been found regarding lidar data, as they represent
able data for a 2-month period corresponding to the first spe-   a very small data set, mainly located over the sea.
cial observation period of the field campaign (Fourrié et al.,
2019). Among them, observations related to the low-level
humidity flow were assimilated. Such observations are im-
                                                                 1   Introduction
portant for the description of the feeding of the convective
mesoscale systems with humidity (Duffourg and Ducrocq,           Heavy precipitation regularly affects the Mediterranean area
2011; Bresson et al., 2012; Ricard et al., 2012). Among          with huge damages and sometimes casualties. One of the
them there were a dense reprocessed network of high-quality      aims of the Hydrological cycle in the Mediterranean Experi-
Global Navigation Satellite System (GNSS) zenithal total de-     ment (HyMeX; Drobinski et al., 2014) was to study the high-
lay (ZTD) observations, reprocessed data from wind profil-       impact weather events, especially during the first special ob-
ers, lidar-derived vertical profiles of humidity (ground and     servation period (SOP1; Ducrocq et al., 2014), which took
airborne) and Spanish radar data. The aim of the paper is        place in autumn 2012 (5 September–6 November 2012) in
to assess the impact of the assimilation of these four obser-    the northwestern Mediterranean. The importance of an accu-
vation types on the analyses and the forecasts from the 3 h      rate description of the low-level humidity flow, which feeds
forecast range (first guess) up to the 48 h forecast range. In   the mesoscale systems, was shown in previous studies (Duf-
order to assess this impact, several observing system experi-    fourg and Ducrocq, 2011; Bresson et al., 2012; Ricard et al.,
ments (OSEs) or so-called denial experiments, were carried       2012). This is why during this period research observations
out by removing one single data set from the observation data    were deployed over the northwestern Mediterranean area.
set assimilated in the reanalysis.                               These observations aimed at a better description of the hu-
   Among the evaluated observations, it is found that the        midity and wind fields. As an example, water vapour lidars
ground-based GNSS ZTD data set provides the largest im-          were deployed at Candillargues and Menorca island (pink
pact on the analyses and the forecasts, as it represents an      dots in Fig. 1). Particular attention was also paid to the con-
evenly spread and frequent data set providing information at     trol of data quality.
each analysis time over the AROME-WMED domain. The
impact of the reprocessing of GNSS ZTD data also improves

Published by Copernicus Publications on behalf of the European Geosciences Union.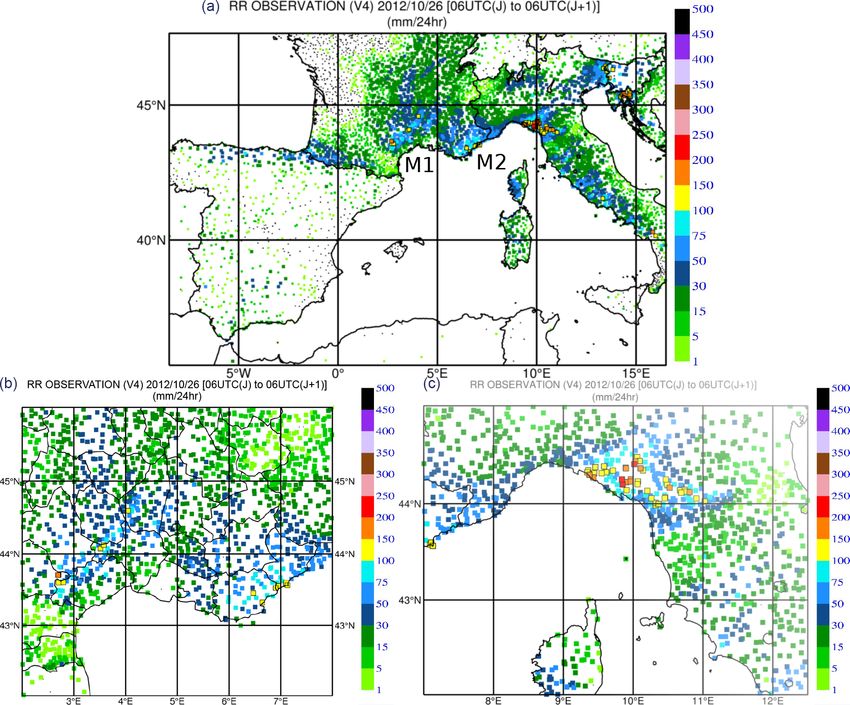
464 N. Fourrié et al.: Data assimilation impact studies with the final AROME-WMED reanalysis of the HyMeX SOP1

Figure 1. Location of observations considered in this study, with the exception of GNSS zenithal total delays. Wind profilers are depicted
with blue squares; ground-based lidars are depicted with pink dots; assimilated LEANDRE II (Lidar Embarqué pour l’étude des Aérosols,
Nuage, Dynamique, Rayonnement et Espèces minoritaires) airborne profiles are depicted with purple dots; and Spanish radars are depicted
with orange symbols. Red symbols correspond to the French radar locations.

   Another important element to better understand the key              ground-based and airborne lidars. Reprocessing after the
processes related to the high precipitation and their fore-            campaign was also performed for the wind profiler data (Saïd
casting is the convective-scale modelling. For many years,             et al., 2016) and the ground-based GNSS (Global Navigation
such numerical weather prediction models have been imple-              Satellite System) zenithal total delays (ZTDs) (Bock et al.,
mented in operations to enhance the forecast quality. In addi-         2016) to improve data quality and filter out bad data.
tion, the forecast quality depends on their initial atmospheric           Previous impact studies were already performed for this
conditions, which are determined with a data assimilation              type of observation in other contexts. For example, Bielli
system.                                                                et al. (2012) and Grzeschik et al. (2008) tested the impact
   For the HyMeX SOP1 campaign, an AROME (Applica-                     of the assimilation of water vapour lidars in mesoscale mod-
tion of Research to Operations at MEsoscale; Seity et al.,             els and found a positive impact of such an assimilation up
2011) version was developed and ran in real time to forecast           to the 24 h forecast range. Benjamin et al. (2004) studied the
and study heavy precipitation in this region: the AROME-               impact of a wind profiler network and obtained a positive im-
WMED (western Mediterranean) model (Fourrié et al.,                    pact on short-range (3–12 h) forecasts. Concerning the GNSS
2015). This model is cantered over the western Mediter-                data, Mahfouf et al. (2015) showed systematic improvements
ranean basin and includes a data assimilation system, which            of the atmospheric-humidity short-range forecasts and of the
provides every 3 h an analysis of the meteorological situ-             structure and the location of precipitation in the AROME
ation. In the framework of the Innovative Observing and                models as found previously in a heavy precipitation context
Data Assimilation Systems for severe weather events in the             (Boniface et al., 2009). These results agree well with pre-
Mediterranean (IODA-MED) project, two reanalyses were                  vious studies performed in other numerical weather predic-
performed after the campaign (Fourrié et al., 2019) with the           tion (NWP) models (Macpherson et al., 2008; Gutman et al.,
aim of providing new references for process studies. The first         2004).
one intended to provide a homogeneous data set of atmo-                   As previously mentioned, an accurate description of the
spheric fields (which was not the case in the real-time ver-           low-level humidity flow is required to simulate the evolution
sion due to a system upgrade in the middle of the SOP1).               of the mesoscale system well. The aim of the study presented
The second one included in addition a maximum of observa-              here is to quantify the impact of four observation systems
tions deployed during the SOP1 field campaign with a more              on the quality of precipitation simulation. These observa-
recent version of the model. The latter will be considered in          tion data sets, assimilated in the AROME-WMED reanaly-
this study.                                                            sis of the SOP1, provided information on the atmospheric-
   Among the research observations assimilated in the                  humidity distribution and the wind circulation, hence de-
AROME-WMED reanalysis were the humidity profiles from                  scribing the moisture flux of the low-level flow. The observa-

Nat. Hazards Earth Syst. Sci., 21, 463–480, 2021                                         https://doi.org/10.5194/nhess-21-463-2021
N. Fourrié et al.: Data assimilation impact studies with the final AROME-WMED reanalysis of the HyMeX SOP1 465

tions are the reprocessed ZTDs from the ground-based GNSS            Initial atmospheric states of AROME-WMED come every
(Bock et al., 2016), the humidity profiles from ground-based      3 h from 3D-Var analyses assimilating observations within
and airborne lidars (Chazette et al., 2016; Di Girolamo et al.,   a ±1 h 30 min assimilation window. This system analyses
2016), reprocessed wind profiler data (Saïd et al., 2016), and    the two components of horizontal wind, temperature, spe-
the Doppler winds and reflectivities from the Spanish radars.     cific water vapour humidity and surface-pressure fields on
To achieve this, a number of denial data assimilation exper-      the model grid at full resolution. The other prognostic model
iments, consisting in removing one observation type, were         fields (turbulent kinetic energy, pressure departure from hy-
carried out during the 2-month period of the SOP1.                drostatism, vertical divergence and specific content of five
   The paper is arranged as follows. Section 2 describes the      condensed water species) are not updated by the analyses but
AROME-WMED configurations, the observation data sets              copied from the background. The background error statis-
and the denial experiments. Section 3 assesses the impact of      tics are climatological. Based on the Berre (2000) multivari-
the ground-based GNSS data assimilation on the analyses,          ate formulation, cross covariances between errors for differ-
the background and the forecast quality during the SOP1.          ent physical quantities are represented using scale-dependent
Section 4 provides information on the impact of other obser-      statistical regressions, including an extra balance relationship
vation types (i.e. wind profilers, lidars and Spanish radars).    for specific humidity. The background error statistics have
Section 5 focusses on the impact of all these data on the         been calculated using forecast differences from AROME-
IOP16a (Intensive Observation Period) case study. Finally,        WMED ensemble data assimilation (Brousseau et al., 2011,
conclusions are given in Sect. 7.                                 approach) over a 15 d period of the HyMeX SOP1 (17 to
                                                                  31 October 2012) to be representative of the encountered
                                                                  meteorological conditions of the SOP1 on average. More
2     Sensitivity study description and validation                details on these background error covariances are available
      methodology                                                 in Fourrié et al. (2019). Lateral boundary conditions are
                                                                  hourly provided by the global NWP ARPEGE (Action de
2.1    “Denial” experiment methodology
                                                                  Recherche Petite Echelle Grande Echelle; Courtier et al.,
To study the contribution of the observations on the analy-       1991) forecasts which also benefited from a maximum of as-
sis and forecast quality of the heavy-precipitation events of     similated observation with longer cutoff analyses. Each day
the SOP1, denial experiments have been devised. These ex-         at 00:00 UTC, a 54 h forecast is run. Conventional observa-
periments consist of removing one observation data set to         tions (from radiosondes, aircraft, surface stations, wind pro-
compare its forecast quality with the reanalysis simulations,     filers and GNSS ZTDs), radar data and satellite observations
where all observations are assimilated. Here, denial exper-       (infrared and microwave radiances, atmospheric motion vec-
iments were conducted on the following four observation           tors, and ocean surface winds from scatterometers) were as-
types: the ground-based GNSS ZTDs, the wind profilers, the        similated.
water vapour lidars and Spanish radars. They were performed          Table 1 presents the distribution of assimilated data in RE-
with the AROME-WMED model.                                        ANA as a function of observation types. Satellite data rep-
                                                                  resent the majority of observations. This can be explained
2.2    AROME-WMED configuration                                   by the fact that the Infrared Atmospheric Sounding Interfer-
                                                                  ometer (IASI) sensor provides 44 channels per observation
The different AROME-WMED model configurations are de-             point. Surface observations provide 15.21 % of assimilated
scribed in Fourrié et al. (2015, 2019) and rely on the op-        data. Aircraft and radiosondes give a similar amount of data
erational limited-area model AROME (Seity et al., 2011;           (around 8 %). GNSS ZTDs represent 1.85 % of the total, and
Brousseau et al., 2016) version running at Météo-France           wind profilers represent 1.17 %. Special efforts were made
since 2008. At the time of the SOP1 campaign, analyses were       to assimilate non-operational data types such as lidar water
performed at a 2.5 km horizontal resolution every 3 h with a      vapour profiles and Spanish radar data. Humidity data from
3D variational data assimilation (3D-Var; Brousseau et al.,       lidar contribute a very small amount of assimilated data at
2011). The AROME-WMED version used in this study as               0.12 %. Radar data represent 11.88 % of the total amount of
the reference is the second reanalysis one, named hereafter       assimilated data, and Spanish ones only represent 0.6 %.
REANA. An extensive description of this reanalysis can be
found in Fourrié et al. (2019). The main components are re-       2.3   Description of the studied observing systems
called here. The REANA data set has a 2.5 km horizontal
resolution, and the model has 60 vertical levels from 10 m        As mentioned above, four observing systems were studied.
above the surface to 1 hPa. Deep convection is explicitly re-     The location of these observations is shown in Fig. 1, except
solved, and a one-moment microphysical scheme with five           for the ground-based GNSS ZTD location, which is available
classes of hydrometeors is used (Pinty and Jabouille, 1998;       in Fig. 4 of Fourrié et al. (2019).
Caniaux et al., 1994).

https://doi.org/10.5194/nhess-21-463-2021                                  Nat. Hazards Earth Syst. Sci., 21, 463–480, 2021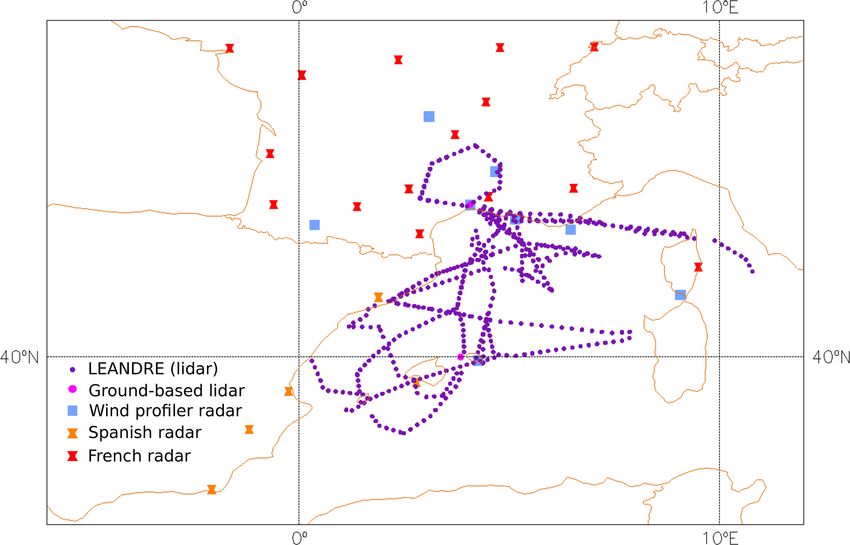
466 N. Fourrié et al.: Data assimilation impact studies with the final AROME-WMED reanalysis of the HyMeX SOP1

Table 1. Sorted amounts of assimilated data in REANA over the      2.3.2   Wind profilers
SOP1 period (5 September–5 November 2012).
                                                                   Data from eight wind profiler radars (sounding in VHF
          Observation type           Amount     Percentage         or UHF bands) were assimilated in AROME-WMED (see
                                                                   Fig. 1). These profilers provided vertical profiles of the wind
          Satellites                8 663 312     53.00 %
          Surface stations          2 485 620     15.21 %
                                                                   vector, turbulence, precipitation, and height of the atmo-
          Radars                    1 942 539     11.88 %          spheric boundary layer and tropopause (Saïd et al., 2016).
          Spanish radars               97 847       0.6 %          The measure principle is described in Annex 1 of Saïd et al.
          Aircraft                  1 413 313      8.65 %          (2016). Profilers measure the Doppler radial spectra of the
          Radiosondes               1 319 523      8.07 %          returned signal backscattered by various types of targets. In
          GNSS ZTD                    302 191      1.85 %          order to derive the three components of the wind, most of
          Wind profiler               191 012      1.17 %          the HyMeX profilers use five beams. These data were avail-
          Lidars                       19 470      0.12 %          able for the whole SOP1 in real time and have been repro-
          Total                    16 346 191       100 %          cessed after the SOP1 by Saïd et al. (2016) with an improved
                                                                   quality control to remove spurious data. Here, observations
                                                                   from eight wind radars (UHF and VHF) mainly located in the
                                                                   south of France, in Corsica and in Menorca (Fig. 1) were con-
2.3.1   GNSS zenithal total delays
                                                                   sidered. These observations are assimilated as vertical pro-
GNSS ZTD provides useful information on precipitable wa-           files of horizontal wind.
ter and pressure at a high temporal frequency and in all
                                                                   2.3.3   Lidars
weather conditions. In REANA2, we considered here repro-
cessed data (REPROC-GNSS in the following) with a ho-              During the SOP1, ground-based and airborne lidars were op-
mogeneous reprocessing using a single software and more            erated. The mobile Water vapour and Aerosol LIdar (WALI;
precise satellite orbit position and clocks (Bock et al., 2016),   Chazette et al., 2016) operates with an emitted wavelength of
which were available for the whole SOP1. Additional data           354.7 nm. This instrument was operated at a site close to Ciu-
were also considered compared to the operational and data          tadella (western part of Menorca located near 39◦ 590 0700 N,
set available in near real time. This data set, called hereafter   3◦ 500 1300 E). Mixing ratio profiles were delivered with a res-
OPERGNSS, is provided by E-GVAP (EUMETNET EIG –                    olution of 15 m for the 0–6000 m altitude range. A detailed
Network of European Meteorological Services – GNSS wa-             description of this instrument can be found in Chazette et al.
ter VApour Programme), and ZTD data for one reception sta-         (2016). The raw vertical resolution of the data is 75 m, but for
tion may be available for more than 10 processing centres.         assimilation above 2000 m, the resolution was thinned start-
These ZTD data are assimilated according the methodology           ing from 75 to 450 m above 5000 m.
described in Mahfouf et al. (2015). The model equivalent is           The second ground-based lidar, the BASIL instrument
computed with the following equation (Mahfouf et al., 2015):       (University of BASILicata Raman lidar system; Di Giro-
                Zztop                                             lamo et al., 2016) was located in Candillargues in the south
           −6                 p      e                            of France. The original data resolution is 30 m, but data
ZTD = 10                 k1     + k3 2 dx,                   (1)
                              T     T                              were thinned at 60 m below 1000 m, increasing up to 420 m
                0                                                  above 4000 m in the assimilation. For WALI, 292 mixing ra-
where p is the pressure, T is the temperature, e is the water      tio profiles were assimilated in REANA, covering the pe-
vapour pressure, k1 = 0.776 Pa−1 K and k3 = 3730 Pa−1 K2 ,         riod 17 September at 03:00 UTC to 27 October 2012 at
x is the height above the ground, and ztop is the height           21:00 UTC, whereas for BASIL, 172 profiles were assim-
of the model top. After a monitoring of the difference be-         ilated, covering the period 10 September at 09:00 UTC to
tween observations and model equivalent, observations with         5 November 2012 at 15:00 UTC.
good statistics are selected from a “white list”. ZTD data are        Concerning the LEANDRE II lidar (Chazette et al.,
also bias-corrected, and an updated bias correction for each       2016) on board ATR 42 aircraft, data were available for
GNSS station was also computed in the REANA2 version.              22 analysis slots (512 assimilated profiles), covering the pe-
They are finally assimilated if they pass the first-guess qual-    riod 11 September at 09:00 UTC to 25 October 2012 at
ity control which rejects data too far from the model back-        21:00 UTC. Profiles with a 150 m vertical resolution were
ground. Only one observation per 3 h assimilation and per          thinned at a 15 km horizontal resolution and are mainly lo-
surface station is assimilated for each analysis. Please refer     cated over the Mediterranean Sea (Fig. 1).
to Mahfouf et al. (2015) for more information on the data
assimilation of GNSS ZTD in AROME.

Nat. Hazards Earth Syst. Sci., 21, 463–480, 2021                                    https://doi.org/10.5194/nhess-21-463-2021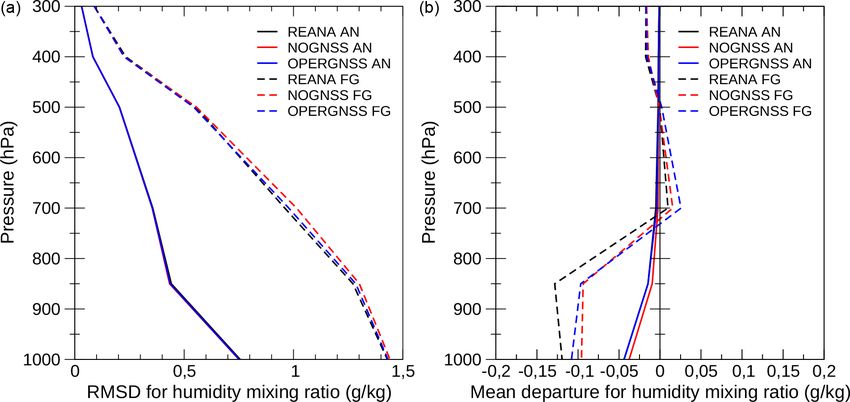
N. Fourrié et al.: Data assimilation impact studies with the final AROME-WMED reanalysis of the HyMeX SOP1 467

2.3.4    Spanish radars                                            NORADSPAIN experiment was run without any data from
                                                                   the five Spanish radars. A total of 97 847 observations, rep-
Doppler radial winds and reflectivities from five Spanish          resenting 0.6 % of the total number of assimilated observa-
radars located in Barcelona, Valencia, Almeria, Murcia and         tions, were removed in the NORADSPAIN experiments.
Palma de Mallorca and provided by AEMET (Agencia Es-                  As shown in Table 2, the largest differences in terms of
tatal de Meteorología) were assimilated in REANA. After            the number of assimilated observations are obtained with
a strict quality control check to exclude data with gross er-      NOGNSS, which leads to a 1.85 % difference in the amount
rors, only the three lowest elevations were considered for         of assimilated data.
the assimilation. Doppler winds are assimilated in the 3D-
Var of AROME according the method described by Mont-               2.5   Validation protocol
merle and Faccani (2009), and reflectivity data are assimi-
lated as pseudo-observations of relative humidity profiles as      As a first step, the performance of the data assimilation sys-
proposed in Caumont et al. (2010) and implemented in Wat-          tem is validated by comparing the various analysis (AN) and
trelot et al. (2014).                                              first-guess (FG) values against available observations which
   Several procedures are applied to raw data in order to          can be independent from REANA (i.e. not assimilated) or
avoid erroneous measurements entering the minimization as          on the contrary assimilated in REANA. One of the key tools
much as possible. An observation operator allows for simu-         used to evaluate the performance of the assimilation system
lating radial Doppler winds measurements from the model            is to examine the FG departure (O FG) and the AN depar-
horizontal wind based on Caumont and Ducrocq (2008).               ture (O AN) in terms of mean and root mean square (RMS)
Only measurements performed within 150 km of the radar             values, with O standing for observation with the other assim-
are considered due to the broadening of the beam with in-          ilated observations. Statistics of departures are computed at
creasing distance and the lack of reliability. An observation      the observation location.
error variance proportional to the distance from the radar is         Those statistics were also computed using a small amount
applied in the minimization. Reflectivities are not directly as-   of available independent data. The first source comes from
similated, but they are used to retrieve pseudo-observations       the vessel Marfret Niolon, which was an instrumented com-
of relative humidity from surrounding simulated reflectivity       mercial ship of opportunity, cruising regularly between the
profiles through a unidimensional Bayesian inversion. A hor-       southern French harbour of Marseille and two Algerian har-
izontal thinning on the data (Doppler winds and retrieved          bours (Algiers and Mostaganem). Please refer to Fig. 14 of
profiles of relative humidity) is performed to avoid horizontal    Fourrié et al. (2019) for the trajectories of the vessel dur-
correlation of observation errors: only one profile, having the    ing the SOP1. Two autonomous systems were installed in
most important number of elevations that passed the quality        order to provide atmospheric and oceanic measurements, in
control, is selected in each 15 × 15 km2 box.                      the context of the HyMeX long observation period (LOP).
                                                                   A GNSS antenna was installed on the front of the Marfret
2.4     Description of the experiments                             Niolon for the duration of the HyMeX campaign. The data
                                                                   were post-processed in kinematic precise point positioning
Table 2 summarizes the names of the denial experiments             with the software provided by Natural Resources Canada
and the observations considered. Five experiments were con-        (Kouba and Héroux, 2001) and using high-resolution prod-
ducted over the 2-month period of the SOP1 (from 5 Septem-         ucts provided by the International GNSS Service.
ber to 5 November 2012). They all used the same configura-            The second source of independent data comes from wind
tion of AROME-WMED, with the differences lying in the              data obtained from an airborne Doppler cloud profiler radar
observations assimilated. For each experiment, it differs by       named RASTA (Radar Airborne System Tool for Atmo-
only one observation type from the reanalysis (REANA) used         sphere; Bouniol et al., 2008; Protat et al., 2009; Delanoë
as the reference. This allows for evaluating the impact of this    et al., 2013) that flew 45 d during the SOP1. This airborne
observation type on the analysis and the forecast. Among           radar was on board the Falcon 20 research aircraft. It allows
the five experiments, two experiments deal with the impact         for the documentation of the microphysical properties and
of GNSS ZTD. The first one, NOGNSS, is obtained by re-             the horizontal components of the wind field in terms of ver-
moving the REPROC-GNSS ZTD from the assimilation. The              tical profiles.
second, called OPERGNSS, aimed to evaluate the impact of              The operational data assimilation monitoring procedure
the REPROC-GNSS data set provided by Bock et al. (2016)            also provides FG and AN departure statistics for assimilated
compared to the OPERGNSS data set provided by E-GVAP.              observations in the experiments, which are described in a
The E-GVAP data set was thus assimilated after replacing           companion paper (Fourrié et al., 2019).
that of Bock et al. (2016) in OPERGNSS. The NOLIDAR                   In a second step, the forecast (range between +3 and
experiment is the run with neither airborne nor ground-based       +54 h) quality is assessed in terms of surface parameters
lidar data in the data assimilation. The NOWPROF experi-           and precipitation scores. The surface parameters (tempera-
ment is obtained by removing the wind profiler data, and the       ture and relative humidity at 2 m and wind at 10 m) come

https://doi.org/10.5194/nhess-21-463-2021                                   Nat. Hazards Earth Syst. Sci., 21, 463–480, 2021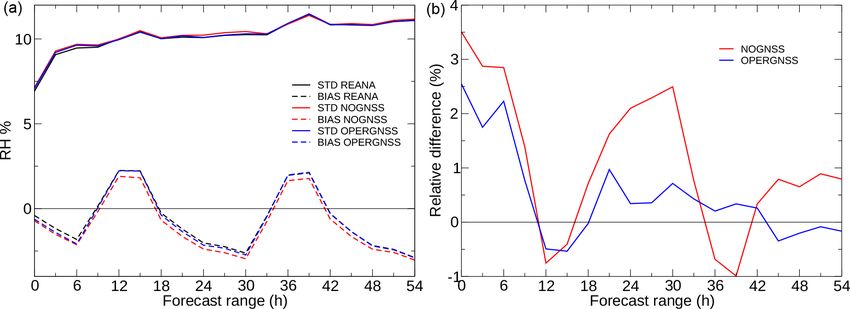
468 N. Fourrié et al.: Data assimilation impact studies with the final AROME-WMED reanalysis of the HyMeX SOP1

Table 2. Description of the data denial experiments discussed in this study and difference (in %) in the amount of assimilated data compared
to the reanalysis REANA.

                   Experiment name      Description                                                          Difference
                                                                                                             (%) in the
                                                                                                             number of
                                                                                                            assimilated
                                                                                                                   data
                   REANA                AROME − WMED reanalysis (second); see Fourrié et al. (2019)
                   NOGNSS               REANA − reprocessed GNSS ZTD                                           −1.86 %
                   OPERGNSS             NOGNSS + operational GNSS ZTD                                          −1.04 %
                   NOLIDAR              REANA − lidar                                                          −0.15 %
                   NOWPROF              REANA − wind profilers                                                 −1.12 %
                   NORADSPAIN           REANA − Spanish radars                                                  −0.6 %

from the HyMeX database, which provides surface synoptic                ANA, as the information from this data set is assimilated
observations available over the AROME-WMED domain, to-                  in this experiment) indicates that the best correlation, as ex-
gether with additional hourly observations from the Météo-              pected, is obtained for REANA (around 0.99), with the sec-
France, AEMET and MeteoCat (Meteorological Service of                   ond one being OPERGNSS (around 0.975) and the last one
Catalonia) mesoscale networks. Some of these observations               being NOGNSS (around 0.96), as shown in Fig. 2. This re-
were assimilated to produce surface analyses. For the evalu-            sult is confirmed when computing the RMSE of the differ-
ation of the precipitation quality, the dense surface data set          ences (Fig. 2, right panel). A weak diurnal cycle of the scores
rain gauge network available in the HyMeX database (ver-                is noticed with a maximum correlation around 09:00 UTC
sion V4, https://doi.org/10.6096/MISTRALS-HyMeX.904)                    and a minimum around 15:00 UTC. Concerning the stan-
has been used. Scores of 3-hourly accumulated precipitation             dard deviation of the differences, they are lower during the
from all analysis times on a given day are compared to the              03:00–09:00 UTC period and larger in the afternoon. This
corresponding observed 24 h accumulated precipitation.                  minimum of correlation and maximum of standard deviation
   The evaluation of the various denial experiments is com-             correspond to the time of the early stage of the convection,
pared with the reference REANA run. This allows for getting             which is less easy to predict and introduces inhomogeneities
the impact of each considered observation type on the analy-            in the water vapour distribution due to precipitation processes
sis and the forecast.                                                   (condensation, evaporation, cold-pool formation, etc.).
                                                                           We then discuss the result of the statistics for the analysis
                                                                        and first guess against radiosonde observations, which repre-
3     Impact of GNSS data on the analysis and first-guess               sents a reference data set in data assimilation (Fig. 3). First
      quality                                                           of all, as expected, the AN RMS difference (solid lines) is
                                                                        smaller than the FG difference (dashed lines) for the three
This section investigates the impact of assimilating the
                                                                        simulations, showing the expected behaviour of the mini-
ground-based GNSS ZTD data on the numerical weather pre-
                                                                        mization during the assimilation process, with differences
diction model analysis and subsequent forecast quality. This
                                                                        between the observing system experiments (OSEs; Fig. 3).
data set represents the largest one in terms of the number of
                                                                        No impact can be seen on the AN RMS differences. The
studied observation types, event though in the end it repre-
                                                                        absence of impact can be explained by the fact that ra-
sents only a small fraction of assimilated data (1.85 %) in the
                                                                        diosondes are reference observations for assimilation and
analyses (Table 1). As seen in Table 1, satellite data are the
                                                                        that all the analyses are very constrained by these obser-
most numerous, followed by surface station data, radar data
                                                                        vations. However, a small positive impact is present on the
from the French network, aircraft data and radiosonde data.
                                                                        FG RMS difference 3 h later. The lowest differences are ob-
Even if surface data provide information only for one level,
                                                                        tained with REANA FG, and the largest ones are obtained
the network is very dense over France and was reinforced
                                                                        with NOGNSS FG. OPERGNSS FG differences are close to
in other countries like Spain or Italy. The other observation
                                                                        REANA FG but slightly larger, showing on the one hand that
types provide information at different levels all along the ver-
                                                                        the assimilation of GNSS data is beneficial (OPERGNSS or
tical.
                                                                        REPROC-GNSS data sets) and on the other hand that the
3.1    Impact on moisture field                                         reprocessing of the data brings a small improvement in the
                                                                        comparison of FG with humidity of radiosondes. This shows
Comparison to the integrated water vapour (IWV) from the                that the modifications in the analysis brought by the GNSS
reprocessed GNSS observations (not independent from RE-                 at places other than radiosondes ones are beneficial and kept

Nat. Hazards Earth Syst. Sci., 21, 463–480, 2021                                          https://doi.org/10.5194/nhess-21-463-2021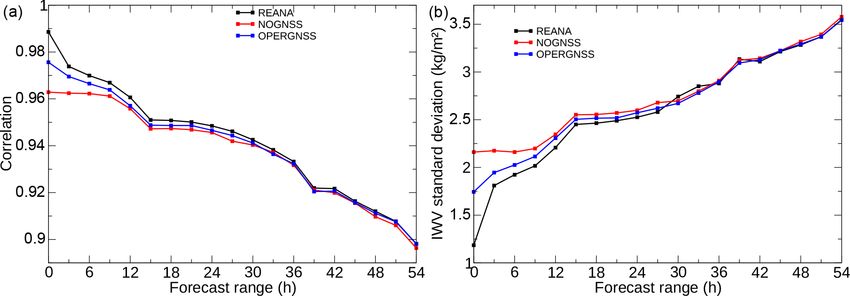
N. Fourrié et al.: Data assimilation impact studies with the final AROME-WMED reanalysis of the HyMeX SOP1 469
Figure 2. Correlation (a) and standard deviations (b, in kg m−2 ) of integrated water vapour (IWV) content from reprocessed GNSS obser-
vations (Bock et al., 2016) and AROME-WMED analyses (REANA in black, NOGNSS in red and OPERGNSS in blue) as a function of the
analysis slot (h).
during the 3 h forecast. The largest improvement of the as- when compared to the mean observation in grey shown in
similation of GNSS data is found between 600 and 850 hPa, Fig. 4. The magnitude of this relative positive (moist) bias is
with NOGNSS FG being larger than REANA FG and OP- around 0.5 %. Table 3 shows the mean correlation of RE-
ERGNSS FG in this part of the atmosphere. In addition, OP- ANA, NOGNSS and OPERGNSS AN and FG with Mar-
ERGNSS FG is larger than REANA FG between 700 and fret Niolon observations. The higher correlation is obtained
850 hPa, showing a slight benefit of assimilating REPROC- with REANA for both AN and FG. When comparing the
GNSS instead of OPERGNSS. mean value of ZTD at the Marfret Niolon places, the closest
The various AN mean departures are very close to each value to the observed one is obtained with REANA, even if a
other, with slight negative values in the lower and mid tro- small moist bias is observed (0.9 mm). This bias is larger for
posphere (analysis too moist), as displayed in the right panel NOGNSS (3.6 mm) and OPERGNSS (4.8 mm). This could
of Fig. 3. Mean FG departures are larger and homothetic, be explained by the fact that there few assimilated observa-
with stronger values for REANA FG, being the signature of tions over the sea, which results in a more biased model.
a weak moist bias in the corresponding analysis for the lower Although the sample size of the Marfret Niolon data set is
troposphere. The less biased first guess is the one from the rather small (around 1000 collocations), this is an original
NOGNSS experiment. result and makes clear that the REANA experiment produces
In addition, AN and FG were compared with radiances the best reanalysis and the best 3 h forecasts.
from the Spinning Enhanced Visible and Infrared Imager
(SEVIRI) on board the geostationary satellite Meteosat 3.2 Impact on wind field
Second Generation (MSG), which is sensitive to moisture
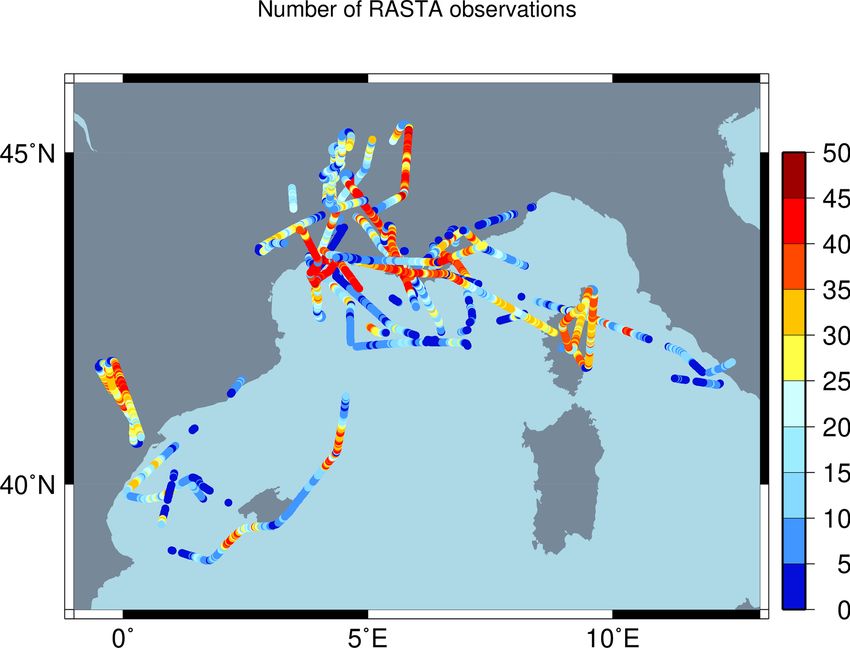
(WV channels 6.2 µm for the upper troposphere and 7.3 µm Analysis and first-guess quality has been evaluated against
for the mid troposphere). This imager indeed represents an- RASTA (Radar Airborne System Tool for Atmosphere)
other important source of humidity information, especially Doppler winds (Borderies et al., 2019a). This airborne radar
over oceans where information from neither GNSS nor ra- was on board Falcon 20 aircraft and provided 33 083 wind
diosondes is available. These humidity channel data are as- observations over the Mediterranean area as illustrated in
similated for each of the AROME-WMED analyses. The Fig. 5, where only a small amount of wind data from con-
study of the FG and AN statistics for REANA, OPERGNSS ventional observations is available. It is worth reminding that
and NO GNSS shows no impact between the various exper- the data from this instrument were not assimilated in RE-
iments for these observations (not shown, Table S1 in the ANA. This data set thus represents additional independent
Supplement). information for the evaluation of our denial experiments.
The correlation between the various AROME-WMED Table 4 provides the RMS error (RMSE) values for wind
ZTD AN and corresponding independent (not assimilated) calculated with these data. The RMSE for background and
Marfret Niolon observations is higher for REANA than for analysis is lower in REANA than in the other two experi-
NOGNSS and even for OPERGNSS (Fig. 4). There is a ments. The analysis RMSE for OPERGNSS is lower than
correlation maximum around 09:00 UTC and a minimum the one for NOGNSS.
around 15:00 UTC. The mean ZTD is quite similar in all ex- As GNSS observations do not provide any wind infor-
periments, with a maximum at 09:00 UTC and a minimum mation, the improvement observed in wind field can be ex-
around 00:00 UTC. A moist bias is found in all simulations plained by the effect of mass field information assimilation
on the wind field, essentially created during model integra-
https://doi.org/10.5194/nhess-21-463-2021 Nat. Hazards Earth Syst. Sci., 21, 463–480, 2021470 N. Fourrié et al.: Data assimilation impact studies with the final AROME-WMED reanalysis of the HyMeX SOP1
Figure 3. Root mean square differences (RMSDs) (a) and mean (b) for analysis (AN, solid lines) and first-guess (FG, dashed lines) departures
against assimilated radio-sounding observations for the mixing ratio (g kg−1 ); REANA in black, NOGNSS in red and OPERGNSS in blue.
Figure 4. Correlation of the differences between zenithal total delays (ZTD) between REANA (black), NOGNSS (red) and OPERGNSS
(blue) analyses and corresponding Marfret Niolon independent observations as a function of analysis time in (a); mean value of ZTD (m)
in (b), the grey line corresponding to observations.
Table 4. Analysis (AN) and first-guess (FG) root mean square er-
ror (RMSE) values for the wind (in m s−1 ) computed with respect
to RASTA observations (sample size of 33 083 observations) for
Table 3. Mean zenithal total delays (ZTDs) for REANA, NOGNSS REANA, NOGNSS and OPERGNSS experiments.
and OPERGNSS analyses and Marfret Niolon observations (first
column). Correlation of ZTDs between REANA, NOGNSS and Experiment AN RMSE FG RMSE
OPERGNSS analyses and corresponding Marfret Niolon observa-
tions (OBS) computed over the eight analysis slots and correlation REANA 5.59 5.87
between ZTDs forecasted by AROME-WMED at the 3 h forecast NOGNSS 5.63 5.97
range and corresponding observations from Marfret Niolon. OPERGNSS 5.60 5.92
Experiments Mean AN ZTD FG ZTD
ZTD correlation correlation tion. There is indeed a little coupling between these fields
(m) during the analysis (Borderies et al., 2019b). This indirect
REANA 2.4617 0.967 0.961 effect was already demonstrated by Wattrelot et al. (2014),
NOGNSS 2.4642 0.961 0.958 for example, who noted a positive impact on the wind field
OPERGNSS 2.4654 0.962 0.958 when assimilating pseudo-observations of relative humidity.
OBS 2.4606 Lindskog et al. (2017) also reported – but did not show –
a positive impact on wind forecasts when assimilating ZTD
data.
Nat. Hazards Earth Syst. Sci., 21, 463–480, 2021 https://doi.org/10.5194/nhess-21-463-2021N. Fourrié et al.: Data assimilation impact studies with the final AROME-WMED reanalysis of the HyMeX SOP1 471
Table 5. Correlation and standard deviation of ZTD (in m) between AROME-WMED forecasts and reprocessed GNSS observations averaged
over forecast ranges.
Parameter REANA NOGNSS OPERGNSS
Correlation (1–24 h) 0.962 0.957 0.957
Correlation (25–48 h) 0.922 0.917 0.919
Correlation (49–54 h) 0.906 0.902 0.905
Standard deviation (forecast – observation, 1–24 h) 0.0152 0.0164 0.0160
Standard deviation (forecast – observation, 25–48 h) 0.0221 0.0226 0.0223
Standard deviation (forecast – observation, 49–54 h) 0.0244 0.0249 0.0244
Figure 6. Equitable threat score (ETS) for the 24 h accumulated
precipitation from the sum of the eight 3 h forecasts used as a back-
ground of the data assimilation cycle each day of the period from
Figure 5. Location of RASTA observations during the first HyMeX 5 September to 5 November 2012. Results for REANA are dis-
special observation period. Coloured dots represent the number of played in black; those for NOGNSS are displayed in red; and those
wind data available per profile. for OPERGNSS are displayed in blue. Dots indicate that the dif-
ference between the curves and the REANA curve as a reference is
statistically significant at a 0.95 confidence threshold using a boot-
3.3 Impact on short-range precipitation strap test.
Figure 6 shows that the equitable threat score (ETS) of the
24 h accumulated precipitation computed with the sum of
the 3 h precipitation from the eight analysis times is im- 4 Impact of GNSS data on medium-term forecasts
proved with the assimilation of GNSS ZTD data compared
to the NOGNSS experiment. It represents an evaluation of The impact of the GNSS data has also been assessed for
the background quality. The difference is statistically signifi- longer forecast ranges (3 to 54 h). The effect of the assim-
cant for each threshold. When comparing the assimilation of ilation of the GNSS data on the correlation with IWV from
REANA to OPERGNSS, the ETS for precipitation is slightly the GNSS data set is maximal for the analysis and decreases
better with the reprocessed data set, but the differences are up to the 30 h forecast range (Fig. 7) as the general impact of
not significant except for the 40 mm d−1 threshold. The loss the initial conditions on the forecast performance reduces. A
of skill for OPERGNSS simulation for larger daily precipi- similar behaviour is found with the standard deviations of the
tation from the eight 3 h forecasts is surely due to the lower differences between observed IWV and one simulated from
number of occurrences for heavier precipitations. the three experiments.
Overall, the background quality is improved with the as- Compared to the observed ZTDs from the Marfret Niolon,
similation of GNSS observations, and the data reprocessing the signal is more noisy because of a smaller data set, but
brings improvement in terms of precipitation from 3 h fore- when compared to values averaged over the forecast ranges
cast, even though this benefit is not significant. (Table 5), the correlation for NOGNSS is lower than RE-
ANA and OPERGNSS, which provides itself lower corre-
lation than REANA. The standard deviations are higher for
the NOGNSS forecasts. In addition, a decrease of the corre-
https://doi.org/10.5194/nhess-21-463-2021 Nat. Hazards Earth Syst. Sci., 21, 463–480, 2021472 N. Fourrié et al.: Data assimilation impact studies with the final AROME-WMED reanalysis of the HyMeX SOP1
Figure 7. Correlation (a) and standard deviations (b, kg m−2 ) of integrated water vapour content between AROME-WMED forecasts and
reprocessed GNSS observations (Bock et al., 2016) as a function of forecast range (h).
lation (respectively an increase of the standard deviation) is tures for radiosondes, aircraft and satellite winds (Fig. 11).
seen for forecast range over 24 h. The largest impact is a decrease of 0.08 m s−1 for the ra-
The forecast quality has also been evaluated against sur- diosonde FG RMS differences at 300 hPa (left panel). Con-
face data. No impact was found on temperature at 2 m or on cerning the AN RMS differences, the improvement (SATOB,
10 m wind (not shown). A small impact was found on relative satellite observation) or degradation (radiosondes and air-
humidity at 2 m (Fig. 8). A reduction of the bias is noticed craft) are very small. The largest value obtained at 200 hPa
with REANA during the first 9 h of the forecast compared to is due to the small amount of data available for the computa-
OPERGNSS and NOGNSS. From 12 h onwards the results tion.
for REANA and OPERGNSS are similar. Regarding the stan- A small but not significant (Fig. 12) improvement of RE-
dard deviation, it is smaller for REANA between 0 and 9 h ANA compared to NOWPROF appears on the ETS of the
than for NOGNSS and OPERGNSS and between the 21 and 24 h accumulated precipitation accumulated from the 6 to
27 h forecast range than for NOGNSS. This difference repre- 30 h forecast ranges.
sents more than 2 % of improvement. For the other forecast
ranges the differences are lower than 1 %. 5.2 Ground-based and airborne lidar data
The impact of the assimilation of GNSS data on the 24 h
accumulated precipitation from the forecast initialized at As discussed in Sect. 2.2, humidity profiles retrieved from
06:00 UTC is less clear. The improvement of the GNSS data ground-based and airborne lidars have been assimilated in
reprocessing compared to the real-time data set is beneficial the REANA experiment. In Fig. 1, the trajectories of all
for all thresholds except for 2 mm d−1 (where the ETS is bet- ATR 42 flights are plotted, together with the localization of
ter for OPERGNSS) and is statistically significant for mod- the two ground-based lidars. The denial NOLIDAR experi-
erate thresholds (10 and 20 mm d−1 , Fig. 9). The difference ment results are very close to the reanalysis ones (Table 6),
between REANA ETS and NOGNSS ETS values is not sig- as these data represent very few additional data located over
nificant. When examining scores for precipitation forecasts ocean, where few observations are available for the compari-
between 30 and 54 h, there is a small significant degrada- son. No impact of the lidar data is found when comparing the
tion of the ETS for 2 mm d−1 with the NOGNSS experiment various analysed ZTDs to the Marfret Niolon corresponding
and a small improvement with OPERGNSS for 40 mm d−1 observations. These results agree with the Bielli et al. (2012)
(Fig. 10). study where no significant impact was found on the 24 h ac-
cumulated precipitation.
5 Other impact studies 5.3 Spanish radars
As previously mentioned we performed other impact studies No significant impact has been noticed over the HyMeX do-
with wind profilers, lidar data and Spanish radar data. main. However, when focusing over the Iberian Peninsula,
the ETS for the 24 h accumulated precipitation from the sum
5.1 Wind profilers of the eight 3 h precipitation background forecasts (Fig. 13)
is improved with the assimilation of Spanish radar data. This
No impact of the assimilation of wind profiler data is found impact also remains in longer forecast ranges as the ETS
except on the wind field. A small impact is noticed in terms for the 24 h precipitation accumulation between 6 and 30 h
of wind RMS differences of background and analysis depar- forecast ranges is improved with the assimilation of Span-
Nat. Hazards Earth Syst. Sci., 21, 463–480, 2021 https://doi.org/10.5194/nhess-21-463-2021N. Fourrié et al.: Data assimilation impact studies with the final AROME-WMED reanalysis of the HyMeX SOP1 473
Figure 8. Bias (BIAS; forecast minus observations, dashed lines) and standard deviations (STD; solid lines) computed with relative humidity
at 2 m (a) and relative root mean square differences (%, b) with respect to REANA.
Figure 10. Equitable threat score of 24 h accumulated precipitation
Figure 9. Equitable threat score of the 24 h accumulated precipita-
from the 30 to 54 h forecast range of the long forecast initialized at
tion from the 6–30 h forecast range of the long forecast initialized at
00:00 UTC each day of the period from 5 September to 5 Novem-
00:00 UTC each day of the period from 5 September to 5 Novem-
ber 2012 computed over the AROME-WMED domain with rain
ber 2012 computed over the AROME-WMED domain with rain
gauges of the HyMeX database (version 4). Dots indicate that the
gauges of the HyMeX database (version 4). Dots indicate that the
difference between the curves is statistically significant.
difference between the curves is statistically significant.
Table 6. Correlations and standard deviations of zenithal total de-
lays (in m) between AROME-WMED forecasts from 00:00 UTC
and reprocessed GNSS observations averaged over forecast ranges
(0, 1–24, 25–48 and 49–54 h).
REANA NOLIDAR
Correlation for the forecast 0 h 0.968 0.960
Correlation for the forecast 1–24 h 0.962 0.961
Correlation for the forecast 25–48 h 0.923 0.924
Correlation for the forecast 49–54 h 0.906 0.907
Standard deviation for the forecast 0 h 0.0144 0.0167 Figure 11. First-guess (a) and analysis (b) RMS differences
Standard deviation for the forecast 1–24 h 0.0152 0.0154 (REANA–NOWPROF experiments) computed against radiosondes
Standard deviation for the forecast 25–48 h 0.0221 0.0220
(black), aircraft (red) and satellite observations (SATOB, green) ob-
Standard deviation for the forecast 49–54 h 0.0243 0.0243
servations for the zonal wind component (m s−1 ); negative values
correspond to a positive impact of the wind profiler.
https://doi.org/10.5194/nhess-21-463-2021 Nat. Hazards Earth Syst. Sci., 21, 463–480, 2021474 N. Fourrié et al.: Data assimilation impact studies with the final AROME-WMED reanalysis of the HyMeX SOP1
Figure 12. Equitable threat score (ETS) of 24 h accumulated pre- Figure 14. Equitable threat score (ETS) for the 24 h accumu-
cipitation from the 6 to 30 h forecast ranges of the long forecast lated precipitation from the 6 to 30 h forecast ranges initialized at
starting at 00:00 UTC each day of the period from 5 September 00:00 UTC each day of the period from 5 September to 5 Novem-
to 5 November 2012 computed over the AROME-WMED domain ber 2012 computed over the AROME-WMED domain with rain
with rain gauges of the HyMeX database (version 4). The lack of gauges of the HyMeX database (version 4). Results for REANA are
dots indicates that the difference between the curves is not signifi- displayed in black, and those for NORADSPAIN are in red. Dots
cant. REANA is plotted in black, and NOWPROF is in red. indicate that the difference between the curves is statistically sig-
nificant.
Figure 13. Equitable threat score (ETS) for the 24 h accumulated
Figure 15. Equitable threat score (ETS) for the 24 h accumu-
precipitation obtained from the sum of eight 3 h forecasts used as
lated precipitation from the 30 to 54 h forecast ranges initialized at
a background of the data assimilation cycle each day of the pe-
00:00 UTC each day of the period from 5 September to 5 Novem-
riod from 5 September to 5 November 2012 computed over the
ber 2012 computed over the AROME-WMED domain with rain
AROME-WMED domain with rain gauges of the HyMeX database
gauges of the HyMeX database (version 4). Results for REANA are
(version 4). Results for REANA are displayed in black, and those
displayed in black, and those for NORADSPAIN are in red. Dots
for NORADSPAIN are in red. Dots indicate that the difference be-
indicate that the difference between the curves is statistically sig-
tween the curves is statistically significant.
nificant.
ish radars for thresholds between 0.5 and 20 mm every 24 h sula, it is interesting to note that the assimilation of Span-
(Fig. 14). This impact does not remain at longer forecast ish radar data in AROME-WMED was made on a research
ranges (Fig. 15). These results are in good agreement with mode, as only French radars were assimilated at the time of
the Wattrelot et al. (2014) study which found an improve- the HyMeX campaign and the reanalyses. These data repre-
ment of the short-term precipitation forecast scores. However sent only 0.6 % of the assimilated data. This is 3 times less
contrary to the aforementioned study, we obtained a signifi- than REPROC-GNSS data.
cant improvement of the 24 h precipitation accumulation be-
tween 6 and 30 h forecast ranges over the Iberian Peninsula.
Even if we do not obtain a significant impact at the HyMeX
domain scale but a significant one over the Iberian Penin-
Nat. Hazards Earth Syst. Sci., 21, 463–480, 2021 https://doi.org/10.5194/nhess-21-463-2021N. Fourrié et al.: Data assimilation impact studies with the final AROME-WMED reanalysis of the HyMeX SOP1 475
recorded, with intense river discharges (Ardèche, Gardon and
Gapeau rivers for example). Such intense rainfall amounts
led to local flash floods and two casualties in the Var region.
In fact as shown in Fig. 17, three local precipitation max-
ima appear on the observed 24 h accumulated rainfall amount
(25 October at 06:00 UTC to 26 October at 06:00 UTC) on
the Mediterranean coastal area of France and Italy (Liguria
Tuscany region), with a first elongated one in the Cévennes
area (more than 150 mm, M1) and a small second one close
to the coast (around 100 mm, M2).
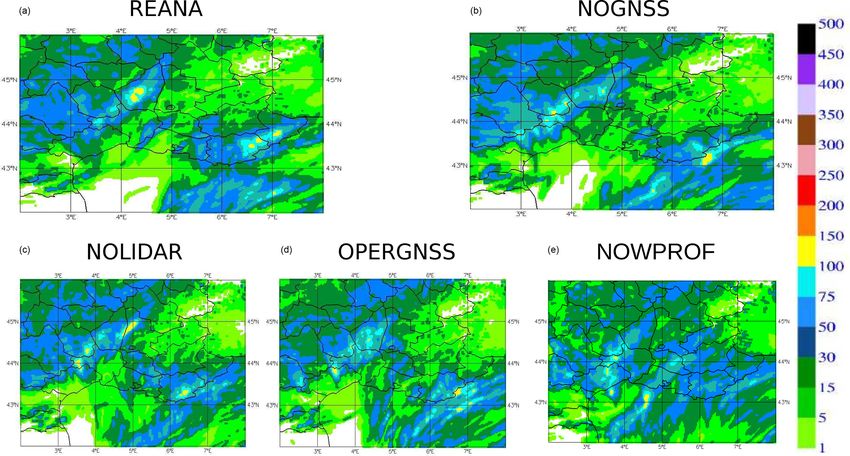
Figure 18 shows the 24 h accumulated precipitation be-
tween the 6 and 30 h forecasts for the different experiments
considered in this study. The REANA 24 h accumulated rain-
fall (from the 6 to 30 h forecast ranges) simulation agrees
with the observations for both the M1 and M2 systems. The
NOLIDAR experiment is very close to REANA; this is con-
Figure 16. Time–height cross section of the wind measured by
sistent with the fact that the amount of additional lidar data is
the Candillargues UHF radar for IOP16. Horizontal wind compo-
fairly small in REANA when compared to NOLIDAR. The
nents are represented by the black arrows (meteorological conven-
tion), and wind speeds are in colour. CNRM: Centre National de strongest impact is found when no GNSS data are assimilated
Recherches Météorologiques; CAND: Candillargues. (NOGNSS run): M1 and M2 are strongly underestimated;
surprisingly the OPERGNSS experiment leads to an accurate
forecast of M2 but underestimates the southwestward exten-
6 IOP16 case study sion of M1. Finally a strong negative impact is found with the
NOWPROF simulation which misses M2 and does not repro-
During the HyMeX SOP1, IOP16a was dedicated to a heavy- duce correctly M1. Over Italy, the gain brought by the obser-
precipitation event (HPE) that occurred over Cévennes– vations is not so evident, but it is quite well known in data
Vivarais (CV) in France and later on, in Italy (IOP16b) on impact studies that the assimilation of observation does not
25–26 October; this event was associated with local flash always improve the forecast at each analysis time but does
flooding and several casualties. This offshore convection case overall.
is well documented in Duffourg et al. (2016). On 26 October
at 00:00 UTC active convection was occurring over Catalo-
nia; this area of intense convective activity crossed the Gulf 7 Conclusions
of Lion, reaching the French Mediterranean coast around
06:00 UTC and later on and then hitting the Italian Ligurian The AROME-WMED model was originally developed to
coast in the evening. It is well known that the associated con- study and forecast heavy-precipitation Mediterranean events
vective systems are usually fed with moisture, during their during the special observation periods (SOPs) of the HyMeX
early stage over the warm Mediterranean Sea. A moist, con- programme. Two reanalyses were produced after the HyMeX
ditionally unstable southwestern flux is therefore found in the autumn campaign for the first SOP. The first one was carried
lower troposphere (Fig. 16) with a low-level jet by the Can- out after the field campaign to provide reanalyses simulations
dillargues radar around 09:00–12:00 UTC, associated with a of the period enjoying an updated AROME-WMED version.
slowly evolving weak-pressure low (around 995 hPa) local- The second one, performed a few years after, was done to
ized over southern France on 26 October at midday. More- improve the quality of the first reanalyses, assimilating the
over, low-level convergence is reinforced by the complex largest amount of data possible from the experimental field
orography (Cévennes ridge of the Massif Central and Alps in campaign (i.e. lidar and dropsonde humidity profiles) or from
France), triggering convection. An upper southwesterly wind reprocessed data (such as GNSS ZTDs, wind profiles, high-
jet is observed above 500 hPa (Fig. 16); in the evening of vertical-resolution radiosondes and Spanish doppler radars)
25 October the wind rotates to the west on the CV area as using the latest AROME version.
shown by the Candillargues UHF radar. Previous studies such as Duffourg and Ducrocq (2011),
During the 25 and 26 October period, many deep convec- Ricard et al. (2012), or Bresson et al. (2012) have shown the
tive systems developed over the northwestern Mediterranean importance of an accurate description of the low-level moist
(Duffourg et al., 2016). Although observed accumulated sur- flow-feeding mesoscale convective systems. In this study the
face precipitation from Friday, 26 October, at 18:00 UTC, to impact of various data sets related to humidity and wind on
Saturday, 27 October, at 06:00 UTC, over southern France the forecast quality from this comprehensive reanalysis is in-
it only reached around 150 mm in 24 h (Martinet et al., vestigated over the 2-month period. Many data sets of the
2017), very strong hourly rates (near 50 mm every 1 h) were first special observation period of the HyMeX campaign have
https://doi.org/10.5194/nhess-21-463-2021 Nat. Hazards Earth Syst. Sci., 21, 463–480, 2021476 N. Fourrié et al.: Data assimilation impact studies with the final AROME-WMED reanalysis of the HyMeX SOP1
Figure 17. Accumulated precipitation (mm) for 24 h between 26 October at 06:00 UTC and 27 October 2012 at 06:00 UTC over the AROME-
WMED domain (a) and zoom over the Cevennes region (b) and over the north of Italy (c). Please note that the dates given in the figure are
in the format of year month day (yyyy/mm/dd). RR: rain rate.
been considered here. The reprocessed GNSS data set (Bock Our study finds a small positive impact on humidity
et al., 2016) was removed and replaced with the operational forecast at short-term ranges of the reprocessed GNSS
data set used in the real-time AROME-WMED version. We ground-based zenithal total delay assimilation compared
examined the humidity data provided by ground-based and with NOGNSS. This data set is evenly distributed over the
airborne lidars. The impact of the reprocessed wind profilers AROME-WMED domain and provided at each analysis time
and the Spanish radar data was also evaluated. The impact information period on integrated water vapour. The impact
of these data sets was assessed through observing system ex- of the data reprocessing for GNSS zenithal total delays com-
periments which consist of removing the data sets and com- pared to the processing made in real time was also stud-
paring forecast quality from these denial experiments with ied by comparing REANA with OPERGNSS. Even though
a reference which includes all data sets. The selected data a positive impact is observed with REANA compared to OP-
sets were research observations (water vapour lidars) or re- ERGNSS, this improvement is not statistically significant.
processed data (from ground-based GNSS receivers or wind Given the impact of ground-based GNSS, there is also an in-
profilers). In total, the amount of denied data ranged between terest in continuing work to assimilate GNSS data over ocean
0.15 % and 1.86 % of the total number of observations, de- surfaces.
pending on the OSE’, and the impact was thus expected to Small impacts on wind fields were also observed for wind
be small. profilers. The sole impact of the assimilation of lidar data
is found when comparing with independent airborne radar
Nat. Hazards Earth Syst. Sci., 21, 463–480, 2021 https://doi.org/10.5194/nhess-21-463-2021N. Fourrié et al.: Data assimilation impact studies with the final AROME-WMED reanalysis of the HyMeX SOP1 477 Figure 18. Same as Fig. 17 but for 24 h accumulated precipitation forecasted by (a) REANA, (b) NOGNSS, (c) NOLIDAR, (d) OPERGNSS and (e) NOWPROF experiments, from the 6 to 30 h forecast ranges. observations located over the Mediterranean Sea. Since this in real time and to have bias-corrected observations that are data set represents a very small fraction of assimilated data, valuable for data assimilation. In addition, GNSS data avail- this may explain the absence of impact. In addition they were ability on ships seems to be a promising way to increase the not assimilated at their full available temporal frequency but coverage over ocean (Fan et al., 2016). When the data set is just once every 3 h. available frequently but not well spread over the model do- Spanish radar data assimilation improves the short-term main, such as for the Doppler winds and reflectivities from quality of the background as noticed on the 24 h accumulated the Spanish radars or winds from profiler radars, its assimi- precipitation of the eight 3 h background forecasts for each lation may lead to a positive impact on the precipitation fore- day but only over the Iberian Peninsula with no clear impact cast, but it remains local. Finally, a marginal impact from over the HyMeX domain. It is interesting to stress that this local and sporadic data sets such as humidity profiles from impact remains during the first 30 h of the forecast but with- water vapour lidars can be obtained, but it is not visible on out any remote impact over the rest of the AROME-WMED “global scores”. To get a material impact on the forecast in a domain. A greater impact could possibly be obtained if the mesoscale model from a set of observation through its data data were provided with additional scan elevations. assimilation, our study suggests to select data sets which With the examination of the impact of the assimilation are frequently available at each analysis time and also well of four different data sets over a 2-month period in the spread over the domain. mesoscale AROME-WMED, our study shows that it is re- The impact of the abovementioned data could be further quired to be spatially distributed well and have frequent data improved. For example, the impact of GNSS in AROME- sets such as the GNSS ZTD data set to get, with its assim- France has been recently improved with the use of variational ilation, an overall impact in terms of analysis and forecast bias correction in replacement of the static bias correction skills. This result agrees with the findings of Mahfouf et al. used in this study (Patrick Moll, personal communication, (2015), who show that the assimilation of GNSS systemat- 2020). In addition radar data from foreign countries have ically improves the atmospheric-humidity short-range fore- been assimilated in AROME since July 2020. The distribu- casts despite the small fraction of GNSS observations assim- tion of these data by OPERA (Operational Programme for ilated in AROME. A high temporal availability and a regular the Exchange of Weather Radar Information; the EUMET- horizontal distribution are both needed to get a significant NET Radar programme) allows for getting data of a high impact on the forecast scores. Moreover, it is interesting to quality in the data assimilation and thus increasing their im- process as precisely as possible a maximum of GNSS data pact in the AROME model (Martet et al., 2019). With a more https://doi.org/10.5194/nhess-21-463-2021 Nat. Hazards Earth Syst. Sci., 21, 463–480, 2021
You can also read


