Genetic diversity and morphological characterisation of three turbot (Scophthalmus maximus L., 1758) populations along the Bulgarian Black Sea coast
←
→
Page content transcription
If your browser does not render page correctly, please read the page content below
A peer-reviewed open-access journal
Nature Conservation 43: 123–146 (2021)
doi: 10.3897/natureconservation.43.64195                 RESEARCH ARTICLE
https://natureconservation.pensoft.net                                                                   Launched to accelerate biodiversity conservation

  Genetic diversity and morphological characterisation
    of three turbot (Scophthalmus maximus L., 1758)
    populations along the Bulgarian Black Sea coast

    Petya Ivanova1, Nina Dzhembekova1, Ivan Atanassov2, Krasimir Rusanov2,
 Violin Raykov1, Ivelina Zlateva1, Maria Yankova1, Yordan Raev1,3, Galin Nikolov3

1 Institute of Oceanology, Bulgarian Academy of Sciences (IO-BAS), First May Street 40, P.O. Box 152,
Varna 9000, Bulgaria 2 AgroBioInstitute-Agricultural Academy (ABI), 8 Dragan Tsankov Blvd, Sofia 1164,
Bulgaria 3 Executive Agency of Fisheries and Aquaculture (EAFA) at the Minister of Agriculture and Foods,
1“Knyaz Alexander Batenberg” Str., 8000, Burgas, Bulgaria

Corresponding author: Petya Ivanova (pavl_petya@yahoo.com)

Academic editor: M.G. Mazzocchi | Received 9 February 2021 | Accepted 22 March 2021 | Published 16 April 2021

                                http://zoobank.org/782D979B-7A2E-48CA-BC55-73FA9FD69208

Citation: Ivanova P, Dzhembekova N, Atanassov I, Rusanov K, Raykov V, Zlateva I, Yankova M, Raev Y, Nikolov
G (2021) Genetic diversity and morphological characterisation of three turbot (Scophthalmus maximus L., 1758)
populations along the Bulgarian Black Sea coast. Nature Conservation 43: 123–146. https://doi.org/10.3897/
natureconservation.43.64195

Abstract
Turbot (Scophthalmus maximus L., 1758) is a valuable commercial fish species classified as endangered.
The conservation and sustainability of the turbot populations require knowledge of the population’s ge-
netic structure and constant monitoring of its biodiversity. The present study was performed to evaluate
the population structure of turbot along the Bulgarian Black Sea coast using seven pairs of microsatellites,
two mitochondrial DNA (COIII and CR) and 23 morphological (15 morphometric and 8 meristic)
markers. A total of 72 specimens at three locations were genotyped and 59 alleles were identified. The ob-
served number of alleles of microsatellites was more than the effective number of alleles. The overall mean
values of observed (Ho) and expected heterogeneity (He) were 0.638 and 0.685. A high rate of migration
between turbot populations (overall mean of Nm = 17.484), with the maximum value (19.498) between
Shabla and Nesebar locations, was observed. This result corresponded to the low level of genetic differ-
entiation amongst these populations (overall mean Fst = 0.014), but there was no correlation between
genetic and geographical distance. A high level of genetic diversity in the populations was also observed.
The average Garza-Williamson M index value for all populations was low (0.359), suggesting a reduction
in genetic variation due to a founder effect or a genetic bottleneck. Concerning mitochondrial DNA, a

Copyright Petya Ivanova et al. This is an open access article distributed under the terms of the Creative Commons Attribution License (CC
BY 4.0), which permits unrestricted use, distribution, and reproduction in any medium, provided the original author and source are credited.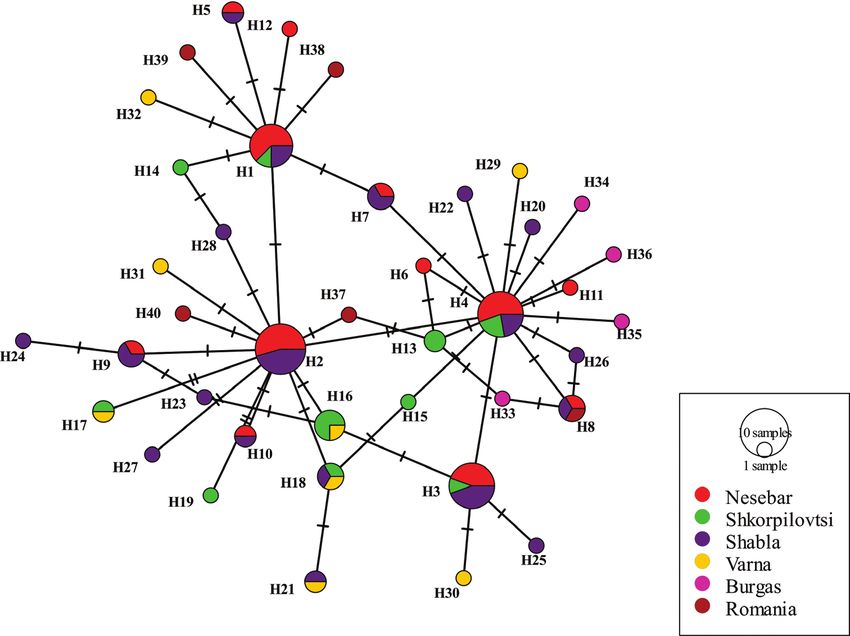
124                 Petya Ivanova et al. / Nature Conservation 43: 123–146 (2021)

total number of 17 haplotypes for COIII and 41 haplotypes for CR were identified. The mitochondrial
DNA control region showed patterns with high haplotype diversity and very low nucleotide diversity,
indicating a significant number of closely-related haplotypes and suggesting that this population may
have undergone a recent expansion. Tajima’s D test and Fu’s FS test suggested recent population growth.
Pairwise Fst values were very low. The admixture and lack of genetic structuring found pointed to the
populations analysed probably belonging to the same genetic unit. Therefore, a proper understanding and
a sound knowledge of the level and distribution of genetic diversity in turbot is an important prerequisite
for successful sustainable development and conservation strategies to preserve their evolutionary potential.

Keywords
Black Sea, COIII, CR, microsatellite genotyping, population structure, turbot

Introduction
Over the past few decades, human impacts on wild fish populations have increased
drastically worldwide as a result of extensive aquaculture, exploitation of fish stocks
for global consumption and human-induced climate changes (Olsson et al. 2007).
Excessive fishing and large-scale environmental changes not only affect the spatial dis-
tribution and structure of populations, but also introduce extensive modifications into
their genetic diversity (Madduppa et al. 2018). The genetic diversity is a fundamental
estimation for a population genetic study and crucial to the fishery management and
resource utilisation (Xu et al. 2019). Marine fishes generally show low levels of genetic
differentiation amongst geographic regions because of higher dispersal potential dur-
ing planktonic egg, larval or adult history stages, coupled with an absence of physical
barriers to the movement between ocean basins or adjacent continental margins (Grant
and Bowen 1998; Hewitt 2000). Loss of genetic diversity can reduce the adaptability,
lessen the population persistence and lead to a decrease in the productivity of the target
species. Such genetic diversity reductions in some of the world’s most abundant species
may add to the growing long-term impact of fishing on their evolutionary potential,
particularly with the abundance staying low and diversity continuing to erode (Pinsky
and Palumbi 2014).
     The turbot (Scophthalmus maximus) is a marine flatfish, with a high commercial
value living on the European continental shelf and drawing remarkable attention with
respect to fisheries and aquaculture (Iyengar et al. 2000). Despite its economic impor-
tance, the turbot is considered vulnerable under the current IUCN Red List Criteria
(IUCN 2019). The wild populations of turbot are exposed to a strong anthropogenic
pressure as it is considered one of the most valuable commercial species subjected to
intensive fishing and is characterised as exploited unsustainably and at a risk of extinc-
tion in the Black Sea (Nikolov et al. 2015).
     Information on the genetic structure of commercially important fish species is cru-
cial to prevent ecological damage and to ensure sustainable and effective management
of exploited stocks and systems (Liu and Cordes 2004; Olsson et al. 2007). Molecular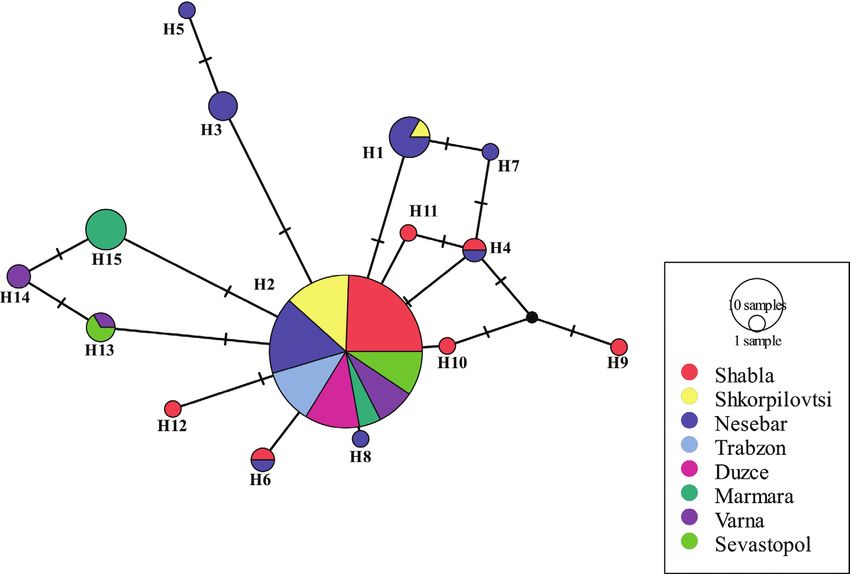
Genetic and morphological diversity of three Black Sea turbot populations 125
markers (microsatellites and mtDNA) were applied only to closely-related turbot spe-
cies in different marine regions in order to assess the genetic diversity (Bouza et al.
2002; Suzuki et al. 2004; Vandamme et al. 2014, 2020; do Prado et al. 2018). Thus,
using these molecular markers, limited data on the population structure of S. maximus
in the Black Sea were obtained (Atanassov et al. 2011; Nikolov et al. 2015; Bessonova
and Nebesikhina 2019; Turan et al. 2019b; Firidin et al. 2020; Ivanova et al. 2020).
Accordingly, to avoid depletion of the genetic diversity, fisheries management
should be based on a more comprehensive knowledge of the genetic integrity of the
populations. The modern molecular methods developed over the past few years offer
unique opportunities to rate the genetic population structures; moreover, the subse-
quent evaluations should be further used to smooth the process of local management
and to promote increased harvest under a sustainable fisheries regime.
The aim of the present study is to evaluate the population genetic diversity of three
turbot populations along the Bulgarian Black Sea coast and its applicability for the
purposes of monitoring and conservation of genetic diversity in terms of sustainable
management and rational exploitation of stocks.
Material and methods
Sample collection and DNA extraction
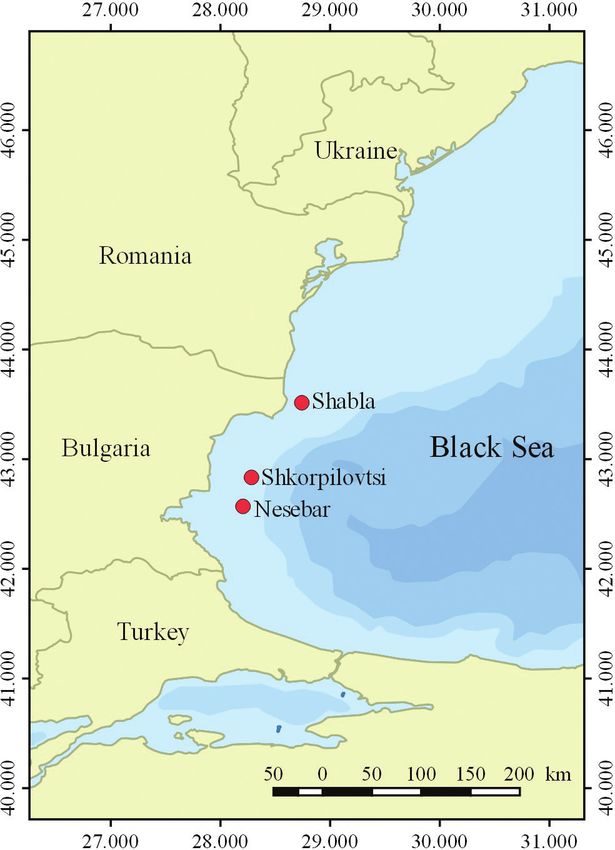
Seventy-two turbot samples were caught by a local fishing vessel in March 2019 and
April 2020 at two locations in the Black Sea (Shabla, Shkorpilovtsi and Nesebar)
(Fig. 1). For DNA analysis, tissue samples were taken from dorsal fin and stored in
96% ethanol at 4 °C prior to the following analyses. The genomic DNA was extracted
by DNeasy Blood & Tissue Kit (QIAGEN). All the DNA extracts were analysed by gel
electrophoresis to monitor the DNA quality prior the PCR amplification.
Microsatellite genotyping
Seven microsatellite loci (Sma1-125INRA, Smax-02, Sma3-12INRA, 3/9CA15, B12-
IGT14, Sma-E79 and Sma-USC26) were amplified and analysed (Table 1). The poly-
merase chain reaction (PCR) was performed in a reaction volume of 50 µl containing
2 µl of each primer, 25 µl of Mastermix (MyTaqTM HS Mix) and 2 µl of the target
DNA. The reverse microsatellite primers were fluorescently labelled at the 5’ end with
the 6-FAM dye (Table 1). The PCR amplification was performed under the following
conditions: 35 cycles (95 °C for 1 min, 95 °C for 45 sec, 56–60 °C for 50 sec depend-
ing on the primer type, 72 °C for 1 min) and 72 °C for 10 min. Applied Biosystems
3130 Genetic Analyzer (Thermo Fisher Scientific) was used to carry out the fragment
analysis. The size of the fragments was determined with GeneMapper 4.0 (Thermo
Fisher Scientific) software package.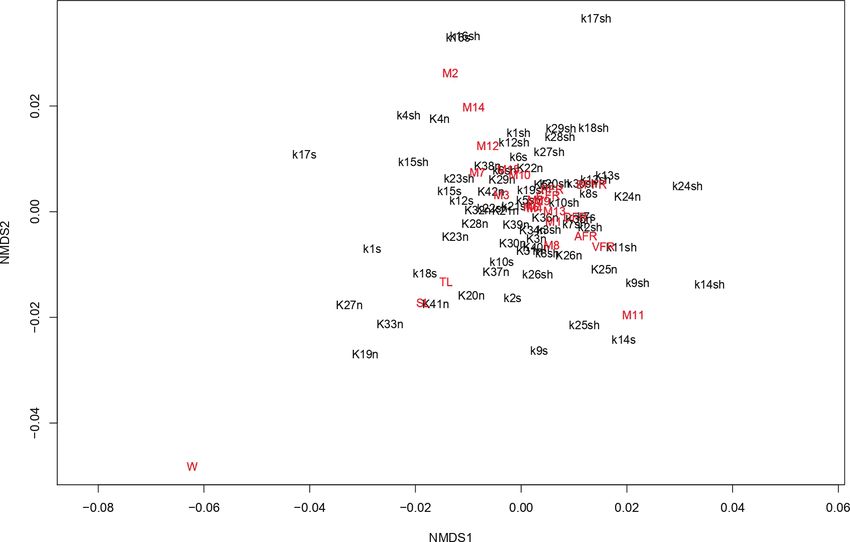
126                 Petya Ivanova et al. / Nature Conservation 43: 123–146 (2021)

Figure 1. Sampling sites (red circles) along the Bulgarian Black Sea coast.

PCR and sequence analysis of mitochondrial DNA (COIII)
The polymerase chain reaction (PCR) using mitochondrial primers (COIII) was car-
ried out in a reaction volume of 50 µl containing 2 µl of each primer, 25 µl of the
Mastermix (MyTaqTM HS Mix) and 2 µl of the target DNA. The mitochondrial
cytochrome c oxidase subunit III (COIII) was amplified using universal primers (F:
AGCCCATGACCTTTAACAGG and R: GACTACATCAACAAAATGTCAGTAT-
CA, according to Valles-Jiménez (2005). The conditions for PCR amplification includ-
ed the following parameters: 94 °C for 5 min, 95 °C for 30 sec, 49 °C for 1min, 72 °C
for 1 min (35 cycles) and 72 °C for 5 min. The mtDNA sequencing was performed by
Macrogen Europe B.V. The obtained COIII sequences were deposited in the GenBank
under accession numbers MN556886–MN556913 and MW446249–MW446288.
Genetic and morphological diversity of three Black Sea turbot populations                127

Table 1. Characterization of microsatellite loci for Black Sea turbot genotyping.

     Locus       GenBank No              Primer sequences                  Repeat motif         Size range
B12-I GT14       AF182086.1       F: GTGATGGAAGATTGTACCAG                    (GT)14              113–119
                                  R: CACAATAAAGGATAGACCAG
3/9CA15          AF182091.1       F: AGAGTGAAGAACGTACCTGC                    (CA)15             226–245
                                 R: CAATGGAGAGGCAGTATCGG
Sma1-125INRA       No data        F: CACACCTGACAAAGCTCAAC                (TAGA)11-(TG)4         112–152
                                R:GCTGAACATTTTCATGTTGATAG
Smax-02            No data        F: GGAGGATGTATTGAAAGTGT                    (TG)16              93–141
                                  R: AGAGCAGGTCATTATACAGC
Sma3-12INRA        No data        F: CACAATTGAATCACGAGATG                    (TG)21              88–110
                                   R: GCCACCACTGCGTAACAC
Sma-E79            No data       F: GCAGCGACTTGCTTCTTTCT             (GT)6-(AT)14-(GT)9-(TA)7   227–317
                                 R: GTCAGTTTGTGGTGTGTGGG
Sma-USC26          No data      F:TCAAACCAACGGACTAACAAACA                   (TATC)12            202–282
                                R:CTTCATTACCAGCCCATCAAAGT

PCR and sequence analysis of mitochondrial DNA (CR)
The polymerase chain reaction (PCR) using mitochondrial primers (CR) was carried
out in a reaction volume of 50 µl, containing 2 µl of each primer, 25 µl of Mastermix
(MyTaqTM HS Mix) and 2 µl of target DNA. The mitochondrial control region (CR)
was amplified using universal primers (L15924: 5’AGCTCAGCGCCAGAGCGC-
CGGTCTTGTAAA and H16498-5’-CCTGAAGTAGGAACCAGATG, according
to Atanassov et al. (2011). The conditions of PCR amplification included the fol-
lowing parameters: 94 °C for 5 min, 95 °C for 45 sec, 50 °C for 1 min, 72 °C for
1 min (35 cycles) and 72 °C for 5 min. PCR product quality control was performed
by electrophoresis on 2% agarose gel. The sequencing was performed by Macrogen
Europe B.V. The obtained CR sequences were deposited in the GenBank under the
accession numbers MN556856–MN556885 and MW446289–MW446330. The new
sequences were compiled and analysed with previously deposited sequences extracted
from the GenBank database covering all available CR sequences of different popula-
tions of S. maximus along the Bulgarian Black Sea coast.

Morphology analyses
Eight meristic characteristics were thoroughly investigated: total length (TL), standard
length (SL), dorsal fin ray (DFR), pectoral fin ray (PFR), anal fin ray (AFR), ventral fin
ray (VFR) back pectoral fin ray (BPFR); caudal fin ray (CFR); plus 15 morphometric
characters: M1-Linea-Dorsal height; M2-Linea-Anal height; M3-Beginning dorsal fin
origin – end of operculum; M4-Mouth-beginning pectoral fin origin; M5-Mouth-
operculum distance; M6-Mouth-end of pectoral fin distance; M7-Mouth-origin of
dorsal fin; M8-Length of the dorsal base; M9-Caudal Fin base expanse; M10-Anal base
length; M11-Ventral length; M12-Body height; M13-starting-end mouth distance;
M14-lateral line; M15-standard length (according to Turan et al. 2019a) that are com-
monly used to describe Scophthalmidae species.
128 Petya Ivanova et al. / Nature Conservation 43: 123–146 (2021)
Statistical analyses
The Hardy-Weinberg equilibrium (HWE) exact tests and loci combinations for link-
age disequilibrium with the Markov Chain methods were conducted using GenAlEx
6.5 (Peakall and Smouse 2012). The indices for genetic diversity as Shannon’s infor-
mation index, observed, expected unbiased, expected heterozygosities and inbreeding
coefficient were calculated, against that background also using GenAlEx 6.5 (Peakall
and Smouse 2012). Polymorphic information content (PIC) and Garza and William-
son index were computed using Arlequin v.3.5.2.2 (Excoffier and Lischer 2010). The
analyses of private alleles (alleles observed in only one population), the allelic rich-
ness and Mantel test were accomplished by the programme GenAlEx 6.5 (Peakall and
Smouse 2012).
The inbreeding coefficient (Fis) was thereupon calculated using Genepop 4.7
(Rousset 2008) and mtDNA sequence data were further analysed by applying
MEGA7 (Kumar et al. 2018). The sequence alignment was established, the num-
ber of haplotypes, haplotype network and molecular phylogenetic neighbour join-
ing (NJ) tree (Saitou and Nei 1987) and TCS Networks were easily constructed
by means of PopArt (Clement et al. 2002). The bootstrap consensus tree was in-
ferred from 1000 replicates. The evolutionary distances were computed using the
Tajima-Nei method (Tajima and Nei 1984) and the haplotype (H) and nucleotide
(π) diversities were estimated with DnaSP 5.10.01 (Librado and Rozas 2009). The
fixation index Fst calculated in Arlequin v. 3.5.2.2 (Excoffier and Lischer 2010) was
used to infer the genetic structure. The significance test was obtained from 1023
permutations. Bayesian clustering analysis was performed in STRUCTURE v.2.3.4
(Pritchard et al. 2000) with 10 independent iterations at each K = 1–10 with 205
Markov Chain Monte Carlo iterations after a burning period of 205 repetitions. The
optimum K was estimated using the Structure Harvester (Earl and Von Holdt 2012)
following the Evanno method (Evanno et al. 2005) for BIC comparison. Structure
graphical results were plotted with CLUMPAK (Kopelman et al. 2015).Correla-
tion analysis was appropriately implemented to identify the specific pattern of linear
relationships between morphometric and meristic characters to be further analysed
and validated amongst the studied populations, aiming at assessing the similarity/
dissimilarity in morphology. The non-parametric statistical test – similarity analysis
(ANOSIM) was conducted in order to identify statistically significant differences
between samples and hierarchical clustering and NDMS were used to visualise the
distribution of samples with respect to their morphology similarities. All statistical
analyses and graphic representations were performed using the statistical and pro-
gramming software R 4.3.8 (R Core Team 2020), packages: ‘PerformanceAnalytics’
(Peterson and Carl 2014), ‘vegan’ (Oksanen et al. 2019), ‘tidyverse’ (Wickham 2017)
for data manipulation, ‘cluster’ (Maechler et al. 2018) for selection and implementa-
tion of the proper clustering algorithm and ‘factoextra’ (Lê et al. 2008) for clustering
visualisation, as well as ‘dendextend’ (Galili 2015), available through the CRAN
repository (www.r-project.org).Genetic and morphological diversity of three Black Sea turbot populations 129
Results
Genetic variability of microsatellite loci
All analysed microsatellite markers proved to be polymorphic and a total of 59 alleles
was discerned within the seven loci. The length of the identified alleles in the investi-
gated loci ranged between 85 and 320 base pairs (bp). The number of alleles per locus
ranged between 2 and 13 (Table 2). As a result, Sma-USC26 (13 alleles) was the most
polymorphic locus and Smax-02 (two alleles) was the least polymorphic locus. Analysis
of allelic frequencies by loci showed that the lowest allelic frequency (0.017) was found
at locus Sma-E79 and the highest one (0.717) at locus Smax-02. Reasonable amount
of polymorphism in turbot was evident from the allele frequency data, with the mean
number of alleles (MNA) being 6.330 ± 0.634.
The Shabla, Nesebar and Shkorpilovtsi populations had the smallest number of
alleles per Smax-02 locus in comparison with all Black Sea populations previously
investigated (Table 2). For the other loci, the data obtained were similar (Turan et al.
2019b; Bessonova and Nebesikhina 2019; Firidin et al. 2020). The most polymorphic
locus in the current study was Sma-USC26 in the Shabla population (Table 2).
Table 2. Number of alleles per locus for Shabla, Nesebar and Shkorpilovtsi turbot populations and com-
parison with the reference data for turbot from different Black Sea areas and adjacent seas (BG-Bulgaria,
GA-Georgia, TR-Turkey). NA – not analysed.
Population Locus References
N of Sma1- Smax- Sma3- B12- 3/9CA15 Sma-E79 Sma-
samples 125INRA 02 12INRA IGT14 USC26
Shabla,BG,BS 30 5 2 8 5 5 11 13 Current study
Nesebar,BG,BS 28 4 2 8 5 7 8 10 Current study
Shkorpilovtsi, BG, BS 14 6 2 6 4 6 8 8 Current study
Varna, BG, BS 10 9 14 9 5 4 NA NA Turan et al. 2019b
Trabzon, TR, BS 10 6 4 7 3 10 NA NA Turan et al. 2019b
Duzdze, TR, BS 10 8 5 4 3 14 NA NA Turan et al. 2019b
Sevastopol, BS 10 11 11 11 9 6 NA NA Turan et al. 2019b
Caucasian, BS 63–64 9 13 7 NA 11 11 9 Bessonova and
Nebesikhina 2019
Crimean, BS 128–130 7 5 11 NA 10 14 11 Bessonova and
Nebesikhina 2019
Sea of Azov 60–61 8 6 6 NA 7 14 11 Bessonova and
Marmara Sea, Turkey 10 8 7 5 7 3 NA NA Nebesikhina 2019;
Romania, BS 12 8 NA 12 NA 6 NA NA Turan et al. 2019b;
Istanbul, TR, BS 42 6 NA 7 NA 11 NA NA Firidin et al. 2020
Kocaeli, TR, BS 34 5 NA 5 NA 7 NA NA
Zonguldak, TR, BS 14 4 NA 6 NA 5 NA NA
Kastamonou, TR, BS 43 4 NA 9 NA 7 NA NA
Sinop, TR, BS 45 5 NA 5 NA 11 NA NA
Samsun, TR, BS 51 6 NA 7 NA 9 NA NA
Trabzon, TR, BS 25 4 NA 7 NA 8 NA NA
Artvin, TR, BS 44 4 NA 7 NA 8 NA NA
Abkhasia, GA, BS 8 3 NA 3 NA 4 NA NA
Crimean, BS 46 5 NA 5 NA 6 NA NA
Sea of Azov 50 6 NA 4 NA 6 NA NA130 Petya Ivanova et al. / Nature Conservation 43: 123–146 (2021)
The expected number of alleles varied from 1.529 (Smax-02) to 6.374 (Sma-
USC26) (Table 3). Heterozygosity is a major indicator of the level of genetic diversity
in a population. With the values reflecting the level of observed heterozygosity (Ho)
ranging from 0.107 at locus Smax-02 to 0.929 at locus B12-IGT14 (Table 3), the ex-
pected heterozygosity (He) of genetic diversity would vary from 0.406 at locus Smax-02
to 0.843 at locus Sma-USC26, respectively. The total mean of Ho was 0.638 ± 0.470,
with maximum and minimum values of 0.684 and 0.582 in Shkorpilovtsi population
and Nesebar population, respectively. The overall mean value of He was 0.685 ± 0.026.
The polymorphic information content (PIC) and the values of Shannon-Wiener
index (I) provided a relatively broad value range of 0.324–0.825 and 0.596–2.015,
respectively. The fixation index (Fis) varied between 0.006 and 0.769, with an average
Table 3. Descriptive statistics of Scophthalmus maximus for 7 loci samples from three different populations
along the Bulgarian Black Sea coast.
Sampling area Locus
Sma1-125INRA Smax-02 Sma3-12INRA B12- IGT14 3/9CA15 Sma-USC26 Sma-E79
Shabla N 30 30 30 30 30 30 30
Na 5 2 8 5 5 13 11
Ne 3.529 1.529 2.913 4.009 3.462 5.172 3.072
I 1.371 0.596 1.421 1.471 1.340 2.015 1.608
Ho 0.733 0.233 0.700 0.800 0.800 0.633 0.633
He 0.717 0.406 0.657 0.751 0.711 0.807 0.674
uHe 0.729 0.413 0.668 0.763 0.723 0.820 0.686
Fst -0.023ns 0.425* -0.066 ns -0.066 ns -0.125 ns 0.215 ns 0.061***
Fis -0.006 0.439 -0.049 0.078 -0.049 -0.108 0.231
PIC 67.13 32.35 62.18 70.89 65.89 78.65 65.03
M 0.23810 0.66667 0.53333 0.15942 0.45455 0.23810 0.23636
Nesebar N 28 28 28 28 28 28 28
Na 4 2 8 5 7 10 8
Ne 3.97 1.813 3.477 4.181 3.862 6.374 2.292
I 1.383 0.641 1.595 1.492 1.525 2.012 1.296
Ho 0.643 0.107 0.679 0.786 0.786 0.679 0.393
He 0.748 0.448 0.712 0.761 0.741 0.843 0.564
uHe 0.762 0.456 0.725 0.775 0.755 0.858 0.574
Fst 0.141 ns 0.761*** 0.047 ns -0.033* -0.060 ns 0.195* 0.303*
Fis 0.158 0.769 0.066 0.32 -0.015 -0.042 0.213
PIC 70.1 34.77 68.48 72.57 69.87 82.51 54.44
M 0.23529 0.66667 0.42105 0.11268 0.45455 0.33333 0.18182
Shkorpilovtsi N 14 14 14 14 14 14 14
Na 6 2 6 4 6 8 8
Ne 3.5 1.849 3.5 3.733 3.267 5.521 3.564
I 1.412 0.652 1.489 1.352 1.407 1.837 1.609
Ho 0.857 0.286 0.857 0.929 0.714 0.643 0.500
He 0.714 0.459 0.714 0.732 0.694 0.819 0.719
uHe 0.741 0.476 0.741 0.759 0.72 0.849 0.746
Fst -0.200 ns 0.378 ns -0.200 ns -0.268* -0.029 ns 0.215 ns 0.305*
Fis -0.164 0.409 -0.164 0.338 -0.234 0.008 0.25
PIC 66.58 35.37 68.08 68.38 65.13 79.4 68.99
M 0.28571 0.66667 0.40000 0.10959 0.57143 0.28571 0.13559
N – number of samples, Na – number of different alleles, Ne – number of effective allele, I – Shannon’s information index, Ho (ob-
served) and He – (expected) heterozygosities, uHe (unbiased expected heterozygosity), Fst - measures the expected heterozygosity with
respect to the total population (p-values < 0.05 *,Genetic and morphological diversity of three Black Sea turbot populations 131
value of 0.094 to testify to a slight excess of heterozygotes in the fish group. The Garza-
Williamson index was lowest at the B12-I GT14 locus in the Shkorpilovtsi population
and highest at the Smax-02 locus in all populations analysed.
All investigated loci differed in terms of the Garza-Williamson index (M), within
the range 0.10959 to 0.66667. The M average value in the investigated populations
was 0.361 for Shabla, 0.335 for Nesebar and 0.351 for Shkorpilovtsi (Table 3).
The mean values of unbiased expected heterozygosity (uHe) in the analysed pop-
ulations were similar (0.686±0.049 for Shabla population, 0.701±0.052 for Nese-
bar and 0.719±0.043 for Shkorpilovtsi), which marked the similar genetic diversity
(Bessonova and Nebesikhina 2019).
Pairwise Fst comparisons showed low genetic differentiation between sampling
sites (Table 4) and was always not significant. The presence of migrants per generation
varied between 15 and 19% (Table 4). The highest rate of gene flow (Nm = 19.498)
was observed between Shabla and Nesebar populations.
A Mantel test revealed positive, but not significant relationships between the ge-
netic and geographic distances (R2 = 0.8273, P = 0.336).
Genetic diversity of mitochondrial DNA
A total of 17 haplotypes for COIII (563 bp) and 41 haplotypes for CR (432 bp) were
identified. The sequence analyses of COIII recovered seven haplotypes for Shabla, two
haplotypes for Shkorpilovtsi and eight haplotypes for the Nesebar population (Ta-
ble 5). The majority of the identified COIII haplotypes originated from one prevalent
set of haplotypes (Hap 2) following a single nucleotide substitution (Fig. 2). Four
haplotypes were unique for the Shabla and Nesebar populations (Table 5) compared to
previous data for Black Sea populations (Turan et al. 2019 b).
The COIII haplotype diversity ranged from 0.389 to 0.766 in the three popu-
lations, with the highest value presented in the Nesebar population (Table 5). Nu-
cleotide diversity ranged from 0.001 to 0.002. The result of mean COIII haplotype
diversity between populations was 0.550, higher than the data presented in Turan et al.
(2019b) for five populations in the Black and Marmara Seas (0.380). For the control
region (CR), haplotypes (H1, 2 and 4) were common for the three populations ana-
lysed (Fig. 3) Unique CR haplotypes were observed in all populations, i.e. Shabla (13),
Shkorpilovtsi (7) and Nesrbar (8) (Table 5, Fig. 3).
All three turbot populations analysed showed high levels of haplotype diversity
(0.892–0.954), but low nucleotide diversity (0.004–0.006) in the mtDNA control
Table 4. Scophthalmus maximus population pairwise FST (below diagonal) and pairwise genetic distances
(above diagonal), based on microsatellites.
Shabla Nesebar Shkorpilovtsi
Shabla – 0.061 0.081
Nesebar 0.013 – 0.067
Shkorpilovtsi 0.016 0.014 –132 Petya Ivanova et al. / Nature Conservation 43: 123–146 (2021)
Figure 2. Haplotype network from mtDNA COIII, obtained from the TCS analysis. The size of the
circle represents the frequency of each haplotype. Small lines illustrate the substitutions between the
respective haplotypes. The small black circle indicates the intermediate haplotypes that are not present in
the sample.
Table 5. Genetic diversity parameters of Scophthalmus maximus populations, based on mDNA sequence
data. Control region reference data from Shabla were included (Ivanova et al. 2020).
Sampling site n H pHap Hd PS π D k Fs
COIII Nesebar 26 8 4 0.766 7 0.002 -1.064 1.197 -3.524
Shabla 28 7 4 0.389 5 0.001 -1.857 0.556 -5.235
Shkorpilovtsi 14 2 0 0.495 1 0.001 -1.212 0.495 1.139
CR Nesebar 28 12 8 0.892 10 0.004 -1.097 1.693 -6.925
Shabla 30 19 13 0.954 18 0.006 -1.713 2.425 -15.924
Shkorpilovtsi 14 10 7 0.945 10 0.006 -0.832 2.473 -5.520
n: number of sequences, H: Number of haplotypes, pHap: the number of private haplotypes, Hd: haplotype diversity, PS: polymorphic
sites, π: nucleotide diversity, D: Tajima’s D value; Fs: Fu’s Fs value.
region in comparison with Bulgarian Black Sea populations previously analysed (Atan-
assov et al. 2011) (Table 5).
The population pairwise Fst revealed an overall low level of genetic structure be-
tween the turbot populations. Non-significant Fst values were observed except for the
comparison between Nesebar and Shabla populations (Table 6).
Genetic structure and phylogenetic trees were unable to detect genetic differen-
tiation between sampling sites due to the low genetic differentiation for the COIII
markers (0.002–0.003) and for CR (0.005–0.006) between haplotypes (Table 7). TheGenetic and morphological diversity of three Black Sea turbot populations 133
Figure 3. Haplotype network from CR (mtDNA) obtained from the TCS analysis. The size of the circle repre-
sents the frequency of each haplotype. Small lines illustrate the substitutions between the respective haplotypes.
Table 6. Scophthalmus maximus population pairwise FST (based on COIII below diagonal) and based on
CR (above diagonal), (p-values < 0.05*, < 0.01**, < 0.001***, ns not significant).
Nesebar Shkorpilovtsi Shabla
Nesebar – 0.004ns –0.012ns
Shkorpilovtsi –0.018ns – –0.017ns
Shabla 0.117** 0.122*** –
lowest genetic distance (0.002) was detected between Shkorpilovtsi and Shabla popu-
lations and the highest value (0.003) was found between Shabla and Nesebar popula-
tions, based on COIII analyses. Using CR, the highest genetic distance (0.006) was
found between Shabla and Shkorpilovtsi populations (Table 7).
A Mantel test revealed no significant relationship between genetic and geographic
distances (R2 = 0.868 and P = 0.358 for COIII; R2 = 0.881 and P = 0.324 for CR).
Tajima’s D values were negative for all populations (Table 5), but statistically non-
significant, with the exception of the Shabla population, indicating an excess of rare
nucleotide site variants. The results of Fu’s FS test, which is based on the distribu-
tion of haplotypes, showed negative values for all regions except Shkorpilovtsi (COIII
marker), indicating an excess of rare haplotypes. The overall negative values resulting134 Petya Ivanova et al. / Nature Conservation 43: 123–146 (2021)
Table 7. Pariwise genetic distances between sampling sites, based on COIII (below diagonal) and CR
(above diagonal).
Nesebar Shkorpilovtsi Shabla
Nesebar – 0.005 0.005
Shkorpilovtsi 0.003 – 0.006
Shabla 0.003 0.002 –
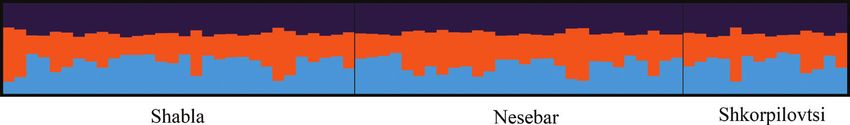
Figure 4. Population structure of Scophthalmus maximus inferred using the programme STRUCTURE
for K = 3 of 72 individuals. Black lines separated individuals from different sampling sites. The structure
analyses showed that the samples from three different localities could not be clustered separately as differ-
ent populations and they are admixed.
from both tests indicate that there is an excess of rare mutations in the populations, but
the excess is statistically non-significant.
Based on the mean log likelihood values LnP(K), Bayesian clustering analysis, im-
plemented in STRUCTURE, indicated K = 3 (LnP = -1695.64) as the most likely
number of clusters (Fig. 4 and Suppl. material 1: Fig. S7).
Morphological variability
Meristic data analyses provided strong statistically significant correlations only between
TL, SL and W (Suppl. material 1: Figs S1, S3, S5), which was rather expected with
respect to individual growth theory basics and moderate positive correlation between
VFR and BPFR with very close values of correlation coefficient values for Shabla, Nese-
bar and Shkorpilovtsi populations (r = 0.55, p = 0.00164; r = 0.58, p = 0.00126; r =
0.057, p = 0.0265), (Table 8). Only the Nesebar population showed moderate positive
correlation between AFR and VFR (r = 0.58, p = 0.01216). As the age of samples was
not determined, to provide a closer look at growth model parameters, the length-weight
relationship (LWR) was studied for comparison. In the Shabla population samples, LWR
was best approximated with a 5th order polynomial model (R2 = 0.6732 – non-linear har-
monic regression would provide even better approximation); in Nesebar samples, LWR
was modelled with the power model: W = 5e – 06*L3.3006 (R2 = 0.0.9608) and in the
Shkorpilovtsi population, LWR was best approximated with 2nd order polynomial model
(R2 = 0.9035). These results might highlight either certain differences in food availability,
accounting for the weight being a highly variable parameter and/or regional environ-
mental specifics or some background noises as seasonal processes or certain physiological
stages, which also may have an impact on the genetic diversity of the studied populations.Genetic and morphological diversity of three Black Sea turbot populations 135
Table 8. Morphometric characters’ correlations.
Morphometric Shabla population (n = 30) Nesebar population (n = 28) Shkorpilovtsi population (n = 14)
characters
M4-M5 Moderate positive correlation: Moderate positive correlation: No correlation
r = 0.52, p = 0.003 r = 0.68, p = 0.00007
M4-M6 Strong positive correlation: Very strong positive correlation: Strong positive correlation:
r = 0.86, p < 0.00001 r = 0.9, p < 0.00001 r = 0.83, p < 0.000129
M5-M6 Moderate positive correlation: Moderate positive correlation: Moderate positive correlation:
r = 0.62, p = 0.0003 r = 0.67, p = 0.00001 r = 0.60, p = 0.018
M6-M10 Moderate positive correlation: Moderate positive correlation: No correlation*
r = 0.55, p = 0.0003 r = 0.57, p = 0.0003 Correlation coefficient r = 0.51 is
significant at significance level a = 0.1
M6-M11 No correlation No correlation Strong positive correlation:
r = 0.71, p < 0.004
M2-M12 Moderate positive correlation: Moderate positive correlation: No correlation
r = 0.54, p = 0.0021 r = 0.62, p = 0.0003
M6-M12 Moderate positive correlation: Moderate positive correlation: Moderate positive correlation:
r = 0.66, p = 0.00007 r = 0.7, p = 0.00003 r = 0.61, p = 0.021
M10-M12 Moderate positive correlation: Moderate positive correlation: Moderate positive correlation:
r = 0.61, p = 0.0003 r = 0.63, p = 0.0003 r = 0.55, p = 0.042
M10-M14 Moderate positive correlation: Moderate positive correlation: Strong positive correlation:
r = 0.7, p = 0.00002 r = 0.61, p = 0.00057 r = 0.73, p = 0.003
M10-M15 Very strong positive correlation: Strong positive correlation: Very strong positive correlation:
r = 0.9, p < 0.00001 r = 0.83, p < 0.00001 r = 0.91, p = 0.00001
M14-M15 Strong positive correlation: Moderate positive correlation: Strong positive correlation:
r = 0.74, p = 0.00001 r = 0.67, p = 0.000096 r = 0.77, p = 0.00013
Correlation analysis applied on morphometric characters revealed a certain linear
functional pattern evident with slight differences amongst the samples, taken from the
populations under investigation. The morphometric characters’ correlation pattern in
Shkorpilovtsi samples was slightly different from the pattern identified for Shabla and
Nesebar samples (although it has to be noted that the correlation coefficient p values
are sensitive to the number of samples n).
Analysis of similarity (ANOSIM) was carried out to identify statistically sig-
nificant differences between the samples. The results showed that there was no sta-
tistically significant differences between Shkorpilovtsi and Shabla and Nesebar and
Shabla samples (Significance Shabla–Shkorpilovtsi = 0.359; Significance Shabla–Nesebar = 0.8869,
with an even distribution of high and low dissimilarity ranks in and between popu-
lations). However, there were statistically significant differences between the sam-
ples taken from Shkorpilovtsi and Nesebar populations (SignificanceShkorpilovtsi–Nesebar =
0.063). In addition, the hierarchical clustering outcome (Suppl. material 1: Figs S2,
S4, S6) showed that the clusters formed are mixed and specimens of all three popu-
lations are represented evenly and, furthermore, no specific outliers were identified.
The latter is also visible from the non-metric multidimensional scaling (NMDS)
plot (Fig. 5). No specific clusters were formed with respect to morphology and only
single specimens are dispersed close to the major cluster formed due to specific mor-
phometric characters deviation (TL, SL and W), which are generally considered to
vary in more broad ranges.136 Petya Ivanova et al. / Nature Conservation 43: 123–146 (2021)
Figure 5. Bray-Curtis-based non-metric multidimensional scaling of Scophthalmus maximus meristic and
morphometric data (all samples).
Discussion
The results obtained in this study correspond to the creation of a database of the genetic
diversity for turbot populations along the Bulgarian Black Sea coast. A comprehensive
analysis of the acquired morphological and molecular data will enable a subsequent as-
sessment of the impact of fishing on the structure of turbot populations. By knowing
the genetic characteristics of valuable populations, we can monitor relatively easy chang-
es in heritable traits and in the level of average genetic diversity (Olsson et al. 2007).
Apparently, the selection of microsatellites with a range of polymorphism has led
to a reduction in the risk of overestimating genetic variability, which might occur with
the selective use of highly polymorphic loci. On the whole, the allelic diversity (mean
number of observed alleles per locus) for populations along the Bulgarian Black Sea
coast (3.559) is higher than that reported by Bessonova and Nebesikhina (2019) for
the same loci in turbot populations from the Crimean Black Sea (3.430) and Azov
Sea (3.420) and lower than species from the Caucasian Black Sea coast (3.623). The
mean values for the obtained and expected heterozygosity (Ho = 0.638 and He =
0.685) are close to those indicated by previous studies for the same loci in turbot
populations (Estoup et al. 1998; Iyengar et al. 2000; Bouza et al. 2002; Bessonova
and Nebesikhina 2019; Turan et al. 2019b; Firidin et al. 2020). The relatively high
heterozygosity and allelic diversity of these populations suggest that local gene flow
takes place amongst them. The observed heterozygosity for Smax-02 and Sma-E79 loci
(Shabla population), for Smax-02, Sma-USC26 and Sma-E79 (Nesebar) and Sma-E79Genetic and morphological diversity of three Black Sea turbot populations 137
(Shkorpilovtsi) are significantly lower than the expected value in turbot populations (P
< 0.05) (Table 3). There are several reasons that can explain this significant reduction in
Ho compared with He, as high rate of migration, errors in reading alleles and inbreed-
ing (Skaala et al. 2004; Li et al. 2009). The unbiased expected heterozygosity (uHe)
showed a mean value of 0.702 ± 0.027, similar for those described by Bessonova and
Nebesikhina (2019) for the Black Sea turbot (0.622 ± 0.086), which marked an equal
level of the genetic diversity in the three populations investigated.
Nevertheless, a significant deviation was detected, from the HWE at a 0.05 α-level
at all of the investigated loci with the exception of Smax-02 locus (Shabla popula-
tion), Smax-02, B12-I GT14, Sma-USC26 and Sma-E79 loci (Nesebar population)
and B12-I GT14 and Sma-E79 loci (Shkorpilovtsi population) (P < 0.05). Departures
from HWE at other loci may be the result of founder and/or bottleneck effects fol-
lowed by a high rate of inbreeding (Kaczmarczyk and Wolnicki 2016). A marker with
a low Fis value will show the genetic diversity of a group more accurately, which means
that this specific marker has a high discrimination power (Han et al. 2018). The posi-
tive and high value for Fis for the three populations was recovered for Smax-02 locus,
based on the small number of the recorded alleles (Table 3) and indicates heterozygote
deficiency that could be caused by inbreeding, presence of null alleles and admixture
of distinct populations (Guo et al. 2013). The Smax-02 locus is also the locus with the
least information (PIC is 0.324) and the lowest Shannon index (0.596).
The studies of the turbot populations, characterised by genetic diversity parameters
(PIC and I), indicate that these values were high for six of the loci analysed (PIC and I
higher than 0.6 and 1.3, respectively) indicating, thereby, high genetic diversity (Froufe
et al. 2004; Fopp-Bayat 2010) (Table 3). The PIC values from each loci varies between
populations analysed (0.622–0.825) and were comparable with the data for turbot
population from the Black Sea (0.713–0.853) (Firidin et al. 2020) and from Turkey,
France and South Korea (PIC 0.3–0.9) (Han et al. 2018) indicating the random loci
were under independent selection pressure and seem to be ideal to be used as a diver-
gence index. For detection of the bottleneck events, the Garza-Williamson index (M)
was successfully employed. The data acquired (ranging from 0.335 to 0.361) across
the studied populations are comparable with the data found for the Varna population
(western Black Sea), based on the same loci (G-W index 0.4 on average) (Turan et al.
2019b), which suggests a sustainable reduction of genetic variation in this population
as a result of founder and/or bottleneck effects (Kaczmarczyk and Wolnicki 2016). It
should be pointed out that, in all studied populations, M indices were lower than 0.68
indicating a recent reduction in population size due to overfishing. The results of the
Mantel test did not detect a clear correlation between geographic distance and the size
of genetic differences existing between populations’ pairs.
Generally, genetic differentiation based on microsatellites is considered as very
weak. The mean value of Fst was 0.014 and the AMOVA results revealed that it was
mostly related to a within-population variation (99.4%) rather than variation amongst
populations (0.6%). The highest Fst value was observed between Shabla and Shkorpi-
lovtsi = 0.016). The population pairwise Fst revealed an overall low level of genetic138 Petya Ivanova et al. / Nature Conservation 43: 123–146 (2021)
structuring between the turbot populations (Table 4). Based on the Fst values, it can
be concluded that the rate of differentiation between populations is low and a high rate
of migration (Nm =17.484, average) can be the main factor underlying this low differ-
entiation. The Fst results were lower when compared to other Black Sea and Marmara
populations (Fst = 0.249 according to Turan et al. 2019 b; Fst = 0.138 according to
Firidin et al. 2020) and evidence of genetic sub-structuring along the Bulgarian Black
Sea coast was not detected.
Mitochondrial DNA polymorphism is widely used to determine population struc-
ture, species differences and evolutionary relationships (Avise et al. 1987). The COIII
gene of mtDNA is a genetic marker used for species identification in the genus Scoph-
thalmus in the Black Sea (Turan et al. 2019a). The S. maximus populations displayed a
genetic pattern typical of a recent population expansion due to its one common COIII
haplotype (Hap 2) present across the range and the high number of unique haplotypes
(Fig. 2). The Shabla population was characterised by the low levels of haplotype diver-
sity (0.389) and nucleotide diversity (0.001) which is probably a result from a founder
event or population bottleneck followed by rapid population growth (Xu et al. 2019).
Population expansion in Shabla was also supported by highly significant negative val-
ues for both Tajima’s D (–1.857, P < 0.05) and Fu’s FS (–5.235 P < 0.05). The values
of genetic diversity, as well as the distribution of private alleles are comparable amongst
the populations, in spite of the low number of samples from Shkorpilovtsi.
The mean haplotype diversity and nucleotide diversity indices calculated as 0.550
and 0.001 for COIII and 0.930 and 0.005 for CR are similar to the data for COI and
Cyt-b for the Black Sea turbot populations presented by Firidin et al. (2020). The
genetic distances calculated, based only on COIII, present clear structure/correlation
between populations according to the geographic distances (Table 7), but they are not
significant according to the Mantel to test.
Studying more variable regions such as mtDNA CR to investigate the genetic vari-
ability across the Black Sea would give more valuable information about population
structuring, based on mtDNA analyses (Firidin et al. 2020; Ivanova et al. 2020). The
high levels of genetic diversity and low levels of nucleotide diversity observed in S. maxi-
mus, based on the mtDNA CR sequences, are in agreement with earlier studies of turbot
populations from the Black Sea (Suzuki et al. 2004; Atanassov et al. 2011; Ivanova et al.
2020). A similar spatial pattern of distribution of genetic variability in mtDNA control
region was also reported for other fishes (Xiao et al. 2008, 2014). High haplotype diver-
sity in CR suggests large, stable, effective population sizes over time in the continental
shelf fishes (Stepien 1999) and, in concurrence with low nucleotide diversity, it has been
linked to population growth after a period of low effective population size (Grant and
Bowen 1998). The inference of population expansion is further supported by the star-
like patterns in Figure 3. The low nucleotide diversity in CR indicate a high number
of closely-related haplotypes and suggest that this population may have undergone a
recent expansion (Slatkin 1993; Mendez-Harclerode et al. 2007), supported also by
non-significant and negative Tajima’s D and Fu’s Fs (Alcaraz and Gholami 2020).Genetic and morphological diversity of three Black Sea turbot populations 139
Pairwise Fst values were very low, with the highest value for COIII observed be-
tween Shabla and Shkorpilovtsi populations and for CR between Shkorpilovtsi and
Nesebar populations. Therefore, no significant genetic differentiation was evident be-
tween any populations and showed that S. maximus within the examined range con-
stitutes a non-differential mtDNA gene pool. Results from STRUCTURE analysis
(Fig. 4) also revealed some degree of admixture in the studied populations. In this
regard, the observed heterozygote deficiency could also be caused by inbreeding de-
pression, as a result of wild populations experiencing considerable reduction mainly
because of overfishing and increased level of pollution.
The present mtDNA and microsatellite analyses of turbot populations along the
Bulgarian Black Sea coast using seven microsatellites and two mtDNA markers give no
evidence for genetic subdivision of this species in comparison with population genetic
structuring found between the north and south Black Sea populations using microsat-
ellites (Firidin et al. 2020). Based on both microsatellite and mtDNA analyses, Turan
et al. (2019b) found one genetic unit of turbot in the Black Sea (Trabzon, Duzdge,
Varna and Sevastopol populations). In the present study, S. maximus populations were
considered to be a single stock, which probably could be attributed to this genetic unit.
A lack of correlation between genetic and geographic distances along the Bulgarian
Black Sea coast was recorded. This result may be evidence of the hydrodynamic factors
that have an effect on the dispersal potential of larvae phases and subsequently affect
genetic differentiation (Vandamme et al. 2014, 2020). S. maximus spawn with pe-
lagic eggs (Vasil’eva 2007) and perform compensatory migration to the north against
taking the caviar to the south of the currents along the Bulgarian coast (Karapetko-
va and Zhivkov 2006). Considering the lack of long active migration of species, the
ocean currents might be responsible for this homogeneity in examined groups. In the
North Sea, the turbot larvae drift on average 102 km (Barbut et al. 2019). Seawater
temperature, food availability and coastal currents explain a significant component of
geographically distributed genetic variation, suggesting that these factors act as drivers
of local adaptation (Ruggeri et al. 2016; Diopere et al. 2017). The strength of local
adaptation is dependent on the interaction between connectivity, population size and
environmentally and human induced pressures (Bernatchez 2016).
Fishing pressure on turbot stock affects the size of the catches; however, there is no
evidence of the impact of fishing on population genetic diversity. Genetic monitoring,
in addition to the stock assessment, should also be carried out to track and identify all
the potential population-genetic changes. Placing a restriction on the maximum catch
size of 45 mm prevents the loss of rare alleles from older and larger individuals. It could
also be an effective tool for protecting the genetic diversity. The regular monitoring and
quota determination of the S. maximus populations are necessary to control the turbot
population status. Close collaboration between molecular geneticists and fisheries bi-
ologists would be required to undertake extensive research into the recruiting processes
of the marine populations and their possible implications for fisheries management
and conservation (Hauser et al. 2002).140 Petya Ivanova et al. / Nature Conservation 43: 123–146 (2021)
Conclusions
The DNA barcoding has proved to be an invaluable tool for tracking and monitor-
ing of endangered populations, thus giving a sharper focus on the strategic con-
servation of distinct genetic stocks and mitigation on human impacts along their
range. The molecular characterisation and analysis of the genetic structure in turbot
populations along the Bulgarian Black Sea coast contributes to the considerable
knowledge about the levels and genetic diversity distribution patterns. Microsatel-
lite and mitochondrial markers both indicated close genetic relationships between
populations. It should, however, be pointed out that, in the examined populations,
a high level of genetic diversity was observed. The lack of strong population genetic
structure was probably due to the small geographic distances and high gene flow
between them. The derived low values of the G-W index are specific for reduced
populations and may indicate a dramatic decrease in the population size in the
past. The applied molecular approach proves critical for any rigorous monitoring of
the impacts of overexploitation and genetic management of threatened fish species
along the Bulgarian Black Sea coast. The results confirmed the high effectiveness of
the use of different types of markers for performing genetic analysis and relevant
provision of reliable information with regard to the genetic diversity within the tur-
bot populations. The genetic characteristics of turbot populations, revealed in this
study, will provide useful information for continuous and effective resource manage-
ment. Moreover, constant monitoring may be needed to maintain the high level of
genetic diversity in natural populations.
Finally, the underlying rationale behind the adoption of a more integrated ap-
proach (genetic and morphological) to the study of S. maximus populations in the
Bulgarian Black Sea coast will provide more accurate assessment of the population
structure as well as it will facilitate detection of any probable changes in gene pools
of the wild populations in connection with their more effective management. There-
fore, a proper understanding and a sound knowledge of the level and distribution
of genetic diversity in turbot is an important prerequisite for successful sustainable
development and conservation strategies to preserve their evolutionary potential.
Acknowledgements
This work has been carried out in the framework of the National Science Program “En-
vironmental Protection and Reduction of Risks of Adverse Events and Natural Disas-
ters”, approved by the Resolution of the Council of Ministers N° 577/17.08.2018 and
supported by the Ministry of Education and Science (MES) of Bulgaria (Agreement
N° D01-230/06.12.2018). The authors would like to thank the reviewers whose com-
ments and suggestions helped improve and clarify this manuscript.Genetic and morphological diversity of three Black Sea turbot populations 141
References
Alcaraz C, Gholami Z (2020) Diversity and structure of fragmented populations of a threat-
ened endemic cyprinodontid (Aphanius sophiae) inferred from genetics and otolith mor-
phology: Implications for conservation and management. Journal of Zoological Systemat-
ics and Evolutionary Research 58(1): 341–355. https://doi.org/10.1111/jzs.12333
Atanassov I, Ivanova P, Panayotova M, Tsekov A, Rusanov K (2011) Mitochondrial control
region DNA variation in turbot populations from the Bulgarian and Romanian Black
Sea coasts. Biotechnology, Biotechnological Equipment 25(4): 2627–2633. https://doi.
org/10.5504/BBEQ.2011.0068
Avise JC, Arnold J, Ball RM, Bermingham E, Lamb T, Neigel JE, Reeb CA, Saunders NC
(1987) Intraspecific phylogeography: The mitochondrial DNA bridge between popula-
tion genetics and systematics. Annual Review of Ecology and Systematics 18(1): 489–522.
https://doi.org/10.1146/annurev.es.18.110187.002421
Barbut L, Groot Crego C, Delerue-Ricard S, Vandamme S, Volckaert FAM, Lacroix G (2019)
How larval traits of six flatfish species impact connectivity. Limnology and Oceanography
64(3): 1150–1171. https://doi.org/10.1002/lno.11104
Bernatchez L (2016) On the maintenance of genetic variation and adaptation to environmental
change: Considerations from population genomics in fishes. Journal of Fish Biology 89(6):
2519–2556. https://doi.org/10.1111/jfb.13145
Bessonova NA, Nebesikhina NA (2019) Investigation of the genetic structure of the Black Sea
turbot Scophthalmus maeoticus (Scophthalmidae) population in the Azov and Black Seas.
Aquatic Bioresources and Environment 2(4): 60–67. https://doi.org/10.47921/2619-
1024_2019_2_4_60
Bouza C, Presa P, Castro J, Sánchez L, Martinez P (2002) Allozyme and microsatellite diver-
sity in natural and domestic populations of turbot (Scophthalmus maximus) in comparison
with other Pleuronectiformes. Canadian Journal of Fisheries and Aquatic Sciences 59(9):
1460–1473. https://doi.org/10.1139/f02-114
Clement M, Snell Q, Walke P, Posada D, Crandall K (2002) TCS: estimating gene genealogies.
Proceedings of 16th International Parallel and Distributed Processing Symposium 2: e184.
https://doi.org/10.1109/IPDPS.2002.1016585
Diopere E, Vandamme SG, Hablützel P, Cariani A, Van Houdt J, Rijnsdorp A, Tinti F (2017)
FishPopTrace Consortium, Volckaert FAM, Maes GE (2017) Seascape genetics of a flatfish
reveals local selection under high levels of gene flow. ICES Journal of Marine Science.
https://doi.org/10.1093/icesjms/fsx160
do Prado FD, Vera M, Hermida M, Bouza C, Pardo BG, Vilas R, Blanco A, Fernández C,
Maroso F, Maes GE, Turan C, Volckaert FAM, Taggart JB, Carr A, Ogden R, Nielsen EE,
Martínez P (2018) Parallel evolution and adaptation to environmental factors in a marine
flatfish: Implications for fisheries and aquaculture management of the turbot (Scophthal-
mus maximus). Evolutionary Applications 11(8): 1322–1341. https://doi.org/10.1111/
eva.12628142 Petya Ivanova et al. / Nature Conservation 43: 123–146 (2021)
Earl DA, Von Holdt BM (2012) Structure harvester: A website and program for visualizing
STRUCTURE output and implementing the Evanno method. Conservation Genetics Re-
sources 4(2): 359–361. https://doi.org/10.1007/s12686-011-9548-7
Estoup A, Gharbi K, SanCristobal M, Chevale C, Haffray P, Guyomard R (1998) Parent-
age assignment using microsatellites in turbot (Scophthalmus maximus) and rainbow trout
(Oncorhynchus mykiss) hatchery populations. Canadian Journal of Fisheries and Aquatic
Sciences 55(3): 715–723. https://doi.org/10.1139/f97-268
Evanno G, Regnaut S, Goudet J (2005) Detecting the number of clusters of individuals using
the software STRUCTURE: A simulation study. Molecular Ecology 14(8): 2611–2620.
https://doi.org/10.1111/j.1365-294X.2005.02553.x
Excoffier L, Lischer HEL (2010) Arlequin suite ver 3.5: A new series of programs to perform
population genetics analyses under Linux and Windows. Molecular Ecology Resources
10(3): 564–567. https://doi.org/10.1111/j.1755-0998.2010.02847.x
Firidin S, Ozturk RC, Alemdag M, Eroglu O, Terzi Y, Kutlu I, Duzgunes ZD, Eyup Cakmak
E, Aydin I (2020) Population genetic structure of turbot (Scophthalmus maximus L., 1758)
in the Black Sea. Journal of Fish Biology 2020: 1–11. https://doi.org/10.1111/jfb.14487
Fopp-Bayat D (2010) Microsatellite DNA variation in the Siberian sturgeon, Acipenserbaeri
(Actinopterygii, Acipenseriformes, Acipenseridae), cultured in a Polish fish farm. Acta Ich-
thyologica et Piscatoria 40(1): 21–25. https://doi.org/10.3750/AIP2010.40.1.03
Froufe E, Sefc KM, Alexandrino P, Weiss S (2004) Isolation and characterization of Brachy-
mystaxlenok microsatellite loci and cross-species amplification in Hucho spp. and Para-
huchoperryi. Molecular Ecology Notes 4(2): 150–152. https://doi.org/10.1111/j.1471-
8286.2004.00594.x
Galili T (2015) dendextend: An R package for visualizing, adjusting and comparing trees of
hierarchical clustering. Bioinformatics (Oxford, England) 31(22): 3718–3720. https://doi.
org/10.1093/bioinformatics/btv428
Grant WS, Bowen BW (1998) Shallow population histories in deep evolutionary lineages of
marine fishes: Insights from sardines and anchovies and lessons for conservation. The Jour-
nal of Heredity 89(5): 415–426. https://doi.org/10.1093/jhered/89.5.415
Guo W, Yu X, Tong J (2013) Development of 134 novel polynucleotide-repeat microsatellite
markers in Silver Carp (Hypophthalmichthys molitrix). Conservation Genetics Resources
5(2): 525–528. https://doi.org/10.1007/s12686-012-9843-y
Han J, Lee WS, Jung TS, Aydin I, Lee W-J (2018) Evaluation of genetic diversity and popu-
lation genetic parameters of farmed turbot species (Scophtalmus maximus) from France,
Turkey, and Korea. Genetics of Aquatic Organisms 2: 1–6. https://doi.org/10.4194/2459-
1831-v2_1_01
Hauser L, Adcock GJ, Smith PJ, Ramírez JHB, Carvalho GR (2002) Loss of microsatellite
diversity and low effective population size in an overexploited population of New Zealand
snapper (Pagrus auratus). Proceedings of the National Academy of Sciences of the United
States of America 99(18): 11742–11747. https://doi.org/10.1073/pnas.172242899
Hewitt G (2000) The genetic legacy of the Quaternary ice ages. Nature 405(6789): 907–913.
https://doi.org/10.1038/35016000
IUCN (2019) The IUCN Red List of Threatened Species. Version 2019-2. http://www.iucn-
redlist.orgGenetic and morphological diversity of three Black Sea turbot populations 143
Ivanova P, Dzhembekova N, Atanassov I, Rusanov K, Raykov V, Zlateva I, Yankova M (2020)
Applicability of control region of mitochondrial DNA for assessment of turbot populations
along the Bulgarian Black Sea coast. 1st International Conference on Environmental Pro-
tection and Disaster RISKs, 2020, 221–230. https://doi.org/10.48365/ENVR-2020.1.20
Iyengar A, Piyapattanakorn S, Heipel DA, Stone DM, Howell BR, Child AR, Maclean N
(2000) A suite of highly polymorphic microsatellite markers in turbot (Scophthalmus maxi-
mus) with potential for use across several flatfish species. Molecular Ecology 9(3): 365–378.
https://doi.org/10.1046/j.1365-294x.2000.00874-3.x
Kaczmarczyk D, Wolnicki J (2016) Genetic diversityof the critically endangered lake minnow
Eupallasella percnurusin Poland and its implications for conservation. PLoS ONE 11(12):
e0168191. https://doi.org/10.1371/journal.pone.0168191
Karapetkova M, Zhivkov M (2006) Fishes in Bulgaria. Geya Libris Publishers, Sofia, 215 pp.
[in Bulgarian]
Kopelman NM, Mayzel J, Jakobsson M, Rosenberg NA, Mayrose I (2015) Clumpak: A pro-
gram for identifying clustering modes and packaging population structure inferences
across K. Molecular Ecology Resources 15(5): 1179–1191. https://doi.org/10.1111/1755-
0998.12387
Kumar S, Stecher G, Li M, Knyaz C, Tamura K (2018) MEGA X: Molecular Evolutionary
Genetics Analysis across computing platforms. Molecular Biology and Evolution 35(6):
1547–1549. https://doi.org/10.1093/molbev/msy096
Lê S, Josse J, Husson F (2008) FactoMineR: An R Package for Multivariate Analysis. Journal of
Statistical Software 25(1): 1–18. https://doi.org/10.18637/jss.v025.i01
Li J, Wang G, Bai Z (2009) Genetic variability in four wild and two farmed stocks of the Chinese
freshwater pearl mussel (Hyriopsis cumingii) estimated by microsatellite DNA markers.
Aquaculture (Amsterdam, Netherlands) 287(3–4): 286–291. https://doi.org/10.1016/j.
aquaculture.2008.10.032
Librado P, Rozas J (2009) DnaSP v5: A software for comprehensive analysis of DNA poly-
morphism data. Bioinformatics 25: 1451–1452. https://doi.org/10.1093/bioinformatics/
btp187
Liu ZJ, Cordes JF (2004) DNA marker technologies and their applications in aquaculture
genetics. Aquaculture (Amsterdam, Netherlands) 238(1): 1–37. https://doi.org/10.1016/j.
aquaculture.2004.05.027
Madduppa HH, Timm J, Kochzius M (2018) Reduced genetic diversity in the clown anemone-
fish Amphiprion ocellaris in exploited reefs of apermonde Archipelago, Indonesia. Frontiers
in Marine Science 5: e80. https://doi.org/10.3389/fmars.2018.00080
Maechler M, Rousseeuw P, Struyf A, Hubert M, Hornik K (2018) Cluster: Cluster Analysis
Basics and Extensions. R package version 2.0.7.
Mendez-Harclerode FM, Strauss RE, Fulhorst ChF, Milazzo ML, Ruthven DC III, Bradley
RD (2007) Molecular evidence for high levels of intrapopulation genetic diversity in
Woodrats (Neotoma Micropus). Journal of Mammalogy 88(2): 360–370. https://doi.
org/10.1644/05-MAMM-A-377R1.1
Navajas-Pérez R, Robles F, Molina-Luzón MJ, De La Herran R, Álvarez-Dios JA, Pardo BG,
Vera M, Bouza C, Martínez P (2012) Exploitation of a turbot (Scophthalmus maximus
L.) immune-related expressed sequence tag (EST) database for microsatellite screening andYou can also read