VLA-1 Binding to Collagen IV Controls Effector T Cell Suppression by Myeloid-Derived Suppressor Cells in the Splenic Red Pulp
←
→
Page content transcription
If your browser does not render page correctly, please read the page content below
ORIGINAL RESEARCH
                                                                                                                                             published: 18 January 2021
                                                                                                                                       doi: 10.3389/fimmu.2020.616531

                                            VLA-1 Binding to Collagen IV
                                            Controls Effector T Cell Suppression
                                            by Myeloid-Derived Suppressor Cells
                                            in the Splenic Red Pulp
                                            Ina N. Eckert 1†, Eliana Ribechini 1†, Katja J. Jarick 2, Sandra Strozniak 1, Sarah J. Potter 1,
                              Edited by:    Andreas Beilhack 2 and Manfred B. Lutz 1*
                 Julia Szekeres-Bartho,
                                            1 Institute for Virology and Immunobiology, University of Würzburg, Würzburg, Germany, 2 Department of Internal Medicine II,
            University of Pécs, Hungary
                                            University Hospital Würzburg, Würzburg, Germany
                    Reviewed by:
                   Gerard Chaouat,
       INSERM U976 Immunologie,             Myeloid-derived suppressor cells (MDSCs) represent a major population controlling T cell
    Dermatologie, Oncologie, France
                                            immune responses. However, little is known about their molecular requirements for
            Maikel Peppelenbosch,
Erasmus Medical Center, Netherlands         homing and T cell interaction to mediate suppression. Here, we investigated the
                   *Correspondence:         functional role of the homing and collagen IV receptor VLA-1 (a1b1-integrin) on in vitro
                      Manfred B. Lutz       GM-CSF generated murine MDSCs from wild-type (WT) and CD49a/a1-integrin (Itga1−/−)
          m.lutz@vim.uni-wuerzburg.de
     †
                                            gene-deficient mice. Here, we found that effector (Teff) but not naive (Tn) CD4+ T cells
      These authors have contributed
                 equally to this work
                                            express VLA-1 and monocytes further up-regulated their expression after culture in
                                            GM-CSF when they differentiated into the monocytic subset of resting MDSCs
                     Specialty section:     (R-MDSCs). Subsequent activation of R-MDSCs by LPS+IFN-g (A-MDSCs) showed
           This article was submitted to
               Immunological Tolerance
                                            increased in vitro suppressor potential, which was independent of VLA-1. Surprisingly,
                         and Regulation,    VLA-1 deficiency did not influence A-MDSC motility or migration on collagen IV in vitro.
                 a section of the journal   However, interaction times of Itga1−/− A-MDSCs with Teff were shorter than with WT
                Frontiers in Immunology
                                            A-MDSCs on collagen IV but not on fibronectin substrate in vitro. After injection, A-MDSCs
           Received: 12 October 2020
         Accepted: 26 November 2020         homed to the splenic red pulp where they co-localized with Teff and showed immediate
          Published: 18 January 2021        suppression already after 6 h as shown by inhibition of T cell proliferation and induction of
                              Citation:     apoptosis. Injection of A-MDSCs from Itga1−/− mice showed equivalent homing into the
      Eckert IN, Ribechini E, Jarick KJ,
Strozniak S, Potter SJ, Beilhack A and
                                            spleen but a reduced suppressive effect. Interaction studies of A-MDSCs with Teff in the
     Lutz MB (2021) VLA-1 Binding to        subcapsular red pulp with intravital two-photon microscopy revealed also here that MDSC
   Collagen IV Controls Effector T Cell     motility and migration parameters were not altered by VLA-1 deficiency, but the interaction
              Suppression by Myeloid-
              Derived Suppressor Cells      times with Teff were reduced. Together, our data point to a new role of VLA-1 adhesion to
               in the Splenic Red Pulp.     collagen IV as a prerequisite for extended contact times with Teff required for suppression.
          Front. Immunol. 11:616531.
    doi: 10.3389/fimmu.2020.616531          Keywords: myeloid-derived suppressor cells (MDSCs), T cells, VLA-1, homing, spleen

Frontiers in Immunology | www.frontiersin.org                                       1                                       January 2021 | Volume 11 | Article 616531
Eckert et al.                                                                                                       VLA-1 Controls MDSC Function

INTRODUCTION                                                                pulp of the spleen (8). In fact, this has been observed for MDSC
                                                                            localization in tumor-bearing mice (20, 23). However, MDSCs
MDSCs were initially identified in tumor-bearing mice and other              can express also the lymph node homing receptors CD62L (6)
diseases such as infections, trauma and chronic inflammation                 and CCR7 (24), enabling their homing also to sites of T cell
(1, 2). MDSCs can control T cell immune responses and their                 priming. In addition, both Ly-6Chigh monocytes and Ly-6Chigh
major role in modulating T cell responses against tumors is well            monocytic MDSCs express CCR2 to home to their target organs
established. Murine MDSCs can be subdivided into granulocytic               such as inflammatory sites or tumors (25, 26). Thus, MDSCs may
(CD11b+ Ly-6Clow Ly-6G+) and monocytic (CD11b+ Ly-6Chigh                    have different options for homing, depending on the type of
Ly-6G - ) subsets (3–5). However, this marker profile is                     inflammation, infection or tumor disease and the early or late
insufficient to distinguish non-suppressive monocytes or                     stage of an immune response. Here we investigated VLA-1
granulocytes from their suppressive MDSC counterparts,                      expressed by monocytic MDSCs as a homing receptor and
respectively, or to dissect differentiated MDSCs from their                 interaction partner for collagen IV in the spleen. Surprisingly,
immediate precursor stages (1). We established a protocol to                VLA-1 did not guide MDSC homing into the spleen or influence
generate murine MDSCs from bone marrow (BM) (6). This                       MDSC migration behavior on collagen IV, but instead collagen
protocol allowed us to study the stepwise signaling events for              IV interaction was required by MDSCs to interact with Teff as a
MDSC generation. We found that monocytes may not directly                   meeting platform.
convert into A-MDSCs in vitro but may require GM-CSF
signaling as an intermediate step of “monocyte licensing,” a
state that could be also considered as “resting monocytic
MDSCs” (R-MDSCs). In vivo, repetitive injections of GM-CSF                  MATERIALS AND METHODS
into mice led to R-MDSC accumulation in the spleen and
microbial stimulation converted them into monocytic A-                      Mice and Animal Experiments
MDSCs, which mediated iNOS-dependent suppression (7).                       C57BL/6 were originally purchased from Charles River. C57BL/
Although the spleen has been identified as a critical organ to               6, C57BL/6 albino, OT-II.dsRed, OT-II.CD90.1, and Itga1−/−
coordinate MDSC functions (5, 8), MDSC homing into the                      mice (27) were bred in the animal facilities of the Institute of
spleen and their migration within the spleen remains largely                Virology and Immunobiology at the University of Würzburg
unclear. In mycobacteria-vaccinated mice MDSC accumulation                  under specific pathogen-free conditions. All animal experiments
occurred preferentially in the red pulp and bridging channels. An           were performed after permission of and under control of the
inflammatory challenge directed them into the white pulp and                 local government (Regierung von Unterfranken, AZ 55.2-2532-
activated them to induce dendritic cells (DC) killing but left the          2-200).
white pulp T cells unaffected (9).
    Lymph node and splenic white pulp homing of T cells is a                MDSC Generation and Activation
typical feature of naive T cells (Tn), while Teff step-wise lose this       MDSCs were generated from murine BM as described in detail
property and acquire a different homing pattern. Specific homing             before (6). Briefly, BM single cell suspensions were cultured for 3
receptors that guide Teff include the “very late antigen” (VLA)             days with murine recombinant GM-CSF (200 U/ml, Peprotech)
integrin family members that are composed of different a1-a6                or the equivalent amount of supernatant from a GM-CSF
chains pairing with the b1 integrin chain (10). The expression of           producing cell line (28). To obtain activated monocytic
the integrin a1b1 (VLA-1, CD49a/CD29) appears 5–6 days after                MDSCs (A-MDSCs) releasing NO as a suppressor molecule,
activation at the T cell surface and is kept as a typical memory            LPS (100 ng/ml, Sigma Aldrich) and IFN-g (100 U/ml,
marker. VLA-1 is functioning mainly as collagen IV receptor and             Peprotech) were added as described (5) for 4 h or overnight
poorly binds other extracellular matrix (ECM) components (11–               as indicated.
14). The red pulp is the only anatomical region in the spleen
where collagen IV is freely accessible for interaction with cells           FACS Analyses
(15, 16) leading to the accumulation of Teff in the red pulp (17–           To block FcgR II/III interactions cells were incubated with 10%
20). VLA-1+ Teff are generated at frequencies of 8–10% among                hybridoma clone 2.4G2 supernatant (ATCC) in the dark for
splenic Teff and up to 30% at infection sites such as the lung (21).        20 min on ice. Cell surface markers were stained in PBS
Thus, Tn cell priming occurs in the paracortex of lymph nodes or            containing 0.1% BSA (Serva), 0.1% sodium azide (Roth) and
the white pulp of the spleen (T cell areas) but VLA-1+ Teff are             10% hybridoma clone 2.4G2 supernatant in the dark for 15 to
detected outside these areas, mainly in the red pulp.                       30 min on ice. For staining intranuclear antigens, the cells were
    A major function of MDSCs is to control immune responses                incubated with Cytofix/Cytoperm solution (eBiosciences) for
during late stages of infections or during chronic inflammation              30 min at room temperature and subsequent antibody staining
to limit immunopathology, rather than to prevent the initial                was performed with Perm buffer (BD Pharmingen) for 45 to
priming of immune responses against pathogens (22). In this                 60 min at room temperature. For annexin V staining, the cells
scenario, MDSCs should accumulate and act preferentially                    were stained with 0.5 ml annexin V in 50 ml annexin V binding
on Teff, rather than on naive T cells. Since T cell priming                 buffer. After 15 min incubation at room temperature, 100 ml
occurs in the lymph nodes or the splenic white pulp, Teff                   annexin V binding buffer were added and the samples were
accumulation and control can be detected rather in the red                  acquired within 1 h. All samples were measured using the BD

Frontiers in Immunology | www.frontiersin.org                           2                                January 2021 | Volume 11 | Article 616531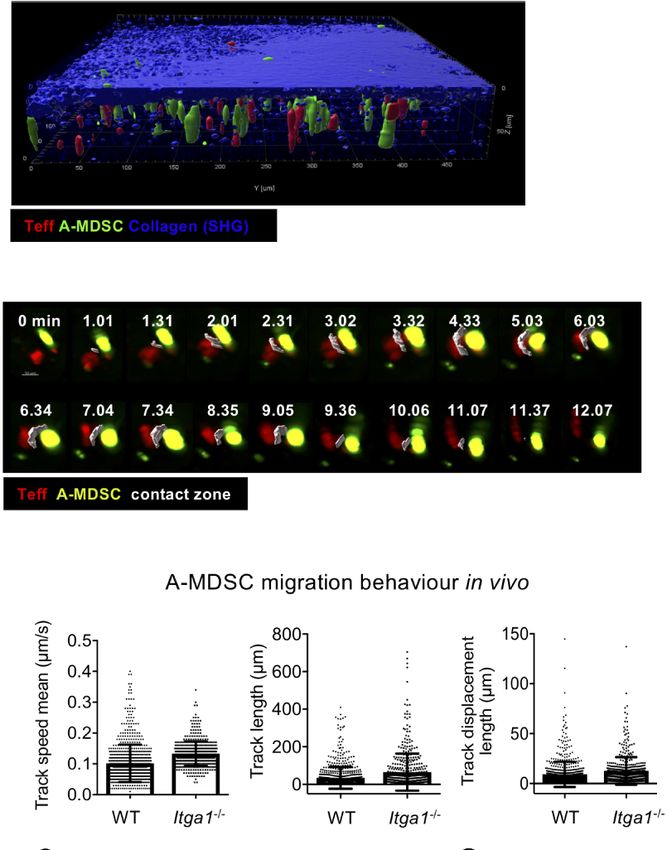
Eckert et al.                                                                                                     VLA-1 Controls MDSC Function

LSR II Flow Cytometer and the data was analyzed via FlowJo 10             MDSC Migration and Interaction With
(Tree Star) and Prism 5 or 7 (GraphPad). Anti-mouse directly              T Cells In Vitro
conjugated antibodies CD11b-PerCP-Cy5.5 (M1/70), CD11b-                   WT or Itga1−/− MDSCs were harvested, spun down and
Alexa Fluor 700 (M1/70), Ly6G-PerCP-Cy5.5 (1A8), Ly6G-                    resuspended in complete media at a concentration of 3 × 10⁶
APC/Fire (1A8), Ly6C-Alexa Fluor 647 (HK1.4),                             cells/ml into a 50-ml falcon and pre-activated by a 4-h
Ly6C-Brilliant Violet 510 (HK1.4), CD49a-PE (HMa1),                       incubation time with 1 µg/ml LPS + 0.5 µg/ml IFN-g at 37°C.
CD49a-APC (HMa1), Thy1.1-PerCP-Cy5.5 (30-H12), CD4-                       Cells were washed with PBS and CFSE-labeled. Teff OT-II cells
PerCP-Cy5.5 (GK1.5), CD8-APC (53-6.7), CD25-PE-Cy7                        were derived from OT-II.dsRed mice and generated by repeated
(PC61), CD62L-Alexa Fluor 700 (Mel14), CD69-Alexa Fluor                   stimulations with the cognate peptide under Th1 conditions.
488 (H1.2F3), CD69-APC (H1.2F3), Ki-67-Alexa Fluor 647                    Cells were mixed at a ratio 1:2 (MDSC:T) and transferred into a
(16A8), Ki-67-FITC (16A8), iNOS-FITC or -PE (XCNFT), and                  m-slide 8 well chamber (IBIDI, #80821) pre-coated with
annexin V-FITC were all purchased from Biolegend.                         fibronectin (20 mg/ml) or collagen IV (100 mg/ml), both Sigma.
                                                                          Cell-interactions were imaged using an inverted Confocal Laser
Tn and Teff Preparation and T Cell                                        Scanning Microscope (Zeiss LSM 780) with an XL incubator
Suppressor Assays                                                         special for live cell imaging. Acquisition was performed using a
Lymph nodes and spleens were collected from C57BL/6, OT-                  10× objective and acquiring consecutive pictures in 4 different
II.dsRed or congenic OT-II.CD90.1 mice and processed until cell           quadrants every 15 s for a total of 60 min (approx. 200 cycles).
suspension following standard protocols. Upon erythrocyte lysis,
cells were cultured for 6 days in a 24-well plate seeded at a             Fluorescence Microscopy
concentration of 2 × 10⁶ cells/well in the presence of 1 µM               Spleens from euthanized mice were collected and transferred
OVA323-339 peptide. At days 6–7, cells were collected and tested          into tubes containing OCT compound (Tissue-Tek, SAKURA),
by FACS for their surface expression of VLA-1 and effector                immediately frozen, and stored at (-80°C). Organs were cut into
markers. As counterpart, Tn freshly isolated from the same                10-mm-thick slices using a Cryotome (Leica), the sections were
organs of littermate mice were used in parallel for in vitro              fixed for 7 min in acetone at room temperature and in case of
suppression assays. Teff were kept in culture and re-stimulated           biotinylated antibody usage subsequently treated with the
weekly in the presence of cognate peptide and Th1 polarizing              Avidin/Biotin Blocking Kit (Vector Laboratories). The primary
conditions with LPS-matured DCs in order to favor and                     antibodies VLA-1-PE (clone HMa1), CD90.1-Biotin (OX-7),
maintain VLA-1 expression (29). Tn and Teff OT-II cells were              CD169-Alexa Fluor 647 (3D6.112), CD11b-Biotin (M1/70) and
used in an inhibition T cell proliferation assay by plating 20.000–       CD11b-Alexa Fluor 488 (M1/70) (all Biolegend) were diluted
200.000 T cells/well stimulated with 1 µM OVA peptide and                 1:100 in PBS with 2% FCS and incubated for 1 h at room
titrations of MDSCs in a 96-well plate, round-bottomed; triplicate        temperature in a wet chamber. Slides were washed several times
cultures were pooled for analyses. When syngeneic naive T cells           in PBS and Streptavidin-Cy3 (Biolegend) diluted 1:300 in PBS
from C57BL/6 WT mice were used, the same procedure was                    with 2% FCS was added for 30 min at room temperature. Finally,
applied but bulk T cells were stimulated by adding anti-CD3 and           slides were repeatedly washed in PBS, dried, and mounted with
anti-CD28 antibodies (2.5 µg/ml each). After 4–5 days                     Fluoromount-G (SouthernBiotech). Tissue sections were all
proliferation of T cells labelled with CFSE (Sigma), CellTrace            visualized and further analyzed with a confocal fluorescence
Violet (Invitrogen) or eFluor670 (Invitrogen) was measured by by          microscope (Zeiss LSM780) and the ZEN Black 8.1 software
flow cytometry (30). In some cases, proliferation was assessed by          (Zeiss) and processed via the ImageJ 1.51h software.
staining for Ki67 (2.5 µg/ml) after 3 days (31).
                                                                          MDSC Migration In Vivo and Interaction
                                                                          With T Cells
Bioluminescence                                                           For the in vivo characterization, cells were prepared as described
For in vivo bioluminescence imaging (32, 33), mice were                   before, mixed at a ratio 1:1 (7-10 × 106 CFSE-labeled A-MDSC +
anesthetized with an intraperitoneal injection of 80 mg/kg                7 to 10 × 106 OT-II.dsRed T cells) and transferred intravenously.
body weight ketamine hydrochloride (Pfizer) and 16 mg/kg                   1 h later mice were anesthetized and a small incision in the left
body weight xylazine (cpPharma). Together with anesthetics,               side was performed in order to expose the spleen. Cling foil
mice were injected with 300 mg/kg body weight D-luciferin                 was used to avoid lint sources in the microscope. The mouse was
(Biosynth). Ten minutes later, bioluminescence signals of the             positioned on a heating pad and the exposed spleen was
anesthetized mice were recorded using an IVIS Spectrum                    positioned under a glass cover slip using two custom-made
imaging system (Perkin-Elmer/Caliper Life Sciences). Pictures             holders. The tissue was kept moist using sterile 0.9% NaCl
were taken from the lateral view in automatic mode with a                 solution. A multiphoton microscope TrimScope II equipped
maximum exposure time of five min per picture. For ex vivo                 with a titanium sapphire laser (Chameleon Ultra II, Coherent),
imaging, mice were injected with D-luciferin and euthanized               beam splitters at 500, 570, and 655 nm, bandpass filters 420/50,
10 min later. Internal organs were removed and subjected to ex            535/50, 605/70, and the photomultipliers from Lavision Biotec
vivo bioluminescence imaging. Pictures were evaluated using               were used. Fluorophores were excited at a wavelength of 840 nm.
Living Image 4.0 software (Caliper Life Sciences).                        The light intensity was increased as the square of penetration

Frontiers in Immunology | www.frontiersin.org                         3                                January 2021 | Volume 11 | Article 616531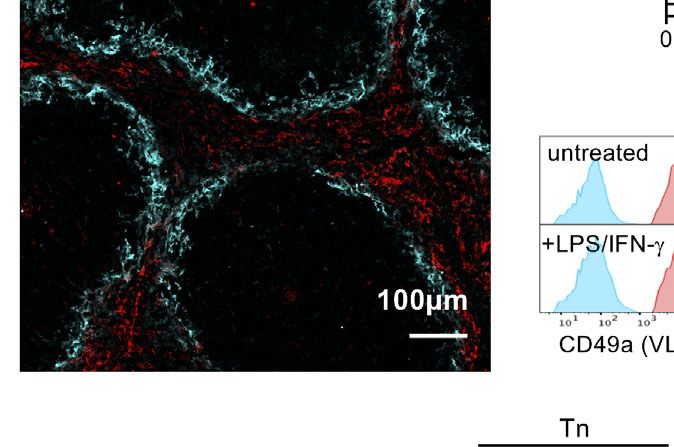
Eckert et al.                                                                                                     VLA-1 Controls MDSC Function

depth along the z-axis, between 5 and 30%. Images were acquired          the expression and function of VLA-1 on MDSCs is unknown.
every 30 s in a field of view of 500 µm × 500 µm with a resolution        Our data indicate that in vitro generated Ly-6Chi monocytic
of 512 × 512 pixels and in a subcapsular region with a range of          R-MDSCs express VLA-1 and even at higher levels as compared
70–90 mm in the z-plane. MDSC and T cell migration and                   with fresh Ly-6Chi monocytes, while granulocytic Ly-6G+ cells in
interaction were recorded for 30–90 min. Imaris (Bitplane,               the cultures did not (Figure 1B). Since we wanted to study
Zurich, Switzerland) was used for four-dimensional image                 VLA-1 dependent homing into the spleen we tested for
analysis (x,y,z,t). The cell tracking was manually corrected and         endogenous cell expression of VLA-1 in the spleen. We
although no filters were applied to process the data, only tracks         analyzed cryosections by immunofluorescence and found a
with durations >60 s were included in the analysis.                      strong and almost exclusive VLA-1 staining in the splenic red
                                                                         pulp of mice (Figure 1C). Together, these data indicate that both
Adoptive Co-transfer of MDSCs and                                        Teff and Ly-6Chi monocytic R-MDSCs express VLA-1, and
T Cells for Suppression In Vivo                                          VLA-1 expression in the spleen is restricted to the red pulp.
Teff were generated from C57BL/6 OT-II.CD90.1 mice. R-                       VLA-1 deficiency may cause altered phenotypes of MDSCs
MDSC and A-MDSC of C57BL/6 and Itga1−/− WT mice were                     during their generation in our cultures. Therefore, we compared
labeled with CFSE, CellTrace Violet or eFluor 670 (eBiosciences)         the composition and functions of monocytic and granulocytic
following the manufacturer’s instructions. Briefly, the cells were        cells within both WT or Itga1 −/− cultures. However, no
centrifuged and resuspended with 2.5 µM CFSE or 1.75 µM                  differences were found for the cell subset frequencies (Figure
eFluor 670 in 1 ml PBS per 2 × 10⁷ cells and incubated in the dark       1D). LPS/IFN-g represents a strong inducer of MDSC activation
for 10 min at room temperature. Subsequently, the cells were             (A-MDSCs) leading to the release of NO as a major suppression
washed with 1 ml FCS and 40 ml PBS. CellTrace Violet staining            mechanism for T cells (5) and dendritic cells (9). A-MDSCs
was performed by incubating 1 × 10⁷ cells in 1 ml PBS containing         showed no difference in their VLA-1 expression as compared to
5 mM CellTrace Violet for 6 min in the dark at room temperature          R-MDSCs. CD11b+ Ly-6G- Ly6Chi cells are shown (Figure 1E),
and subsequent washing with 500 ml FCS and 5 ml RPMI for                 and only CD11b+ Ly-6G- Ly6Chi VLA-1+ monocytic cells in
5 min at 37°C. The T cells and MDSCs were injected into the              MDSC cultures are induced to express iNOS after LPS/IFN-g
lateral tail vein of C57BL/6 WT mice and the spleens were                stimulation (Figure 1F). No difference for intracellular iNOS
harvested at different time points. For FACS analysis, the spleens       induction was detectable between WT or Itga1−/− cells (Figure
were digested with 1 mg/ml Collagenase IV (Worthington),                 1G), postulating similar suppressor capacities.
20 mg/ml DNase I (Roche) an 2% FCS (Gibco) for 45 min at 37°C.               We have shown before that IFN-g produced by the T cells
                                                                         within an in vitro suppressor assay substantially contributed to
Statistics                                                               MDSC activation and suppression capacity (5). Thus, pre-
Comparisons of data were analyzed by the tests indicated in each         activated cells such as our Teff here are predicted to be more
figure legend for the various types of assays using GraphPad              sensitive for MDSC-mediated suppression. The result indicates
Prism 5.0. In some cases, the Student’s t test with EXCEL 14.5.3         that much less R-MDSCs per well are needed for suppression of
was used. Data from the experiments are presented as mean                Teff cell proliferation as compared with Tn (Figure 1H). Since
values ± SEM or SD, as indicated. Differences of p < 0.05 were           MDSC pre-activation improves their suppressor activity, we
considered significant.                                                   compared R- or A-MDSCs with or without genetic deficiency
                                                                         for VLA-1 for differences in their potential to suppress T cells. As
                                                                         expected suppression was stronger by A-MDSCs as compared
RESULTS                                                                  with R-MDSCs, but no difference could be observed between WT
                                                                         and VLA-1 deficient MDSCs in their suppressor potential
VLA-1 Expression, Adhesion Properties,                                   (Figure 1I). These data indicate that Teff can be suppressed
and Functional Role for In Vitro                                         better than Tn, A-MDSCs are better suppressors than R-MDSCs
Suppression                                                              and genetic deficiency of VLA-1 does not influence their
To investigate VLA-1 expression of CD4+ T cells, we stimulated           suppressor function in vitro.
OT-II lymph node cells for 1 week with the cognate OVA peptide
antigen to generate a Teff cell phenotype or used freshly isolated       Homing of Injected R-MDSCs and
Tn OT-II cells for surface CD49a staining. Our analyses confirm           A-MDSCs Into the Spleen
that only Teff but not Tn cells express VLA-1 on the cell surface        VLA-1 expression by MDSCs is expected to be required for their
(Figure 1A).                                                             adhesion to collagen IV and therefore for their homing into
   Monocytes have been shown to express VLA-1 as a homing                splenic red pulp after injection. To follow the general in vivo
receptor (14). Here we confirm that freshly isolated Ly-6Chi              distribution after injection, R-MDSCs we prepared them from
monocytes from BM but not Ly-6G+ granulocytes express VLA-               Luciferase-transgenic mice (32, 33) before intravenous
1 as detected by CD49a staining (Figure 1B). If we postulate that        administration into C57BL/6 albino mice. After 24 h luciferin
MDSCs have to meet VLA-1+ Teff for suppression, they should              was injected, and the bioluminescence was monitored of whole
also express the same homing receptors. While VLA-4                      mice (Figure 2A) or the excised organs (Figure 2B). The
expression has been described on the monocytic MDSCs (34),               quantification indicated that besides the liver and lung where

Frontiers in Immunology | www.frontiersin.org                        4                                 January 2021 | Volume 11 | Article 616531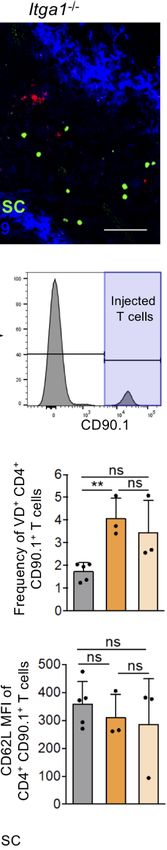
Eckert et al.                                                                                                                                     VLA-1 Controls MDSC Function

                                     A                             B

                                      C                                             D

                                                                                    E                  F                   G

                                      H                                 I

 FIGURE 1 | VLA-1 expression marks Teff, monocytic MDSCs and the splenic red pulp but does not influence suppression in vitro. (A) OT-II cells were stained
 freshly (Tn) or after 1 week of stimulation (Teff) with a1-integrin antibody to detect VLA-1 expression by FACS. Representative of n=3 experiments. (B) Fresh BM cells
 were directly analyzed or cultured for 3d with GM-CSF and stained with with a1-integrin antibody to detect VLA-1 expression on CD11b+ Ly-6G- Ly-6Chi subsets of
 monocytic or CD11b+ Ly-6G+ Ly-6Clow granulocytic MDSC subsets by FACS of WT and Itga1−/− cells. Representative of n>10 experiments. (C) WT spleen sections
 were stained for VLA-1 and CD169 to determine the red and white pulp areas. Representative of n=3 experiments. (D) BM cells of WT mice were cultured for 3d
 with GM-CSF and FACS-stained. Frequencies of CD11b+ Ly-6G+ and CD11b+ Ly-6C+ cells displayed. Mean ± sd of n=5 experiments. (E) BM cells of WT and
 Itga1−/− mice were cultured for 3d with GM-CSF and stimulated with LPS+IFN-g overnight. CD49a expression (red) on CD11b+ Ly-6G- Ly-6Chi gated cells is shown
 over unstained cells (blue). Representative of n=6 experiments. (F) BM cells of WT mice were cultured for 3d with GM-CSF and stimulated with LPS+IFN-g overnight.
 FACS analysis of the MDSC was performed for surface VLA-1 and intracellular iNOS expression. Cells gated as CD11b+ Ly6G- Ly6Chi are shown. Representative for
 n = 3 experiments. (G) Day 3 cultures of CD11b+ Ly6G- Ly6Chi MDSC of WT and Itga1−/− mice were stained for intracellular iNOS. Representative for n=3
 experiments. (H) T cell suppressor assay using syngeneic CD3/CD28-stimulated Tn or Teff with titrated numbers of WT R-MDSCs. Representative of n=3
 experiments. (I) T cell suppressor assay of bulk WT or Itga1−/− R- or A-MDSCs titrated into syngeneic CD3/CD28-stimulated Tn or Teff cell cultures (here only 2 × 10⁴ cells/well).
 After 3d FACS analysis was performed to measure T cell proliferation by their Ki-67 Expression by CD4+ cells. Pooled data of n=4 (Tn) or n=7 (Teff) independent experiments.
 Statistics by Student’s unpaired t-test, homoscedastic disturbances assumed. *p < 0.05, **p < 0.01, ***p < 0.005.

small capillaries trap larger particles or cells, the preferred                              monocytic A-MDSCs were lost more rapidly than the
lymphoid organ for their homing was the spleen but not                                       granulocytic subset (Figure 2G). Homing into the spleen of
lymph nodes (Figure 2C). Injection of CFSE-labeled R-MDSCs                                   R-MDSCs and A-MDSCs was similar (Figures 2D, F). Thus,
from WT and Itga1−/− mice indicated no difference in their                                   VLA-1 expression of monocytic A-MDSC did not influence their
homing potential to lung or spleen and confirmed a lack of                                    homing into the spleen. It remained to be determined whether
injected MDSCs in the lymph nodes and bone marrow (Figure                                    VLA-1 expression by A-MDSCs would influence their T cell
2D). Both granulocytic and monocytic cell subsets of WT and                                  suppressor potential in vivo.
Itga1−/− mice reached the spleen (Figure 2E). LPS/IFN-g
activation of MDSCs has been proven to immediately initiate                                  WT and VLA-1 Deficient A-MDSCs
their suppressor function such as NO release (5, 7). To further                              Appear in the Red Pulp to Mediate
test whether activation would change MDSC spleen homing and                                  Teff Suppression
persistence we repeated the FACS analyses after A-MDSCs                                      The spleen has been reported to represent a major organ for T
injection. After 6 h both subsets of A-MDSCs were readily                                    cell suppression by MDSCs but the anatomical sub-localization
detectable in the spleen but they declined strongly after 24 h,                              of suppression in the spleen is not known (8, 20). During steady
independent of their VLA-1 expression (Figure 2F), and                                       state monocytes form clusters in the collagen-rich subcapsular

Frontiers in Immunology | www.frontiersin.org                                            5                                          January 2021 | Volume 11 | Article 616531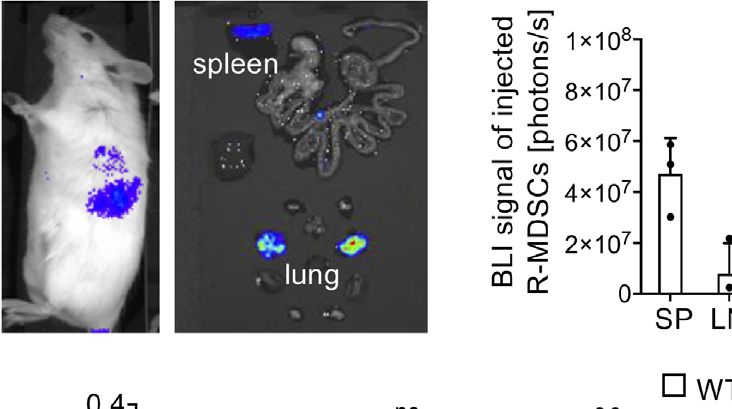
Eckert et al.                                                                                                                  VLA-1 Controls MDSC Function

                                                                                       areas of the spleen. The localization of both injected CD11b+
                                                                                       WT and Itga1-deficient R-MDSCs could be observed at 6 and
    A               B                        C
                                                                                       24 h exclusively in the red pulp areas (Figures 3A, B). Co-
                                                                                       injected A-MDSC and Teff were also detectable only in the red
                                                                                       pulp (Figure 3B), indicating that if A-MDSC interactions occur
                                                                                       with Teff, they have to occur in the red pulp area and that VLA-1
                                                                                       deficiency does not influence MDSC homing.
                                                                                           To test for T cell suppression, further FACS analyses of the
                                                                                       transferred Teff was performed. Co-injection of WT A-MDSCs
                                                                                       dramatically reduced the frequency of Teff that could be
     D                                          E
                                                                                       recovered (Figures 3C, D). The frequency of proliferating cells
                                                                                       among the remaining T cells as detected by the Ki-67 marker was
                                                                                       only moderately but significantly reduced and reversely, Annexin
                                                                                       V-detected apoptosis and cell death measured by membrane
                                                                                       permeability (‘viability dye’) were increased, indicative for
                                                                                       immediate WT A-MDSC suppressor and killing activity
                                                                                       already 6 h after injection (Figure 3D). The activation marker
                                                                                       CD69 was increased with WT A-MDSC injection but not CD25,
                                                                                       and the effector marker CD44 dropped while CD62L expression
     F                                   G                                             remained unaltered at low levels (Figure 3E).
                                                                                           Minor but significant differences between injections of WT
                                                                                       and Itga1−/− A-MDSC on T cells were found only for some of the
                                                                                       parameters tested. The Ki-67 measured proliferation rate was
                                                                                       reconstituted as compared with WT-A-MDSC injection and
                                                                                       CD69 expression was even more elevated (Figures 3D, E).
                                                                                       Together, these data indicate that 6 h after co-injection of WT
                                                                                       or Itga1−/− A-MDSCs the Teff frequency was strongly and very
                                                                                       rapidly reduced. Among the remaining Teff moderate effects on
                                                                                       proliferation and cell death could be detected, while the specific
 FIGURE 2 | MDSC migration in vivo. R-MDSCs were generated from BM of                  inhibitory measures were only partially dependent on VLA-1
 Luciferease-transgeneic mice (C57BL/6) and injected i.v. into C57BL/6 albino          expression by the A-MDSCs. However, the speed with which A-
 mice. (A) After 24 h whole mice were imaged or (B) their excised organs,              MDSCs were able to exert some significant inhibitory and even
 indicating that the spleen and the lung show a visible BLI signal. (C)
 Luciferase intensity can be visualized by spectral color display and was
                                                                                       killing effects on T cells within a time window of only 6 h after
 quantified for the indicated organs (SP, spleen; LN, lymph node; Liv, liver; Lu,       injection was highly remarkable.
 lung); n=3 mice per group. (D) R-MDSCs derived from WT and Itga1−/− mice
 were injected i.v. into C57BL/6 WT mice (n=3) and after 6h the recovered
 frequency of injected cells from the indicated organs was examined via FACS
                                                                                       A-MDSCs Deficient for VLA-1 Show a
 analysis. (E) Subset distribution of monocytic and granulocytic cells from WT         Selective Deficit for Interaction With
 (n=6) and Itga1−/− (n=6) MDSC after homing to the spleen 6h after MDSC                Teff on Collagen IV In Vitro
 injection. (F) MDSCs were generated and activated for 4h with LPS+IFN-g
                                                                                       Since the NO production and suppression capacity of WT and
 (A-MDSCs) and labeled with eFluor670. These A-MDSCs were injected i.v.
 and spleens were harvested 6 and 24 h later. Injected MDSCs were identified
                                                                                       Itga1 −/− A-MDSCs was similar on plastic an intrinsic
 by CD11b and eFluor670 fluorescence. Monocytic and granulocytic subsets                suppression defect by VLA-1 deficiency seems to be excluded.
 were further distinguished by Ly-6C and Ly-6G staining for further analyses.          Therefore, the differences observed in suppression by WT and
 The frequency of recovered WT and Itga1−/− A-MDSCs was examined via                   Itga1−/− A-MDSCs in vivo may result from the interaction of
 FACS analysis after 6 and 24 h. (G) The recovered frequencies were further
                                                                                       VLA-1 on A-MDSCs with splenic collagen IV. To address this,
 distinguished by their subset composition of monocytic and granulocytic cells.
 F+G n=2–8 mice. Statistics by unpaired Student’s t-test, homoscedastic                we tested motility and migration parameters of WT or Itga1−/−
 disturbances assumed. ns, not significant, *p < 0.05.                                  A-MDSCs on collagen IV- or fibronectin-coated glass slides in
                                                                                       the presence of Teff (Figure 4A). No changes in track speed,
                                                                                       track length or track displacement length could be detected
red pulp representing a reservoir and the major site for monocyte                      between WT or Itga1−/− A-MDSCs and all these parameters
recruitment after inflammation (35). We have shown before that                          were similar on both extracellular matrices (Figure 4B). Then we
DC killing but not T cell suppression can be induced after                             assessed the interactions of M-MDSCs with the T cells added to
infiltration of endogenous A-MDSC into the T cell areas of the                          the assay. In the same experimental settings as before, we found
white pulp (9). Whether MDSC suppression of Teff can occur in                          similar interaction times of WT or Itga1−/− A-MDSCs with Teff
the red pulp is unclear. Although our findings so far do not argue                      on fibronectin while interaction times of Itga1−/− A-MDSCs were
for VLA-1 as a spleen homing receptor, we further investigated                         significantly shorter on collagen IV than of WT A-MDSCs
R- and A-MDSC localization after injection within different                            (Figure 4C). These data suggest, that collagen IV as a known

Frontiers in Immunology | www.frontiersin.org                                      6                                January 2021 | Volume 11 | Article 616531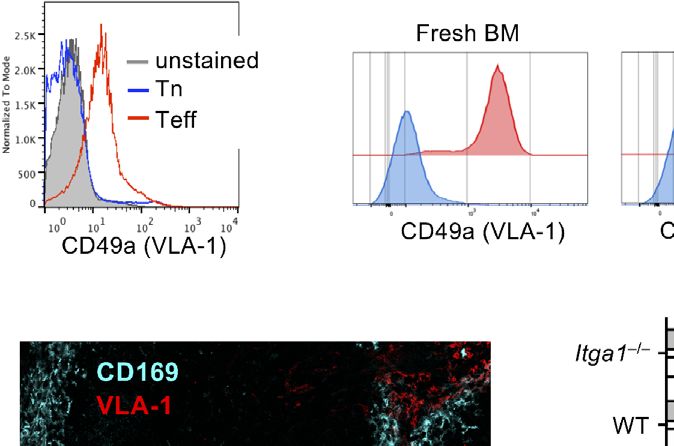
Eckert et al.                                                                                                                            VLA-1 Controls MDSC Function

                                 A                                                                    B

                                 C

                                 D

                                 E

 FIGURE 3 | A-MDSC suppression of Teff in the red pulp is dependent on VLA-1. (A) CFSE-labeled WT R-MDSCs were injected i.v. and the spleens were harvested
 after 6 h and 24 h later for confocal microscopy of cryosections. CD11b staining marks the red pulp and CD169 staining the marginal zone. The CD11b+ CFSE+
 cells, indicated by the arrows, were exclusively detected in the red pulp. Scale bar 30 µm. Representative of sections from n=3 mice. (B) A-MDSCs of Itga1−/− mice
 were labeled with the fluorescence marker CTV and were injected at a 1:1 ratio together with Teff of OT-II congenic CD90.1+ mice. Both injected cell types
 accumulated in the red pulp after 6 h. Scale bar 60 µm. Representative of sections from n=3-6 mice. (C) Experimental setup as in B, but A-MDSCs of WT or Itga1−/−
 mice were injected together with effector OT-II cells (Teff) or as a control, effector OT-II cells were injected without MDSCs. OT-II cells were analyzed by FACS for
 their frequency of recovery and to indicate the gating strategy. (D) Experimental setup and gating as in C to measure proliferation (Ki-67), or apoptosis (Annexin V or
 “Fixable Viability Dye,” VD). (E) Experimental setup as in C, but OT-II cells were analyzed for activated (CD69, CD25) or effector (CD44, CD62L) cell frequencies.
 n = 3–6 mice per group. Statistics by unpaired Student’s t-test, homoscedastic disturbances assumed. ns, not significant, ** p = 0.01, *** p = 0.005.

ligand for VLA-1 does not influence A-MDSC motility and                                 despite the high density of erythrocytes. Therefore, and for the
migration, but controls their interaction with Teff by                                 mentioned technical reasons of light absorbance by
interaction with collagen IV and thereby influence the T cell                           erythrocytes, imaging acquisition was particularly focused on
suppression observed above.                                                            the subcapsular region of the red pulp with a range of 70–90 mm
                                                                                       in the z-plane. When motility and migration parameters such as
Intravital 2-photon Microscopy Confirms                                                 track speed mean, track length, track displacement length, track
Deficits of Itga1−/− A-MDSCs in Teff                                                    area mean, speed or distance from the origin were recorded,
Interactions                                                                           again, no difference was observed between WT and Itga1−/− A-
To test whether such differences could also appear in the spleen                       MDSCs (Figure 5C). Similar to the in vitro contacts with Teff
in vivo, we followed MDSC-T cell interactions by two-photon                            cells, also here WT A-MDSCs showed prolonged interaction
microscopy in living mice. Adoptively transferred CFSE-labeled                         times with Teff as compared with Itga1−/− A-MDSCs (Figure
A-MDSCs and dsRed-expressing OT-II Teff cells were observed                            5D). These data corroborate the in vitro findings that VLA-1
to localize together in the subcapsular red pulp area of the                           expression on A-MDSC is not required for homing, motility
spleen starting at 1 h after i.v. injection (Figures 5A, B). These                     and migration but as a substrate to efficiently interact with
data also demonstrate the technical feasibility of this approach                       activated T cells.

Frontiers in Immunology | www.frontiersin.org                                      7                                        January 2021 | Volume 11 | Article 616531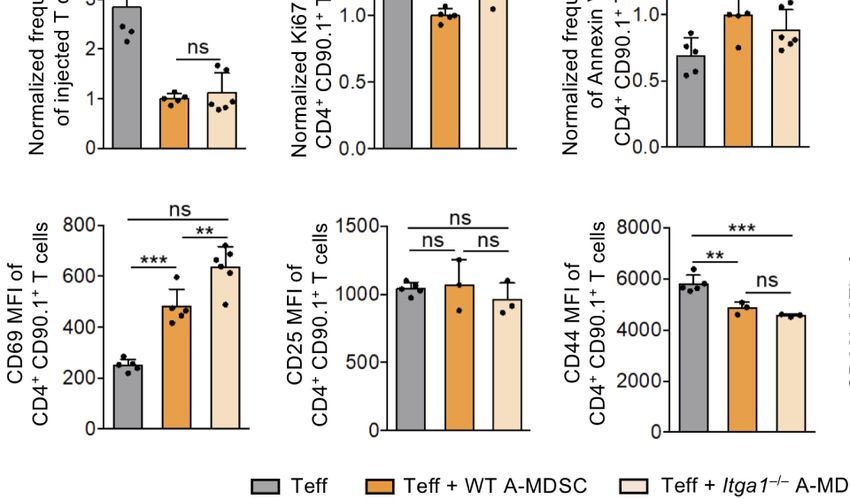
Eckert et al.                                                                                                                       VLA-1 Controls MDSC Function

                                         A

                                         B                                                        C

 FIGURE 4 | A-MDSC require VLA-1 interaction with collagen IV substrate to contact Teff but not for for motility and migration. WT or Itga1−/− A-MDSCs activated
 with LPS/IFN-g and CFSE-labeled were mixed with Teff from OT-II.dsRed mice at a ratio 1:2 (MDSC:T) and transferred into a m-slide 8 well chamber pre-coated with
 fibronectin or collagen IV. (A) Example of A-MDSC tracking. (B) Quantification of MDSC migration parameters were calculated after 60 min imaging using an inverted
 Confocal Laser Scanning Microscope and acquiring consecutive pictures in 4 different quadrants every 15 s. (C) In the same setting as in A, MDSC-T cell
 interactions were followed and quantified. Tracks of WT: n = 125; KO: n = 40. Numbers between brackets indicate MDSC:T cells interaction time in minutes.
 Statistics by unpaired Student’s t-test, homoscedastic disturbances assumed. ns, not significant, **** p = 0.001.

DISCUSSION                                                                          infiltrate tumor stroma to mediate suppressive functions on T
                                                                                    cells (36, 37). The accumulation of MDSCs in the spleen has also
VLA-1 is widely expressed on mesenchymal and immune cell                            been reported during trauma and sepsis and, remarkably, also in
types and less on epithelial cells. It is known to transmit anti-                   this report the infiltration occurred already 6 h after stress
apoptotic, proliferative and tissue retention signals to T cells but                induction (38, 39). This rapid effect is similar to our 6 h time
also to monocytes after binding to collagen (14). Here we report                    period required not only to detect A-MDSC and Teff in the
the expression of VLA-1 on M-MDSCs and addressed its                                spleen but also to show a suppressive and killing effects on T
functional role for MDSC spleen homing, motility and                                cells. However, we did not find a homing defect of R- or A-
migration and its role in the interaction with T cells to mediate                   MDSCs into the spleen in the absence of VLA-1 expression.
suppression. The results indicate that VLA-1 does not serve as a                        VLA-1 expression has been reported for monocytes before.
homing receptor into the spleen or for motility or migration                        Activation signals as the combination of LPS + IFN-g have been
within the spleen, but by binding to collagen IV controls the                       described to induce their VLA-1 expression (40). Here, we found
interaction time with VLA-1+ Teff. As a consequence, MDSC                           that GM-CSF culture increased VLA-1 expression on monocytes
deficient for VLA-1 show reduced suppression as measured for T                       but not their further activation by LPS + IFN-g. This may
cell proliferation and cell death.                                                  indicate that both treatments can up-regulate VLA-1 on
    We found by bioluminescence imaging and FACS analyses                           monocytes but in combination without an additional effect. In
that many of our injected MDSCs reach the lung of healthy mice,                     contrast, LPS + IFN-g signals of GM-CSF-treated monocytes
however the second highest accumulation occurred in the spleen,                     induced their release of NO to suppress T cell proliferation,
but hardly any cells reached the lymph nodes or BM. These data                      which was not observed without pre-treatment with GM-CSF (5,
support the idea that a primary function of MDSCs is not to                         7). We described the GM-CSF treatment of monocytes before as
prevent T cell priming but to control Teff activity during chronic                  a “licensing” process for monocytes converting them into R-
stages of diseases in the target organ and systemically when                        MDSC, a prerequisite for their further activation into A-MDSC
circulating through the splenic red pulp (20, 22). The splenic                      (7). Our data here indicate that elevated VLA-1 expression serves
subcapsular red pulp represents a reservoir for monocytes that                      as another monocyte licensing marker.
are mobilized as an emergency recruitment to inflammatory sites                          Inflammatory stimuli induced VLA-1 expression on the
(8). It has been observed that myeloid cells from the spleen can                    monocytic THP-1 cell line (41), and on activated monocytes in

Frontiers in Immunology | www.frontiersin.org                                   8                                      January 2021 | Volume 11 | Article 616531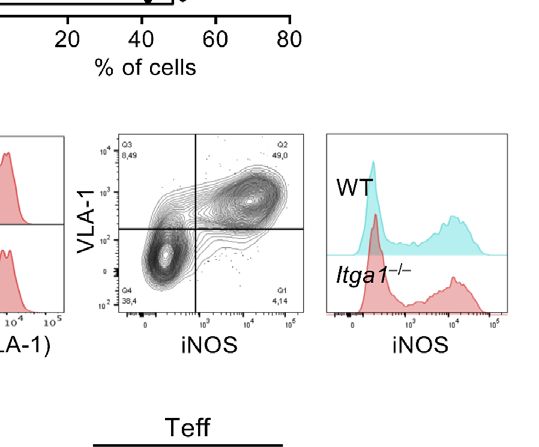
Eckert et al.                                                                                                                         VLA-1 Controls MDSC Function

                                                                                           murine TNBS- or DSS-induced colitis models (42, 43). However,
                                                                                           the inflammatory circumstances of bypass surgery in monocytes
       A
                                                                                           up-regulated only VLA-2 but not VLA-1 (44). Functionally,
                                                                                           VLA-1 may support the recruitment of monocytes to
                                                                                           inflammatory sites such as by collagen XIII into fibrotic lesions
                                                                                           (45) and after monocyte differentiation to macrophages their
                                                                                           VLA-1 expression may block their exit from inflamed tissues by
                                                                                           collagen IV signals (46). The macrophage migration on collagen
                                                                                           IV in chemotaxis assays was markedly inhibited by VLA-1-
       B
                                                                                           deficient macrophages (46), suggesting that VLA-1 may serve
                                                                                           myeloid cells as a homing receptor and coordinator of migration
                                                                                           within tissues (47). Here we show that motility and migration of
                                                                                           A-MDSCs were not impaired on the low affinity binding
                                                                                           substrate fibronectin or the high affinity binding substrate
                                                                                           collagen IV in vitro and in vivo within the splenic red pulp, an
                                                                                           area known to expose collagen IV (15, 16). In contrast, our data
           C
                                                                                           indicate that A-MDSCs require VLA-1 interference with
                                                                                           collagen IV to prolong the interaction times with VLA-1+ Teff
                                                                                           contributing to optimal T cell suppression.
                                                                                               VLA-1 expression on T cells has been described mainly for
                                                                                           pathological situations such as the murine lung where it was
                                                                                           increased after viral infection (21, 48) or on Teff in the psoriatic
                                                                                           epidermis of mice (49), murine colitis (42) or human
                                                                                           atherosclerotic plaques (50). Among T cells, IFN-g producing
                                                                                           CD4+ Th1 cells appear to express the highest levels of VLA-1 in
                                                                                           mice and humans (29, 48). Thus, VLA-1 marks Th1 cells homing
                                                                                           to inflamed or infected peripheral tissues. Despite this peripheral
                                                                                           organ-specific homing under inflammatory conditions, VLA-1+
                                                                                           CD4+ Teff are also detectable in the spleen (51). Our data concur
           D
                                                                                           with this observation since our intravenously injected Teff stay at
                                                                                           least for 6 to 24 h in the splenic red pulp and can be targets of
                                                                                           suppression when encountering A-MDSCs.
                                                                                               Inhibition of T cell proliferation and induction of cell death are
                                                                                           hallmarks of MDSC suppression (52). Here, we generated Teff by
                                                                                           antigenic stimulation of OT-II cells for at least 6 days in vitro. After
                                                                                           adoptive transfer they continue to express Ki-67, as an indicator of
                                                                                           ongoing proliferation. Since no further antigen was provided to the
                                                                                           OT-II cells after injection in vivo, proliferation was only transient.
                                                                                           Teff suppression of proliferation and induction of apoptosis was
 FIGURE 5 | Activated MDSC interaction with Teff in the red pulp requires                  detected 6 h after injection of WT A-MDSCs. This immediate
 VLA-1 expression, but is not needed for migration. (A) Teff co-localize with A-           suppressive effect and a trend for apoptosis was partially dependent
 MDSC in the subcapsular area represented by a thick layer of collagen (blue;              on the VLA-1 expression by the A-MDSCs, which correlated with
 SHG, second harmonic generation). CD4+ OT-II dsRed Teff were and injected
 intravenously together with CFSE-labeled A-MDSCs at a 1:1 ratio (7 × 10⁶
                                                                                           the observed general loss of T cells in the spleen. Also, the effector
 cells of each). After 1 h mice were subjected to live two-photon microscopy               markers CD44 and as a trend CD62L were reduced, potentially also
 of the spleen. Representative of n=2 experiments. (B) Experimental setup as               as indicators of cell death. Surprisingly, the expression of the
 for (A) Representative example of Teff:A-MDSC interaction in vivo overtime. A             activation marker CD69 was generally higher with A-MDSC co-
 contact zone (white) was created as a surface to highlight the interacting area
                                                                                           injection, while CD25 remained unaffected. This may indicate that
 between the two cell types. The complete sequence of consecutive time
 points is shown to visualize the duration of the interaction, from its origin until
                                                                                           CD69 expressing T cells are protected from A-MDSC killing to
 its termination. (C) CD4+ OT-II dsRed Teff and CFSE-labeled LPS/IFN-g                     some extent. Injection of Itga1−/− A-MDSCs restored Teff
 treated A-MDSCs were injected intravenously into C57Bl/6 mice at a 1:1                    proliferation but did not significantly revert their apoptosis or
 ratio. After 1 h mice were subjected to live two-photon microscopy of the                 cell recovery, as compared to WT A-MDSC injection. Notably,
 spleen. The indicated parameters for cell motility and migration were analyzed
                                                                                           CD69 is also considered as a marker of resting tissue-resident
 by Imaris software. A total of 749 tracks were detected for WT MDSCs and
 489 tracks for Itga1−/− MDSCs. (D) Experimental set-up as in (A) Interactions             T cells (53), it is tempting to speculate if some of our in vitro
 of WT and Itga1−/− MDSCs were quantified. From the total amount of tracks,                 activated and transferred OT-II Teff may have acquired a tissue-
 91 (12.14%) resulted in WT MDSC-T cells interacting tracks with an                        resident phenotype in the spleen and are then partially protected
 interaction mean value of 5.76 min and 27 (5.52%) interactions of Itga1−/−                from apoptosis induction. Since we found differences in the
 MDSC-T cells with a mean value of 3.2 min.
                                                                                           susceptibility of T cell suppression in vitro also here, it will be

Frontiers in Immunology | www.frontiersin.org                                          9                                   January 2021 | Volume 11 | Article 616531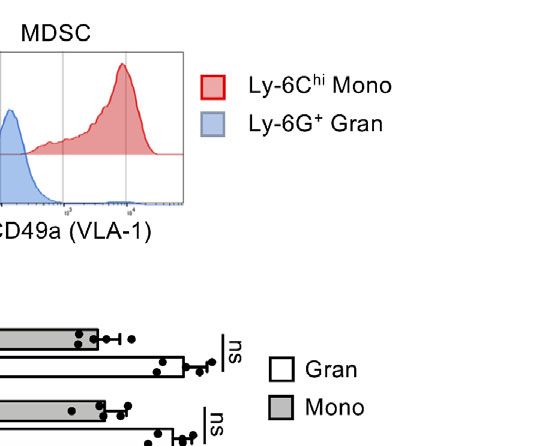
Eckert et al.                                                                                                                                   VLA-1 Controls MDSC Function

interesting for future work to investigate the susceptibility of                              found that the expression of VLA-1 on M-MDSCs was not
MDSC suppression of different T cell subsets and effector stages                              required to mediate their motility or migration on fibronectin or
in more detail in vivo.                                                                       collagen IV in vitro or their homing into the spleen. Instead, our
    MDSCs use multiple mechanisms for suppression, many of                                    data indicate that VLA-1-mediated contact of A-MDSC to
them identified from tumor-induced MDSCs (2). Prominent                                        collagen IV is required to prolong the interaction time period
mechanisms include Agr-1- and IDO-mediated metabolic                                          with Teff needed to optimize the suppressive effect. Together, we
starvation of T cells by preventing their arginine and tryptophan                             introduce VLA-1 as a novel marker for M-MDSCs with
consumption, respectively (54). LPS/IFN-g stimulation of the                                  functional relevance for their T cell suppressor function in
granulocytic MDSC subset in our cultures, did not activate their                              the spleen.
suppressor function. These cells require other stimuli such as
zymosan to up-regulate Arg-1 expression (unpublished results).
Previously, we found that up-regulation of IDO for tryptophan
degradation was induced after LPS/IFN-g treatment in human                                    DATA AVAILABILITY STATEMENT
CD14+ HLA-DRlow monocytic MDSCs, whereas the same stimuli
and signaling pathways induced iNOS and NO release in their                                   The raw data supporting the conclusions of this article will be
murine Ly-6Chigh monocytic MDSC counterparts (7). In this                                     made available by the authors, without undue reservation.
study, we did not separately asses the in vivo mechanism of
suppression employed by the in vitro generated and injected
MDSCs. However, our previous work and data presented here                                     ETHICS STATEMENT
showed that LPS plus IFN-g stimulation of monocytic cells in our
day 3 GM-CSF cultures (monocytic R-MDSC) led to iNOS                                          The animal study was reviewed and approved by Regierung von
induction and NO release to suppress proliferation of T cells or                              Unterfranken, AZ 55.2-2532-2-200.
induce T cell and/or DC killing in vitro and in vivo. Blocking iNOS
pharmacologically or using MDSC generated from NOS2−/− mice
strongly inhibited suppression, indicating that this is their major
                                                                                              AUTHOR CONTRIBUTIONS
suppression mechanism (5, 6, 9). Thus, the mechanism of Teff
suppression by LPS/IFN-g treated M-MDSCs in the splenic red                                   IE, ER, SS, SP, and KJ performed the experiments and analyzed
pulp, detected in this study, is strongly suggested to follow the                             the data. IE, ER AB, and ML analyzed and evaluated the data. IE,
same signaling pathway and mechanism.                                                         ER, and ML wrote the paper and prepared the figures. All authors
    The experiments performed with two-photon microscopy                                      contributed to the article and approved the submitted version.
allowed the observation of MDSC migration and interaction
with T cells only 60–90 µm deep below the spleen capsule due to
the high density of erythrocytes that were absorbing light. Thus,
the data acquired represent mostly subcapsular red pulp areas.                                FUNDING
Therefore, our data may not allow extrapolation of our conclusions                            This project was supported by the DFG (LU851/6-2) and the
on deeper red pulp areas. However, the subcapsular areas are                                  University of Würzburg in the funding programme Open
known reservoirs of monocytes (8). Our data suggest that the red                              Access Publishing.
pulp may also represent a major site of T cell suppression by
MDSCs due to specific accumulation of injected A-MDSCs in
the subcapsular areas.
    In conclusion, we found that high VLA-1 expression is a                                   ACKNOWLEDGMENTS
major characteristic of GM-CSF-licensed monocytes, which
represent resting M-MDSCs that can be activated to exert                                      We thank Humphrey Gardner and Jyrki Heino for providing the
suppressor function on T cells. Teff are more susceptible to                                  Itga1−/− mice and Katherina Hemmen for help with the Imaris
MDSC suppression in vitro and are specifically and very rapidly                                software analyses. We also thank Marion Heuer for expert
targeted by adoptively transferred A-MDSCs in the splenic                                     technical assistance, Nora Müller for her help with the
subcapsular red pulp. Although VLA-1 was mainly reported to                                   confocal microscopy, and the support of Christian Linden as
serve as a homing receptor for T cells and monocytic cells, we                                part of the IZKF Cell Sorting Core Facility.

REFERENCES                                                                                     3. Movahedi K, Guilliams M, Van den Bossche J, Van den Bergh R, Gysemans C,
                                                                                                  Beschin A, et al. Identification of discrete tumor-induced myeloid-derived
 1. Gabrilovich D II, Nagaraj S. Myeloid-derived suppressor cells as regulators of the            suppressor cell subpopulations with distinct T cell-suppressive activity. Blood
    immune system. Nat Rev Immunol (2009) 9(3):162–74. doi: 10.1038/nri2506                       (2008) 111(8):4233–44. doi: 10.1182/blood-2007-07-099226
 2. Gabrilovich DII, Ostrand-Rosenberg S, Bronte V. Coordinated regulation of                  4. Youn J-I, Nagaraj S, Collazo M, Gabrilovich D II. Subsets of myeloid-derived
    myeloid cells by tumours. Nat Rev Immunol (2012) 12(4):253–68. doi:                           suppressor cells in tumor-bearing mice. J Immunol (2008) 181(8):5791–802.
    10.1038/nri3175                                                                               doi: 10.4049/jimmunol.181.8.5791

Frontiers in Immunology | www.frontiersin.org                                            10                                        January 2021 | Volume 11 | Article 616531
Eckert et al. VLA-1 Controls MDSC Function
5. Greifenberg V, Ribechini E, Rossner S, Lutz MB. Myeloid-derived suppressor 25. Geissmann F, Jung S, Littman DR. Blood monocytes consist of two principal
cell activation by combined LPS and IFN-gamma treatment impairs DC subsets with distinct migratory properties. Immunity (2003) 19(1):71–82. doi:
development. Eur J Immunol (2009) 39(10):2865–76. doi: 10.1002/ 10.1016/S1074-7613(03)00174-2
eji.200939486 26. Lesokhin AM, Hohl TM, Kitano S, Cortez C, Hirschhorn-Cymerman D,
6. Rossner S, Voigtlander C, Wiethe C, Hanig J, Seifarth C, Lutz MB. Myeloid Avogadri F, et al. Monocytic CCR2(+) myeloid-derived suppressor cells
dendritic cell precursors generated from bone marrow suppress T cell promote immune escape by limiting activated CD8 T-cell infiltration into
responses via cell contact and nitric oxide production in vitro. Eur J the tumor microenvironment. Cancer Res (2012) 72(4):876–86. doi: 10.1158/
Immunol (2005) 35(12):3533–44. doi: 10.1002/eji.200526172 0008-5472.CAN-11-1792
7. Ribechini E, Hutchinson J, Walter S, Schleicher U, Jordá n Garrote A-L, Potter 27. Gardner H, Kreidberg J, Koteliansky V, Jaenisch R. Deletion of integrin alpha
SJ, et al. Novel GM-CSF signals via IFN-gR/IRF-1 and AKT/mTOR license 1 by homologous recombination permits normal murine development but
monocytes for suppressor function. Blood Adv (2017) 1(14):947–60. doi: gives rise to a specific deficit in cell adhesion. Dev Biol (1996) 175(2):301–13.
10.1182/bloodadvances.2017006858 doi: 10.1006/dbio.1996.0116
8. Bronte V, Pittet MJ. The spleen in local and systemic regulation of immunity. 28. Zal T, Volkmann A, Stockinger B. Mechanisms of tolerance induction in
Immunity (2013) 39(5):806–18. doi: 10.1016/j.immuni.2013.10.010 major histocompatibility complex class II-restricted T cells specific for a
9. Ribechini E, Eckert I, Beilhack A, Du Plessis N, Walzl G, Schleicher U, et al. blood-borne self-antigen. J Exp Med (1994) 180(6):2089–99. doi: 10.1084/
Heat-killed Mycobacterium tuberculosis prime-boost vaccination induces jem.180.6.2089
myeloid-derived suppressor cells with spleen dendritic cell-killing 29. Goldstein I, Ben-Horin S, Li J, Bank I, Jiang H, Chess L. Expression of the
capability. JCI Insight (2019) 5(pii):128664. doi: 10.1172/jci.insight.128664 alpha1beta1 integrin, VLA-1, marks a distinct subset of human CD4+
10. Hynes RO. Integrins: bidirectional, allosteric signaling machines. Cell (2002) memory T cells. J Clin Invest (2003) 112(9):1444–54. doi: 10.1172/JCI19607
110(6):673–87. doi: 10.1016/s0092-8674(02)00971-6 30. Hutchinson JA, Riquelme P, Geissler EK, Fandrich F. Human regulatory
11. Hemler ME, Jacobson JG, Brenner MB, Mann D, Strominger JL. VLA-1: a T macrophages. Methods Mol Biol (2011) 677:181–92. doi: 10.1007/978-1-
cell surface antigen which defines a novel late stage of human T cell activation. 60761-869-0_13
Eur J Immunol (1985) 15(5):502–8. doi: 10.1002/eji.1830150515 31. Endl E, Hollmann C, Gerdes J. Antibodies against the Ki-67 protein:
12. Elices MJ, Hemler ME. The human integrin VLA-2 is a collagen receptor on assessment of the growth fraction and tools for cell cycle analysis. Methods
some cells and a collagen/laminin receptor on others. Proc Natl Acad Sci USA Cell Biol (2001) 63:399–418. doi: 10.1016/s0091-679x(01)63022-x
(1989) 86(24):9906–10. doi: 10.1073/pnas.86.24.9906 32. Beilhack A, Schulz S, Baker J, Beilhack GF, Wieland CB, Herman E II, et al. In
13. Ben-Horin S, Bank I. The role of very late antigen-1 in immune-mediated vivo analyses of early events in acute graft-versus-host disease reveal
inflammation. Clin Immunol (2004) 113(2):119–29. doi: 10.1016/ sequential infiltration of T-cell subsets. Blood (2005) 106(3):1113–22.
j.clim.2004.06.007 doi: 10.1182/blood-2005-02-0509
14. Gardner H. Integrin alpha1beta1. Adv Exp Med Biol (2014) 819:21–39. 33. Chopra M, Riedel SS, Biehl M, Krieger S, von Krosigk V, Bauerlein CA, et al.
doi: 10.1007/978-94-017-9153-3_2 Tumor necrosis factor receptor 2-dependent homeostasis of regulatory T cells
15. Lokmic Z, Lammermann T, Sixt M, Cardell S, Hallmann R, Sorokin L. The as a player in TNF-induced experimental metastasis. Carcinogenesis (2013) 34
extracellular matrix of the spleen as a potential organizer of immune cell (6):1296–303. doi: 10.1093/carcin/bgt038
compartments. Semin Immunol (2008) 20(1):4–13. doi: 10.1016/ 34. Haile LA, Gamrekelashvili J, Manns MP, Korangy F, Greten TF. CD49d is a
j.smim.2007.12.009 new marker for distinct myeloid-derived suppressor cell subpopulations in
16. Liakka A, Karjalainen H, Virtanen I, Autio-Harmainen H. Immuno-electron- mice. J Immunol (2010) 185(1):203–10. doi: 10.4049/jimmunol.0903573
microscopic localization of types III pN-collagen and IV collagen, laminin and 35. Swirski FK, Nahrendorf M, Etzrodt M, Wildgruber M, Cortez-Retamozo V,
tenascin in developing and adult human spleen. Cell Tissue Res (1995) 282 Panizzi P, et al. Identification of splenic reservoir monocytes and their
(1):117–27. doi: 10.1007/BF00319138 deployment to inflammatory sites. Science (2009) 325(5940):612–6.
17. Bajé noff M, Narni-Mancinelli E, Brau F, Lauvau G. Visualizing Early doi: 10.1126/science.1175202
Splenic Memory CD8+ T Cells Reactivation against Intracellular Bacteria in 36. Cortez-Retamozo V, Etzrodt M, Newton A, Rauch PJ, Chudnovskiy A, Berger
the Mouse. PloS One (2010) 5(7):e11524. doi: 10.1371/journal.pone. C, et al. Origins of tumor-associated macrophages and neutrophils. Proc Natl
0011524.g011 Acad Sci USA (2012) 109(7):2491–6. doi: 10.1073/pnas.1113744109
18. Unsoeld H, Voehringer D, Krautwald S, Pircher H. Constitutive expression of 37. Cortez-Retamozo V, Etzrodt M, Newton A, Ryan R, Pucci F, Sio SW, et al.
CCR7 directs effector CD8 T cells into the splenic white pulp and impairs Angiotensin II drives the production of tumor-promoting macrophages.
functional activity. J Immunol (2004) 173(5):3013–9. doi: 10.4049/ Immunity (2013) 38(2):296–308. doi: 10.1016/j.immuni.2012.10.015
jimmunol.173.5.3013 38. Makarenkova VP, Bansal V, Matta BM, Perez LA, Ochoa JB. CD11b+/Gr-1+
19. Jung YW, Rutishauser RL, Joshi NS, Haberman AM, Kaech SM. Differential myeloid suppressor cells cause T cell dysfunction after traumatic stress.
localization of effector and memory CD8 T cell subsets in lymphoid organs J Immunol (2006) 176(4):2085–94. doi: 10.4049/jimmunol.176.4.2085
during acute viral infection. J Immunol (2010) 185(9):5315–25. doi: 10.4049/ 39. Delano M, Scumpia P, Weinstein J, Coco D, Nagaraj S, Kelly-Scumpia K, et al.
jimmunol.1001948 MyD88-dependent expansion of an immature GR-1+CD11b+ population
20. Ugel S, Peranzoni E, Desantis G, Chioda M, Walter S, Weinschenk T, et al. induces T cell suppression and Th2 polarization in sepsis. J Exp Med (2007)
Immune tolerance to tumor antigens occurs in a specialized environment of 204:1463–74. doi: 10.1084/jem.20062602
the spleen. Cell Rep (2012) 2(3):628–39. doi: 10.1016/j.celrep.2012.08.006 40. Rubio MA, Sotillos M, Jochems G, Alvarez V, Corbi AL. Monocyte activation:
21. Ray SJ, Franki SN, Pierce RH, Dimitrova S, Koteliansky V, Sprague AG, et al. rapid induction of alpha 1/beta 1 (VLA-1) integrin expression by
The collagen binding alpha1beta1 integrin VLA-1 regulates CD8 T cell- lipopolysaccharide and interferon-gamma. Eur J Immunol (1995) 25
mediated immune protection against heterologous influenza infection. (9):2701–5. doi: 10.1002/eji.1830250945
Immunity (2004) 20(2):167–79. doi: 10.1016/S1074-7613(04)00021-4 41. Pirila L, Heino J. Altered integrin expression in rheumatoid synovial lining
22. Dorhoi A, Du N. Plessis: Monocytic Myeloid-Derived Suppressor Cells in type B cells: in vitro cytokine regulation of alpha 1 beta 1, alpha 6 beta 1, and
Chronic Infections. Front Immunol (2017) 8:1895. doi: 10.3389/fimmu. alpha v beta 5 integrins. J Rheumatol (1996) 23(10):1691–8.
2017.01895 42. Fiorucci S, Mencarelli A, Palazzetti B, Sprague AG, Distrutti E, Morelli A, et al.
23. Sevko A, Kremer V, Falk C, Umansky L, Shurin MR, Shurin GV, et al. Importance of innate immunity and collagen binding integrin alpha1beta1 in
Application of paclitaxel in low non-cytotoxic doses supports vaccination with TNBS-induced colitis. Immunity (2002) 17(6):769–80. doi: 10.1016/S1074-
melanoma antigens in normal mice. J Immunotoxicol (2012) 9(3):275–81. 7613(02)00476-4
doi: 10.3109/1547691X.2012.655343 43. Krieglstein CF, Cerwinka WH, Sprague AG, Laroux FS, Grisham MB,
24. Suk Lee Y, Davila E, Zhang T, Milmoe HP, Vogel SN, Bromberg JS, et al. Koteliansky VE, et al. Collagen-binding integrin alpha1beta1 regulates
Myeloid-derived suppressor cells are bound and inhibited by anti-thymocyte intestinal inflammation in experimental colitis. J Clin Invest (2002) 110
globulin. Innate Immun (2019) 25(1):46–59. doi: 10.1177/1753425918820427 (12):1773–82. doi: 10.1172/JCI15256
Frontiers in Immunology | www.frontiersin.org 11 January 2021 | Volume 11 | Article 616531You can also read