Systemic T Cell Exhaustion Dynamics Is Linked to Early High Mobility Group Box Protein 1 (HMGB1) Driven Hyper-Inflammation in a Polytrauma Rat Model
←
→
Page content transcription
If your browser does not render page correctly, please read the page content below
cells
Article
Systemic T Cell Exhaustion Dynamics Is Linked to Early High
Mobility Group Box Protein 1 (HMGB1) Driven
Hyper-Inflammation in a Polytrauma Rat Model
Preeti J. Muire 1, *, Martin G. Schwacha 2 and Joseph C. Wenke 1

                                          1   Combat Wound Care, US Army Institute of Surgical Research, JBSA Ft Sam Houston,
                                              San Antonio, TX 78234, USA; joseph.c.wenke.civ@mail.mil
                                          2   Division of Trauma and Emergency Surgery, Department of Surgery, University of Texas Health Science
                                              Center at San Antonio, San Antonio, TX 78229, USA; martin.schwacha@gmail.com
                                          *   Correspondence: preetimuire@gmail.com

                                          Abstract: We previously reported an early surge in high mobility group box protein 1 (HMGB1)
                                          levels in a polytrauma (PT) rat model. This study investigates the association of HMGB1 levels in
                                          mediating PT associated dysregulated immune responses and its influence on the cellular levels of
                                          receptor for advanced glycation end products (RAGE) and toll-like receptor 4 (TLR4). Using the same
                                          PT rat model treated with anti-HMGB1 polyclonal antibody, we evaluated changes in circulating
                                          inflammatory cytokines, monocytes/macrophages and T cells dynamics and cell surface expression
                                          of RAGE and TLR4 at 1, 3, and 7 days post-trauma (dpt) in blood and spleen. Notably, PT rats
                                          demonstrating T helper (Th)1 and Th2 cells type early hyper-inflammatory responses also exhibited
                                increased monocyte/macrophage counts and diminished T cell counts in blood and spleen. In

                                          blood, expression of RAGE and TLR4 receptors was elevated on CD68+ monocyte/macrophages and
Citation: Muire, P.J.; Schwacha,
                                          severely diminished on CD4+ and CD8+ T cells. Neutralization of HMGB1 significantly decreased
M.G.; Wenke, J.C. Systemic T Cell
                                          CD68+ monocyte/macrophage counts and increased CD4+ and CD8+ T cells, but not γδ+ TCR T
Exhaustion Dynamics Is Linked to
                                          cells in circulation. Most importantly, RAGE and TLR4 expressions were restored on CD4+ and
Early High Mobility Group Box
                                          CD8+ T cells in treated PT rats. Overall, findings suggest that in PT, the HMGB1 surge is responsible
Protein 1 (HMGB1) Driven
Hyper-Inflammation in a Polytrauma
                                          for the onset of T cell exhaustion and dysfunction, leading to diminished RAGE and TLR4 surface
Rat Model. Cells 2021, 10, 1646.          expression, thereby possibly hindering the proper functioning of T cells.
https://doi.org/10.3390/cells10071646
                                          Keywords: DAMPs; hyper-inflammation; extremity trauma; lymphopenia; RAGE; TLR4
Academic Editor: Alessandro Poggi

Received: 1 June 2021
Accepted: 25 June 2021                    1. Introduction
Published: 30 June 2021
                                               Polytrauma (PT) patients develop hyper-acute inflammatory responses involving
                                          cell death, the release of damage-associated molecular patterns (DAMPs) and immune
Publisher’s Note: MDPI stays neutral
                                          dysregulation [1–5]. This response impacts patients, especially those with multiple injuries,
with regard to jurisdictional claims in
                                          including fractures, to have adverse clinical outcomes such as altered leukocyte kinetics
published maps and institutional affil-
                                          and impaired fracture repair, in contrast to normal fracture healers [6,7]. Other well-
iations.
                                          documented clinical consequences of hyper-acute inflammatory responses are systemic in-
                                          flammatory response syndrome (SIRS) and paralleled by compensatory anti-inflammatory
                                          response syndrome (CARS) [8]. PT patients who survive the SIRS-CARS phenomena will
                                          experience persistent inflammation, immunosuppression and catabolism syndrome (PICS),
Copyright: © 2021 by the authors.
                                          rendering them susceptible to opportunistic infections and delayed wound healing [9].
Licensee MDPI, Basel, Switzerland.
                                          However, the underlying immunological events associated with hyper-inflammation re-
This article is an open access article
                                          main elusive. Current evidence suggests that persistent lymphopenia in severe trauma
distributed under the terms and
                                          is associated with the development of multiple organ dysfunction syndrome (MODS),
conditions of the Creative Commons
                                          impaired fracture healing and increased mortality [5,10]. Thus, this evidence warrants of
Attribution (CC BY) license (https://
                                          development of targeted approaches to restore a balanced immune response in PT patients
creativecommons.org/licenses/by/
4.0/).
                                          to overcome the burden of deleterious outcomes.

Cells 2021, 10, 1646. https://doi.org/10.3390/cells10071646                                                    https://www.mdpi.com/journal/cells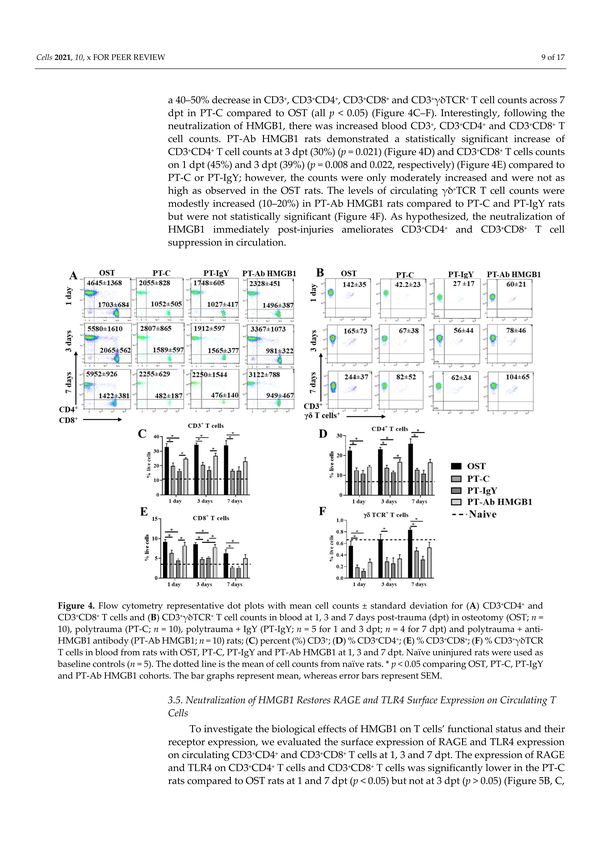
Cells 2021, 10, 1646                                                                                           2 of 17

                             A potential link between sterile trauma-induced immune dysregulation and delayed
                       wound healing are certain pattern recognition receptors that recognize DAMPs such
                       as high mobility group box protein 1 (HMGB1), mitochondrial DNA (mtDNA), S100
                       and other similar molecules released by dying cells following injury and cell membrane
                       damage [11–13]. Despite the importance of all DAMPs in mounting inflammation, here we
                       shed light on the role of HMGB1 in PT due to its prominence as an early post-traumatic
                       predictor marker [14,15]. HMGB1 alerts the immune system and activates inflammatory
                       cascades and cellular chemotaxis [11]. While the onset of inflammation is vital for regulating
                       recovery from trauma and wound healing, if the response is overzealous due to the early
                       burst of HMGB1, the immune cells alter their phenotypes and deprive the wound site of
                       beneficial signals for repair [6,16]. Others and our group have previously reported elevated
                       levels of systemic HMGB1 and altered leukocyte kinetics in PT animal models displaying a
                       delayed fracture healing phenotype [16,17]. Extracellular HMGB1 binds to the receptor for
                       advanced glycation end products (RAGE) and toll-like receptor 4 (TLR4) on immune cells
                       and initiates pro-inflammatory cascades that the host must compensate for to maintain
                       homeostasis [4,18]. Interestingly, the host is equipped with specific innate mechanisms
                       to counter the effect of hyper-immune insults following trauma, which remains unclear
                       and is of interest to our group. However, in extremity trauma, such undertakings by
                       the host’s immune system fail to support adaptive immunological and physiological
                       conditions, leading to deleterious outcomes, thereby requiring therapeutic interventions
                       to modulate mediators to maintain proper functioning. An in vitro study using aortic
                       endothelial cells demonstrated that saturated levels of extracellular HMGB1 lead to cellular
                       exhaustion, causing a negative feedback regulation and ectodomain shedding of RAGE
                       and TLR4 receptors while rendering cells unresponsive to further stimuli [19]. However,
                       these findings lack in vivo validation in a dysregulated inflammatory state. We believe
                       that cellular exhaustion-driven receptor shedding could offer a possible explanation for T
                       cell lymphopenia and dysfunction in PT.
                             Although the relationship between HMGB1 and immunosuppression has been pre-
                       viously established in single thermal injury models [20,21], whether the early surge in
                       HMGB1 in extremity trauma is implicated as a driving force of hyper-acute inflammation
                       and T cell lymphopenia and dysfunction compared to a single fracture model has not
                       been shown before. Current evidence suggests that peripheral lymphocytes, including
                       certain helper T cell (Th) subtypes, have a role in early immunological responses to ther-
                       mal injury [22]; however, their responses in the context of PT with burn, blunt trauma
                       and fracture have not been well characterized during the early phase post injuries. We
                       hypothesized that the surge in HMGB1 levels associated with PT dictates the onset of
                       mixed inflammatory responses by altering cellular dynamics and cell surface expression of
                       HMGB1 receptors, RAGE and TLR4, and the early neutralization of HMGB1 will ameliorate
                       such dysregulated immune responses. A previously established PT rat model with a femur
                       osteotomy, blunt chest contusion and scald burn was employed to test this hypothesis [16].
                       This study’s objective was to shed light on the changes in systemic immune cellular re-
                       sponses, cellular exhaustion/anergy and lymphopenia in PT rats by neutralizing the early
                       systemic HMGB1 levels.

                       2. Materials and Methods
                       2.1. Animals and Surgical Care
                            All animals were individually housed in ventilated cages and provided unlimited
                       access to food and water and unrestricted activity. Animal procedures were conducted in
                       compliance with the Animal Welfare Act, the implementing Animal Welfare Regulations
                       and the principles of the Guide for the Care and Use of Laboratory Animals, National
                       Research Council. An animal protocol was prepared prior to the study, and the Institutional
                       Animal Care and Use Committee (IACUC) at the United States Army Institute of Surgical
                       Research (USAISR) approved all research conducted in this study. The facility where this
                       research was conducted is fully accredited by the American Association for Accreditation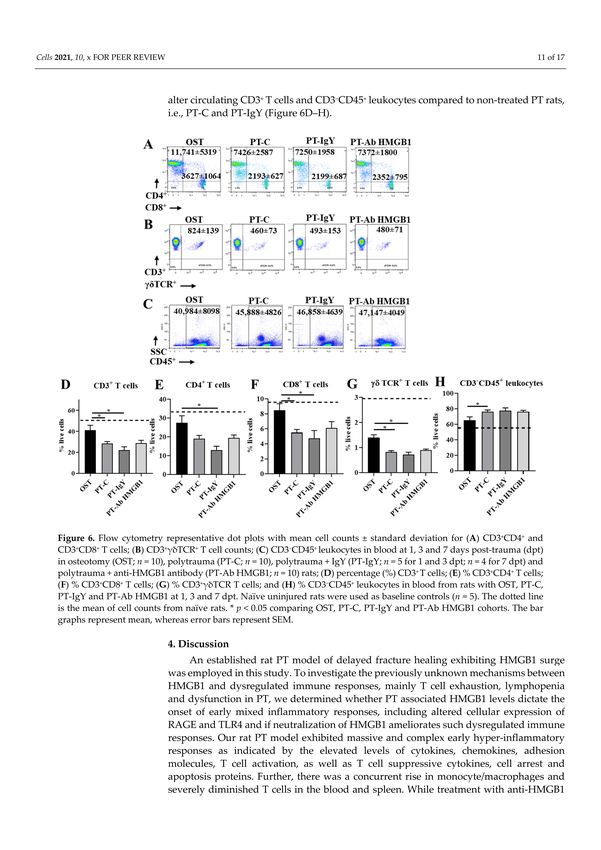
Cells 2021, 10, 1646                                                                                          3 of 17

                       of Laboratory Animal Care (AAALAC). Male Sprague-Dawley rats aged between 10 and
                       14 weeks and weighing 348–425 g were used in this study. All animals received a pre-
                       surgical dose of buprenorphine-HCL SR (1.2 mg/kg, subcutaneously) at least 15 min before
                       surgery. At surgery, during blood draws and prior to euthanasia, all rats were anesthetized
                       and maintained with 1–3% isoflurane and oxygen delivered via a nose cone on a Bain circuit
                       connected to the rodent gas anesthesia machine (VetEquip Inc., Pleasanton, CA, USA).
                       Naïve rats were not surgically manipulated and served as baseline controls. Post-surgery,
                       rats did not receive any prophylactic antibiotics but were assessed closely for signs of
                       distress and body weight. Rats with ≥10% of body weight loss relative to pre-surgery
                       weight received 3 mL sterile surgical saline subcutaneously. At 1, 3 and 7 days post-trauma
                       (dpt), a volume of ~500 µL of venous blood was collected via a catheter from the tail vein
                       from anesthetized rats. At 7 dpt and immediately after blood collection, the anesthetized
                       rats were humanely euthanized by cardiac exsanguination, and spleens were harvested.
                       Naïve rats were anesthetized and euthanized by cardiac exsanguination, similar to the
                       other rats in this study prior to tissue collection. This study was carried out in compliance
                       with the ARRIVE guidelines [23].

                       2.2. Surgery
                             Animals were used for the study in two blocks with 5 rats/block. Data from the first
                       block was used to calculate the sample size for the remaining study assuming a power
                       of 80% and an alpha = 0.05, to achieve statistical significance. Rats were divided into
                       two cohorts of trauma representing a single 3 mm femoral osteotomy (OST), i.e., normal
                       fracture repair model and PT, i.e., delayed fracture repair model. The PT rats underwent
                       three traumas, i.e., a 3 mm femoral osteotomy, a blunt chest contusion with a 0.3 kg weight
                       dropped from a height of 68 cm to exert ~2 J of energy on the rat’s chest and a 100 ◦ C
                       water scald burn for 10 s of approximately 20% of the total body surface area. All trauma
                       and surgical procedures were previously described in detail elsewhere [16]. Immediately
                       after post-trauma operations, the OST rats (n = 10) and sub-cohorts of PT rats were either
                       left untreated (PT-C; n = 10), received a single dose of chicken anti-HMGB1 neutralizing
                       polyclonal antibody (PT-Ab HMGB1; n = 10) (Shino-test, Tokyo, Japan; 2 mg/kg, IP) or
                       received single dose of isotype control chicken IgY antibody (PT-IgY; n = 5 for 1 and 3 dpt;
                       n = 4 for 7 dpt) (Shino-test, Tokyo, Japan; 2 mg/kg, IP). The rats were allowed to recover in
                       clean cages with continued monitoring.

                       2.3. Flow Cytometry
                             Harvested spleens were weighed, chopped into pieces and gently passed through
                       70 µm and 40 µm nylon filters with a syringe plunger to prepare single-cell suspensions.
                       Splenocytes from 7 dpt and whole blood from 1, 3 and 7 dpt were subjected to RBC lysis
                       (BioLegend; 1X RBC lysis buffer) and washed with phosphate-buffered saline. Cells were
                       resuspended in FACS buffer (autoMACS rinsing buffer (Miltenyi Biotech) with 2% BSA)
                       and counted by trypan blue exclusion method using the automated cell counter (Countess,
                       Invitrogen). One million cells/sample were stained with a live/dead stain, i.e., zombie
                       violet dye (BioLegend; 1:2000) and anti-rat CD32/Fc block antibody (BD Bioscience; 1:50)
                       before labeling with the fluorescent-labeled detection antibodies. Antibodies used to detect
                       T cells were anti-rat CD3 antibody (viogreen), anti-rat CD4 antibody (PE-Vio770) and
                       anti-rat CD8a antibody (APC-Vio770) (all Miltenyi Biotech, 1:50, 1:10 and 1:10, respec-
                       tively) and anti-rat γδTCR antibody (PE) (BioLegend; 1:50). Antibodies used to detect
                       CD45+ leukocytes and monocyte/macrophage cells were anti-rat CD45 antibody (PE-Cy5)
                       (BD Biosciences; 1:10) and anti-rat CD68 antibody (APC-Vio770) (Miltenyi Biotech; 1:10).
                       Additionally, anti-RAGE antibody (FITC) (Biorbyt; 1:50) and anti-TLR4 antibody (APC)
                       (Novus Biologicals; 1:100) were used to detect surface receptors RAGE and TLR4 on T
                       cells and monocyte/macrophage cells. Cells were labeled for 30 min at 4 ◦ C in the dark
                       and washed twice with FACS buffer. Cells were fixed with fixation buffer (R&D systems)
                       (250 µL/well) for 15 min at 4 ◦ C in the dark and washed twice with FACS buffer before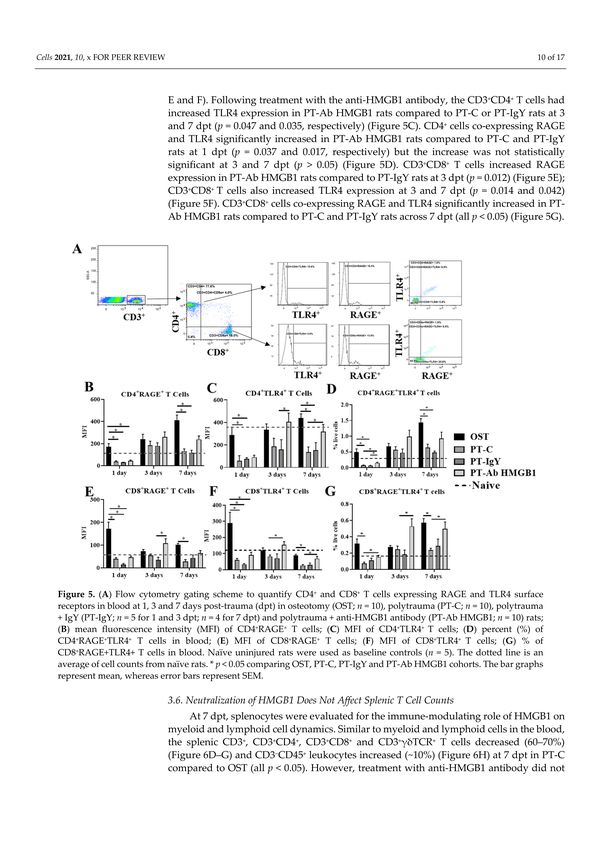
Cells 2021, 10, 1646                                                                                             4 of 17

                       proceeding with data acquisition on the MACS quant 10 flow cytometer (Miltenyi Biotech,
                       Bergisch Gladbach, Germany). All antibodies were titrated before application. Appropriate
                       isotypes control antibodies, fluorescence minus one (FMOs) and single stained cells were
                       used as controls for appropriate gating strategies. Compensation was performed with
                       either single stained cells or beads to ensure there was no spillover within channels. Data
                       were analyzed using Flow Logic software (Miltenyi Biotech), and researchers were blinded
                       to group allocation when analyzing data.

                       2.4. Blood Collection and Processing for Protein Quantification Assays
                            Aliquots of whole blood from OST (n = 5), PT-C (n = 5) and PT-Ab HMGB1 (n = 5) rats
                       were collected in EDTA tubes and centrifuged at 1000× g for 10 min to separate plasma
                       for cytokine analysis. Plasma was stored at −80 ◦ C until used for downstream assays.
                       Cytokines related to Th cell subsets were quantified in the plasma samples using Legend
                       plex rat Th cell cytokine panel kit assay (BioLegend) following the manufacturer’s protocol
                       and plasma dilution of 1:2 for all cytokines, except IL-6 and IFNγ, which was 1:4 dilution.
                       Data were acquired on the MACS quant 10 flow cytometer (Miltenyi Biotech). Data
                       analysis and standard curve interpolation were performed using a BioLegend data analysis
                       software V8.0, supplied with the kit. Additionally, plasma samples were assayed to quantify
                       67 proteins using a Quantibody® rat cytokine array Q67 kit (RayBiotech quantitative
                       proteomic services). Protein analysis of the plasma was performed by RayBiotech according
                       to their protocol and software analysis. Samples with protein concentrations outside the
                       suggested upper limit of detection and the lower limit of detection were excluded from the
                       study, and the values within the correct detectable range were used for further analysis;
                       hence, we reported cytokine protein results from n = 4–5 rats.

                       2.5. Statistical Analysis
                             Data are reported as mean ± SEM. Statistical analysis was performed using Graph-
                       Pad Prism version 8.0.0 for Windows, GraphPad Software, San Diego, CA, USA, www.
                       graphpad.com, accessed on 1 June 2021. Data were assessed for normality using the Q-Q
                       plot, homoscedasticity plot, residual plot, D’Agostino and Pearson test, Shapiro–Wilk test,
                       and the difference between means and median. Data that were not normally distributed
                       were log-transformed before statistical analysis. The cytokine array data were assessed by
                       2-way repeated-measures ANOVA for equal sample numbers and mixed-effect model for
                       samples with missing data with Dunnett’s multiple comparison test. Flow cytometry data
                       from blood was analyzed for statistical significance by performing mixed-effects analysis
                       and Tukey’s Post-hoc multiple comparison test. A p-value < 0.05 was deemed significant.

                       3. Results
                       3.1. Pro- and Anti-Inflammatory Cytokines Are Elevated Following Polytraumatic Injuries
                            Early inflammatory responses were assessed in circulation from blood drawn from
                       OST, PT-C and PT-Ab HMGB1 rats at 1, 3 and 7 dpt, as depicted in Figure 1A. At 1 dpt,
                       protein levels of T cells secreted cytokines such as interleukin (IL) 22, IL-13, IL-2, IL-6 and
                       Granulocyte-macrophage colony-stimulating factor (GM-CSF) were significantly elevated
                       in PT-C vs. OST (all p < 0.05). The anti-inflammatory cytokine IL-10 levels were highest at 1
                       and 3 dpt, and reduced at 7 dpt in PT-C vs. OST and PT-Ab HMGB1. Cytokines secreted by
                       Th17 cells and γδTCR+ T cells such as IL-22, IL-2, IL-17A and IL-17F expression levels were
                       elevated at 1, 3 and 7 dpt in PT-C vs. PT-Ab HMGB1, but were not statistically significant
                       (Figure 1B; Table 1).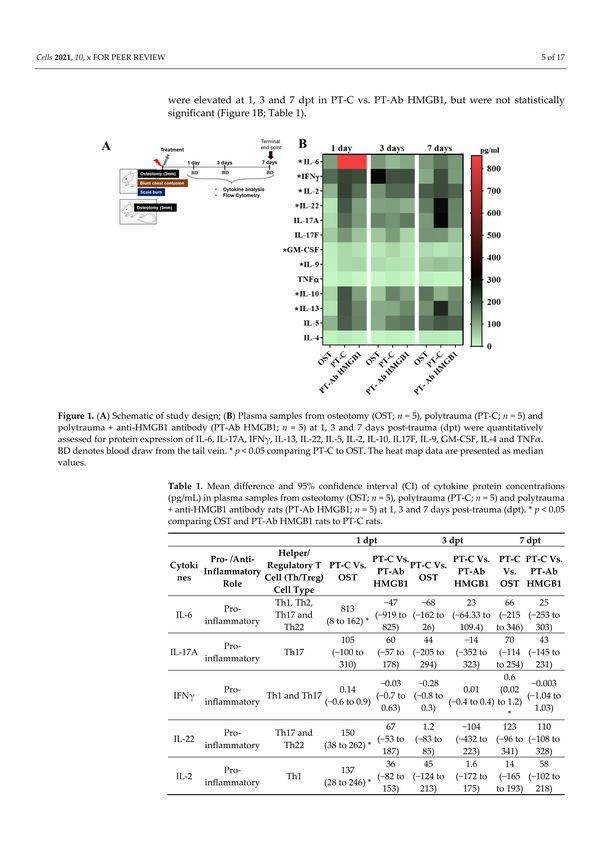
Cells 2021, 10, 1646                                                                                                                                      5 of 17

      Figure 1. (A) Schematic of study design; (B) Plasma samples from osteotomy (OST; n = 5), polytrauma (PT-C; n = 5) and
      polytrauma + anti-HMGB1 antibody (PT-Ab HMGB1; n = 5) at 1, 3 and 7 days post-trauma (dpt) were quantitatively
      assessed for protein expression of IL-6, IL-17A, IFNγ, IL-13, IL-22, IL-5, IL-2, IL-10, IL17F, IL-9, GM-CSF, IL-4 and TNFα. BD
      denotes blood draw from the tail vein. * p < 0.05 comparing PT-C to OST. The heat map data are presented as median values.

      Table 1. Mean difference and 95% confidence interval (CI) of cytokine protein concentrations (pg/mL) in plasma samples
      from osteotomy (OST; n = 5), polytrauma (PT-C; n = 5) and polytrauma + anti-HMGB1 antibody rats (PT-Ab HMGB1; n = 5)
      at 1, 3 and 7 days post-trauma (dpt). * p < 0.05 comparing OST and PT-Ab HMGB1 rats to PT-C rats.

                                                                        1 dpt                           3 dpt                               7 dpt
                                          Helper/
                         Pro- /Anti-                                            PT-C vs.                         PT-C vs.        PT-C               PT-C vs.
                                       Regulatory T       PT-C vs.                          PT-C vs.
   Cytokines           Inflammatory                                              PT-Ab                            PT-Ab           Vs.                PT-Ab
                                       Cell (Th/Treg)      OST                               OST
                            Role                                                HMGB1                            HMGB1           OST                HMGB1
                                        Cell Type
                                         Th1, Th2,                                −47         −68                    23            66                  25
                            Pro-                            813
       IL-6                              Th17 and                               (−919 to    (−162 to             (−64.33 to     (−215 to            (−253 to
                       inflammatory                     (8 to 162) *
                                           Th22                                   825)        26)                  109.4)         346)                303)
                                                           105                     60          44                  −14             70                  43
                            Pro-
     IL-17A                                Th17          (−100 to                 (−57      (−205 to             (−352 to       (−114 to            (−145 to
                       inflammatory
                                                           310)                  to 178)      294)                 323)           254)                231)
                                                                                 −0.03       −0.28                                 0.6               −0.003
                            Pro-                            0.14                                                    0.01
      IFNγ                             Th1 and Th17                             (−0.7 to    (−0.8 to                              (0.02             (−1.04 to
                       inflammatory                     (−0.6 to 0.9)                                           (−0.4 to 0.4)
                                                                                 0.63)        0.3)                              to 1.2) *             1.03)
                                                                                  67          1.2                 −104            123                 110
                            Pro-         Th17 and            150
      IL-22                                                                     (−53 to     (−83 to              (−432 to       (−96 to             (−108 to
                       inflammatory        Th22         (38 to 262) *
                                                                                 187)         85)                  223)          341)                 328)
                                                                                  36           45                   1.6           14                   58
                            Pro-                             137
       IL-2                                 Th1                                 (−82 to     (−124 to             (−172 to       (−165               (−102 to
                       inflammatory                     (28 to 246) *
                                                                                 153)         213)                 175)         to 193)               218)
                                                                                  35           43                                 12                  38
                            Pro-                            60                                                      36
     IL-17F                                Th17                                 (−42 to     (−115 to                            (−77 to             (−36 to
                       inflammatory                     (−16 to 136)                                            (−94 to 165)
                                                                                 112)         200)                               101)                113)
                                                                                  0.2         0.14                               −0.02               −0.006
                            Pro-                             0.9                                                   −0.3
       IL-9                                 Th9                                 (−0.8 to    (−1.2 to                            (−1.3 to            (−1.3 to
                       inflammatory                      (0.2 to 1.7)                                           (−1.9 to 1.3)
                                                                                  1.2)        1.5)                                1.3)                1.3)
                                                                                   0.3        0.4                  0.3            0.06               −0.2
                            Pro-       Th1, Th2 and          0.9
    GM-CSF                                                                      (−0.43 to   (−1.04 to            (−1.14 to       (−1.3              (−1.6 to
                       inflammatory       Th17          (0.01 to 1.7)
                                                                                  1.04)       1.8)                 1.7)          to 1.4)              1.3)
Cells 2021, 10, 1646 6 of 17
Table 1. Cont.
1 dpt 3 dpt 7 dpt
Helper/
Pro- /Anti- PT-C vs. PT-C vs. PT-C PT-C vs.
Regulatory T PT-C vs. PT-C vs.
Cytokines Inflammatory PT-Ab PT-Ab Vs. PT-Ab
Cell (Th/Treg) OST OST
Role HMGB1 HMGB1 OST HMGB1
Cell Type
Th1, Th2, 4 6 −1.03 0.3
Pro- 11 6
TNFα Th17, Th22 (−19 to (−25 to (−14 to (−11 to
inflammatory (−1.2 to 23) (−22 to 34)
and Th9 27) 37) 12) 12)
Th1, Th2, 20 63 −35 −97
Anti- 116 49
IL-10 Tregs, Th17, (−119 to (−67 to (−161 to (−410 to
inflammatory (33 to 199) * (−81 to 178)
Th9 and Th22 158) 192) 91) 217)
59 37 −34 66.14 42.01
Anti- 131
IL-13 Th2 and Th22 (−64 to (−174 to (−344 to (−95 to (−126 to
inflammatory (6 to 256) *
181) 248) 277) 228) 210)
43 61 2.4 −1.03 4.3
Anti- 98
IL-5 Th2 (−110 to (−82 to (−171 to (−144 (−127 to
inflammatory (−53 to 248)
195) 204) 175) to 142) 136)
3 6 −0.6 2
Anti- 8.7 5
IL-4 Th2 (−13 to (−16 to (−18 to (−18 to
inflammatory (−6 to 23) (−14 to 23)
20) 28) 17) 22)
3.2. Plasma Protein Profiles between PT-C and OST or PT-Ab HMGB1 Rats Are
Differentially Expressed
To better understand the similarities and differences between immune responses in
PT-C vs. OST and PT-Ab HMGB1, we examined expression patterns of 67 plasma proteins
using the Rat Cytokine Array Q67 (RayBiotech). Fifteen proteins were differentially ex-
pressed temporally between PT-C and OST or PT-Ab HMGB1 and are presented in Figure 2.
These proteins are Neuropilin 1 and 2, monocyte attracting chemokine (MCP-1/CCL2),
adhesion molecules (L-selectin, junctional adhesion molecule (JAM-A), P-cadherin), pro-
teoglycan (decorin), cell arrest and apoptosis regulator (GAS-1), proteins for endothelial
differentiation and regeneration of tissue i.e., neurogenic locus notch homolog protein 2
(Notch 2), anti-inflammatory and T cell suppressive protein (Galectin 1), cytokine-induced
neutrophil chemoattractant 1 (CINC-1), TNF-related weak inducer of apoptosis receptor
(TWEAK R), lymphocyte activation markers, i.e., CD48 and regulated on activation, nor-
mal T cell expressed and secreted (RANTES), and lymphocyte activation co-stimulatory
immune checkpoint molecule (CD137). Expression levels of proteins responsible for MCP-
1/CCL2, neuropilin 1 and neuropilin 2 were elevated in PT-C at 3 dpt compared to OST and
PT-Ab HMGB1 rats (all p < 0.05) (Figure 2A–C). The expression levels of L-selectin, JAM-A,
decorin, galectin-1 and Gas1 increased at 1 dpt in PT-C and PT-Ab HMGB1 compared to
OST (all p < 0.05); however, L-selectin levels was decreased at 7 dpt in PT-C compared to
PT-Ab HMGB1 (p = 0.034) (Figure 2D,E,G,H,L). The expression levels of P-Cadherin and
Notch-2 were decreased at 7 dpt in PT-C compared to OST (all p = 0.04) (Figure 2F,J). The
expression levels of CINC-1 were significantly reduced at 1 and 3 dpt in PT-C compared
to PT-Ab HMGB1 (p = 0.005 and 0.03, respectively) (Figure 2K). In contrast, TWEAK R
expression significantly increased at 1 and 3 dpt in PT-C compared to OST (all p = 0.04)
(Figure 2I). The expression of RANTES decreased in PT-C compared to OST and PT-Ab
HMGB1 at 3 and 7 dpt. It was statistically significantly different from OST at 3 and 7 dpt
(p = 0.013 and 0.005, respectively) (Figure 2M). CD48, a lymphocyte activation marker,
increased in PT-C vs. OST and PT-Ab HMGB1 and was statistically significant only on
1 dpt for PT-C vs. PT-Ab HMGB1 (p = 0.03) (Figure 2N). Protein expression levels of CD137
increased in PT-C at 1 and 7 dpt and were statistically significant only on 1 dpt for PT-C vs.
OST and PT-Ab HMGB1 (p = 0.04 and 0.0016, respectively) (Figure 2O).Cells 2021, 10, 1646 7 of 17
Figure 2. Plasma samples from osteotomy (OST), polytrauma (PT-C), and polytrauma + anti-HMGB1 antibody (PT-Ab
HMGB1) at 1, 3 and 7 days post-trauma (dpt) were quantitatively assessed for cytokine protein expression. (A) Monocyte
attracting chemokine (MCP-1/CCL2); (B) Neuropilin 1; (C) Neuropilin 2; (D–F) Adhesion molecules: L-selectin, junctional
adhesion molecule (JAM-A) and P-cadherin, respectively; (G) Proteoglycan: decorin; (H) Cell arrest and apoptosis regulator
(GAS-1); (I) TNF-related weak inducer of apoptosis receptor (TWEAK R); (J) Neurogenic locus notch homolog protein 2
(Notch 2); (K) Cytokine-induced neutrophil chemoattractant 1 (CINC-1); (L) Anti-inflammatory and T cell suppressive
protein: Galectin 1; (M) Regulated on activation, normal T cell expressed and secreted (RANTES); (N) Lymphocyte activation
marker: CD48; and (O) lymphocyte activation co-stimulatory immune checkpoint molecule: CD137. (n = 4–5 for OST, PT
and PT-Ab HMGB1) * p < 0.05 comparing OST and PT-Ab HMGB1 rats to PT-C rats. The bar graphs represent the mean,
whereas error bars represent SEM. NA–protein expression data is not available.Cells 2021, 10, 1646 8 of 17
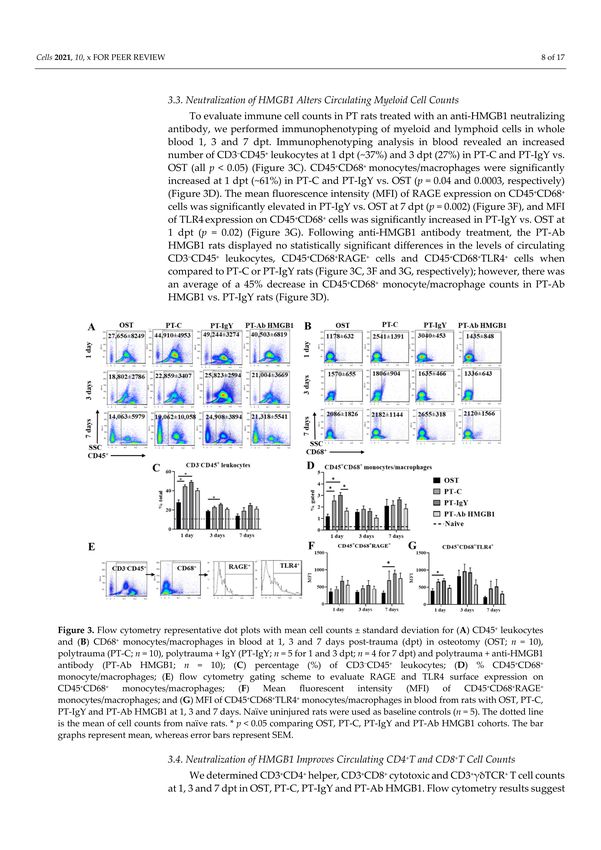
3.3. Neutralization of HMGB1 Alters Circulating Myeloid Cell Counts
To evaluate immune cell counts in PT rats treated with an anti-HMGB1 neutralizing
antibody, we performed immunophenotyping of myeloid and lymphoid cells in whole
blood 1, 3 and 7 dpt. Immunophenotyping analysis in blood revealed an increased number
of CD3− CD45+ leukocytes at 1 dpt (~37%) and 3 dpt (27%) in PT-C and PT-IgY vs. OST (all
p < 0.05) (Figure 3C). CD45+ CD68+ monocytes/macrophages were significantly increased
at 1 dpt (~61%) in PT-C and PT-IgY vs. OST (p = 0.04 and 0.0003, respectively) (Figure 3D).
The mean fluorescence intensity (MFI) of RAGE expression on CD45+ CD68+ cells was
significantly elevated in PT-IgY vs. OST at 7 dpt (p = 0.002) (Figure 3F), and MFI of TLR4
expression on CD45+ CD68+ cells was significantly increased in PT-IgY vs. OST at 1 dpt
(p = 0.02) (Figure 3G). Following anti-HMGB1 antibody treatment, the PT-Ab HMGB1 rats
displayed no statistically significant differences in the levels of circulating CD3− CD45+
leukocytes, CD45+ CD68+ RAGE+ cells and CD45+ CD68+ TLR4+ cells when compared to
PT-C or PT-IgY rats (Figure 3C, Figure 3F and Figure 3G, respectively); however, there was
an average of a 45% decrease in CD45+ CD68+ monocyte/macrophage counts in PT-Ab
HMGB1 vs. PT-IgY rats (Figure 3D).
Figure 3. Flow cytometry representative dot plots with mean cell counts ± standard deviation for (A) CD45+ leukocytes and
(B) CD68+ monocytes/macrophages in blood at 1, 3 and 7 days post-trauma (dpt) in osteotomy (OST; n = 10), polytrauma
(PT-C; n = 10), polytrauma + IgY (PT-IgY; n = 5 for 1 and 3 dpt; n = 4 for 7 dpt) and polytrauma + anti-HMGB1 antibody (PT-
Ab HMGB1; n = 10); (C) percentage (%) of CD3− CD45+ leukocytes; (D) % CD45+ CD68+ monocyte/macrophages; (E) flow
cytometry gating scheme to evaluate RAGE and TLR4 surface expression on CD45+ CD68+ monocytes/macrophages;
(F) Mean fluorescent intensity (MFI) of CD45+ CD68+ RAGE+ monocytes/macrophages; and (G) MFI of CD45+ CD68+ TLR4+
monocytes/macrophages in blood from rats with OST, PT-C, PT-IgY and PT-Ab HMGB1 at 1, 3 and 7 days. Naïve uninjured
rats were used as baseline controls (n = 5). The dotted line is the mean of cell counts from naïve rats. * p < 0.05 comparing
OST, PT-C, PT-IgY and PT-Ab HMGB1 cohorts. The bar graphs represent mean, whereas error bars represent SEM.Cells 2021, 10, 1646 9 of 17
3.4. Neutralization of HMGB1 Improves Circulating CD4+ T and CD8+ T Cell Counts
We determined CD3+ CD4+ helper, CD3+ CD8+ cytotoxic and CD3+ γδTCR+ T cell
counts at 1, 3 and 7 dpt in OST, PT-C, PT-IgY and PT-Ab HMGB1. Flow cytometry results
suggest a 40–50% decrease in CD3+ , CD3+ CD4+ , CD3+ CD8+ and CD3+ γδTCR+ T cell
counts across 7 dpt in PT-C compared to OST (all p < 0.05) (Figure 4C–F). Interestingly,
following the neutralization of HMGB1, there was increased blood CD3+ , CD3+ CD4+ and
CD3+ CD8+ T cell counts. PT-Ab HMGB1 rats demonstrated a statistically significant in-
crease of CD3+ CD4+ T cell counts at 3 dpt (30%) (p = 0.021) (Figure 4D) and CD3+ CD8+ T
cells counts on 1 dpt (45%) and 3 dpt (39%) (p = 0.008 and 0.022, respectively) (Figure 4E)
compared to PT-C or PT-IgY; however, the counts were only moderately increased and
were not as high as observed in the OST rats. The levels of circulating γδ+ TCR T cell
counts were modestly increased (10–20%) in PT-Ab HMGB1 rats compared to PT-C and
PT-IgY rats but were not statistically significant (Figure 4F). As hypothesized, the neutral-
ization of HMGB1 immediately post-injuries ameliorates CD3+ CD4+ and CD3+ CD8+ T cell
suppression in circulation.
Figure 4. Flow cytometry representative dot plots with mean cell counts ± standard deviation for (A) CD3+ CD4+ and
CD3+ CD8+ T cells and (B) CD3+ γδTCR+ T cell counts in blood at 1, 3 and 7 days post-trauma (dpt) in osteotomy (OST;
n = 10), polytrauma (PT-C; n = 10), polytrauma + IgY (PT-IgY; n = 5 for 1 and 3 dpt; n = 4 for 7 dpt) and polytrauma +
anti-HMGB1 antibody (PT-Ab HMGB1; n = 10) rats; (C) percent (%) CD3+ ; (D) % CD3+ CD4+ ; (E) % CD3+ CD8+ ; (F) %
CD3+ γδTCR T cells in blood from rats with OST, PT-C, PT-IgY and PT-Ab HMGB1 at 1, 3 and 7 dpt. Naïve uninjured rats
were used as baseline controls (n = 5). The dotted line is the mean of cell counts from naïve rats. * p < 0.05 comparing OST,
PT-C, PT-IgY and PT-Ab HMGB1 cohorts. The bar graphs represent mean, whereas error bars represent SEM.Cells 2021, 10, 1646 10 of 17
3.5. Neutralization of HMGB1 Restores RAGE and TLR4 Surface Expression on Circulating
T Cells
To investigate the biological effects of HMGB1 on T cells’ functional status and their
receptor expression, we evaluated the surface expression of RAGE and TLR4 expression on
circulating CD3+ CD4+ and CD3+ CD8+ T cells at 1, 3 and 7 dpt. The expression of RAGE
and TLR4 on CD3+ CD4+ T cells and CD3+ CD8+ T cells was significantly lower in the PT-C
rats compared to OST rats at 1 and 7 dpt (p < 0.05) but not at 3 dpt (p > 0.05) (Figure 5B,
C, E and F). Following treatment with the anti-HMGB1 antibody, the CD3+ CD4+ T cells
had increased TLR4 expression in PT-Ab HMGB1 rats compared to PT-C or PT-IgY rats at 3
and 7 dpt (p = 0.047 and 0.035, respectively) (Figure 5C). CD4+ cells co-expressing RAGE
and TLR4 significantly increased in PT-Ab HMGB1 rats compared to PT-C and PT-IgY rats
at 1 dpt (p = 0.037 and 0.017, respectively) but the increase was not statistically significant
at 3 and 7 dpt (p > 0.05) (Figure 5D). CD3+ CD8+ T cells increased RAGE expression in
PT-Ab HMGB1 rats compared to PT-IgY rats at 3 dpt (p = 0.012) (Figure 5E); CD3+ CD8+
T cells also increased TLR4 expression at 3 and 7 dpt (p = 0.014 and 0.042) (Figure 5F).
CD3+ CD8+ cells co-expressing RAGE and TLR4 significantly increased in PT-Ab HMGB1
rats compared to PT-C and PT-IgY rats across 7 dpt (all p < 0.05) (Figure 5G).
Figure 5. (A) Flow cytometry gating scheme to quantify CD4+ and CD8+ T cells expressing RAGE and TLR4 surface receptors
in blood at 1, 3 and 7 days post-trauma (dpt) in osteotomy (OST; n = 10), polytrauma (PT-C; n = 10), polytrauma + IgY
(PT-IgY; n = 5 for 1 and 3 dpt; n = 4 for 7 dpt) and polytrauma + anti-HMGB1 antibody (PT-Ab HMGB1; n = 10) rats; (B) mean
fluorescence intensity (MFI) of CD4+ RAGE+ T cells; (C) MFI of CD4+ TLR4+ T cells; (D) percent (%) of CD4+ RAGE+ TLR4+ T
cells in blood; (E) MFI of CD8+ RAGE+ T cells; (F) MFI of CD8+ TLR4+ T cells; (G) % of CD8+ RAGE+TLR4+ T cells in blood.
Naïve uninjured rats were used as baseline controls (n = 5). The dotted line is an average of cell counts from naïve rats.
* p < 0.05 comparing OST, PT-C, PT-IgY and PT-Ab HMGB1 cohorts. The bar graphs represent mean, whereas error bars
represent SEM.Cells 2021, 10, 1646 11 of 17
3.6. Neutralization of HMGB1 Does Not Affect Splenic T Cell Counts
At 7 dpt, splenocytes were evaluated for the immune-modulating role of HMGB1 on
myeloid and lymphoid cell dynamics. Similar to myeloid and lymphoid cells in the blood,
the splenic CD3+ , CD3+ CD4+ , CD3+ CD8+ and CD3+ γδTCR+ T cells decreased (60–70%)
(Figure 6D–G) and CD3− CD45+ leukocytes increased (~10%) (Figure 6H) at 7 dpt in PT-C
compared to OST (all p < 0.05). However, treatment with anti-HMGB1 antibody did not
alter circulating CD3+ T cells and CD3− CD45+ leukocytes compared to non-treated PT rats,
i.e., PT-C and PT-IgY (Figure 6D–H).
Figure 6. Flow cytometry representative dot plots with mean cell counts ± standard deviation for (A) CD3+ CD4+ and
CD3+ CD8+ T cells; (B) CD3+ γδTCR+ T cell counts; (C) CD3− CD45+ leukocytes in blood at 1, 3 and 7 days post-trauma (dpt)
in osteotomy (OST; n = 10), polytrauma (PT-C; n = 10), polytrauma + IgY (PT-IgY; n = 5 for 1 and 3 dpt; n = 4 for 7 dpt) and
polytrauma + anti-HMGB1 antibody (PT-Ab HMGB1; n = 10) rats; (D) percentage (%) CD3+ T cells; (E) % CD3+ CD4+ T
cells; (F) % CD3+ CD8+ T cells; (G) % CD3+ γδTCR T cells; and (H) % CD3− CD45+ leukocytes in blood from rats with OST,
PT-C, PT-IgY and PT-Ab HMGB1 at 1, 3 and 7 dpt. Naïve uninjured rats were used as baseline controls (n = 5). The dotted
line is the mean of cell counts from naïve rats. * p < 0.05 comparing OST, PT-C, PT-IgY and PT-Ab HMGB1 cohorts. The bar
graphs represent mean, whereas error bars represent SEM.
4. Discussion
An established rat PT model of delayed fracture healing exhibiting HMGB1 surge
was employed in this study. To investigate the previously unknown mechanisms between
HMGB1 and dysregulated immune responses, mainly T cell exhaustion, lymphopenia
and dysfunction in PT, we determined whether PT associated HMGB1 levels dictate theCells 2021, 10, 1646 12 of 17
onset of early mixed inflammatory responses, including altered cellular expression of
RAGE and TLR4 and if neutralization of HMGB1 ameliorates such dysregulated immune
responses. Our rat PT model exhibited massive and complex early hyper-inflammatory
responses as indicated by the elevated levels of cytokines, chemokines, adhesion molecules,
T cell activation, as well as T cell suppressive cytokines, cell arrest and apoptosis proteins.
Further, there was a concurrent rise in monocyte/macrophages and severely diminished T
cells in the blood and spleen. While treatment with anti-HMGB1 antibody immediately
post-trauma modestly attenuated the early hyper-inflammatory cytokine responses, it
significantly restored immune cell dynamics and receptor expression of RAGE and TLR4
in blood, but not in the spleen. Such interactions could be potentiating cellular hyper-
activation and exhaustion, rendering cells unresponsive to further stimuli, a possible reason
for the delayed fracture healing phenotype associated with PT (Figure 7).
Figure 7. Graphical illustration showing the effects of high mobility group box protein 1(HMGB1),
a damage-associated molecular pattern (DAMP) in (A) single trauma and (B) polytrauma (PT).
Several DAMPs such as HMGB1, mitochondrial DNA (mtDNA), S100 and other similar molecules
are released from the cytosol of necrotic cells following injury and the damage of the cell membranes.
Despite the importance of all DAMPs in mounting inflammation, here we shed light on the role of
HMGB1 in PT due to its prominence as an early post-traumatic predictor marker [14,15]. Following
injury circulating levels of HMGB1 are relatively lower in a single injury than in PT. HMGB1 mediates
pro-inflammatory and immunomodulatory responses by binding to receptor for advanced glycation
end products (RAGE) and toll-like receptor 4 (TLR4) on immune cells and triggers pro-inflammatory
cascades in the surrounding cells the host must compensate for to maintain homeostasis. However,
while inflammation is vital for regulating tissue homeostasis and repair if overburdened by the early
surge of HMGB1, it can result in hyper-inflammation and immune cell exhaustion causing T cells
to alter their phenotypes and undergo ectodomain shedding of RAGE and TLR4, leading to T cell
lymphopenia and dysfunction.
During the initial days post-trauma, our observations of the immune responses
conform to expectations based on the previous clinical observations and those obser-
vations made in other rodent models [20,21]. Studies using rodent models of trauma-
hemorrhage and sepsis have demonstrated similar concurrent responses showing both
hyper-inflammation and immunosuppression, thereby establishing an independent re-
sponse pattern known as mixed antagonist response syndrome (MARS) that, according toCells 2021, 10, 1646 13 of 17
our results, seems to be also prevalent in PT [24–26]. The rise in plasma concentrations of
cytokines such as IL-6, IFNγ and TNFα, during the early hours post-trauma (hpt) likely
contributes to the mobilization of CD45+ myeloid leukocytes, including CD68+ mono-
cyte/macrophages. Meanwhile, elevated levels of GM-CSF and MCP-1 observed here
may associate with migration and proliferation of monocyte/macrophages within the
inflammatory niche, as previously demonstrated [27]. As observed in severe trauma pa-
tients, a notable SIRS response, paralleled by CARS-like responses associated with elevated
anti-inflammatory molecules such as IL-10, IL-13 and Galectin, was evident in our results,
confirming a MARS-like response in PT [28]. The comparatively lower TNFα expression
coincides with higher IL-10 levels in the current study, which is known to inhibit TNFα
secretion. Schneider et al. showed elevated levels of IL-10, IL-6 and TNFα during the early
trauma hemorrhage and blocking of IL-10 further increased IL-6 and TNFα levels after
injury, indicating that IL-10 release may be part of the body’s natural defense process to
counter-regulate the early-deranged immune mediators as means to attenuate post-injury
SIRS [25]. This observation could explain the reason for increased IL-6 expression at 1 dpt
in PT-Ab HMGB1 rats, whose IL-10 levels were slightly reduced during that time-point,
compared to PT-C rats.
Contrasting to the increased proportion of monocyte/macrophages in blood and
spleen, the T cell counts were significantly depleted, consistent with previous findings
suggesting trauma-associated lymphopenia in trauma patients [5]. As suspected, early and
inappropriate T cell activation was confirmed with increased expression of lymphocyte
activation markers, CD48 and CD137, at 1 dpt in PT-C compared to OST and PT-Ab HMGB1.
Cross-linking of CD137 promotes IL-2 secretion and enhances T cell proliferation, survival
and cytolytic activity, a possible explanation for increased IL-2 levels in PT-C than OST and
PT-Ab HMGB1 at 1 dpt. Interestingly and contrasting to previous findings, the expression of
RANTES, a chemoattractant for T cells, decreased in PT-C compared to PT-Ab HMGB1 and
OST at 3 and 7 dpt, which is indicative of T cell depletion in PT-C [24]. The role of HMGB1
in activating CD4+ T cells has been previously demonstrated [29]; however, in the context
of extremity trauma, the untimely activation of T cells via HMGB1 mediated cascades
within the first 24 hpt could explain the occurrence of T cell exhaustion and dysfunction.
Early neutralization of HMGB1 significantly ameliorated circulating CD4+ and CD8+ T cell
depletion. Interestingly, the same anti-HMGB1 antibody treated PT rats demonstrated no
significant recovery of γδTCR+ T cells, suggesting the potential involvement of additional
mediators in regulating γδTCR+ T cells depletion in PT, prompting further investigation.
Recent findings in chronic inflammatory disorders and cancer suggest that HMGB1
enhances immunosuppressive properties of T cells either directly or indirectly [30]. Direct
activation occurs via RAGE and TLR4 surface receptors expressed on T cells. For example,
the HMGB1:RAGE/TLR4 axis mediates activation of immune inhibitory function of reg-
ulatory T cells (Tregs), whose primary role is to suppress CD4+ and CD8+ T cells via the
production of IL-10 [30]. Whereas indirect activation could be via HMGB1:TLR4: NFκB
axis mediated activation of myeloid-derived suppressor cells (MDSCs) proliferation and
its crosstalk with macrophages resulting in enhanced IL-10 secretion, could potentially
exert T cell suppression [31]. The exact mechanisms of T cell suppression are still not fully
understood and could be a combination of both direct and indirect mechanisms involving
RAGE and TLR4 receptors as well as via MDSCs, which has been previously described [20].
While the expression levels of RAGE and TLR4 increased on monocytes/macrophages, the
receptor expression levels significantly diminished on T cells in PT-C compared to OST.
This study is the first indication of diminished levels of surface expression of RAGE and
TLR4 on T cells in response to overwhelming levels of HMGB1 in vivo. In an in vitro study,
the authors stimulated human aortic endothelial cells (HAECs) with a high concentration of
HMGB1 and demonstrated that as time progressed, HAECs rapidly underwent ectodomain
shedding of RAGE and TLR4 in response to HMGB1 and was concentration and time-
dependent, which caused the cells to become insensitive to further HMGB1 stimulation [19].
Similarly, in our study, the diminished expression levels of RAGE and TLR4 on T cells inCells 2021, 10, 1646 14 of 17
PT could be due to receptor ectodomain shedding and T cell exhaustion/anergy because of
the early and untimely activation of T cells by HMGB1. Interestingly, early neutralization
of HMGB1 restored the expression of RAGE and TLR4 on T cells (primarily CD8+ T cells),
implying that HMGB1 favors receptor-mediated immune function when present at low
levels, thereby suggesting its direct role in regulating T cell responses via RAGE and TLR4.
Further, the proportion of T cells expressing RAGE and TLR4 increased, accompanied
by the augmentation of cell-cell adhesion ability evidenced by elevated plasma levels of
L-selectin and P-cadherin, which are rapidly shed by specialized enzymes upon cellular
activation, suggesting that neutralization of HMGB1 demonstrated a positive response for
maintaining the CD4+ and CD8+ T cells activation in blood. We and others have shown
that circulating L-selectin levels are increased at 1 dpt in PT-C, and the levels continue to
decrease with time in extremity trauma [32]. Importantly, our observations likely indicate
that the use of therapeutic blocking agents specific to RAGE or TLR4 for long-term suppres-
sion of HMGB1 mediated inflammatory pathways might not deliver favorable outcomes
in PT.
In addition to evaluating T cell counts by flow cytometry, we also attempted to
characterize the helper T (Th) cell responses in PT based on the Th cell cytokine profiles in
circulation. Recent findings support the notion that the induction of specific Th cell subsets
are critical for orchestrating the immune regulatory mechanisms and have emerged as
essential reparative cells in wound healing. T cells can resolve inflammation by secreting
reparative cytokines and growth factors and interact with other immune cells to potentiate
the complex and active tissue repair process (reviewed in [33]). Some trauma studies
suggest that an abnormal shift within the Th cell subsets and their secreted cytokines
contributes to dysregulated immune responses [22,34]. However, this theory remains
unclear due to contrasting findings from various research groups. In the case of trauma
hemorrhage patients, a study demonstrated that Th type 1 cell (Th1) responses (secrete
IL-2, IFNγ) were suppressed. In contrast, the Th type 2 (Th2) responses (secrete IL-4,
IL-5, IL-13 and IL-10) were elevated, leading to a suppressed adaptive immune response
and increased susceptibility to sepsis [35]. Findings from another group indicate that
following severe burn trauma, a notable increase in Th2 response occurs without altering
the Th1 response [36,37]. In the current study, we assessed circulating Th cytokines secreted
from various Th cell subtypes and showed that most of the Th cytokines (with either pro-
inflammatory or anti-inflammatory roles) peaked on day one in PT-C compared to OST
rats. The elevated levels of IL-22, IL-13, IL-2 and IL-6 observed within the first 24 hpt
may likely provide integral signals for T cell activation and mobilization. During the
first 24 h, the cytokines released do not indicate a favorable shift in the Th1/Th2-type
towards Th2 cytokine response. However, cytokine data suggests that more than one of the
Th cell subtypes were simultaneously activated. These observations are similar to those
demonstrated previously in major trauma patients with generally high plasma levels of all
Th cell cytokines, who needed hospitalization but did not succumb to trauma [28].
As mentioned previously, the increased cytokine levels during the initial 24 hpt depict
the occurrence of a cytokine storm, which is of diagnostic value in severe trauma patients
with a risk of developing severe complications and death [38]. We suspect that a prominent
Th2 immunosuppressive response is marked by elevated IL-10 levels, indicating post-injury
T cell suppression in PT. Shimin Wang et al., in their study, demonstrated that increased IL-
10 production led to T cell inactivation and impairment of adaptive immunity in the tumor
environment [39]. IL-10 is also known to suppress the production of pro-inflammatory
mediators such as IL-2 and IFNγ secreted by Th1 cells, thereby inhibiting innate and
adaptive immune responses to infectious pathogens. IL-2 is predominantly expressed
by activated CD4+ T cells, and its levels are generally quantified to assess Th1 responses.
Inadequate IL-2 production is associated with immunosuppression after burn injury [40].
Contrastingly, we observed elevated levels of IL-2 in PT-C compared to OST at 1 dpt and
diminished levels at 3 and 7 dpt in all groups. High levels of IL-2 in our study are per
the findings of Petr Svoboda et al., where the authors reported that IL-2 was detected inCells 2021, 10, 1646 15 of 17
severe trauma patients only during the first 24 hpt, following which the concentrations
of IL-2 rapidly decreased in all trauma patients [41]. Pro-inflammatory cytokines such as
IL-22, IL-2, IL-17A and IL-17F secreted by Th17 cells and γδTCR+ T cells were substantially
elevated at all times in PT-C vs. PT-Ab HMGB1, indicating the onset of an early hyper-
inflammatory response. However, whether this early hyper-inflammatory response in PT
is due to a shift in precisely the Th2 response or could be due to global immune depression
is unknown and requires further evaluation of the Th cell subtypes. Our findings infer
that the heightened cytokine response is the body’s natural way of regulating the immune
response. If left in such an overwhelming inflammatory state, the response could have
deleterious effects, leading to MODS and delayed healing.
Overall, these findings contribute to the characterization of polytraumatic peripheral
hyper-inflammation and T cell exhaustion, lymphopenia and dysfunction. We suggest
that modulating the balance between the pro-and anti-inflammatory mediators in a timely
fashion may become a potential therapeutic approach that reduces mortality and improve
the prognosis of PT patients. There are a few limitations to the study. Since the animals
were raised in an almost sterile environment, the phenotype of the CD8+ T cells may differ
from clinical data, especially those trauma patients who have been previously exposed to
various antigens creating an individualized immune profile [42], raising the notion that
further evaluation of memory CD8+ T cells in this model is desirable for reaching definitive
conclusions. Although the distribution of investigated circulating Th cytokines levels
indicated no particular shift toward a specific Th cell subset, the Th cell subset distribution
may differ in the tissue environment and need further investigation. Another limitation
is that the cytokines secreted by Th cells may also be secreted by other leukocytes, which
could be interfering with clearly distinguishing a particular shift toward a specific Th
cell subset.
5. Conclusions
In conclusion, our results indicate that T cell exhaustion and lymphopenia are possibly
associated with the altered expression levels of RAGE and TLR4, which is linked to the rise
in leukocyte mobilization and an early mixed hyper-inflammatory response by a surge in
HMGB1 levels following extremity trauma. We ultimately demonstrated that high levels
of HMGB1 are responsible for producing unsatisfactory outcomes in PT; nevertheless,
its early neutralization immediately post injuries opens up new opportunities for early
and targeted therapeutic strategies for preventing dysregulated immune responses after
polytraumatic injuries.
Author Contributions: Conceptualization: J.C.W. and P.J.M.; Data curation, P.J.M.; Formal analysis,
P.J.M.; Funding acquisition, J.C.W.; Methodology, P.J.M. and J.C.W.; Supervision, J.C.W. and M.G.S.;
Writing—original draft, P.J.M.; Writing—review & editing, M.G.S., J.C.W. and P.J.M. All authors have
read and agreed to the published version of the manuscript.
Funding: This research was supported by the Combat Casualty Care Research Program (CCCRP).
Institutional Review Board Statement: Research was conducted in compliance with the Animal
Welfare Act, the implementing Animal Welfare regulations, and the principles of the Guide for the
Care and Use of Laboratory Animals, National Research Council. The facility’s Institutional Animal
Care and Use Committee approved all research conducted in this study. The facility where this
research was conducted is fully accredited by the AAALAC.
Data Availability Statement: The datasets generated during and/or analyzed during the current
study are available from the corresponding author on reasonable request.
Acknowledgments: We thank Alicia Lofgren, Christina Sandoval and Kinton Armmer for animal
surgery and technical support. We also thank Scott Kelly, Pham Phong and Desiree Romano for
animal surgery assistance, sample collection and laboratory support.
Conflicts of Interest: The authors declare no conflict of interest.Cells 2021, 10, 1646 16 of 17
Dod Disclaimer: The views expressed in this article are those of the author(s) and do not reflect the
official policy or position of the U.S. Army Medical Department, Department of the Army, DoD or
the U.S. Government.
References
1. Karwan, K. Evaluation of patients with polytrauma treated in the emergency department. Pol. Merkur. Lek. Organ Pol. Tow. Lek.
2009, 27, 296–301.
2. Dhar, S.A.; Butt, M.F.; Hussain, A.; Mir, M.R.; Halwai, M.A.; Kawoosa, A.A. Management of lower limb fractures in polytrauma
patients with delayed referral in a mass disaster: The role of the Ilizarov method in conversion osteosynthesis. Injury 2008, 39,
947–951. [CrossRef]
3. Hranjec, T.; Swenson, B.R.; Dossett, L.A.; Metzger, R.; Flohr, T.R.; Popovsky, K.A.; Bonatti, H.J.; May, A.K.; Sawyer, R.G. Diagnosis-
dependent relationships between cytokine levels and survival in patients admitted for surgical critical care. J. Am. Coll. Surg.
2010, 210, 833–844. [CrossRef]
4. Xiao, W.; Mindrinos, M.N.; Seok, J.; Cuschieri, J.; Cuenca, A.G.; Gao, H.; Hayden, D.L.; Hennessy, L.; Moore, E.E.; Minei, J.P. A
genomic storm in critically injured humans. J. Exp. Med. 2011, 208, 2581–2590. [CrossRef]
5. Manson, J.; Cole, E.; De’Ath, H.D.; Vulliamy, P.; Meier, U.; Pennington, D.; Brohi, K. Early changes within the lymphocyte
population are associated with the development of multiple organ dysfunction syndrome in trauma patients. Crit. Care 2016, 20,
1–10. [CrossRef] [PubMed]
6. Weckbach, S.; Hohmann, C.; Braumueller, S.; Denk, S.; Klohs, B.; Stahel, P.F.; Gebhard, F.; Huber-Lang, M.S.; Perl, M. Inflammatory
and apoptotic alterations in serum and injured tissue after experimental polytrauma in mice: Distinct early response compared
with single trauma or “double-hit” injury. J. Trauma Acute Care Surg. 2013, 74, 489–498. [CrossRef] [PubMed]
7. Bastian, O.W.; Kuijer, A.; Koenderman, L.; Stellato, R.K.; van Solinge, W.W.; Leenen, L.P.; Blokhuis, T.J. Impaired bone healing in
multitrauma patients is associated with altered leukocyte kinetics after major trauma. J. Inflamm. Res. 2016, 9, 69. [CrossRef]
[PubMed]
8. Keel, M.; Trentz, O. Pathophysiology of polytrauma. Injury 2005, 36, 691–709. [CrossRef] [PubMed]
9. Gentile, L.F.; Cuenca, A.G.; Efron, P.A.; Ang, D.; McKinley, B.A.; Moldawer, L.L.; Moore, F.A. Persistent inflammation and
immunosuppression: A common syndrome and new horizon for surgical intensive care. J. Trauma Acute Care Surg. 2012, 72, 1491.
[CrossRef] [PubMed]
10. Heffernan, D.S.; Monaghan, S.F.; Thakkar, R.K.; Machan, J.T.; Cioffi, W.G.; Ayala, A. Failure to normalize lymphopenia following
trauma is associated with increased mortality, independent of the leukocytosis pattern. Crit. Care 2012, 16, 1–10. [CrossRef]
11. Relja, B.; Land, W.G. Damage-associated molecular patterns in trauma. Eur. J. Trauma Emerg. Surg. 2020, 46, 751–775. [CrossRef]
12. Sun, S.; Sursal, T.; Adibnia, Y.; Zhao, C.; Zheng, Y.; Li, H.; Otterbein, L.E.; Hauser, C.J.; Itagaki, K. Mitochondrial DAMPs increase
endothelial permeability through neutrophil dependent and independent pathways. PLoS ONE 2013, 8, e59989. [CrossRef]
13. Shao, Y.; Nanayakkara, G.; Cheng, J.; Cueto, R.; Yang, W.Y.; Park, J.-Y.; Wang, H.; Yang, X. Lysophospholipids and their receptors
serve as conditional DAMPs and DAMP receptors in tissue oxidative and inflammatory injury. Antioxid. Redox Signal. 2018, 28,
973–986. [CrossRef]
14. Cohen, M.J.; Brohi, K.; Calfee, C.S.; Rahn, P.; Chesebro, B.B.; Christiaans, S.C.; Carles, M.; Howard, M.; Pittet, J.-F. Early release of
high mobility group box nuclear protein 1 after severe trauma in humans: Role of injury severity and tissue hypoperfusion. Crit.
Care 2009, 13, 1–10. [CrossRef] [PubMed]
15. Ottestad, W.; Rognes, I.N.; Pischke, S.E.; Mollnes, T.E.; Andersson, U.; Eken, T. Biphasic release of the Alarmin high mobility
group box 1 protein early after trauma predicts poor clinical outcome. Crit. Care Med. 2019, 47, e614–e622. [CrossRef]
16. Mangum, L.H.; Avila, J.J.; Hurtgen, B.J.; Lofgren, A.L.; Wenke, J.C. Burn and thoracic trauma alters fracture healing, systemic
inflammation, and leukocyte kinetics in a rat model of polytrauma. J. Orthop. Surg. Res. 2019, 14, 1–15. [CrossRef] [PubMed]
17. Horst, K.; Hildebrand, F.; Pfeifer, R.; Hübenthal, S.; Almahmoud, K.; Sassen, M.; Steinfeldt, T.; Wulf, H.; Ruchholtz, S.; Pape, H.
Impact of haemorrhagic shock intensity on the dynamic of alarmins release in porcine poly-trauma animal model. Eur. J. Trauma
Emerg. Surg. 2016, 42, 67–75. [CrossRef] [PubMed]
18. Yang, H.; Wang, H.; Andersson, U. Targeting inflammation driven by HMGB1. Front. Immunol. 2020, 11, 484. [CrossRef]
19. Yang, W.S.; Kim, J.J.; Lee, M.J.; Lee, E.K.; Park, S.-K. Ectodomain shedding of RAGE and TLR4 as a negative feedback regulation
in high-mobility group box 1-activated aortic endothelial cells. Cell. Physiol. Biochem. 2018, 51, 1632–1644. [CrossRef]
20. Ruan, X.; Darwiche, S.S.; Cai, C.; Scott, M.J.; Pape, H.-C.; Billiar, T.R. Anti-HMGB1 monoclonal antibody ameliorates immunosup-
pression after peripheral tissue trauma: Attenuated T-lymphocyte response and increased splenic CD11b+ Gr-1+ myeloid-derived
suppressor cells require HMGB1. Mediat. Inflamm. 2015, 2015, 458626. [CrossRef]
21. Huang, L.-F.; Yao, Y.-M.; Zhang, L.-T.; Dong, N.; Yu, Y.; Sheng, Z.-Y. The effect of high-mobility group box 1 protein on activity of
regulatory T cells after thermal injury in rats. Shock 2009, 31, 322–329. [CrossRef]
22. Miller, A.C.; Rashid, R.M.; Elamin, E.M. The “T” in trauma: The helper T-cell response and the role of immunomodulation in
trauma and burn patients. J. Trauma Acute Care Surg. 2007, 63, 1407–1417. [CrossRef]
23. Percie du Sert, N.; Hurst, V.; Ahluwalia, A.; Alam, S.; Avey, M.T.; Baker, M.; Browne, W.J.; Clark, A.; Cuthill, I.C.; Dirnagl, U. The
ARRIVE guidelines 2.0: Updated guidelines for reporting animal research. J. Cereb. Blood Flow Metab. 2020, 40, 1769–1777.Cells 2021, 10, 1646 17 of 17
24. Darlington, D.N.; Gonzales, M.D.; Craig, T.; Dubick, M.A.; Cap, A.P.; Schwacha, M.G. Trauma-induced coagulopathy is associated
with a complex inflammatory response in the rat. Shock 2015, 44, 129–137. [CrossRef]
25. Schneider, C.P.; Schwacha, M.G.; Chaudry, I.H. The role of interleukin-10 in the regulation of the systemic inflammatory response
following trauma-hemorrhage. Biochim. Biophys. Acta BBA Mol. Basis Dis. 2004, 1689, 22–32. [CrossRef]
26. Novotny, A.R.; Reim, D.; Assfalg, V.; Altmayr, F.; Friess, H.M.; Emmanuel, K.; Holzmann, B. Mixed antagonist response and
sepsis severity-dependent dysbalance of pro-and anti-inflammatory responses at the onset of postoperative sepsis. Immunobiology
2012, 217, 616–621. [CrossRef]
27. Kobayashi, Y.; Kubo, A.; Iwano, M.; Sakaguchi, Y.; Samejima, K.; Kyoda, Y.; Yonemasu, K.; Hashimoto, T. Levels of MCP-1
and GM-CSF mRNA correlated with inflammatory cytokines mRNA levels in experimental autoimmune myocarditis in rats.
Autoimmunity 2002, 35, 97–104. [CrossRef]
28. Heizmann, O.; Koeller, M.; Muhr, G.; Oertli, D.; Schinkel, C. Th1-and Th2-type cytokines in plasma after major trauma. J. Trauma
Acute Care Surg. 2008, 65, 1374–1378. [CrossRef]
29. Zhao, G.-j.; Yao, Y.-m.; Lu, Z.-q.; Hong, G.-l.; Zhu, X.-m.; Wu, Y.; Wang, D.-w.; Dong, N.; Yu, Y.; Sheng, Z.-y. Up-regulation of
mitofusin-2 protects CD4+ T cells from HMGB1-mediated immune dysfunction partly through Ca2+ -NFAT signaling pathway.
Cytokine 2012, 59, 79–85. [CrossRef]
30. Wild, C.A.; Bergmann, C.; Fritz, G.; Schuler, P.; Hoffmann, T.K.; Lotfi, R.; Westendorf, A.; Brandau, S.; Lang, S. HMGB1 conveys
immunosuppressive characteristics on regulatory and conventional T cells. Int. Immunol. 2012, 24, 485–494. [CrossRef]
31. Parker, K.H.; Sinha, P.; Horn, L.A.; Clements, V.K.; Yang, H.; Li, J.; Tracey, K.J.; Ostrand-Rosenberg, S. HMGB1 enhances immune
suppression by facilitating the differentiation and suppressive activity of myeloid-derived suppressor cells. Cancer Res. 2014, 74,
5723–5733. [CrossRef] [PubMed]
32. Kerner, T.; Ahlers, O.; Spielmann, S.; Keh, D.; Bührer, C.; Gerlach, M.; Höfler, S.; Gerlach, H. L-selectin in trauma patients: A
marker for organ dysfunction and outcome? Eur. J. Clin. Investig. 1999, 29, 1077–1086. [CrossRef] [PubMed]
33. D’Alessio, F.R.; Kurzhagen, J.T.; Rabb, H. Reparative T lymphocytes in organ injury. J. Clin. Investig. 2019, 129, 2608–2618.
[CrossRef] [PubMed]
34. Zhang, Y.; Li, X.F.; Wu, W.; Chen, Y. Dynamic changes of circulating T-helper cell subsets following severe thoracic trauma. Int. J.
Clin. Exp. Med. 2015, 8, 21106. [PubMed]
35. Gupta, D.L.; Sinha, T.; Bhoi, S.; Rao, D. Cytokine Gene Polymorphism and Sepsis. In Infectious Process and Sepsis; IntechOpen:
London, UK, 2020.
36. Zedler, S.; Faist, E.; Ostermeier, B.; Donnersmarck, G.H.V.; Schildberg, F.-W. Postburn Constitutional Changes in T-cell Reactivity
Occur in CD8+ Rather than in CD4+ Cells. J. Trauma Acute Care Surg. 1997, 42, 872–881. [CrossRef]
37. Zedler, S.; Bone, R.C.; Baue, A.E.; von Donnersmarck, G.H.; Faist, E. T-cell reactivity and its predictive role in immunosuppression
after burns. Crit. Care Med. 1999, 27, 66–72. [CrossRef] [PubMed]
38. Binkowska, A.M.; Michalak, G.; Pilip, S.; Kopacz, M.; Słotwiński, R. The diagnostic value of early cytokine response in patients
after major trauma–preliminary report. Cent. Eur. J. Immunol. 2018, 43, 33. [CrossRef]
39. Wang, S.; Gao, X.; Shen, G.; Wang, W.; Li, J.; Zhao, J.; Wei, Y.-Q.; Edwards, C.K. Interleukin-10 deficiency impairs regulatory T
cell-derived neuropilin-1 functions and promotes Th1 and Th17 immunity. Sci. Rep. 2016, 6, 1–16.
40. Wood, J.J.; Rodrick, M.L.; O’Mahony, J.B.; Palder, S.B.; Saporoschetz, I.; D’Eon, P.; Mannick, J.A. Inadequate interleukin 2
production. A fundamental immunological deficiency in patients with major burns. Ann. Surg. 1984, 200, 311. [CrossRef]
41. Svoboda, P.; Kantorová, I.; Ochmann, J. Dynamics of interleukin 1, 2, and 6 and tumor necrosis factor alpha in multiple trauma
patients. J. Trauma 1994, 36, 336–340. [CrossRef]
42. Reinke, S.; Geissler, S.; Taylor, W.R.; Schmidt-Bleek, K.; Juelke, K.; Schwachmeyer, V.; Dahne, M.; Hartwig, T.; Akyüz, L.; Meisel,
C. Terminally differentiated CD8+ T cells negatively affect bone regeneration in humans. Sci. Transl. Med. 2013, 5, ra36–ra177.
[CrossRef]You can also read