Viral fibrotic scoring and drug screen based on MAPK activity uncovers EGFR as a key regulator of COVID 19 fibrosis
←
→
Page content transcription
If your browser does not render page correctly, please read the page content below
www.nature.com/scientificreports
OPEN Viral fibrotic scoring and drug
screen based on MAPK activity
uncovers EGFR as a key regulator
of COVID‑19 fibrosis
Elmira R. Vagapova1,3*, Timofey D. Lebedev1,2,3 & Vladimir S. Prassolov1,2
Understanding the molecular basis of fibrosis, the lethal complication of COVID-19, is urgent. By
the analysis of RNA-sequencing data of SARS-CoV-2-infected cells combined with data mining we
identified genes involved in COVID-19 progression. To characterize their implication in the fibrosis
development we established a correlation matrix based on the transcriptomic data of patients with
idiopathic pulmonary fibrosis. With this method, we have identified a cluster of genes responsible for
SARS-CoV-2-fibrosis including its entry receptor ACE2 and epidermal growth factor EGF. Then, we
developed Vi-Fi scoring—a novel drug repurposing approach and simultaneously quantified antiviral
and antifibrotic activities of the drugs based on their transcriptomic signatures. We revealed the
strong dual antifibrotic and antiviral activity of EGFR/ErbB inhibitors. Before the in vitro validation, we
have clustered 277 cell lines and revealed distinct COVID-19 transcriptomic signatures of the cells with
similar phenotypes that defines their suitability for COVID-19 research. By ERK activity monitoring in
living lung cells, we show that the drugs with predicted antifibrotic activity downregulate ERK in the
host lung cells. Overall, our study provides novel insights on SARS-CoV-2 dependence on EGFR/ERK
signaling and demonstrates the utility of EGFR/ErbB inhibitors for COVID-19 treatment.
Severe acute respiratory syndrome coronavirus 2 (SARS-CoV-2) is the cause of the ongoing coronavirus disease
(COVID-19) pandemic. Opposed to the majority of coronaviruses, SARS-CoV-2 replicates in the lower respira-
tory tract resulting in the development of pneumonia, which progresses into acute respiratory distress syndrome
(ARDS) with fatal destruction of the human organism in severe c ases1,2. The general step in ARDS development
is the elevation of plasma pro-inflammatory cytokines and rapid lung infiltration with immune cells3. In the
advanced stages of COVID-19 pulmonary fibrosis and cytokine release syndrome (CRS) is often p resent4. Vast
release of proinflammatory cytokines along with sepsis and massive multiorgan damage is the cause of at least
30% of fatal COVID-19 cases1. Molecular pathways that are responsible for the development of SARS-CoV-2
induced fibrosis, ARDS and CRS, are not yet understood. This gap in the knowledge limits the development
of novel therapies targeting the development of fibrosis or the repurposing of existing medicines that may be
effective against SARS-CoV-2 infection and virus-induced fibrosis.
It is known that viruses could interfere with pro-survival pathways of the host cell. Some viruses are known
to hijack ERK activity in host cells to regulate virus transcription5. MAPK/ERK pathway is tightly implemented
in cancer cell survival and therapy-resistance through the hyperactivation of cytokine s ignaling6. However, it is
not clear whether drugs targeting those pathways are beneficial for the treatment of viral infections or fibrosis.
Recent reports reveal that more than 50% of COVID-19 patients with lung, blood, and esophageal cancer are
highly suspected to develop critical symptoms of COVID-19 resulting in a high rate of ICU admission (more
than 20%) and high mortality rates compared to other c ancers7. Immunocompromised patients with several
diseases, such as hypertension, chronic obstructive disease (COPD), diabetes, and cardiovascular disease, are
more susceptible to the disease caused by SARS-CoV-2 and its associated c omplications8,9. Advanced stages of
COVID-19 progression resemble features observed in COPD, idiopathic pulmonary fibrosis (IPF), and lung
cancer. All mentioned diseases are tightly linked with the recruitment and suppression of immune cells along
with necroptosis or pyroptosis of lung c ells10 resulting in widespread organ inflammation and CRS, but still, the
1
Engelhardt Institute of Molecular Biology, Russian Academy of Sciences, Moscow 119991, Russia. 2Center for
Precision Genome Editing and Genetic Technologies for Biomedicine, Engelhardt Institute of Molecular Biology,
Russian Academy of Sciences, Moscow, Russia. 3These authors contributed equally: Elmira R. Vagapova and
Timofey D. Lebedev. *email: vr.elmira@gmail.com
Scientific Reports | (2021) 11:11234 | https://doi.org/10.1038/s41598-021-90701-w 1
Vol.:(0123456789)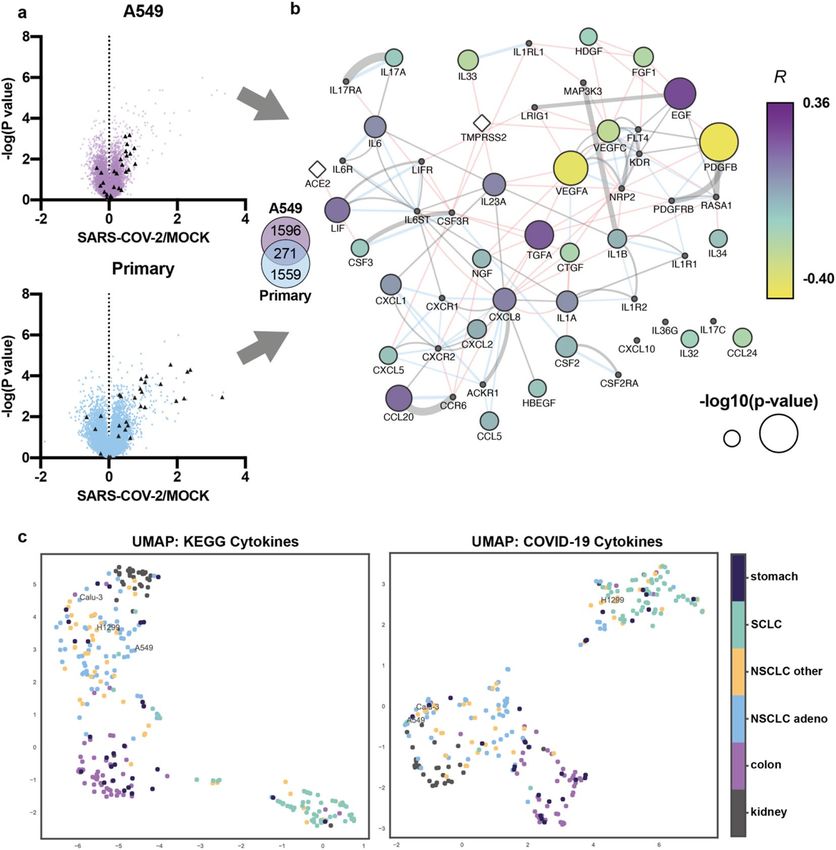
www.nature.com/scientificreports/
factors that trigger these processes in individuals are not completely understood. Possibly the heterogeneity in
cytokine-involved response could depend on the host cell transcriptomic predisposition, and the expression of
ACE2 and TMPRSS2 in lung tissues11.
So far, the anti-COVID-19 effective therapy is not developed, along with the absence of risk stratification for
cancer patients based on their ongoing treatment. Recently developed drug screening and repurposing strategies
aim at the revealing of virus or host targeting drugs have several limitations: they are either restricted to BSL3
laboratories or limited to in silico effectiveness q uantification12.
For the first time, we present our Vi-Fi algorithm for drug repurposing that quantifies both antiviral and
anti-inflammatory actions of any drug based on its transcriptomic signature. We combined it with our safe and
flexible lentiviral-based system for in vitro v erification13. As a result, we identified 19 drugs with promising dual
(antifibrotic and antiviral) potential, the majority of which are EGFR/ErbB inhibitors, and showed their efficacy
in vitro. We also, measured the ERK activity in single lung cells, and show that the drugs with the predicted
antifibrotic activity downregulate ERK in lung cells and thus ERK quantification can be used for drug screening.
We believe that our findings and novel approaches can be beneficial not only for the development of an effective
SARS-CoV-2 treatment strategy but also can be easily translated into other research areas.
Results
SARS‑CoV‑2 induced cytokine signature defines types of lung cancer cell lines. The implica-
tion of host growth factor signaling in SARS-CoV-2 infection of cells was recently described for the first time14.
Previously, it was shown that SARS-CoV-2 infection causes cytokine-coding genes overexpression in vitro15. To
reveal particular cytokines and growth factors implicated in the lung cells response to SARS-CoV-2 infection
we utilized recently published RNA-sequencing data of immortalized cancer human alveolar type II (A549) and
primary human bronchial epithelial (NHBE) cells infected with the virus (GEO ID: gse147507). We observed
1867 differentially expressed genes (DEGs) in A549 cells infected with the SARS-CoV-2 virus compared to
mock-treated cells and 1830—in NHBE cells (Fig. 1a, Supplementary Table S1). Notably, among 271 mutual
DEGs we found genes coding proinflammatory proteins CXCL8 and CSF2, their expression elevated in response
to SARS-CoV-2 infection.
We formed a network composed of genes coding cytokines and growth factors found among SARS-CoV-2
DEGs (cyto-DEGs) (Fig. 1b). In total, 31 cyto-DEGs were found either in A549 or NHBE cells in response to
SARS-CoV-2 infection. Using the Genemania algorithm in Cytoscape we created a network-based in protein
interactions (physical, genetic, or pathway) of cyto-DEGs with the addition of SARS-CoV-2 cellular receptors—
ACE2 and TMPRSS2. To reveal any existing interplay between cytokines and growth factors and ACE2 in lung
cells, we calculated the correlation between each input gene in the network and ACE2 expression in the 108
samples (GEO: GSE47460) from lungs of healthy donors (Supplementary Table S1)16. The highest statistically
significant correlation (R = 0.36) was between mRNA levels of epidermal growth factor EGF and ACE2. Also,
ACE2 correlated with genes coding EGFR ligand—TGFa, chemokines—CCL20, CXCL8, and LIF on mRNA level.
PDGFB and VEGFA had the highest value of negative correlation with ACE2. In the same way, we calculated the
correlation between proteins-network nodes and TMPRRS2 expression (Supplementary Table S1). Supposedly,
ACE2 is directly connected with the existence of inflammatory-primed phenotype in lung cells connected with
elevated EGF, FGF1, TGFa, CXCL8, CCL2, and LIF expression.
The response of stable cell lines to SARS-CoV-2 infection in vitro highly depends on the selection criteria,
which makes the study of COVID-19 complications such as CRS and drug discovery in vitro is challenging. To
solve this issue, we decided to compose a panel of cytokine coding genes that could be involved in COVID-19
severity (COVID-19 cytokines). In this panel we included SARS-CoV-2 cyto-DEGs, the genes coding cytokines
that are elevated in humans with severe COVID-19 obtained by manual data collection from published studies
and SARS-CoV-2 receptors ACE2 and TMPRSS2—in total 55 genes (Supplementary Table S2)3,17–24.
We aimed at understanding how the widely used in COVID-19 research cell lines derived from lung, stom-
ach, kidney, and colon tissues differ based on the basal transcriptomic activity of particular genes. We per-
formed UMAP25 analysis of 277 cancer cell lines of different origin26 and called it CellMAP using 2 gene sets:
cytokine–cytokine receptor interaction pathway (KEGG) and COVID-19 cytokines (Supplementary Table S2).
Here we provide evidence that lung cancer cell lines A549 and Calu-3 widely used in COVID-19 research have
similar cytokine signatures and COVID-19 transcriptomic landscapes while H1299 cell line is distinct from
them (Fig. 1c).
Transcriptomic signature dictates the type of response to the drug. The development of fibrosis
is not a unique feature of SARS-CoV-2, SARS-CoV, and MERS-CoV infection. In some patients suffering from
IPF, the presence of viruses EBV, CMV, HHV-7, and HCV determines the severity of the disease27,28. However,
it is still not clear whether viruses directly trigger the formation of fibrosis themselves or act as the co-factors in
the preconditions required for the development of the disease by the secondary factors. Molecular predisposi-
tions, for example, based on the basal level of cytokine expression, could increase susceptibility of individuals to
fibrosis and respiratory failure irrespective of the initiating factors29,30.
We calculated the pairwise correlations for gene expression of COVID-19 cytokines (Supplementary Table S2)
in the panel of 160 IPF samples from GSE47460 d ataset16 (49 genes were present in the dataset). To investigate the
implementation of particular cytokines or their groups we performed the clusterization based on the correlation
score and in the bootstrap analysis, we revealed 3 main clusters with 5–24 members (Fig. 2a and Supplementary
Fig. S1a). We applied the same analysis saving the order of genes for normal lung tissue (108 samples) and lung
cancer (489) (GSE3141, GSE19804, GSE2109, GSE18842, GSE33532, GSE19188, GSE43580). We observed a
Scientific Reports | (2021) 11:11234 | https://doi.org/10.1038/s41598-021-90701-w 2
Vol:.(1234567890)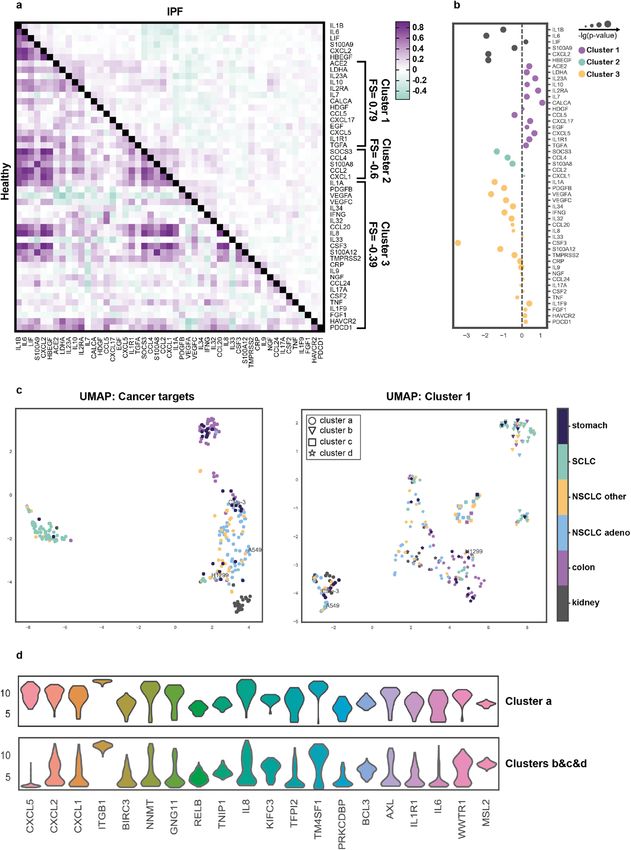
www.nature.com/scientificreports/
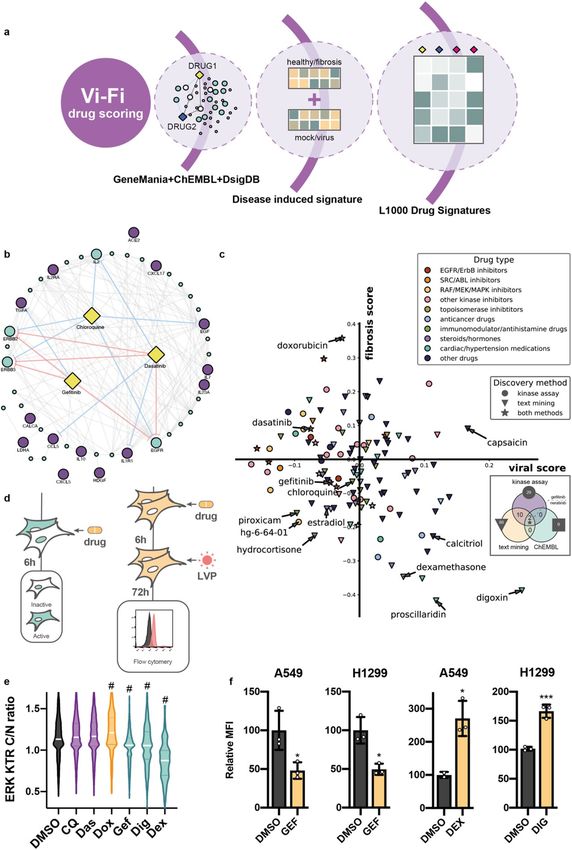
Figure 1. SARS-CoV-2 infection causes changes in the expression of cytokine and growth factors-coding genes
that are differently connected with ACE2. (a) Volcano plots showing the difference between the expression of
genes in A549 and primary lung cells infected with SARS-CoV-2 compared to mock-treated control and the
− log(P-value). Each triangle represents a gene. Cyto-DEGs are colored in dark grey. Venn diagram illustrates
number of unique A549 and NHBE (primary) DEGs and their intersection (271) (b) The network of proteins
comprised of cytokine- and growth factors (nodes) created via GeneMania. Black nodes—genes that are
added by GeneMania or are absent from GEO: GSE47460 (CXCL10, IL36G, IL17c). Color indicates Spearmen
correlation coefficient R between each gene and ACE2 in 108 normal lung samples (purple—max correlation
value, R = 0.36, yellow—max anticorrelation value, R = 0.40), size—− log10 p-value of the calculated correlations.
Connections show pathways (grey), genetic interaction (red), and physical interaction (blue). (c) UMAP analysis
of 65 non-small cell lung cancer (NSCLC) adenocarcinoma, 44 NSCLC of other origins, 59 small cell lung
cancer (SCLC), 31 kidney cancer, 50 colon cancer, and 28 stomach cancer cell lines from Sanger dataset. UMAP
was performed using cytokine-cytokine receptor interaction pathway (KEGG) and COVID-19 cytokines gene
sets.
high number of correlating genes in normal lung samples, which lowered in IPF and lung cancer patient samples
(Fig. 2a and Supplementary Fig. S1b, Supplementary Table S3).
Next, to estimate the involvement of gene groups in the fibrosis we calculated the fibrotic score (FS) of each
cluster. Briefly, we calculated the difference between the number of genes that have significantly higher and lower
expression in IPF samples compared to normal lung and divided this value by a total number of genes in a cluster.
Among others, cluster 1 is represented by 14 genes—ACE2, LDHA, IL23A, IL2RA, IL10, IL7, CALCA, HDGF,
CCL5, CXCL17, EGF, CXCL5, IL1R1, and TGFA possessed the highest FS = 0.79 (Fig. 2a). Notably, both ligands
of EGFR were within this cluster 1 supporting the evidence of implementation of EGFR signaling in fibrosis
development. All genes presented in cluster 1 except for CCL5 and HDGF were elevated in IPF patients com-
pared to healthy individuals (Fig. 2b). Interestingly, ACE2 was placed in Cluster 1, while TMPRSS2 in Cluster 3.
Scientific Reports | (2021) 11:11234 | https://doi.org/10.1038/s41598-021-90701-w 3
Vol.:(0123456789)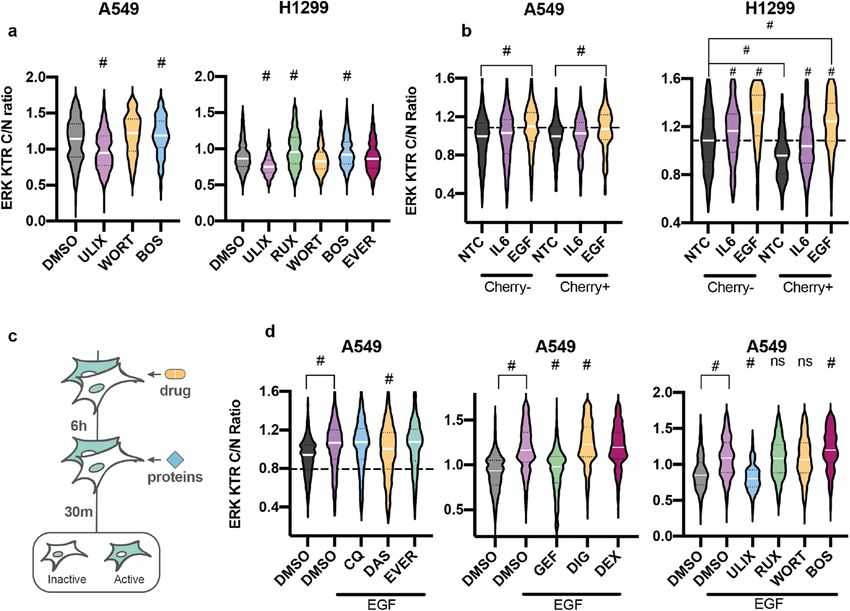
www.nature.com/scientificreports/

                                            Figure 2.  Fibrosis scoring of SARS-CoV-2 associated cytokines. (a) Correlation matrixes of 49 SARS-
                                            CoV-2 associated cytokine coding genes expression in the healthy lung (lower-left half) and IPF (upper-right
                                            half) samples. Pearson correlation coefficient was calculated for each gene pair and genes were clustered by
                                            Ward’s method and then bootstrapped. Fibrosis scores (FS) are indicated for each cluster. (b) The difference
                                            in expression of genes in healthy lung samples and IPF. (c) UMAP analysis of 65 non-small cell lung cancer
                                            (NSCLC) adenocarcinoma, 44 NSCLC of other origins, 59 small cell lung cancer (SCLC), 31 kidney cancer, 50
                                            colon cancer, and 28 stomach cancer cell lines from Sanger dataset. UMAP was performed using cancer-related
                                            drug targets (Cancer targets) gene set and 14 genes from Cluster 1. Cells were then clustered (clusters a–d)
                                            using HDBSCAN algorithms due to their proximity after UMAP analysis by Cluster 1 genes. (d) Differentially
                                            expressed genes for Cluster a and Clusters b & c & d.

          Scientific Reports |   (2021) 11:11234 |              https://doi.org/10.1038/s41598-021-90701-w                                                 4

Vol:.(1234567890)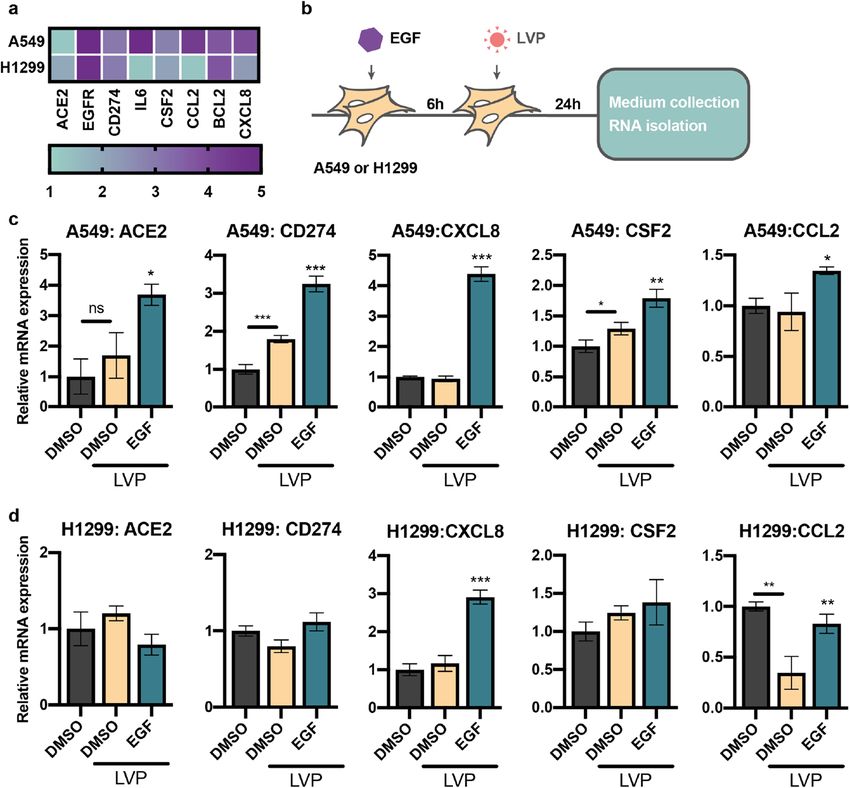
www.nature.com/scientificreports/
We decided to perform additional UMAP a nalysis25 of 277 cancer cell l ines26 using cancer-related drug targets
(COSMIC Cancer Gene Sensus and Drug–Gene Interaction database, Supplementary Table S2) and Cluster 1
cytokines. Additionally, we asked whether the genes included in Cluster 1 better differentiate cancer cell lines
based on the transcriptomic landscape. Here we provide evidence that A549 and H1299 are likely to have similar
cancer-related signatures, but different COVID-19 related profibrotic transcriptomic landscape (Fig. 2c). Calu-3
and A549 cells were found in Cluster a, which is defined by the differential expression of genes coding profibrotic
and proinflammatory cytokines (Fig. 2d, Supplementary Table S4). Further, we ran UMAP algorithm on 7
datasets covering 489 cancer and 363 healthy lung samples. With the input of Cluster 1 cytokines, we revealed a
distinct cluster of lung cancer samples with the reduced expression of EGFR and CD274 (Supplementary Fig. S1c,
Supplementary Table S4). Thus, our findings suggest that transcriptomic predisposition could dictate the proviral
or proinflammatory response of the cell lines and potentially lung cancer patients. Performing such analysis could
be beneficial in selecting suitable models for the particular analysis based on the experiment design and for the
prediction of lung cancer patients response to SARS-CoV-2 infection.
Viral fibrotic scoring predict antiviral and antifibrotic action of the EGFR/ErbB inhibitors. We
believe that predicting viral- and fibrotic-related effects of the drug could be beneficial in drug-repurposing.
Thus, we developed Vi-Fi (Viral Fibrotic) scoring algorithm of the drugs based on their L1000 signatures (http://
amp.pharm.mssm.edu/l1000fwd/#) and their potential to reverse viral- and fibrosis-induced changes in gene
expression (Fig. 3a)31. First, we addressed the issue of whether the cluster with the highest FS could be targeted
by any drug with a known mechanism of action. Taking into account that drug action could be indirect, we uti-
lized the GeneMania approach to expand our panel by the addition of proteins known to physically and geneti-
cally interact with cluster elements (Fig. 3b, Supplementary Table S4).
Then we selected drugs that can target any of the 45 proteins identified by GeneMania, by screening drugs
and their targets from ChEMBL (https://www.ebi.ac.uk/chembl/) and DSigDB (http://dsigdb.tanlab.org/DSigD
Bv1.0/) databases (Supplementary Table S5). We found 109 drugs with described mechanisms in the ChEMBL
database, 149 approved drugs, and tested kinase inhibitors from DSigDB, and 445 drugs with possible inhibitory
effects based on text mining data from DSigDB collection of computational drug signatures (Supplementary
Table S5). 4 compounds that were identified in the analysis of all three databases were EGFR/ErbB inhibitors. To
differentiate which of these drugs could exhibit antiviral and antifibrotic action we extracted drug-induced gene
expression signatures for A549 cells from the L1000 dataset and performed Vi-Fi scoring. Briefly, to calculate
scores for each drug we compared its signature with genes upregulated and downregulated genes during IPF (for
fibrotic score) or SARS-CoV-2 infection (for viral score). Negative score values represent antiviral or antifibrotic
action, while positive scores represent proviral or profibrotic effects. A detailed description is provided in the
Methods section.
In total, 121 identified drugs were present in the L1000 dataset, and 99 of them had either antiviral or anti-
fibrotic scores (Fig. 3c, Supplementary Table S6). Most EGFR, SRC (including dasatinib), RAF (such as BRAF
inhibitor HG-6-64-01), and MEK inhibitors displayed antiviral effects, while the majority of hormones, steroid
hormones, immunomodulators and various drugs used to treat hypertension or heart conditions showed distinct
antifibrotic scores. 34 drugs had both predicted antiviral and antifibrotic effect and 25 of these drugs had either
EGFR or ERBB2/3 as one of their reported targets (Supplementary Table S6). Among FDA-approved drugs
EGFR inhibitor gefitinib, nonsteroidal anti-inflammatory drug piroxicam, alkylating anticancer drug thiotepa,
female hormone estradiol and steroid hormone hydrocortisone had the most prominent antiviral and antifibrotic
scores. Interestingly, piroxicam, estradiol, and thiotepa had reported activity against EGFR or ERBB2. Several
cardiac glycosides such as digoxin and proscillaridin while have been predicted by us and reported antifibrotic
activity32 displayed high proviral scores. We also found that the widely used anticancer drug doxorubicin had the
highest predicted profibrotic score, indicating the need for its safety evaluation for use in the treatment of cancer
patients with COVID-19. Only, two drugs were revealed by the analysis of all three datasets (kinase assay, text
mining and ChEMBL)—gefitinib and neratinib, both of them target EGFR. Our analysis revealed chloroquine,
but its antiviral and antifibrotic scores were relatively low, which is consistent with recent reports33. Notably,
chloroquine was identified exclusively by text mining. To expand our analysis, we used Vi-Fi scoring to predict
the combined effect of each drug pair (7260 combinations) from 121 drugs identified earlier (Supplementary
Table S6). For this, we combined drug-induced gene expression signatures and calculated Vi-Fi scores. We
revealed several drugs, which when are used in combination with other drugs results in the majority of combina-
tions having both antiviral and antifibrotic scores (Supplementary Fig. S2a and Supplementary Table S6). Top 10
such drugs include HSP90 inhibitor geldanamycin, IGF-1 and insulin receptor inhibitor BSM-536924, antibiotic
thiostrepton, ALK inhibitor NVP-TAE684, two RAF inhibitors (hg-6-64-01 and AZ-628), two PI3K inhibitors
(wortmannin and GDC-0941), anticancer drugs gemcitabine and gefitinib (Supplementary Fig. S2a). Next, we
compared the results of our Vi-Fi scoring algorithm with commonly used for drug discovery and repurposing
CMap algorithm34 (Supplementary Table S6). CMap also predicted antiviral activity of SRC inhibitors bosutinib
and saracatinib, but in general, CMap showed less consistent results than Vi-Fi scoring for the antiviral effect
of EGFR and ERBB2/3 inhibitors, as well as for antifibrotic action of anti-inflammatory and anti-histamine
drugs (Supplementary Fig. S2b). CMap analysis predicted the absence of proviral activity of digoxin, although
it predicted its antifibrotic activity.
To get an experimental evaluation of the Vi-Fi algorithm we used previously developed in our laboratory sys-
tem based on the transfer of gene coding fluorescent protein into a host cell by the lentiviral vector particles13. We
selected two lung cancer cell lines with similar cancer phenotypes and different COVID-19 related transcriptomic
signatures based on our CellMAP analysis. Considering the vital role of the MAPK/ERK pathway in controlling
processes in host cells including cytokine s ignaling35 we decided to study its implication in the response of lung
Scientific Reports | (2021) 11:11234 | https://doi.org/10.1038/s41598-021-90701-w 5
Vol.:(0123456789)www.nature.com/scientificreports/
Figure 3. Vi-Fi drug repurposing and Vi-Fi evaluation in vitro. (a) Scheme of the method. (b) GeneMania network of potential drug
targets relative to our panel of 14 SARS-CoV-2 profibrotic genes (violet nodes) and 32 additional genes predicted by GeneMania
(blue nodes). A full list of genes is provided in Supplementary Table S4. The predicted interaction of gefitinib (GEF), dasatinib (DAS),
and chloroquine (CQ) with proteins in the network. Red lines indicate direct inhibition determined by kinase activity assays and the
blue lines—predicted inhibitory (text mining). (c) Scatter plot with predicted effects of drugs on SARS-CoV-2 infection (viral score)
and fibrosis development (fibrotic score). Types of drugs are marked by colors concerning their medical usage, the primary target, or
general mechanisms of action. Circles—drugs with proven inhibitory activity against at least one protein in the network (ChEMBL or
DSigDB), diamonds—text mining (DSigDB), and stars—both methods. Venn diagram represents number of drugs available at L1000
revealed by each method. (d) Schemes of the experiments. (e) Violin plots of ERK activity in A549 ERK-KTR cells. Cells were treated
with 5 µM CQ, 25 nM DAS, 25 nM doxorubicin (DOX), 5 µM GEF, 25 nM digoxin (DIG) and 10 µM dexamethasone (DEX) for 6 h.
(g) Relative MFI of cells treated with 5 µM GEF, 10 µM DEX, and 25 nM digoxin (DIG). P-value is calculated relative to DMSO-
treated sample. (f) Relative MFI of cells treated with GEF, DEX, and DIG. Error bars represent standard deviation from 3 independent
biological replicates. LVP lentiviral particles. p-value for e was calculated by Mann–Whitney test, #p-value < 0.001. p-value for (f) was
determined by unpaired t-test, *p-value < 0.1, ***p-value < 0.001.
Scientific Reports | (2021) 11:11234 | https://doi.org/10.1038/s41598-021-90701-w 6
Vol:.(1234567890)www.nature.com/scientificreports/
cells to drugs with different viral and fibrotic activity. We utilized a kinase translocation reporter (ERK-KTR) to
track the ERK activity in H1299 and A549 cells at the single-cell level. Briefly, EKR-KTR allows quantification
of ERK activity in a single cell based on fluorescent reporter translocation between nucleus and cytoplasm36.
For this, H1299-KTR and A549-KTR cells were with non-toxic concentrations of 5 drugs with different fibrotic
potential—EGFR inhibitor gefitinib, heart glycoside digoxin, corticosteroid dexamethasone, anticancer antibiotic
doxorubicin, and SRC inhibitor dasatinib as shown in Fig. 3d. Gefitinib, digoxin, and dexamethasone inhibited
ERK activity while doxorubicin activated it in A549 cells (Fig. 3e). Dexamethasone also inhibited ERK in H1299
cells (Supplementary Fig. S3a,d). Thus, our findings show that the drugs with ERK inhibitory activity possess an
antifibrotic potential and ERK monitoring could be beneficial to predict the potential to prevent fibrosis. As the
utilization of the Vi-Fi scoring predicted the antiviral potential of EGFR/ERbB inhibitors including gefitinib,
chloroquine, and dasatinib, along with a high proviral capacity of dexamethasone and digoxin, we pretreated
A549 and H1299 cells with these agents before the addition of LVP as shown on Fig. 3e. Gefitinib, chloroquine,
and dasatinib significantly reduced the efficacy of lentiviral transduction of A549 and H1299 cells while digoxin
and dexamethasone elevated the transduction rate of the cells (Fig. 3f, Supplementary Fig. S3b,c).
Antifibrotic drugs change the response of lung cells to EGF. As Vi-Fi scoring predicted strong dual
antifibrotic and antiviral potential of EGFR inhibitors and we showed the ability of gefitinib to downregulate
ERK activity along with the reduction of lentiviral transduction efficacy in lung cells pretreated with this drug
we decided to understand how EGFR downstream signaling is implicated in this process.
By utilization of ERK-KTR reporter and the lentiviral vector-based system, we measured the antiviral and
antifibrotic potential of the drugs known to inhibit EGFR downstream kinases: mTORC1, JAK2, SRC and
MAPK1/2—everolimus, ruxolitinib, bosutinib and ulixertinib (Fig. 4d and Supplementary Fig. S4a). Ulixertinib
blocked ERK activity and ruxolitinib activated it in both A549 and H1299 cells (Fig. 4a). Bosutinib stimulated
ERK activity in H1299 cells but not in A549 (Fig. 4a).
We also measured the impact of IL6 and EGF stimulation on transduced and non-transduced cells. EGF acti-
vated ERK in both A549 and H1299 cell lines and the action was more prominent on the transduced population
of H1299 cells (Fig. 4b). IL6 stimulated ERK activity only in H1299 cells. We also detected that ERK activity was
decreased in transduced H1299 and A549 cells compared to non-treated cells, and there was a bystander decrease
of ERK activity in non-transduced A549 cells. Next, we decided to understand whether any of the tested drugs
reverse EGF-mediated ERK activity. For that we pretreated A549 and dasatinib, gefitinib and ulixertinib blocked
EGF-driven ERK activation in A549 cells (Fig. 4c,d and Supplementary Fig. S4b).
Next, we measured the ability of cellular kinase targeting drugs (everolimus, ruxolitinib, ulixertinib) to affect
the transduction rate of A549 and H1299 cells. Everolimus significantly reduced the transduction rate of both
cells, ruxolitinib stimulated it only in H1299 cell line and ulixertinib had no impact on the transduction efficacy
(Supplementary Fig. S4c). However, no significant changes in the transduction rate of A549 or H1299 cells were
detected with the addition of EGF (Supplementary Fig. S4d). Next, we treated the cells with EGF along with the
addition of drugs with promising antiviral action: chloroquine, dasatinib, and everolimus to test the possibility
of EGF to modulate the drug response. Our data demonstrate that the addition of EGF results in a dramatic
increase of mean fluorescent intensity of the A549 cells treated with dasatinib or everolimus and H1299 treated
with chloroquine (Supplementary Fig. S4d). Our results thus confirm that EGF indeed is involved in the infection
processes of the lung cells and EGFR signaling is a potential drug target in COVID-19 treatment.
EGF induces ACE2 expression and proinflammatory change in lung cells. First, we measured the
mRNA levels of ACE2 and TMPRSS2, EGFR—EGF receptor, IL6, CXCL8 and CCL2—proinflammatory cytokines
and chemokines, BCL2—apoptosis regulator, and CD274—programmed cell death ligand in A549 and H1299
cells. We decided to measure CD274 as the exhaustion of CD8 + T cells with the elevation of PD-1 (programmed
cell death protein 1, also known as CD279) expression is present in severe COVID-19 patients37,38. In these cells
we detected comparable levels of ACE2, EGFR, CD274, BCL2, CSF1, and CSF2 mRNA expression, but the levels
of IL6, CXCL8, and CCL2 were significantly higher in A549 cells, suggesting the existence of the inflammation-
primed transcriptomic activity in this cell line (Fig. 5a). These results are consistent with the results of UMAP
analysis which showed distinct COVID-19 related transcriptomic signatures of A549 and H1299 cells (Fig. 2c).
Also, we detected a very low expression level of TMPRSS2 mRNA in both cell lines.
As a next step towards understanding the mechanisms of EGFR-signaling implementation in the COVID-
19-related severity, we stimulated A549 and H1299 cells with the recombinant EGF before the addition of lentivi-
ral particles (Fig. 5b). The lentiviral transduction of A549 cells led to the elevation of the CD274 and CSF2 mRNA
expression, also ACE2 expression had an upcoming trend (Fig. 5c,d). We also found that CD274 expression was
elevated in A549 cells treated with SARS-CoV-2 virus compared to mock-treated cells (Supplementary Table S1)
and in virus infected lung cells of COVID-19 p atients39. We found strong elevation of the expression of the genes
coding ACE2, CD274, CXCL8, CCL2 and CSF2 in the A549 cells that was not detected in H1299 cells. Notably,
only CXCL8 up-regulation was common for both cell lines.
Bronchoalveolar fluid (BALF) from patients with severe COVID-19 was shown to be enriched in chemokines
that are responsible for the attracting of inflammatory monocytes40. Therefore, we investigated the response of
human model macrophages derived from THP-1 cell line to the conditioned culture medium harvested from
pretreated A549 and H1299 cell lines (Supplementary Fig. S5a). The conditioned culture medium of the cells
transduced with lentiviral particles induce the expression of CXCL8 in macrophages (Supplementary Fig. S5b,c).
Chemokine CXCL8 is crucial for the attraction of macrophages and neutrophils into the inflamed organs, includ-
ing lung. At the same time CSF2 and IL6 mRNA expression had an uprising trend in macrophages treated with
H1299 conditioned medium.
Scientific Reports | (2021) 11:11234 | https://doi.org/10.1038/s41598-021-90701-w 7
Vol.:(0123456789)www.nature.com/scientificreports/
Figure 4. Drugs and proteins change the transduction efficacy of lung cells and the ERK activity. (a) Violin
plots of ERK activity in A549 and H1299 cells measured with ERK-KTR. A549 cells were treated with 50 nM
ulixertinib (ULIX), 10 µM wortmannin (WORT), 1 µM bosutinib (BOS) for 6 h. H1299 cells were treated with
50 nM ulixertinib (ULIX), 10 µM ruxolitinib (RUX), 10 µM wortmannin (WORT), 1 µM bosutinib (BOS), and
100 nM everolimus (EVER) for 6 h. p-value is calculated relative to DMSO-treated sample. (b) Violin plots of
ERK activity in A549 and H1299 cells with ERK-KTR. Cells were incubated with lentiviral particles for 72 h
and proteins were added to serum negative media 30 min before the fluorescence detection. (c) Scheme of the
experiment: A549 and H1299 cells with ERK-KTR were treated with the drugs and proteins for 6 h in serum
negative media before the addition of 100 ng/mL EGF for 30 min before fluorescence detection. (d) Violin plots
of normalized ERK activity in A549 cells measured with ERK-KTR. Cells treated with drugs were compared
to cells treated only with EGF by Mann–Whitney test. Drugs and proteins concentrations: 5 µM chloroquine,
25 nM dasatinib, 100 nM everolimus, 5 µM gefitinib (GEF), 25 nM digoxin (DIG), 10 µM dexamethasone
(DEX), 50 nM ulixertinib (ULIX), 2.5 µM ruxolitinib (RUX), 10 µM wortmannin (WORT), 1 µM bosutinib
(BOS), 100 ng/mL IL6 and EGF. p-value is calculated relative to DMSO + EGF treated sample unless it is marked
otherwise. LVP lentiviral particles. p-value for (a–d) was calculated by Mann–Whitney test, #p-value < 0.001.
Discussion
Within the present study, we have focused on the host cell inflammatory response to the SARS-CoV-2 infection.
We suggested that not only immune cells, but the host lung cells themselves, are involved in the development
of fibrosis and CRS. We aimed at the characterization of molecular mechanisms defining severity of COVID-19
to reveal novel drug targets involved in fibrosis and viral infection. In general, the current work shed light on
the implementation of growth factor signaling in the COVID-19 related fibrosis. With a combination of the
computational and molecular biological approaches we developed a novel strategy for drug repurposing and
validated it in vitro.
We developed the drug repurposing approach that overcomes the limitations of the recently proposed
methods to predict effective anti-SARS-CoV-2 drugs12. These computational methods are either based on drug
interaction with virus-associated protein networks or on drug-induced transcriptomic signatures, and mostly
focus only on antiviral properties of the compound. We developed Vi-Fi scoring based on the protein network
associated with both SARS-CoV-2 infection and pulmonary fibrosis followed by the quantifying drug antiviral
and antifibrosis scores based on their transcriptomic signatures. This allowed us to narrow down drugs with
high probability of dual antiviral and antifibrotic effect. The ability to predict drug combinations makes Vi-Fi
scoring even more powerful. Development of the combinational therapeutic approaches are of the particular
interest for SARS-CoV-2 treatment as well as in the field of anticancer drug discovery, as the monotherapy often
is a source of drug resistance. Even the development of high-throughput platforms for drug screening have not
significantly simplified the combinational drug discovery because of the innumerable possible drug combina-
tions. We demonstrate that Vi-Fi scoring could be easily modified to predict drug combinations. Thus, our
Vi-Fi scoring algorithm is a flexible tool and possesses a great potential to reveal drugs and their combinations
Scientific Reports | (2021) 11:11234 | https://doi.org/10.1038/s41598-021-90701-w 8
Vol:.(1234567890)www.nature.com/scientificreports/
Figure 5. EGF activates proinflammatory signature in A549 cells. (a) Heatmap representing relative to GAPDH
mRNA expression level of genes in nontreated A549 and H1299 cells. (b) Scheme of the experiment: A549 and
H1299 cells were treated with EGF (100 ng/mL) for 6 h followed by the addition of lentiviral particles (LVP).
The medium was collected and RNA was isolated 24 h later. Relative mRNA level of ACE2, CD274, CXCL8,
CSF2, and CCL2 genes in A549 (c) and H1299 (d) cells treated with EGF (100 ng/mL).
that target multiple pathological processes in any disease. With the Vi-Fi approach we revealed that anticancer
drugs such as EGFR/ErbB inhibitors possess antiviral and antifibrotic potential. This finding was promising as
the issue of chemotherapy adaptation during the COVID-19 pandemic is unsolved. Receptor tyrosine kinase
inhibitors such as gefitinib effectiveness in our experiments is also consort with the lung cancer data as patients
with EGFR inhibitors administration had lower COVID-19 severity r ate41. Interestingly, among steroid hormones
dexamethasone showed highest antifibrotic score, which explains success of it use for treatment of severe COVID-
19 cases, despite dexamethasone having moderate proviral score and proviral action on LVP transduction of
lung cancer cells. Although our analysis has identified chloroquine as a drug with antiviral and antifibrotic drug,
its connection with COVID-19 associated proteins in lung cells was revealed only by text mining compared to
EGFR/ErbB inhibitors, that were present in all three databases and had higher antiviral scores than chloroquine.
For the first time, we apply single cell monitoring of ERK activity for the in vitro study of proinflammatory
response of lung cells. ERK activity correlated with the profibrotic action of the tested drug suggesting that
monitoring of ERK activity in lung cells can be beneficial to measure drug potential to block proinflammatory
and profibrotic cytokines. Our results suggest that antifibrotic and anti-inflammatory effect of drugs is realized
not only through affecting immune cells but also by inhibition of autocrine signaling in lung cells. Also, we
provided an experimental and computationally expanded findings regarding the significance of transcriptomic
landscape of the cell line in the development of the response. We developed an algorithm based on the machine
learning to predict the similarity of cell lines. The question of model selection for in vitro studies is urgent and
is not limited to COVID-19 research.
A common observation in each of our analysis is the implementation of EGF/EGFR signaling in the SARS-
CoV-2 infection and proinflammatory priming of the host cells. Notably, EGFR was recently described as SARS-
CoV-2 receptor, that supports our findings, even though these findings were independent and obtained by
Scientific Reports | (2021) 11:11234 | https://doi.org/10.1038/s41598-021-90701-w 9
Vol.:(0123456789)www.nature.com/scientificreports/
the study of different processes during COVID-19 infection42. Although SARS-CoV-2 associated genes such
as CCL2 and ACE2 are known to be IFN-inducible43, it is likely that EGF serves a trigger of proinflammatory
response in lung cells and even substitutes IFNγ. We showed that EGF induces the expression of CXCL8, CSF2,
CCL2, ACE2, and CD274 in lung cells. Notably, it was shown that recombinant IFN failed to induce a detect-
able level of ACE2 expression in A549 cells and the fact has been interpreted as unsuitably of transformed lung
cells to be a model for SARS-CoV-2 infection studies in vitro44. We explain that by the absence of EGF, which
plays a substantial role in the supporting SARS-CoV-2 infection and the development of the fibrosis and CRS.
Also, EGF is likely implemented in the immune cells attraction to the damaged lung in the severe COVID-19
patients. Among EGF-inducible genes CSF2 is associated with tissue damaging by the attraction of proinflam-
matory macrophages and also could be produced by epithelium airways cells in response to a llergens45. CSF2
is known to be implicated in the attraction of proinflammatory M1 macrophages. Also, upregulation of CD274
expression could be a mechanism underlying the protection of virus-infected cells from being eliminated by
cytotoxic CD8 + T cells or driving T cells exhaustion by PD-1/PD-L1 interaction. EGFR signaling implication
in SARS infection was earlier the object of potent interest, and the role of different EGFR ligands was discussed
in the context of fibrosis reduction after the infection with the previously described respiratory viruses and the
inhibition of growth factor signaling was recently described as a promising strategy to prevent SARS-CoV-2
infection14,46. Concomitant with our results it was previously reported that both EGF and IFNγ induce CD274
expression in lung adenocarcinoma cells and act through the MAPK cascade, and imbalanced PD-1/PD-L1
interaction is observed during viral infections47,48.
Altogether, we provide evidence that EGF and EGF-inducible genes are involved in fibrosis and inflamma-
tion, that could be prevented by targeting EGFR/MAPK pathway by EGFR/ErbB inhibitors such as gefitinib and
dasatinib and we anticipate that Vi-Fi scoring will be a valuable tool that can be rapidly adopted by those who
study drug responses.
However, this study has several limitations. Development of novel therapy is a very complex multistage
process; our study covers the initial steps of the identification of the potential and antiviral drugs—computa-
tional drug scoring (Vi-Fi) and in vitro validation. We believe that our data will encourage further experimental
validation of identified drugs including EGFR/ErbB inhibitors in animal models. Also, our scoring approach
covers drugs with potential antifibrotic and antiviral activity, what makes it a powerful tool for drug repurposing
that can be applied to other diseases. Another limitation is that SARS-CoV-2-induced inflammatory long-term
response that triggers multiple organs cannot be fully modeled in short-term in vitro experiments. By the utiliza-
tion of ERK activity reporter and cell lines of two origins (lung and hematopoietic) we were able to register the
response similar to initiating events of the ongoing cytokine storm and viral infection that arises in host cells.
Material and methods
Cell culture and drugs. Human lung cancer cells H
129949 and A549 (DSMZ ACC 107; Deutsche Sammlung
von Mikroorganismen und Zellkulturen GmbH, Braunschweig, Germany) and embryonic kidney cells HEK-
293T were cultured at 37 °C and 5% CO2 in DMEM growth medium supplemented with 10% fetal bovine
serum (FBS). THP-1 (ATCC TIB-202) cells were cultures in RPMI-1640 growth medium supplemented with
10% FBS. All growth media were also supplemented with 2 mM l-glutamine, 100 units/mL penicillin, 100 μg/
mL streptomycin, and 1 mM sodium pyruvate. A549 and H1299 cell lines were gifted by Prof. Dr. Thomas Dob-
ner, Heinrich-Pette Institute at the Leibniz Institute for Experimental Virology. HEK-293T cell line was a gift
from Prof. Dr. Boris Fehse, UKE. THP-1 cell line was gifted Dr. Nikita Nikiforov from Institute of Experimen-
tal Cardiology, National Medical Research Center of Cardiology. RPMI-1640, DMEM, penicillin/streptomycin,
sodium pyruvate, and l-glutamine were purchased from Gibco (ThermoFisher Scientific, USA). THP-1 cell were
differentiated by incubation with 100 ng/mL phorbol 12-myristate 13-acetate (PMA) (P1585, Sigma Aldrich)
for 24 h50. All cell lines were routinely checked for mycoplasma contamination by Hoechst or DAPI staining.
None of the cell lines used in the study belongs to the list of misidentified cell lines. Drugs used in the cur-
rent study bosutinib (PZ0192, Sigma Aldrich), chloroquine (C6628, Sigma Aldrich), dasatinib (11498, Cayman
Chemical Company), everolimus (S1120, Selleckchem), gefitinib (SML1657, Sigma Aldrich), ulixertinib (S7854,
Selleckhem), digoxin (2266, Cayman Chemical Company), dexamethasone (D4902, Sigma Aldrich), ruxolitinib
(S1378, Selleckchem), wortmannin (S2758, Selleckchem).
Differential expression analysis and correlation. Multiple t-tests with false discovery rate (FDR) cor-
rection for genes in SARS-CoV-2 infected A549 and NHBE cells were performed in GraphPad Prism 8 soft-
ware. Transcriptomic data of A549 (6 samples) and NHBE (6 samples) cells was analyzed separately. Genes with
P-value < 0.01 were considered as differentially expressed. Differential expression analysis of markers for clusters
identified by UMAP was performed in Python using Mann–Whitney t-tests and FDR correction. Spearmen
coefficient of correlation between genes was calculated in GraphPad Prism 8 software.
Genemania. To visualize interactions between identified genes, we employed the GeneMANIA (http://
www.genemania.org/), a Cytoscape application tool used for the functional prediction of gene and protein inter-
actions. For network creation utilized for drug discovery physical and genetic interactions, and pathways data-
bases were used.
Lentiviral particles production. The stocks containing VSV-G pseudotyped lentiviral particles were
generated by co-transfection of HEK293T with LeGO-iC2++ or pLentiCMV Puro DEST ERKKTRClover, and
packaging plasmids. pLentiCMV Puro DEST ERKKTRClover was a gift from Markus Covert (Addgene plas-
mid #59150). For the creation of H1299 cells expressing ERK KTR, cells were transduced with ERKKTRClover
Scientific Reports | (2021) 11:11234 | https://doi.org/10.1038/s41598-021-90701-w 10
Vol:.(1234567890)www.nature.com/scientificreports/
lentiviral particles to achieve ~ 50% transduction rate and then transduced cells were selected with medium sup-
plemented with 1 μg/mL puromycin (Sigma).
Real‑time PCR. RNA extraction from myeloid and lung cancer cells and qRT-PCR analysis was performed
in accordance with manufacturer protocols as described in Ref.51. Primer sequences used in this study are pro-
vided in Supplementary Table S7.
ERK KTR quantification. H1299 and A549 cells with ERK-KTR expression were generated by lentivi-
ral transduction of pLentiCMV Puro DEST ERKKTRClover plasmid, which was a gift from Markus Covert
(Addgene plasmid #59150). For nuclear segmentation cells were incubated with 500 ng/mL Hoechst-33342
for 30 min before imaging on Leica DMi8. To measure ERK activation by EGF and IL6 cells were cultured in
medium without serum. Each experiment was repeated at least two times, three microscopic fields were chosen
randomly for imaging for each well. Cytoplasm to nucleus ratios (C/N ratio) of mClover intensity were calcu-
lated for each cell. Nuclei and cytoplasm segmentation, and object intensity calculations were performed with
CellProfiler. Median intensities of mClover fluorescence in cytoplasm and nucleus were quantified and used to
calculate cytoplasm to nucleus (C/N) ratios for each cell. Outliners were removed based on z-score. Data pro-
cessing was performed in Python and GraphPad Prism 8.4.
Correlation matrixes and clustering. We used transcriptomic data for 160 IPF samples from LGR Con-
sortium dataset GSE4746016 and calculated Spearmen’s rank correlation coefficients in GraphPad 8.4 for each
pair of 49 COVID-19-associated cytokine genes present in the dataset. Then pairwise correlation matrix was
clustered by Ward’s hierarchical cluster method and bootstrap resampling using PVclust R p ackage52. Clusters
with 5 or more genes and AU-value > 95 were considered as stable (Supplementary Fig. S3a). Similar correlation
matrixes were calculated for 108 healthy lung samples from the same data set, 489 lung cancer and 363 con-
trol samples from 7 NCSLC datasets: GSE314153, GSE1980454, GSE2109, G SE1884255, GSE33532, G SE1918856,
57
GSE43580 .
UMAP. Transcriptomic data for 277 lung, colon, stomach and kidney cancer cell lines was obtained from
Genomics of Drug Sensitivity in Cancer dataset58 and UMAP analysis was performed using 4 different gene sets
(Supplementary Table S2). For initial NSCLC analysis transcriptomic data from 7 previously described NCSLC
datasets was used as well as 410 additional samples from GSE63074 dataset. Since GSE63074 dataset showed a
significant batch effect it was removed from final analysis. UMAP was performed using Python library (https://
github.com/lmcinnes/umap), appropriate codes are provided (https://github.com/CancerCellBiology/CELL-
MAP). Cluster analysis for UMAP data was performed using HDBSCAN algorithms (https://github.com/scikit-
learn-contrib/hdbscan).
Cmap. Cmap analysis was performed using clue.io online platform. The top 150 differentially expressed
genes identified in A549 cells in response to SARS-CoV-2 infection were used as a query. Genes used for the
analysis are listed in Supplementary Table S1. We used only the drug scores calculated for A549 cell line. The
Cmap scores are available in Supplementary Table S6.
Vi‑Fi scoring. Physical and genetic interactions, and pathways databases were used for network creation
with addition of up to 30 related genes. ChEMBL (https://www.ebi.ac.uk/chembl/)59 and DSigDB (http://dsigdb.
tanlab.org/DSigDBv1.0/)60 databases were used for initial selection of drugs that interact with at least one tar-
get from gene/protein network. From ChEMBL only drugs with described mechanisms were selected. From
DSigDB FDA approved drugs and kinase inhibitors databases were used to find drugs with tested inhibitory
activity. DSigDB computational drug signatures databases were used to find drugs that inhibit, decrease phos-
phorylation, expression and stability, block interaction with ligand and promote degradation of target genes/
proteins. To calculate antiviral and antifibrotic scores for drugs we used L1000 binary drug-induced gene expres-
sion signatures in full space (http://amp.pharm.mssm.edu/L1000FWD/)31. Drug-induced signatures were com-
pared with two disease specific gene expression signatures: differentially expressed genes (DEGs) in idiopathic
pulmonary fibrosis (IPF) vs. healthy lung used for fibrosis score calculation, and DEGs in SARS-CoV-2 infected
A549 and normal human bronchial epithelial (NHBE) cells used for viral score calculation (Supplementary
Table S6). Vi-Fi scores were calculated according to this formula:
n
n
i=1 Si × BPi i=1 Si × BPi
S= − ,
n up n down
where S is the fibrotic or viral score for the drug; Si is the score for an individual gene from drug-induced
signature: + 1 if gene expression is upregulated in a disease-specific signature, − 1 if downregulated; BPi is the
Boolean p-value: 1 if p-value for gene expression difference in a disease-specific signature is < 0.05, 0 otherwise;
n is the number of upregulated (up) or downregulated (down) genes in drug-induced signature. Negative score
values represent antiviral or antifibrotic predicted effect, while positive score represents proviral or profibrotic.
For calculation of combined drugs scores L1000 drug-induced signatures were combined and genes which
expression changes in opposite directions were removed from the analysis. If the same gene was present in both
drug signatures that gene was taken into account only once. All analysis were performed in Python and codes
Scientific Reports | (2021) 11:11234 | https://doi.org/10.1038/s41598-021-90701-w 11
Vol.:(0123456789)www.nature.com/scientificreports/
are available (https://github.com/CancerCellBiology/Vi-Fi-scoring). The interactive 2D plot is available on our
web-site 6zr.ru.
Statistics. All the data are expressed as mean ± SD from at least three individual experiments unless stated
otherwise in the text. Statistical significances of differences observed in flow cytometry and ERK-KTR experi-
ments were determined by Mann–Whitney non-parametric test. Statistical significances for real-time PCR
experiments were determined by an unpaired two-sided Student t-test.
Ethics declarations. No humans or animals were directly involved in the study.
Data availability
The results presented herein are based only on publicly available datasets. They are available using identifiers
listed in Supplementary Table S8.
Code availability
The source code used to generate main and supplementary figures is published (https://github.com/CancerCell
Biology).
Received: 12 February 2021; Accepted: 5 May 2021
References
1. Zhang, B. et al. Clinical characteristics of 82 death cases with COVID-19. medRxiv https://doi.org/10.1101/2020.02.26.20028191
(2020).
2. Xu, Z. et al. Pathological findings of COVID-19 associated with acute respiratory distress syndrome. Lancet. Respir. Med. 8, 420–422
(2020).
3. Huang, C. et al. Clinical features of patients infected with 2019 novel coronavirus in Wuhan, China. Lancet (London, England)
395, 497–506 (2020).
4. De Lafaille, C. S. et al. Journal pre-proof Immunology of COVID-19: Current state of the science. Immunol. Rev. Proj. https://doi.
org/10.1016/j.immuni.2020.05.002 (2020).
5. DuShane, J. K. & Maginnis, M. S. Human DNA virus exploitation of the MAPK-ERK cascade. Int. J. Mol. Sci. 20, 3427 (2019).
6. Balmanno, K. & Cook, S. J. Tumour cell survival signalling by the ERK1/2 pathway. Cell Death Differ. 16, 368–377 (2009).
7. Dai, M. et al. Patients with cancer appear more vulnerable to SARS-COV-2: A multi-center study during the COVID-19 outbreak.
Cancer Discov. https://doi.org/10.1158/2159-8290.CD-20-0422 (2020).
8. Mehta, V. et al. Case fatality rate of cancer patients with COVID-19 in a New York hospital system. Cancer Discov. https://doi.org/
10.1158/2159-8290.CD-20-0516 (2020).
9. Wang, B., Li, R., Lu, Z. & Huang, Y. Does comorbidity increase the risk of patients with COVID-19: Evidence from meta-analysis.
Aging (Albany. NY). 12, 6049–6057 (2020).
10. Fink, S. L. & Cookson, B. T. Apoptosis, pyroptosis, and necrosis: Mechanistic description of dead and dying eukaryotic cells. Infect.
Immun. 73, 1907–1916 (2005).
11. Hirano, T. & Murakami, M. COVID-19: A new virus, but a familiar receptor and cytokine release syndrome. Immunity 52, 731–733
(2020).
12. Zhou, Y. et al. Network-based drug repurposing for novel coronavirus 2019-nCoV/SARS-CoV-2. Cell Discov. 6, 14 (2020).
13. Prokofjeva, M. M. et al. A new system for parallel drug screening against multiple-resistant HIV mutants based on lentiviral self-
inactivating (SIN) vectors and multi-colour analyses. AIDS Res. Ther. 10, 1 (2013).
14. Klann, K. et al. Growth factor receptor signaling inhibition prevents SARS-CoV-2 replication. Mol. Cell https://doi.org/10.1016/J.
MOLCEL.2020.08.006 (2020).
15. Blanco-Melo, D. et al. Imbalanced host response to SARS-CoV-2 drives development of COVID-19. Cell 181, 1036-1045.e9 (2020).
16. Peng, X. et al. Plexin C1 deficiency permits synaptotagmin 7-mediated macrophage migration and enhances mammalian lung
fibrosis. FASEB J. 30, 4056–4070 (2016).
17. Gong, J. et al. Correlation analysis between disease severity and inflammation-related parameters in patients with COVID-19
pneumonia. MedRxiv. https://doi.org/10.1101/2020.02.25.20025643 (2020).
18. Xiong, Y. et al. Transcriptomic characteristics of bronchoalveolar lavage fluid and peripheral blood mononuclear cells in COVID-
19 patients. Emerg. Microbes Infect. 9, 761–770 (2020).
19. Wu, C. et al. Risk factors associated with acute respiratory distress syndrome and death in patients with coronavirus disease 2019
pneumonia in Wuhan, China. JAMA Intern. Med. 180, 934 (2020).
20. Zhou, F. et al. Clinical course and risk factors for mortality of adult inpatients with COVID-19 in Wuhan, China: A retrospective
cohort study. Lancet (London, England) 395, 1054–1062 (2020).
21. Ruan, Q., Yang, K., Wang, W., Jiang, L. & Song, J. Clinical predictors of mortality due to COVID-19 based on an analysis of data
of 150 patients from Wuhan, China. Intensive Care Med. 46, 846–848 (2020).
22. Yan, Y. et al. Clinical characteristics and outcomes of patients with severe covid-19 with diabetes. BMJ Open Diabetes Res. Care 8,
e001343 (2020).
23. Diao, B. et al. Reduction and functional exhaustion of T cells in patients with coronavirus disease 2019 (COVID-19). Front.
Immunol. 11, 827 (2020).
24. Zhou, Z. et al. Heightened innate immune responses in the respiratory tract of COVID-19 patients. Cell Host Microbe 27, 883-890.
e2 (2020).
25. Mcinnes, L., Healy, J., Saul, N. & Großberger, L. UMAP: Uniform manifold approximation and projection software • review •
repository • archive. (2018). https://doi.org/10.21105/joss.00861
26. Garnett, M. J. et al. Systematic identification of genomic markers of drug sensitivity in cancer cells. Nature 483, 570–575 (2012).
27. Moore, B. B. & Moore, T. A. Viruses in idiopathic pulmonary fibrosis. Etiology and exacerbation. Ann. Am. Thorac. Soc. 12(Suppl
2), S186–92 (2015).
28. Sheng, G. et al. Viral infection increases the risk of idiopathic pulmonary fibrosis: A meta-analysis. Chest 157, 1175–1187 (2020).
29. Riha, R. L. et al. Cytokine gene polymorphisms in idiopathic pulmonary fibrosis. Intern. Med. J. 34, 126–129 (2004).
30. Allen, R. J. et al. Genetic variants associated with susceptibility to idiopathic pulmonary fibrosis in people of European ancestry:
A genome-wide association study. Lancet. Respir. Med. 5, 869–880 (2017).
Scientific Reports | (2021) 11:11234 | https://doi.org/10.1038/s41598-021-90701-w 12
Vol:.(1234567890)www.nature.com/scientificreports/
31. Wang, Z., Lachmann, A., Keenan, A. B. & Ma’ayan, A. L1000FWD: Fireworks visualization of drug-induced transcriptomic sig-
natures. Bioinformatics 34, 2150–2152 (2018).
32. Triana-Martínez, F. et al. Identification and characterization of Cardiac Glycosides as senolytic compounds. Nat. Commun. 10,
4731 (2019).
33. Mehra, M. R., Ruschitzka, F. & Patel, A. N. Retraction-Hydroxychloroquine or chloroquine with or without a macrolide for treat-
ment of COVID-19: A multinational registry analysis. Lancet (London, England) 395, 1820 (2020).
34. Lamb, J. et al. The Connectivity Map: Using gene-expression signatures to connect small molecules, genes, and disease. Science
313, 1929–1935 (2006).
35. Aikin, T. J., Peterson, A. F., Pokrass, M. J., Clark, H. R. & Regot, S. MAPK activity dynamics regulate non-cell autonomous effects
of oncogene expression. Elife 9, e60541 (2020).
36. Kudo, T. et al. Live-cell measurements of kinase activity in single cells using translocation reporters. Nat. Protoc. 13, 155–169
(2018).
37. Diao, B. et al. Reduction and functional exhaustion of T cells in patients with coronavirus disease 2019 (COVID-19). MedRxiv
https://doi.org/10.1101/2020.02.18.20024364 (2020).
38. Moon, C. Fighting COVID-19 exhausts T cells. Nat. Rev. Immunol. 20, 277–277 (2020).
39. van de Veerdonk, F. L. et al. A systems approach to inflammation identifies therapeutic targets in SARS-CoV-2 infection. medRxiv
https://doi.org/10.1101/2020.05.23.20110916 (2020).
40. Liao, M. et al. Single-cell landscape of bronchoalveolar immune cells in patients with COVID-19. Nat. Med. https://doi.org/10.
1038/s41591-020-0901-9 (2020).
41. Dai, M. et al. Patients with cancer appear more vulnerable to SARS-CoV-2: A multicenter study during the COVID-19 outbreak.
Cancer Discov. 10, 783–791 (2020).
42. Wang, S. et al. AXL is a candidate receptor for SARS-CoV-2 that promotes infection of pulmonary and bronchial epithelial cells.
Cell Res. 31, 126–140 (2021).
43. Ziegler, C. G. K. et al. SARS-CoV-2 receptor ACE2 is an interferon-stimulated gene in human airway epithelial cells and is detected
in specific cell subsets across tissues. Cell 181, 1016-1035.e19 (2020).
44. Letko, M., Marzi, A. & Munster, V. Functional assessment of cell entry and receptor usage for SARS-CoV-2 and other lineage B
betacoronaviruses. Nat. Microbiol. 5, 562–569 (2020).
45. Becher, B., Tugues, S. & Greter, M. GM-CSF: From growth factor to central mediator of tissue inflammation. Immunity 45, 963–973
(2016).
46. Venkataraman, T. & Frieman, M. B. The role of epidermal growth factor receptor (EGFR) signaling in SARS coronavirus-induced
pulmonary fibrosis. Antiviral Res. 143, 142–150 (2017).
47. Stutvoet, T. S. et al. MAPK pathway activity plays a key role in PD-L1 expression of lung adenocarcinoma cells. J. Pathol. 249,
52–64 (2019).
48. Schönrich, G. & Raftery, M. J. The PD-1/PD-L1 axis and virus infections: A delicate balance. Front. Cell. Infect. Microbiol. 9, 207
(2019).
49. Mitsudomi, T. et al. p53 gene mutations in non-small-cell lung cancer cell lines and their correlation with the presence of ras
mutations and clinical features. Oncogene 7, 171–180 (1992).
50. Starr, T., Bauler, T. J., Malik-Kale, P. & Steele-Mortimer, O. The phorbol 12-myristate-13-acetate differentiation protocol is critical
to the interaction of THP-1 macrophages with Salmonella Typhimurium. PLoS One 13, e0193601 (2018).
51. Lebedev, T. D. et al. Two receptors, two isoforms, two cancers: Comprehensive analysis of kit and trka expression in neuroblastoma
and acute myeloid leukemia. Front. Oncol. 9, 1046 (2019).
52. Suzuki, R. & Shimodaira, H. Pvclust: an R package for assessing the uncertainty in hierarchical clustering. Bioinformatics 22,
1540–1542 (2006).
53. Bild, A. H. et al. Oncogenic pathway signatures in human cancers as a guide to targeted therapies. Nature 439, 353–357 (2006).
54. Lu, T.-P. et al. Identification of a novel biomarker, SEMA5A, for non-small cell lung carcinoma in nonsmoking women. Cancer
Epidemiol. Biomark. Prev. 19, 2590–2597 (2010).
55. Sanchez-Palencia, A. et al. Gene expression profiling reveals novel biomarkers in nonsmall cell lung cancer. Int. J. Cancer 129,
355–364 (2011).
56. Hou, J. et al. Gene expression-based classification of non-small cell lung carcinomas and survival prediction. PLoS One 5, e10312
(2010).
57. Tarca, A. L. et al. Strengths and limitations of microarray-based phenotype prediction: Lessons learned from the IMPROVER
Diagnostic Signature Challenge. Bioinformatics 29, 2892–2899 (2013).
58. Iorio, F. et al. A landscape of pharmacogenomic interactions in cancer. Cell 166, 740–754 (2016).
59. Mendez, D. et al. ChEMBL: Towards direct deposition of bioassay data. Nucleic Acids Res. 47, D930–D940 (2019).
60. Yoo, M. et al. DSigDB: Drug signatures database for gene set analysis. Bioinformatics 31, 3069–3071 (2015).
Acknowledgements
The author thankful to Dr. Ioanna Triviai, Dr. Carol Stocking, Prof. Dr. Tomas Dobner and Prof. Dr. Boris
Fehse from UKE Hamburg for kindly providing the cell lines used in this study and Prof. Dr. Boris Fehse and
Dr. Christopher Rieken for providing LEGO-vectors. Dr. Anton Buzdin and Dr. Sergei Dmitriev for partially
providing drugs used in the study.
Author contributions
E.V. conceived, designed and performed experiments, contributed to data analysis and development of com-
putational analysis and wrote the original manuscript. L.T. conceived, designed and developed computational
methods, performed computational analyses, performed experiments, and contributed to the manuscript writing.
V.P. conceived, directed the project, analyzed experiments, and edited the manuscript.
Funding
Part of this work (imaging of KTR cell lines) was supported by Grant № 075-15-2019-1660 from the Ministry of
Science and Higher Education of the Russian Federation. All other experiments were funded by RFBR according
to the research project № 20-04-60401.
Competing interests
The authors declare no competing interests.
Scientific Reports | (2021) 11:11234 | https://doi.org/10.1038/s41598-021-90701-w 13
Vol.:(0123456789)You can also read