TOPOLOGY IDENTIFIES EMERGING ADAPTIVE MUTATIONS IN SARS-COV-2
←
→
Page content transcription
If your browser does not render page correctly, please read the page content below
Topology identifies emerging adaptive mutations in SARS-CoV-2

                                                         Michael Bleher2†* , Lukas Hahn2†* , Juan Ángel Patiño-Galindo3 , Mathieu Carrière4 ,
                                                                          Ulrich Bauer5 , Raúl Rabadán3 , Andreas Ott1,2†*

                                            1
                                              Mathematics Department, Karlsruhe Institute of Technology, Karlsruhe, Germany
                                            2
                                              Mathematical Institute, Heidelberg University, Heidelberg, Germany
                                            3
                                              Program for Mathematical Genomics, Department of Systems Biology, Columbia University, New York, NY, USA
                                            4
                                              DataShape, Inria Sophia-Antipolis, Biot, France
                                            5
                                              Mathematics Department, Technical University of Munich, Munich, Germany
arXiv:2106.07292v1 [q-bio.PE] 14 Jun 2021

                                            † These   three authors contributed equally to this work.
                                            * Correspondence:   mbleher@mathi.uni-heidelberg.de
                                                                lhahn@mathi.uni-heidelberg.de
                                                                andreas.ott@kit.edu

                                            Abstract

                                            The COVID-19 pandemic has lead to a worldwide effort to characterize its evolution through the map-
                                            ping of mutations in the genome of the coronavirus SARS-CoV-2. As the virus spreads and evolves it
                                            acquires new mutations that could have important public health consequences, including higher trans-
                                            missibility, morbidity, mortality, and immune evasion, among others. Ideally, we would like to quickly
                                            identify new mutations that could confer adaptive advantages to the evolving virus by leveraging the
                                            large number of SARS-CoV-2 genomes. One way of identifying adaptive mutations is by looking at
                                            convergent mutations, mutations in the same genomic position that occur independently. The large
                                            number of currently available genomes, more than a million at this moment, however precludes the
                                            efficient use of phylogeny-based techniques. Here, we establish a fast and scalable Topological Data
                                            Analysis approach for the early warning and surveillance of emerging adaptive mutations of the coro-
                                            navirus SARS-CoV-2 in the ongoing COVID-19 pandemic. Our method relies on a novel topological
                                            tool for the analysis of viral genome datasets based on persistent homology. It systematically identifies
                                            convergent events in viral evolution merely by their topological footprint and thus overcomes limita-
                                            tions of current phylogenetic inference techniques. This allows for an unbiased and rapid analysis of
                                            large viral datasets. We introduce a new topological measure for convergent evolution and apply it
                                            to the complete GISAID dataset as of February 2021, comprising 303,651 high-quality SARS-CoV-2
                                            isolates taken from patients all over the world since the beginning of the pandemic. A complete list of
                                            mutations showing topological signals of convergence is compiled. We find that topologically salient
                                            mutations on the receptor-binding domain appear in several variants of concern and are linked with
                                            an increase in infectivity and immune escape. Moreover, for many adaptive mutations the topological
                                            signal precedes an increase in prevalence. We demonstrate the capability of our method to effec-
                                            tively identify emerging adaptive mutations at an early stage. By localizing topological signals in the
                                            dataset, we are able to extract geo-temporal information about the early occurrence of emerging adap-
                                            tive mutations. The identification of these mutations can help to develop an alert system to monitor
                                            mutations of concern and guide experimentalists to focus the study of specific circulating variants.

                                                                                                   1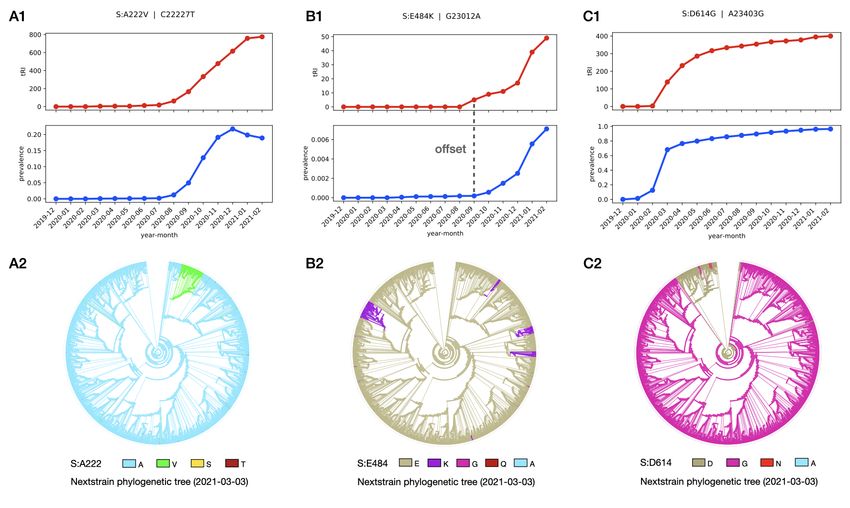
Introduction

The COVID-19 pandemic has led to millions of lost human lives and devastating economic impact
worldwide. The pandemic was caused by a coronavirus, SARS-CoV-2, likely to have originated from
an animal reservoir [1, 22, 29, 32]. As the virus has spread through the world, it has been mutating
and acquiring new mutations in its genome. Although most of the mutations could be deleterious or
neutral, a few of them could be advantageous for the virus, for instance, by increasing its infectivity
or by helping it to avoid the immune system. As more people develop immune protection by previous
viral infections or through vaccination, it is important to rapidly and effectively identify mutations
that could confer the virus some adaptive advantage.
One approach to identify potential adaptive mutations is by experimentally mutating many positions
and testing the effect of these mutations in certain phenotypes, like binding to the human receptor or
immune escape [9, 35, 45]. However, the number of mutations in the viral genome is extraordinarily
large and this number is even larger when different genetic backgrounds are considered. Experimental
approaches are limited by the vast number of potential variations.
Another approach to identify adaptive mutations, that relies only on the genomic information of the
virus, is to look for mutations in a particular genomic locus that occurs multiple times, more than
what one expected. If a mutation is deleterious, we should not be able to observe it frequently and
when observed, its presence should not increase in frequency as time goes by. However, if a mutation
gives some sort of advantage to the virus, we should expect that it could occur in several places
independently and that its frequency should increase with time. We have several examples of these
kind of mutations already observed in the COVID-19 pandemic. For instance, the D614G mutation in
the Spike gene was early identified in the pandemic and is now found in most of the virus isolates [21].
The genomic-based approaches to identify adaptive mutations also have the advantage that there
is a worldwide effort to sequence viruses with currently more than a million genomes available to
the scientific community. As the pandemic evolves, the technology becomes more accessible, and
the public health and political will to characterize variants increases, we should expect this number
to grow, leading to an almost real-time genomic data acquisition for the real-time surveillance of
concerning variants. Ideally, we would like to have a method that will leverage all genomic information
at real-time to rapidly inform public health authorities about the emergence of potential mutations of
concern [14].
The most standard way to identify these adaptive mutations is based on the aforementioned idea
that mutations that confer an adaptive advantage occur repeatedly in the population and increase in
frequency. For this analysis one needs to construct a phylogenetic tree of the genomes available and
identify mutations that occur in independent branches. That is the idea behind software packages
like TreeTime and HomoplasyFinder [5, 34]. HomoplasyFinder has been used to study convergent
evolution in SARS-CoV-2 during earlier phases of the pandemic [39, 40]. Phylogenetic approaches,
however, become daunting as the number of sequences increases, and become a major challenge when
the number of genomes exceeds the tens of thousands. That is due to the scaling of the number of
potential phylogenetic trees with the number of genomes. Although there are approximations based
on subsamples of sequences adapted to the focus of the analysis, like for example in Nextstrain [12],
these methods rarely scale to the numbers of SARS-CoV-2 genomes currently available. In addition
to the complexity due to the large number of sequences, the phenomenon that we are interested in
characterizing, the independent emergence of mutations, gives rise to homoplasies that confuse the
generation of phylogenetic trees. This leads to the necessity of masking problematic sites that induce
instabilities in the inferred phylogenies [38]. Furthermore, it has been observed that in producing a
single optimal phylogeny for SARS-CoV-2 one generally faces serious difficulties, as the number of

                                                   2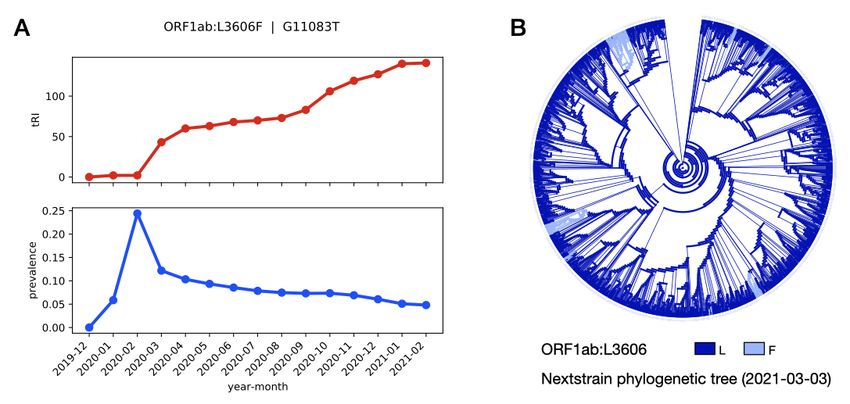
sequences is large while the genetic diversity is low [28]. Ideally, we would like a method that identifies
potential adaptive mutations without the need of constructing a phylogenetic tree.
Here we propose a method based on Topological Data Analysis (TDA) that can efficiently identify
convergent mutations without the need to construct a phylogenetic tree and that can easily scale to
hundreds of thousands of genomes. We show how this method can identify known and potentially
relevant new adaptive mutations even at low frequencies in the populations.

Results

Topological Data Analysis and viral evolution.  Chan et al. [3] proposed a method from Topological
Data Analysis known as persistent           homology1
                                                to extract global features from genomic datasets that
capture evolutionary processes that can be represented by a tree (vertical) or a network (reticulate)
at various scales of genetic distance. In this approach, in place of a single phylogenetic tree or
network, the core structure is a sequence of objects, one for each dimension, which incorporates
many potential evolutionary relationships between the corresponding isolates in a comprehensive and
efficient way. While persistent homology in dimension zero reproduces aspects of vertical evolution
in terms of hierarchical clustering, it has been established that the presence of persistent homology
above dimension zero necessarily implies that the corresponding evolutionary history cannot be fully

                     A1    AA                AA                   AA         A3
                                                                                            AA
                      CA         AC    CA          AC    CA             AC

                      CC               CC          CC                   CC

                                                                               CA                     AC
                     A2                      AA

                                       CA          AC
                                                                                            CC

                                             CC

                     B1                                                B2

                                                                             Genetic Distance Scale

Figure 1. Topological Data Analysis detects reticulate events in viral evolution. (A) Reticulate events in molecular
evolution create topological cycles. (A1) and (A2) show possible evolutionary histories on the level of individuals in the
example of a genome with only two nucleotides. The coloring of the edges corresponds to the acquisition of a specific
mutation, while the coloring of the nodes represents individuals carrying this mutation. Convergent evolution (A1) or
recombination (A2) leads to the presence of four alleles for which there is no single consistent phylogeny (four-gamete
test). On the genomic level, identical individuals cannot be distinguished and incompatible phylogenies are represented
by a topological cycle in the corresponding phylogenetic network (A3). (B) Persistent homology in dimension one detects
reticulate events in viral evolution by means of a persistence barcode. Each bar in the barcode (B2) corresponds to a
topological cycle in the reticulate phylogeny (B1). Bars starting at higher genetic distance scale correspond to cycles
with edges of longer genetic distance. The length of a bar indicates the size of the corresponding cycle.

   1
       Throughout this paper, the term homology refers to the notion from the mathematical field of topology.

                                                              3
explained by a single phylogenetic tree. The mathematical background of this phenomenon is a classical
theorem due to Rips, which asserts that trees have trivial persistent Vietoris-Rips homology [11]. In
particular, persistent homology in dimension one detects topological cycles in the genomic dataset,
in which case phylogenetic reconstruction methods can produce ambiguous tree topologies. Figure 1
shows the simplest examples of such inconsistencies and how they can be represented in terms of
a reticulate phylogeny. For a given sequence alignment, persistent homology extracts its inherent
topological patterns and compiles it to a stable and unbiased descriptor known as a persistence barcode.
Each bar in the barcode corresponds to a topological cycle in the associated reticulate phylogeny, which
can be traced back to the explicit isolates that comprise the reticulate event (Figure 1).
There are several scenarios that can lead to reticulate events. For instance, if a genome of an organism
imports genetic material from a different genome, in lateral gene transfer for instance, we will observe
that parts of the newly generated genome resemble the parent, while others resemble the genome of
the organism that exported that material. Recombination and reassortments are common phenomena
observed in viruses where two parental strains co-infect the same host cell generating a new virus
containing genetic material from both parental strains. But similarity between genomes can also be
generated at smaller scales, when the same mutation occurs independently twice, making the two
strains more similar than expected. Persistent homology captures all these events, and also the scale
of the events. Although in general it requires care to infer the biological origin of a given topological
cycle, in viral evolution one expects bars at small scales to correspond mostly to homoplasies, while
well-supported recombination signals typically produce topological features at larger scales, as entire
blocks of genetic material are exchanged in the process.
Quantification of topologically recurrent mutations. In order to identify signals of convergent evolution
in SARS-CoV-2, we define a novel index of recurrence in reticulate phylogenies that is based on persis-
tent homology and does not rely on a possibly sub-optimal tree reconstruction. We use a specifically
designed algorithm, implemented in a recent version of Ripser [2], that associates to each bar in the
persistence barcode an explicit topological cycle given by a series of isolates that approximates all
potentially relevant evolutionary steps as faithfully as possible (see Methods). We further consider
only SNV cycles, for which adjacent sequences only differ by single nucleotide variations (SNV) and
that do not include more than one substition per site (Figure 2). In the barcode, these cycles are
associated to bars that start at genetic distance scale 1. The topological recurrence index (tRI) of a
specific mutation is then the total number of SNV cycles in the reticulate phylogeny that contain this
A B
tRI = 2
1nt 1nt
1nt 1nt
1nt
1nt
Figure 2. The topological recurrence index (tRI) quantifies convergent evolution. (A) SNV cycles are formed by single
nucleotide variations only. All virus isolates in the cycle have genetic distance one. Without multiple substitutions per
site, the fact that a topological cycle closes up necessarily implies that all SNVs in this cycle appear twice, independently
of each other and distributed across both possible lineages. (B) The topological recurrence index (tRI) is the total
number of SNV cycles in the phylogeny that contain a specific SNV. In the example shown, the red SNV is contained in
two distinct cycles and therefore has a tRI of 2. The tRI gives a lower bound for the number of independent occurrences
of a given mutation during the evolution of the virus.
4mutation (Figure 2). The tRI provides a lower bound for the number of independent occurrences of a
given mutation during the evolution of the virus. It is therefore a measure for convergent evolution.
Persistent homology of the GISAID dataset. To characterize the extent to which reticulate events
shape the evolution of SARS-CoV-2, we computed the persistence barcode of a curated alignment of
161,024 genetically distinct viral genomes from human and animal hosts representing the evolution
of the pandemic since its beginning in late 2019. The alignment was compiled from all 303,651 high
quality genomes in the complete GISAID EpiCoV dataset as of 28 February 2021. The computa-
tion involved the generation of a genetic distance matrix (Hamming distance) of the dataset with
Hammingdist [20] and the subsequent computation of its persistence barcode with Ripser [2] (see
Methods). The resulting barcode is shown in Figure 3 and features 2,899 bars across all genetic
distance scales at the current level of diversification. Each bar in the barcode corresponds to a
one-dimensional topological cycle in the dataset and indicates the presence of a reticulate event in
the evolutionary history of the virus. For RNA viruses like SARS-CoV-2, possible biological mech-
anisms underlying reticulate evolution include homologous recombinations and homoplasies through
convergent evolution. Notably, the vast majority of topological features in the GISAID dataset is
concentrated at small genetic distance scales and is expected to be associated mainly to homoplasic
sites. In large genomic datasets, homoplasies can arise randomly, which leads to a certain amount of
statistical noise in the persistence barcode. Another important source of topological features are sys-
tematic sequencing inaccuracies, either through contamination of the sequenced isolates or acquisition
of an improper consensus genome [24, 25]. Here, we present a careful investigation of the topologi-
cal features of the GISAID dataset at small scales and develop a pipeline that allows us to separate
statistical noise from real biological signals for convergence.
A B
Figure 3. Topological Data Analysis of the GISAID dataset and simulated viral evolution. (A) Persistence barcode
representing the persistent homology in dimension one of the complete GISAID dataset as of February 2021, containing
161,024 genetically distinct high-quality SARS-CoV-2 genomes and representing the evolution of the pandemic since
its beginning in late 2019 (see Methods). Each of the 2,899 bars in the barcode corresponds to a topological cycle in
the reticulate phylogeny. The rich topology of the dataset indicates a multitude of reticulate events that shaped the
evolution of the virus in the course of the pandemic. (B) Topological features are satistically significant. Simulations
were generated with SANTA-SIM [19] for five distinct scenarios with varying growth rate g and mutation rate µ (see
Table 1). The 95% prediction intervals for the number of one-dimensional cycles in each scenario are based on the
extrapolation of a Panjer distribution for an increasing number of distinct sequences in the simulated phylogenies (see
Methods). For each scenario, the validation dataset shown in the plot is well-described by the corresponding prediction
intervals. The worst case scenario V predicts an upper limit of 1,171 cycles that appear randomly in the phylogeny. The
statistical noise in all scenarios is below the observed number of 2,899 cycles in the GISAID dataset.
5We estimated the expected number of
The number of topological features is statistically significant.
topological cycles created by random homoplasic events by simulating several evolutionary scenarios
under the following assumptions: uniform probability distribution for substitutions across the genome,
no variations in fitness, and zero recombination rate. The simulations were performed with SANTA-
SIM [19], implementing a Wright-Fisher model for evolutionary scenarios that realize different choices
of population growth and substitution rate (see Methods). The statistical analysis of persistence
barcodes of the simulated data shows that in the GISAID dataset with 161,024 distinct sequences, it
is unlikely to find more than 1,171 one-dimensional topological cycles (95% prediction interval upper
limit, scenario V; see Figure 3).
We conclude that a large part of the 2,899 topological cycles in the GISAID dataset must be due
to increased mutation probabilities, selection effects, recombination events, or systematic sequencing
errors.
Performance analysis and comparison with phylogeny-based methods. Standard phylogenetic methods
for the detection of convergent evolution in genomic datasets are based on the prior reconstruction of a
phylogenetic tree. The independent occurrence of a given mutation in different branches of the tree is
then taken as an indicator of convergence. These methods are able to effectively find homoplasies even
for highly genetically diversified isolates. However, current phylogenetic inference techniques have an
unfavorable scaling with the number of sequences due to the rapid growth of the number of trees
representing possible evolutionary histories. In addition, it has been observed that finding a single
phylogeny that optimally captures the evolutionary history of SARS-CoV-2 is problematic because
the number of sequences is large and at the same time their genetic diversity is low [28].
A B
Figure 4. Performance analysis and comparison with phylogeny-based methods. (A) Basic runtime comparison between
TDA-based methods and phylogeny-based methods for small random samples of SARS-CoV-2 genomes from the GISAID
dataset. We used IQTree [27] to reconstruct phylogenetic trees (with default settings and fast search option). The
subsequent homoplasy analysis was performed with TreeTime [34] and HomoplasyFinder [5] (with default settings). For
the TDA-approach we used Hammingdist to generate genetic distance matrices and Ripser (with scaling parameter
threshold 2) for the subsequent computation of persistence barcodes (see Methods). The comparison was carried out on
an Intel Xeon E7-4870 processor. The favorable overall scaling of TDA-based methods allows for the effective analysis
of the full GISAID dataset. (B) Runtime and memory usage for the computation of persistence barcodes for all monthly
sub-alignments of the GISAID dataset with Ripser (with scaling parameter threshold 2; see Methods). The generation
of the genetic distance matrix of the full alignment with Hammingdist took 31 hours and 338 Gigabytes of memory. The
computations were carried out on an Intel Xeon Gold 6230R processor.
6Persistent homology provides a new approach to this problem by detecting convergent evolution on
small genetic distance scales purely in terms of topological cycles, without the need of constructing
any phylogenetic trees. Inferring convergent evolution via persistent homology allows for an effective
analysis of large datasets that scales favorably with the number of sequences. This is exemplified by
a basic runtime comparison with typical phylogeny-based methods for small samples of SARS-CoV-2
genomic data, and enables a rapid analysis of the full GISAID dataset comprising 161,024 genetically
distinct sequences (see Figure 4 and Methods). The short runtimes needed for the computation of
persistent homology with Ripser are largely due to the fact that the topological recurrence analysis is
restricted to topological cycles on small genetic distance scales (the SNV cycles). We emphasize that
in contrast to phylogenetic-based methods, our method only resolves homoplasies on small genetic
distance scales.
Topologically recurrent mutations in the whole genome alignment. In the absence of convergent evo-
lution, mutations that appear in topological cycles are expected to be equally distributed across all
segregating sites, so that a tRI ≥ 2 is already a statistically significant signal (p < 0.05; see Methods).
The result of the tRI analysis for the whole genome alignment of the GISAID dataset with a total
of 1,684 SNV cycles is shown in Figure 5, and a full list of mutations with tRI ≥ 2 is available in
Table S2. Most of the mutations with strong tRI signal are known to be highly homoplasic and lead to
stability issues in the construction of SARS-CoV-2 phylogenies [6, 28, 38, 39]. In this way, persistent
A SNV SAAV gene tRI prevalence
G11083T1,2 L3606F ORF1ab 141 5%
C21575T1,2 L5F S 97 2%
C15324T1,2 synonymous ORF1ab 38 3%
C3037T1,2 synonymous ORF1ab 34 96%
A17615G K1383R ORF1ab 33 6%
C2453T L730F ORF1ab 31 2%
A10323G1,2 K3353R ORF1ab 29 2%
A23403G1,2 D614G S 29 96%
G25563T1,2 Q57H ORF3a 28 26%
C27964T2 S24L ORF8 27 10%
B
Figure 5. Topological signals of recurrent mutations across the whole genome. The table in (A) lists the topological
recurrence index (tRI) and the prevalence of mutations with strongest topological signal. Many of these have previously
been reported to be highly homoplasic in Turakhia et al.1 [38] and van Dorp et al.2 [39]. For a complete list of mutations
with statistically significant topological signal (tRI ≥ 2) see Table S2. The histogram in (B) shows the distribution of
topological signals across the whole SARS-CoV-2 genome. In every region of the genome, reticulate events play a crucial
role in the evolution of the virus.
7homology can aid the design of masking schemes in the phylogenetics of emerging pathogens. For ex-
ample, ORF1ab:G11083T shows a steady increase in tRI over the whole course of the pandemic, while
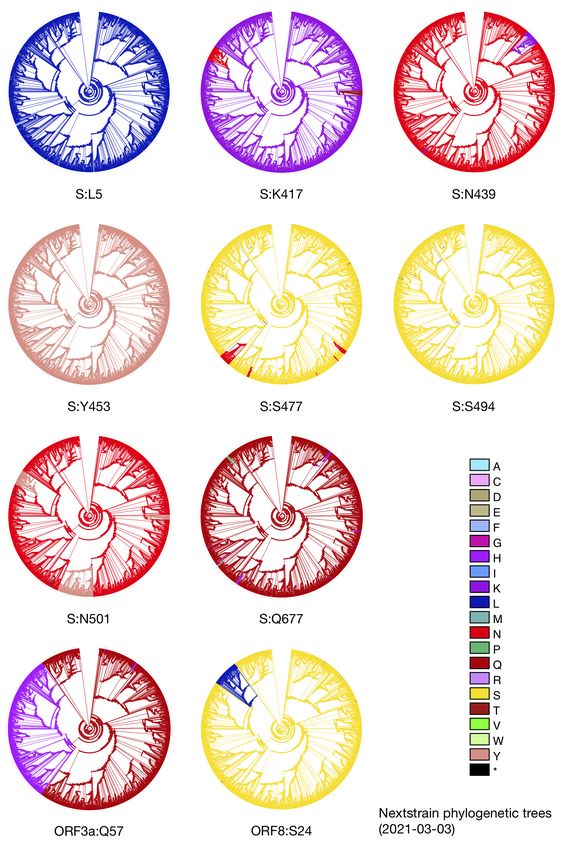
at the same time its prevalence remains low (Figure 6). A corresponding ancestral state reconstruction
analysis based on the Nextstrain tree of a curated subsample of 3,507 sequences from the GISAID
dataset as of 3 March 2021 [12], confirms that this mutation indeed arises repeatedly in independent
and disjoint parts of the phylogeny, but was never established in larger subpopulations. Both syn-
onymous and non-synonymous mutations with tRI ≥ 2 are spread across the whole genome, which
reveals that the evolution of most parts of the genome violates the hypothesis of vertical evolution.
The overall distribution of recurrent mutations across the genome is the result of many interfering
biological processes, including recombination at several junction hotspots [10].
Figure 6. Topological footprint of a highly recurrent mutation in the example of the mutation ORF1ab:G11083T. (A) A time
series analysis shows a monthly increase of the tRI, while the prevalence stays low. This indicates that the mutation has
been re-emerging frequently and steadily since the beginning of the pandemic. The consistently low prevalence suggests
that the mutation is neutral or deleterious, as a beneficial substitution would be expected to establish itself in larger
subpopulations. In particular, this example shows that for certain mutations, tRI and prevalence are not correlated.
(B) An ancestral state reconstruction analysis confirms the convergent evolution of ORF1ab:G11083T in terms of the
repeated occurrence in independent branches of the Nextstrain tree [12] of a curated subsample of 3,507 sequences from
the GISAID dataset as of 3 March 2021.
Identifying which mutations are topologically recurrent due to selective pressures requires additional
information. For example, S:D614G was early on identified as a candidate for adaptation. There is
now evidence that this mutation increases transmissibility [21, 23] and in vitro infectiousness [17, 33,
44]. So in this case, the prominent tRI signal of S:D614G in the whole genome alignment is likely a
consequence of convergent evolution due to the increased fitness associated to the mutation. We find
additional evidence of convergent evolution due to selective pressures by a more detailed analysis of
the Spike gene.
Reticulate evolution of the Spike gene. While a persistent homology analysis of the whole genome data
quantifies the reticulate evolution in SARS-CoV-2, which obstructs the construction of phylogenies
for the whole genome, the chief public health interest lies in the evolution of the Spike protein. Of
particular importance are the receptor-binding domain (RBD) and its vicinity, for which it is known
from experiments that certain mutations enhance binding to the ACE2 receptor [35] or reduce binding
of polyclonal convalescent plasma [9]. In order to probe the evolution of single genes for reticulate
events, we run the persistent homology analysis for a suitable truncation of the alignment. In doing
so for the Spike gene, we are able to investigate whether mutations arise recurrently also on this
scale, which can be indicative of ongoing convergent evolution due to selective pressures. For the
analysis of the Spike gene, a topological recurrence index tRI ≥ 8 is statistically significant (p < 0.05;
see Methods). Results are shown in Figure 7 and a full list of Spike gene mutations showing some
topological signal of recurrence is provided in Table S3. We find a large number of 10,814 topological
cycles, including 10,677 SNV cycles, which implies that reticulate events have a significant impact
8A SNV SAAV tRI prevalence B site position total tRI per substitution
C22227T A222V 776 19% D936 Y:91, H:9, N:4, G:2, V:2, E:2
C21575T L5F 466 2% G75 V:43, R:12, S:4, D:2, A:2
G22992A S477N 433 4% G261 V:33, S:9, R:9, C:5, D:3
A23403G D614G 400 96% P26 S:46, L:34, H:8, T:3
C21614T L18F 362 8% D80 Y:60, N:10, A:8, G:3
C21855T S98F 342 2% H146 Y:22, Q:10, R:2, L:2
C22444T synonymous 276 2% E156 D:5, Q:3, K:2, G:2
G23593T Q677H 251 1% D215 H:41, Y:26, G:4, N:2
C23731T synonymous 203 1% D427 Y:5, H:2, G:2, V:2
C24334T synonymous 193 4% E484 K:49, G:10, Q:6, A:2
C22388T synonymous 161in mid-2020. While S:S477N is known to affect the binding affinity to the ACE2 receptor [35] leading
to a slight increase in fitness, there is no conclusive evidence whether or not S:A222V also results
in a higher transmissibility [15]. A particularly strong signal in our analysis that persists after the
initial surge in prevalence in the European summer of 2020 suggests that S:A222V is notably recurrent,
independently of its impact on viral fitness.
Figure 8. Typical time series and convergence patterns observed in the Spike mutations S:A222V (A), S:E484K (B) and
S:D614G (C). The ancestral state reconstruction analysis is based on the Nextstrain tree of a curated subsample of 3,507
sequences from the GISAID dataset as of 3 March 2021 [12]. Recurrence of the mutation S:A222V persists after its initial
surge in prevalence in mid-2020 (A1), but the mutation only got established in a subpopulation associated to the B.1.177
/ 20E (EU1) lineage (A2). For S:E484K, the rise in tRI precedes the rise in prevalence with an offset of at least one
month (B1). This serves as an early indicator for an immune escape mutation to establish itself in several subpopulations
due to selective pressure (B2). For S:D614G, after a rapid increase in tRI and prevalence the tRI reaches a plateau (C1)
once the mutation has become dominant, superseding the wild type in the early phase of the pandemic (C2).
We observe that on the RBD in particular, many of the topologically salient mutations appear in
several variants of interest (VOI) or variants of concern (VOC) because of their phenotypic effects on
the virus [42]. The substitutions S:E484K, S:L452R, S:K417N and S:S494P all result in a significantly
reduced binding of polyclonal convalescent plasma and exhibit a distinct pattern in the times series
analysis: a steady increase in tRI starting in late 2020, but before the eventual increase in prevalence
(see Figure 8 and Figure S9). This pattern is compatible with the hypothesis that immune evasion
manifests itself in convergent evolution in a host population with a rising level of immunity. Similarly,
S:N501Y and S:N501T produce comparable signals in the tRI analysis and induce a slight antibody
escape, which again is consistent with the corresponding time series analysis (Figure S9) and ances-
tral state reconstruction (Figure S10). The fact that S:N501Y has a comparatively high prevalence
and is recognized in various VOI and VOC lineages is likely explained by the additional increase in
ACE2 binding affinity for the asparagine-to-tyrosine substitution. A similar behavior is observed for
S:N439K [37] and is likely the explanation for its strong topological signal.
Notably, the tRI values of the mutations S:Y453F and S:F486L exclusively originate from a small
subpopulation closely related to the Cluster 5 mink variant [30, 41, 43]. The comparatively low values
of the tRI suggest that both mutations have an adaptive effect in minks but do not significantly
increase fitness of viruses circulating in the human population.
10A B
tRI signifi- notable ACE2-binding mean plasma
SAAV tRI prevalence
cant since lineages affinity1 antibody escape2 Sample: all SAAVs with tRI > 0 S477N
S477N 433 2020-07 4% B.1.160, 0.06 0.011
N439K
B.1.526* E484K
N501T N501Y
L452R
N439K 88 2020-04 2% 0.04 0.016
V367F
S494P 64 2020-09the initial acquisition of a significant tRI signal after October 2020 (Fisher’s exact test, p < 0.05).
A possible interpretation is a beginning shift towards immune escape as the driving force behind adap-
tation. Correspondingly, we expect immune evasion to cause increasingly strong topological signals in
the ongoing pandemic when immunity is on the rise in the human population.
Early warning and surveillance of emerging adaptive mutations. As persistent homology is sufficiently
sensitive to detect signals of convergent evolution already at very low mutation frequencies, we propose
the topological recurrence index as an early warning system for emerging adaptive mutations. In
particular, monitoring the tRI over time might aid vaccine development by the early identification of
emerging vaccine resistance. Figure 9 features many mutations showing evidence of adaptation [9, 35]
that have low prevalence so far, but give rise to notable signals of convergence in persistent homology.
Among those are the mutations S:L452R, S:T478K, S:E484Q and S:P681R associated with the lineage
B.1.617, which was linked with a major outbreak in India at the time of writing [4, 16]. The mutation
S:P681R lies outside the receptor-binding domain, but yields a significant tRI signal in the Spike gene
analysis (see Figure 7 and Table S3). The tRI signals for the mutations S:T478K and S:E484Q have not
yet reached statistical significance, but show a rising tendency in February 2021 (see Figure S9). We
further note that in a situation where sufficient genomic surveillance is available, the representation of
reticulate events corresponding to adaptation in terms of SNV cycles provides geographic and temporal
specifics which might be useful for public health decision making. Figure 10 depicts three examples of
this application, with explicit cycles showing the acquisition of the mutation S:E484K in the variants
of concern P.2 and B.1.1.7, and the emergence of S:Y453F in a subpopulation that is suspected to
originate from mink populations [30, 41, 43].
A1 EPI_ISL_416036
A2 EPI_ISL_596982
B EPI_ISL_406862
Brazil|2020-03-05 England|2020-10-08 Germany|2020-01-28
B.1.1.28 B.1.1.7 B.1.153
EPI_ISL_918514 EPI_ISL_547575 EPI_ISL_851504 EPI_ISL_950875 EPI_ISL_622262 EPI_ISL_511395
Brazil|2020-10-14 Brazil|2020-06-16 England|2021-01-08 England|2020-12-22 Denmark|2020-06-08 Portugal|2020-03-30
P.2 B.1.1.28 B.1.1.7 B.1.1.7 B.1.1.298 B.1.1
EPI_ISL_717930 EPI_ISL_908209 EPI_ISL_683307
Brazil|2020-10-27 England|2021-01-16 mink/Denmark|2020-10-15
P.2 B.1.1.7 B.1.1.298
S: E484K S: E484K S: Y453F
Figure 10. SNV cycles representing the acquisition of adaptive mutations in the evolution of the Spike gene. Panel
(A) shows two instances of the mutation S:E484K arising independently, once in Brazil in October 2020 (A1), and once
within the lineage B.1.1.7 in England in January 2021 (A2). Panel (B) shows the emergence of a variant containing the
mutation S:Y453F, which is associated with adaptation to the mink host. One of the isolates was sampled from a mink,
while the other one was taken from a patient in Denmark. Both are part of the lineage B.1.1.298 that is suspected to
originate from mink populations [30, 41, 43].
Discussion
The identification of adaptive mutations in large genomic datasets is of paramount importance. In the
current COVID-19 pandemic such mutations could be associated with vaccine resistance and higher
transmissibility, among other concerning attributes. We present here a method that can rapidly
identify the presence of these mutations.
Persistent homology provides an effective method to study convergent evolution of SARS-CoV-2 and
is able to efficiently deal with the ever-increasing wealth of sequencing data created by global public
12health surveillance. This novel tool rapidly extracts the associated global patterns from genomic data
in an unbiased way and without relying on the prior reconstruction of a single phylogeny.
Applying this approach to an alignment of 303,651 viral genomes from GISAID representing the
evolution of the pandemic from its beginning in late 2019 until February 2021, we found 2,899 instances
of incompatible evolutionary histories, which are indicative of reticulate events such as homoplasies
or recombinations shaping the evolution of the virus. By localizing these events on the genome, we
found evidence for convergent evolution on several sites, some of which are already known to be
highly homoplasic. A similar analysis for the Spike gene revealed a strong increase to 10,814 signals
for reticulate events mostly located on the S1 subunit and the S1-S2 cleavage region, showing that
convergence plays a significant role in the evolution of the Spike protein in particular. We observed
that topologically salient mutations on the receptor-binding domain are generally linked with a change
in phenotype associated with adaptation to the human host, and often convergently evolve in several
variants of concern. We inferred that a leading selective pressure behind convergent evolution in the
early phase of the pandemic is an increase in binding affinity to the ACE2 receptor, while immune
escape is currently gaining importance in populations with rising levels of immunity. In particular,
we found that persistent homology is sufficiently sensitive to detect these processes already at very
low mutation frequencies, and is able to explicitly localize the acquisition of adaptive mutations in the
dataset.
Based on these insights, we propose persistent homology as an early warning system for the emergence
of new adaptive mutations in the ongoing SARS-CoV-2 pandemic and foresee this capability also in
future pandemics of various pathogens. In addition, the early identification of variants of concern
associated to adaptive mutations can guide experimentalists for the phenotypic characterization. We
envision a combined effort between public health organizations with rapid sampling and sequencing of
viral genomes, the computational characterization of potential adaptive variants and the experimental
phenotypic characterization of these variants.
Methods
Data acquisition. We downloaded all SARS-CoV-2 genome sequences from the GISAID EpiCoV
database as of 28 February 2021 (isolated from human and animal hosts) that carried the follow-
ing attributes: “complete”, “high coverage”, “low coverage excluded”, “collection date complete”.
This dataset comprised 450,473 sequences. A list of GISAID accession numbers of all sequences used
in the present work, along with an acknowledgement of the contributions of both the submitting and
the originating laboratories, is provided in Table S1.
Multiple sequence alignment. We aligned all sequences against the Wuhan/Hu-1 reference sequence
EPI ISL 402125 in three stages: first, sequences were micro-aligned with two moving markers of 21nt
Topological
Sequence Genetic distance Barcode &
GISAID data recurrence index
alignment matrix cycle localization
(tRI)
Figure 11. A schematic diagram of the Topological Data Analysis pipeline for the monitoring of emerging adaptive
mutations in SARS-CoV-2.
13length starting from the ends of the NCBI SARS-CoV-2 reference genome NC 045512.2 (reference site
positions 266 and 29,674). Subsequently all sequences containing ambiguous markers, or at least one
ambiguous site (nucleotide “N”) in between the markers, were removed. This resulted in a dataset
comprising 304,714 sequences. Second, a subset of 128,347 sequences that deviated from the reference
sequence in genome length, or whose genetic distance to the reference sequence was greater than 20nt,
was aligned with MUSCLE [8], iteratively in blocks of 20 sequences each. Subsequently an alignment
scheme for all sequences was derived. Third, all aligned sequences were truncated at reference site
positions 266 and 29,674 to obtain complete SARS-CoV-2 genome sequences. All sequences still
containing at least one ambiguous site (nucleotide “N”) were removed. This resulted in an alignment
comprising 303,651 sequences of length 30,130nt.
Time series, monthly sub-alignments, and distance matrices. We used Hammingdist [20] to compute
the genetic distance matrix (Hamming distance) of the alignment of 303,651 whole genome sequences.
Noteworthy, our convention in this work is that insertions and deletions (dashes in aligned sequences)
do not contribute to the genetic distance.
We created 15 time buckets, each ranging from December 2019 to one of the months between December
2019 and February 2021. For each time bucket, a time bucket sub-alignment of all genetically distinct
sequences whose collection dates belong to the given time bucket was created by selecting isolates by
their date stamp and removing genetically identical sequences (Hamming distance = 0). The largest
time bucket sub-alignment ranging from December 2019 to February 2021 contained 161,024 geneti-
cally distinct sequences. Then for each such sub-alignment the corresponding genetic distance matrix,
which is a sub-matrix of the distance matrix of the whole alignment, was derived. We obtained 15
distance matrices of whole genome time bucket sub-alignments. This process was repeated for all sub-
alignments after truncating sequences to the Spike gene (reference site positions 21,563 to 25,384).
We obtained 15 distance matrices of Spike gene time bucket sub-alignments.
Topological Data Analysis and persistent homology. Topological Data Analysis is a field of data science
that aims at extracting topological structures and patterns from datasets. Such topological structures
have associated dimensions: structures of dimension 0 can be thought of as the connected components,
and structures of dimension 1 are essentially the loops, or cycles, of the dataset. Structures of higher
dimensions can also be defined, but are also more difficult to interpret. In this article, we are interested
in reticulate evolutionary processes, thus we choose to focus on topological structures in dimension 1,
since cycles can be interpreted as signals of divergence from phylogenetic trees.
Datasets often come as point clouds: in our setting, each point corresponds to a virus genome sample,
and lies in a high-dimensional space where each nucleotide of the genome is a dimension. A common
way to extract the phylogenetic network from this point cloud simply amounts to connecting samples
as soon as their genetic distance is less than a given threshold r > 0. This results in a (neighborhood)
graph, whose set of cycles provides candidates for the topological structures in dimension 1 of the true
underlying network. Equivalently, this corresponds to put balls of radius r around each point, and
to collect the loops formed by the union of balls. However, a main limitation of this approach comes
from the fact that there might not exist a single correct r value (Figure 12).
The most common way to handle this issue in Topological Data Analysis is to actually compute
and track the cycles for all possible values of r ranging from 0 to +∞. As r increases, some cycles
can appear, and some already existing cycles can disappear, or get filled in. The whole point of
Topological Data Analysis is to record, for each cycle, its radius of appearance, or birth time, and
radius of disappearance, or death time. This is called the persistent homology of the Vietoris-Rips
14r0 = 0 r1 > r0 r2 > r1
r3 > r2
r1 r2 r3
Figure 12. Illustration of the Vietoris-Rips filtration of a point cloud. Each point represents a sample, and we display the
unions of balls of various radii r0 = 0 < r1 < r2 < r3 . If one only chooses one radius, one might either see nothing (r0 ,
r3 ), or detect the small red cycle but miss the large blue one (r1 ), or vice-versa (r2 ). A solution to handle this issue is
to characterize each cycle with its radii of appearance and disappearance: the red cycle induces a red bar in the barcode
with endpoints r1 (for which the cycle is present in the union of balls) and r2 (in which the cycle is filled in the union
of balls), and similarly for the blue cycle.
filtration2 corresponding to the point cloud. Hence, the Vietoris-Rips filtration provides a multiscale
method to extract cycles of various sizes, and encode them in a so-called persistence barcode: each
bar, or interval, in this barcode represents a cycle , i.e., in our case, a reticulate evolutionary process,
and the bar endpoints correspond to its radii of birth and death, i.e., the maximum genetic distance
between consecutive samples forming the cycle, and, roughly, the maximum pairwise genetic distance
between samples forming the cycle. Moreover, the length of the bar represents the cycle size. In our
case, this corresponds to the length of the reticulate evolutionary process, which allows to distinguish,
for instance, between homoplasies and recombinations.
Computing persistent homology. A limitation of most of the algorithms in the literature that compute
the persistent homology of Vietoris-Rips filtrations, is that they do not provide the samples forming
the cycles corresponding to the bars in the barcode. Fortunately, this feature became recently available
for the software Ripser [2], so we used it to compute the persistent homology of the Vietoris-Rips
filtration associated to the genetic distance matrix for each time bucket sub-alignment (whole genome
and Spike gene). As we are only interested in SNV cycles, the computation of persistence barcodes
for the time bucket sub-alignments was restricted to small genetic distance scales (Ripser scaling
parameter threshold set to 2), which greatly increases the speed of the computation.
2
Formally speaking, this construction is actually called the Čech filtration. The Vietoris-Rips filtration is just a
tractable approximation of the Čech filtration, which shares its essential properties.
15Ripser is a state-of the art software for the computation of persistent homology based on the topolog-
ical construction of Vietoris-Rips complexes. This construction, based on a scale parameter r, can be
summarized as follows. The input is a distance matrix describing the dataset, considered as a finite
metric space. First, consider the geometric graph at scale r, whose vertices are the data points, with
any two points connected by an edge whenever their distance is at most r. Generalizing this construc-
tion, the Vietoris-Rips complex at scale r connects any subset of the data points with a simplex (an
edge, a triangle, a tetrahedron, or a higher-dimensional generalization thereof) whenever all pairwise
distances in the subset are at most r. A Vietoris-Rips complex is a particular type of simplicial com-
plex, a higher-dimensional generalization of graphs which is of crucial interest in algebraic topology,
in particular in homology theory.
For the computation of the persistence barcode, Ripser resorts to various optimizations, which are
crucial when handling datasets of the size considered in the present work. Notably, Ripser computes
persistent cohomology, which is not based on cycles but instead on cocycles, often described intuitively
as cuts that tear open a hole. In order to obtain the requisite cycles representing the features in
persistent homology, we used a custom version of Ripser that subsequently carries out a second
computation, this time based on cycles instead of cocycles. While a naive computation based on
homology would be prohibitively expensive, the previous computation of the persistence barcode
based on cocycles makes the subsequent computation of representative cycles feasible.
The homological features identified by persistent homology admit different representative cycles. In
order to obtain cycles that fit tightly to the data points, we use a method called exhaustive reduction
[7, 46], which can be roughly summarized as follows. Whenever a representative cycle contains an
edge that also appears in another cycle as the longest edge, a tighter representative can be obtained
by replacing the edge with the remaining edges from the other cycles, which all have shorter length.
Topological recurrence analysis. For each time bucket sub-alignment (whole genome and Spike gene)
a complete list of SNV cycles (one-dimensional cycles all of whose edges have genetic length 1nt) in
this alignment was generated from the corresponding Ripser output. For each edge in an SNV cycle
the endpoints of the edge correspond to a pair of uniquely determined sequences in the alignment
that differ in exactly one nucleotide site position and hence determine an SNV. A list of all such
edges that have the following two additional properties was compiled: (i) one of the two sequences
associated with the endpoints shares a nucleotide with the reference sequence at the SNV site position,
and (ii) the SNV is isolated in the sense that at the two preceding and following site positions the
nucleotides are the same as in the reference sequence. Condition (ii) ensures that the corresponding
SAAV is uniquely determined by the SNV for all edges carrying that SNV. Then for each SNV in
that list, its topological recurrence index (tRI) is by definition the total number of all SNV cycles
containing an edge that gives rise to the given SNV. We computed the tRI of each such SNV for every
time bucket sub-alignment (whole genome and Spike gene). Moreover, for every whole genome time
bucket sub-alignment the prevalence of every SNV was computed as the quotient of the number of
all sequences carrying that SNV by the number of all sequences in that sub-alignment. Note that the
sub-alignments entering into this computation consisted of genetically distinct sequences. Finally, for
every SNV the measurements of both tRI (whole genome and Spike gene) and prevalence for all time
buckets were combined into a time series analysis chart. Even if all 1,684 SNV cycles arose through
random processes, it is expected that the resulting tRIs are distributed uniformly among all observed
mutations. So the probability for a given mutation to have tRI≥ k is given by a binomial distribution
where the number of trials corresponds to the number of mutations in SNV cycles, and the probability
for success is the inverse of the number of mutations that are realized in the dataset. From this we
deduce that in the whole genome analysis tRI≥ 2 is highly significant (p < 0.01), while for the Spike
gene analysis any value tRI ≥ 8 is significant (p < 0.05).
16Ancestral state reconstruction analysis. For the study of the evolutionary histories of topologically
highly recurrent mutations, we performed ancestral state reconstruction analyses using Mesquite Ver-
sion 3.61 [26]. As inputs we used a curated alignment of 3,507 genome sequences and its corresponding
Maximum-Likelihood tree, downloaded from Nextstrain [12] on 3 March 2021. The tree was rooted
using the oldest sequence available (EPI ISL 406798, collected on 26 December 2019). We inferred the
evolution of each amino acid of interest along this SARS-CoV-2 tree using a parsimony approach.
Simulations. We checked the significance of persistent homology as an indicator of increased muta-
bility or increased fitness by comparing the real dataset to simulations under the null-hypothesis of
completely neutral evolution. The datasets were simulated with SANTA-SIM [19], which produces
forward simulations of viral evolution based on a Wright-Fisher model. By completely neutral evo-
lution we mean a Wright-Fisher model of viral evolution with uniform mutation probabilities for all
substitions across the genome, no fitness variations among individuals and no recombination events.
The parameters of the model are as follows.
• number of generations: N = 10, 000
• number of sequences sampled from the population per time step: n = 15
• recombination rate: ρ = 0
• mutation rate per site per generation: µ
• effective initial population: p
• carrying capacity: c
• population growth rate per generation: g
In order to estimate the effect of these parameters on the number of expexted one-dimensional cycles in
the GISAID dataset, we considered five scenarios. In scenarios I-III we varied the mutation rate under
the assumption of fixed population size, while in scenarios IV and V we investigated the effects of
logistic growth of the viral population. An overview of the parameters for each scenario is in Table 1.
The range of mutation rates in scenarios I-III were chosen such that the diversity in the simulated
phylogenies are in close correspondence to the observed diversity in the GISAID dataset. While a
mutation rate of µ = 0.75E − 7 substitutions per generation per site systematically underestimates
the maximal distances to the root, the highest value of µ = 1.25E − 7 produces slightly larger max-
imal values (Figure S6). In fact, scenario II with µ = 1.00E − 7 reproduced the observed maximal
distance accurately and provides a good approximation of the GISAID dataset. Major differences
scenario mutation rate µ growth rate g initial population p /
[10−7 subst./(site×gen.)] [1/gen.] carrying capacity c
I 0.75 0
p = c = 100, 500, 1000, 2500,
II 1 0
5000, 7500, 104 , 105 , 106
III 1.25 0
IV 0.75 2 p = 100 / c = 100, 500, 1000,
V 0.75 5 2500, 5000, 7500, 104 , 105 , 106
Table 1. Parameters in scenarios I-V. Scenarios I-III vary over a range of mutation rates that roughly captures the
diversity of the GISAID dataset. Scenarios IV and V probe the influence of logistic population growth. For all scenarios
we produced 100 simulations for each of the values of the carrying population c ≤ 105 , and 5 simulations for c = 106 .
17scenario I II III IV V
95% PI [692, 814] [362, 408] [211, 237] [646, 727] [1023, 1171]
Table 2. 95% Prediction intervals for each scenario in datasets with 161,024 distinct sequences.
between simulations and the GISAID dataset in Figure S6 arise due to real-world effects like growth
of population size, increase in worldwide sequencing rates, and enhanced spread of certain variants in
the phylogeny.
In order to keep the overall runtime and memory usage at a reasonable level, we extrapolated results of
the persistent homology analysis for smaller simulated datasets to the size of the GISAID dataset. For
all scenarios we produced 100 simulations for each of the following values of the effective population
p (resp. carrying capacity c): 100, 500, 1000, 2500, 5000, 7500, 104 , 105 . Additionally, we included 5
simulations for p = 106 to achieve a better support of the extrapolation fit. For each value of p we
randomly chose 60% of the simulations as training data, used to determine the parameters of different
models in a non-linear least squares fit, while the remaining 40% were dedicated for later validation
and comparison of the models.
For each scenario we considered a quadratic, cubic, powerlaw and exponential model for the observed
points (xi , yi ), and linear and powerlaw fits for the squared residuals (yi − yfit (xi ))2 in the training
data (Figure S8). In each model, we then used the resulting fits mean(x) and var(x) as estimators
for the mean and variance of an underlying Panjer (a, b, 0)-class distribution [31, 36]. The quantiles
of the observed number of cycles in the training data fit the quantiles of the Panjer distribution with
corresponding mean and variance remarkably well, see Figure S7.
We then determined the likelihood L = i PPanjer (y = yi |mean(xi ), var(xi )) to observe the validation
Q
data {(xi , yi )}. For each model, the corresponding log-likelihoods are listed alongside the corresponding
fits in Figure S8. According to the log-likelihoods, the variance of the Panjer distribution is generally
best described by a powerlaw behaviour. An exception is scenario II, for which the small sample of 5
simulations at p = 106 has an uncharacteristically small variance that skews the fits and corresponding
likelihoods. Among the models that assume a powerlaw dependence of the variance, again with
exception of scenario II, the cubic-powerlaw model yields maximum likelihoods.
Finally, we determined the 95% prediction intervals for the expected numbers of random cycles by use
of the cubic-powerlaw extrapolation of mean and variance of a Panjer distribution (Table 2). Figure 3
shows the extrapolation of 95% prediction intervals for each scenario, together with the validation
data. As an immediate observation, the validation data of scenarios I, IV and V, which were all based
on the same mutation rate, are well described by the prediction intervals of scenario I. The prediction
intervals of scenario V differ significantly from the other two only at high numbers of distinct sequences.
This difference arises because simulations in scenario V generally produce less distinct sequences than
scenario I and IV, such that a steeper extrapolation is not penalized sufficiently. Hence, the prediction
intervals of scenario V illustrate the error margins of the extrapolations, but are not likely to faithfully
represent the expected number of one-dimensional cycles. We also observe that higher mutation rates
in scenarios II and III lead to smaller numbers of one-dimensional cycles in the dataset.
In conclusion, the 95% prediction interval of scenario V yields an upper bound of [1023, 1171] expected
random cycles in the GISAID dataset with 161,024 distinct sequences. Accordingly, the 2,899 one-
dimensional cycles in the GISAID dataset cannot be explained by statistical noise. Moreover, since
the diversity of the GISAID dataset is better approximated by scenario II than by scenarios I, IV or
V, it is reasonable to rely on the prediction interval of scenario II, which predicts that in 95% of the
cases we expect between [362, 408] random cycles.
18Acknowledgements
The authors acknowledge scientists and laboratories for sharing SARS-CoV-2 genome sequencing data
with the research community via the GISAID database. A list of all contributions used in this work
detailing authors from the originating laboratories responsible for obtaining the specimens and the
submitting laboratories where genetic sequence data were generated is available in Table S1. This
work was supported by the BMBF-funded de.NBI Cloud within the German Network for Bioinfor-
matics Infrastructure (de.NBI) (031A532B, 031A533A, 031A533B, 031A534A, 031A535A, 031A537A,
031A537B, 031A537C, 031A537D, 031A538A). The authors acknowledge the use of de.NBI cloud and
the support by the High Performance and Cloud Computing Group at the Zentrum für Datenverar-
beitung of the University of Tübingen and the Federal Ministry of Education and Research (BMBF)
through grant no 031 A535A. They thank M. Hanussek for IT support and early access to VALET
[13]. The authors further acknowledge support from the Interdisciplinary Center for Scientific Com-
puting at Heidelberg University and the development work of the Scientific Software Center of Hei-
delberg University carried out by D. Kempf and L. Keegan. This research was supported by the DFG
Collaborative Research Center SFB/TRR 109 “Discretization in Geometry and Dynamics”. M.B.
was supported by the Deutsche Forschungsgemeinschaft (DFG, German Research Foundation) under
Germany’s Excellence Strategy EXC 2181/1 - 390900948 (the Heidelberg STRUCTURES Excellence
Cluster). L.H. thanks the Evangelisches Studienwerk Villigst for their support. A.O. acknowledges
funding by the Deutsche Forschungsgemeinschaft (DFG, German Research Foundation) – 281869850
(RTG 2229).
Author Contributions
M.B., L.H., A.O., J.P.G., R.R. designed the study; M.B., L.H., A.O. curated data; M.B., M.C., L.H.,
A.O., J.P.G. performed computational analyses; U.B., M.B., L.H., A.O. developed and implemented
software; M.B., L.H., A.O. acquired computing resources; M.B., L.H., A.O. drafted the manuscript;
all authors contributed to the final version of the paper.
Disclosure of Potential Conflicts of Interest
R.R. is a founder of Genotwin, he is member of the Scientific Advisory Board of AimedBio and consults
for Arquimea Research.
References
1. Andersen, K. G., Rambaut, A., Lipkin, W. I., et al. The Proximal Origin of SARS-CoV-2. Nature
Medicine 26, 450–452 (2020). doi:10.1038/s41591-020-0820-9.
2. Bauer, U. Ripser: Efficient Computation of Vietoris-Rips Persistence Barcodes. Journal of Applied
and Computational Topology (to appear) (2021). doi:10 . 1007 / s41468 - 021 - 00071 - 5. arXiv:
1908.02518.
3. Chan, J. M., Carlsson, G. & Rabadan, R. Topology of Viral Evolution. Proceedings of the National
Academy of Sciences 110, 18566–18571 (2013). doi:10.1073/pnas.1313480110.
4. Cherian, S., Potdar, V., Jadhav, S., et al. Convergent Evolution of SARS-CoV-2 Spike Mutations,
L452R, E484Q and P681R, in the Second Wave of COVID-19 in Maharashtra, India. preprint
(2021). doi:10.1101/2021.04.22.440932.
19You can also read