2018 Census: Changes and how they might affect data - Stats NZ
←
→
Page content transcription
If your browser does not render page correctly, please read the page content below
2018 Census: Changes and how they
might affect data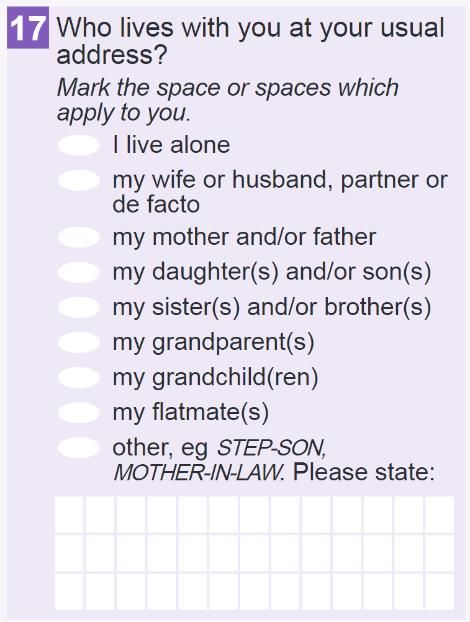
Crown copyright ©
See Copyright and terms of use for our copyright, attribution, and liability statements.

Citation
Stats NZ (2018). 2018 Census: Changes and how they might affect the data. Retrieved from www.stats.govt.nz.

ISBN 978-1-98-852873-1 (online)

Published in May 2018 by
Stats NZ Tatauranga Aotearoa
Wellington, New Zealand

Contact
Stats NZ Information Centre: info@stats.govt.nz
Phone toll-free 0508 525 525
Phone international +64 4 931 4600

www.stats.govt.nz
2018 Census: Changes and how they might affect the data

Contents
Purpose and summary .......................................................................................................................... 6
    Summary .......................................................................................................................................... 6

Changes to the 2018 Census ................................................................................................................. 9
    2018 changes ................................................................................................................................... 9

Changes and their effect on each variable ......................................................................................... 12
    Prioritisation of variables ............................................................................................................... 12
    Age / Date of birth ......................................................................................................................... 12
    Sex ................................................................................................................................................ 13
    Usual residence .............................................................................................................................. 13
    Census night address ..................................................................................................................... 15
    Ethnicity ......................................................................................................................................... 15
    Māori descent ................................................................................................................................ 16
    Iwi affiliation .................................................................................................................................. 17
    Birthplace ....................................................................................................................................... 18
    Usual residence one year ago ........................................................................................................ 18
    Legally registered relationship status ............................................................................................ 19
    Partnership status in current relationship ..................................................................................... 19
    Household composition, family type, extended family type, and child dependency status ......... 20
    Main means of travel to education and Educational institution address ..................................... 22
    Highest secondary school qualification ......................................................................................... 23
    Post-school qualification................................................................................................................ 24
    Field of study.................................................................................................................................. 25
    Highest qualification (derived variable) ......................................................................................... 26
    Sources of personal income........................................................................................................... 27
    Total personal income ................................................................................................................... 28
    Work and labour force status ........................................................................................................ 28
    Hours worked in employment per week ....................................................................................... 31
    Status in employment .................................................................................................................... 31
    Main means of travel to work........................................................................................................ 32
    Occupied dwelling type ................................................................................................................. 33
    Tenure of household...................................................................................................................... 35
    Years at usual residence ................................................................................................................ 37
    Years since arrival in New Zealand ................................................................................................ 38

                                                                             3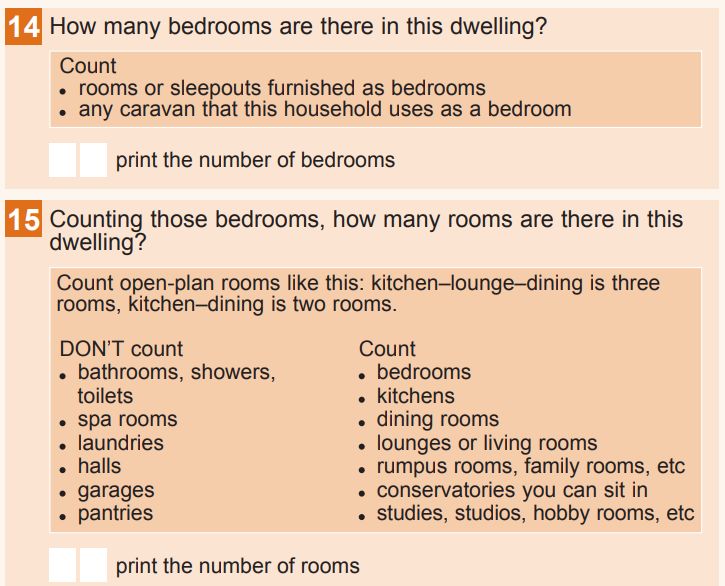
2018 Census: Changes and how they might affect the data
Languages spoken .......................................................................................................................... 39
Religious affiliation ........................................................................................................................ 40
Study participation......................................................................................................................... 41
Disability/activity limitations ......................................................................................................... 42
Cigarette smoking behaviour ......................................................................................................... 42
Number of children born ............................................................................................................... 44
Individual home ownership ........................................................................................................... 45
Occupation ..................................................................................................................................... 46
Industry .......................................................................................................................................... 47
Sector of ownership ....................................................................................................................... 48
Unpaid activities ............................................................................................................................ 48
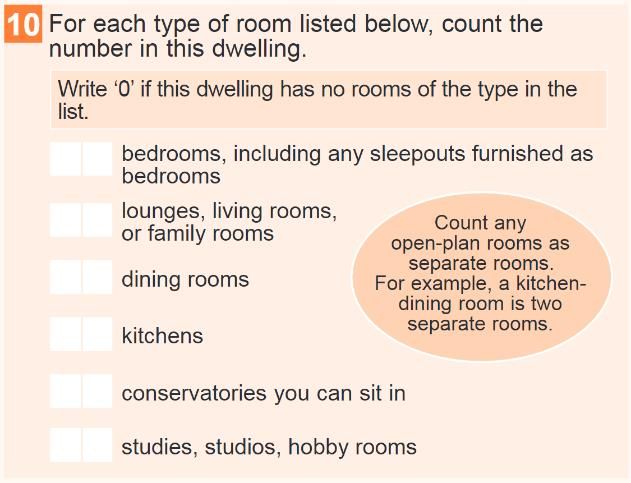
Number of rooms and bedrooms .................................................................................................. 49
Main types of heating .................................................................................................................... 50
Access to telecommunication systems .......................................................................................... 51
Number of motor vehicles ............................................................................................................. 52
Housing quality .............................................................................................................................. 52
Conclusion ........................................................................................................................................... 54
References .......................................................................................................................................... 55
Appendix 1: Summary of changes....................................................................................................... 56
42018 Census: Changes and how they might affect the data
List of tables and figures
List of tables
1. Predicted level of real-world change and data collection change for 2018 Census variables ........... 7
Appendix table 1. Likelihood of change for variable, by type of change .............................................. 56
List of figures
1. Household composition, family type, extended family type and child dependency status
questions, dwelling form and individual form, 2018 Census........................................................... 21
2. Travel to education and educational address questions, 2018 Census ............................................ 22
3. Post-school qualifications questions, 2013 and 2018 censuses ....................................................... 24
4. Field of study question, 2013 and 2018 censuses ............................................................................ 26
5. Hours worked questions, 2013 and 2018 censuses .......................................................................... 29
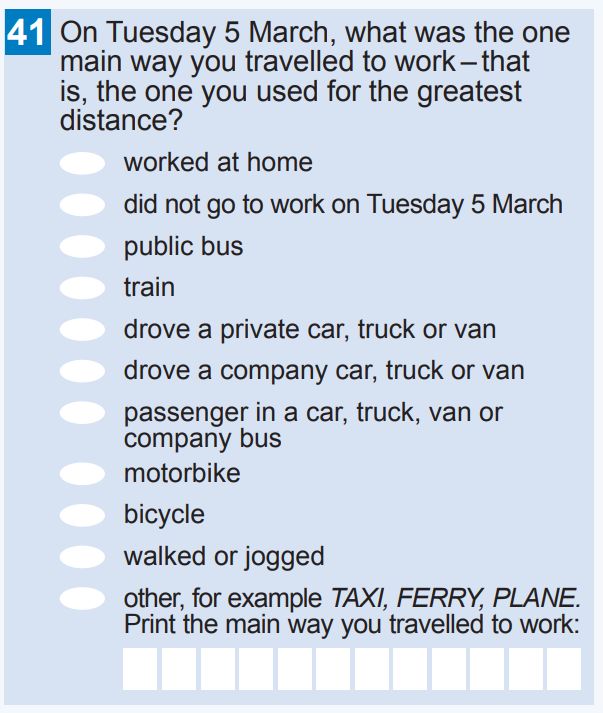
6. Means of travel to work question, 2013 and 2018 censuses ........................................................... 32
7. Occupied dwelling type question, 2013 and 2018 censuses ............................................................ 33
8. Tenure of household questions, 2013 and 2018 censuses ............................................................... 36
9. Years at usual residence questions, 2013 and 2018 censuses.......................................................... 37
10. Religious affiliation question, 2013 and 2018 censuses ................................................................. 40
11. Cigarette smoking behaviour questions, 2018 Census ................................................................... 43
12. Individual home ownership question, 2013 and 2018 censuses .................................................... 45
13. Number of rooms and bedrooms questions, 2013 and 2018 censuses ......................................... 49
14. Main types of heating question, 2013 and 2018 censuses ............................................................. 51
15. Housing quality questions, 2018 Census ........................................................................................ 53
52018 Census: Changes and how they might affect the data
Purpose and summary
2018 Census: Changes and how they might affect the data describes the changes made to content
and operational processes of the 2018 Census of Population and Dwelling to better reflect the needs
of customers, and how these changes might affect the comparability of the data over time.
The changes relate to the classifications, imputation, and questionnaire design; the way the data is
processed, variable by variable; and the predicted impacts on the data. Where relevant, we include
changes due to actual changes in the population (‘real-world changes’). The new model we
employed in the 2018 Census to better reflect the needs of customers has resulted in changes that
may impact on the comparability of the data over time. We outline the anticipated impacts this
report.
Summary
The 2018 New Zealand Census is a change census, meaning that for the first time since 2001, the
variables collected in the census have undergone significant review. With the change model, and a
general update of systems, there are considerations to be made for data quality. We have made
every effort to ensure data quality remains high, and the trust our data users and members of the
public place in the census is preserved. There are instances where changes may have an impact on
the quality of data, although in many cases these changes will lead to positive outcomes.
We outline possible implications of the changes in content and process of 2018 Census for each of
the variables. While we’ve tried to limit the impacts on comparability with previous data there are
instances where this was not possible, given the changed approach for 2018 and need to refresh and
update content. Until the data is analysed it is impossible to fully understand the impacts of the
changes, therefore our assessments are based on what we knew leading into the 2018 Census
operation. Following the analysis of the 2018 Census data, we will publish metadata and further
information about any impacts of changes on 2018 Census data.
Table 1 summarises the predicted level of change for each variable, with priority 1 variables first.
Appendix 1 summaries the likelihood of eight types of change for each variable.
62018 Census: Changes and how they might affect the data
Table 1
1. Predicted level of real-world change and data collection change for 2018 Census variables
Predicted level of real-world change and data collection change for 2018 variable
Variable Level of real-world change Level of data collection change
(predicted) (predicted)
Age/Date of Birth Moderate Minor
Sex Moderate Minor
Usual residence Moderate Minor
Census night address Moderate Minor
Ethnicity Moderate Minor
Māori descent Minor Moderate
Iwi affiliation Moderate Moderate
Birthplace Moderate Minor / Moderate
Usual residence one year ago Not applicable Not applicable
Legally registered relationship Minor Minor
status
Partnership status in current Minor Minor
relationship
Household composition, family Minor Major
type, extended family type and
child dependency status
Main means of travel to Not applicable Not applicable
education and Educational
institution address
Highest Secondary School Minor Minor
Qualification
Post-school qualification Minor Moderate / Major
Field of study Minor Moderate
Highest qualification (derived Minor Moderate / Major
variable)
Sources of personal income Minor Moderate
Total personal income Moderate Moderate
Work and labour force status Minor / Moderate Minor / Moderate
72018 Census: Changes and how they might affect the data
Hours worked in employment Minor Minor
per week
Status in employment Minor / Moderate Minor
Main means of travel to work Minor Minor / Moderate
Occupied dwelling type Moderate Moderate
Tenure of household Minor Minor
Years at usual residence Minor Minor
Years since arrival in New Moderate Moderate
Zealand
Languages spoken Moderate Minor
Religious affiliation Moderate Major
Study participation Minor Major
Disability / activity limitations Minor / Moderate Major
Cigarette smoking behaviour Moderate Minor
Number of children born Minor Minor
Individual home ownership Minor Minor
Occupation Minor / Moderate Minor / Moderate
Industry Minor / Moderate Minor / Moderate
Sector of ownership Minor / Moderate Minor
Unpaid activities Minor Minor
Number of rooms and Minor Moderate
bedrooms
Main types of heating Moderate / Major Major
Access to telecommunication Major Minor
systems
Number of motor vehicles Minor Minor/Moderate
Housing quality Not applicable Not applicable
82018 Census: Changes and how they might affect the data
Changes to the 2018 Census
The aim of the New Zealand census, which has been occurring since 1851, is to provide a high quality
count of the New Zealand population and dwellings every five years. The census is unique in that it is
able to provide information on small populations and groupings that is not achievable in sample
surveys.
It is important that the census reflects the data needs of New Zealand at the time. Some of these
needs do not change, while others are emerging. This mix is reflected in the change model that the
2018 Census operated under and informs the strategic aims of the 2018 Census.
These strategic aims are to:
• improve data quality while modernising
• reduce the cost of collection operations
• contribute to organisation capability
• increase the use of administrative data
• make digital engagement easy
• adopt a test-drive development
• deliver customer driven products and services.
See 2018 Census strategy for more information about the strategy.
The strategic aims of the census fit within the larger organisational roles of Stats NZ., which include
ensuring we continue to provide independent and trusted data and that we enable New Zealand’s
decision makers. It is also important for Stats NZ, and therefore the census, to innovate to drive
value for our customers while ensuring that we are trusted stewards for New Zealand’s data now
and into the future.
2018 changes
As well as making changes to the wording and design of the questionnaires, we made some
substantial operational and process changes to the 2018 Census. We updated processes,
methodologies, systems, and tools across the census programme to ensure the census is as cost-
effective as possible while ensuring high quality data for our customers.
See:
• Respondent interaction
• Concept and questionnaire changes
• Collection methodology
• Classification changes
• Imputation
• Document layout
• Prioritisation of variables.
92018 Census: Changes and how they might affect the data
Respondent interaction
A key element of the change model is the difference in how respondents interacted with the 2018
Census. Most respondents received a letter with an access code which they can then use to
complete the census online. We expect the move to online will result in data quality improvements.
We sent access codes to households listed on an address register, which had been constructed then
physically checked by Stats NZ. We mailed out the codes to about 80 percent of dwellings, while the
remaining 20 percent were ‘list-leave’, where a field officer visited the dwelling to deliver either an
access code or paper forms with an access code. While online was the primary mode of completion,
people who do not receive paper forms through the ‘list-leave’ process were able to request them.
This paper describes some of the possible data quality implications of the change model by variable,
as well as some other changes that may impact on data quality.
See 2018 Census – a modernised, digital-first census for more about the change model for 2018
Census.
Concept and questionnaire changes
The changes we made to the concepts of questions and to the design and layout of the
questionnaires were a result of changes to the data needs of our customers, or where a question
required changes due to respondent difficulty in the 2013 Census or during the testing phase of the
2018 Census.
See 2018 Census report on final content for a summary of these changes.
Collection methodology
Changes to the collection methodology may have some impact, positive or negative, on data quality.
We made changes to ensure the census meets the needs of respondents and customers in 2018, as
well as reducing the cost of running the census.
In previous censuses, staff visited every dwelling in New Zealand to deliver and collect paper census
forms as well as delivering internet access codes in 2006 and 2013. In 2018, we moved to the digital-
first approach, where most dwellings received an internet access code on the mail. We employed
fewer field than in previous censuses. Our aim was to enable more respondents to complete the
census without the prompting of field staff, and to target our resources to respondents who had not
completed their census. From previous censuses, we know certain groups are less likely to complete
their census. In order to encourage these groups to participate, we had targeted response strategies,
a comprehensive communications and marketing campaign, and ran focused community
engagement activities. The aim was to help mitigate some of the challenges in achieving our
expected response and coverage rates as a result of the new collection model and a general trend
down in response rates.
The uptake in online responses to the census will result in a significant improvement on the quality
of the data we receive. On the whole data, collected using the internet collection system (ICS) is of
better quality than that of paper. The online form used automatic routing and as-you type lists which
helped respondents answer the necessary questions with their correct information easily. As well as
these features, which help respondents, we used radio buttons and check-boxes and mandatory
questions to ensure the data collected is of high quality. Where this is applicable, the possible
102018 Census: Changes and how they might affect the data
implications of these changes have been discussed, see the online optimisation sections in Changes
and their effect on each variable.
Changes to the processing system have the potential to impact on how the data looks compared to
earlier censuses. However, we carefully considered all changes to ensure that, where possible, any
we made will improve the quality of the data received.
Classification changes
The classifications for a number of variables, for example religion and iwi, have been reviewed and
updated to ensure our classifications are moving with society’s changes. The impacts of the changes
to classifications are discussed in relevant sections of Changes by variable.
Changes to the statistical geographies allow us to report more detailed information at small
geographies for our customers to use while ensuring that we maintain the privacy of respondents.
See Statistical standard for geographic areas 2018 (SSGA18).
Imputation
Imputation is discussed at length with relevant variables. Two key types of imputation are used:
donor and administrative data imputation. We intend to use imputation for a number of variables,
although not all variables, where there is sufficient evidence that imputed data will be of acceptable
quality. However, a final decision about imputation will be made once we’ve received all the data.
Donor imputation finds similar respondents with a response to the variable in question. The
processing system then finds the closest match to the respondent with missing or unidentifiable
data and imputes the donor respondent’s response. This method of imputation uses the CANCEIS
(Canadian census edit and imputation system) developed by Statistics Canada and used in their
census. The system is based on the Nearest-neighbour Imputation Methodology (NIM) and was first
used to perform edit and imputation on census data.
Administrative data imputation uses information provided by the respondent available in other
datasets (eg health or education datasets) and imputes a response based on this information.
112018 Census: Changes and how they might affect the data
Changes and their effect on each variable
Here are possible implications for each of the 2018 Census variables of the changes we’ve made to
various aspects of the census.
The variables in this chapter are ordered by priority.
Prioritisation of variables
We applied one of three levels of priority to each variable, based on the 2018 Census data quality
management strategy.
Priority 1 variables include those that are the highest priority in terms of quality, time, and resources
across all phases of the census. These variables are core census output variables and contribute to
population and dwelling counts as well as provide the necessary data for electoral purposes. On the
online census form, priority 1 variables are mandatory questions, , while priority 2 and 3 are
optional.
Priority 2 variables contribute to data that is of high interest to the public and is closely linked to the
main purpose of the census.
Priority 3 variables are important to certain groups and result in information that can only be
collected from are a census.
As well as assigning a priority level, we gave each variable a change rating (minor, moderate, or
major) for real-world change and for the data collection changes (including questionnaire/concept
changes and processing changes).
Note: the changes in this chapter are indicative, based on what we knew before analysing the 2018
Census data.
Age / Date of birth
Moderate real-world change, minor data collection change
Priority 1 variable
There are few significant changes from 2013 to the way age is being processed, but no changes to
the content collected. Age is needed for population estimates, and as such is a high priority variable
and where necessary it will be imputed. Imputation was also used in 2013 and a similar approach is
being used in 2018.
We will take age data from the dwelling form if it is missing from the individual form, but available
on the dwelling form. Failing this, we will use donor imputation. An edit is planned to ensure that if
any other information is provided an imputed age cannot be possible.
Imputation
Imputation will not be required for forms completed online as date of birth is a mandatory field.
However, field officers will not be checking paper forms for completion so some non-response items
on paper forms will need to be corrected with imputation.
122018 Census: Changes and how they might affect the data
Collection methodology
A new collection model was implemented in 2018, with a digital-first approach, with specific
targeted strategies to engage hard-to-reach populations. We do not yet know the impact of the
changes to the collection methodology on different age groups – there may be some impact on the
data as a result.
Real-world changes
It is expected that the shifts we observe in the age make-up of the New Zealand population in 2018
will be as a result of real-world changes. It is expected that the proportion of 15–39-year-olds and
65+ year-olds will rise due to an increase in migration and an ageing population, respectively. We
expect to see fewer 0–14-year-olds as the birth rate continues to be low, and a lower proportion of
those aged 40–64 as there are fewer migrants in this age group compared to the 15–39-year-old
population.
Sex
Priority 1 variable
Moderate real-world change, minor data collection change
Like age, sex is a high priority variable and has remained largely unchanged from 2013 in order to
maintain a reliable time-series for analysis. There have been no content or processing changes in the
sex question from 2013. The imputation approach used in 2013 will be employed for the 2018
census, however due to the attention the sex variable has attracted in the lead up to the 2018
census, there may be an increased use of the imputation method.
Responding to intersex
As there is no intersex or indeterminate option in 2018, intersex respondents who contact Stats NZ
will be advised that they can request a paper form and tick both male and female. These responses
will kept to facilitate future analysis of these responses, however, they will be imputed to male or
female — the same process that occurred in 2013.
Imputation
In general, where the sex variable is missing, imputation for sex will is planned to have a similar
approach for age. Sex will be taken from the dwelling form if information is available. If information
from the dwelling form is unavailable, sex will be derived from name, if possible. Failing these two
approaches, donor imputation will be used.
It is predicted that changes to the sex make-up of the 2018 population will largely be driven by real-
world events. However, we are expecting to see minimal change from the 2013 data.
Usual residence
Priority 1 variable
Moderate real-world change, minor data collection changes
Usual residence is a priority 1 variable, with minimal change in content since the 2013 Census. The
main changes are to do with the statistical geographies used. There are also some changes to how
132018 Census: Changes and how they might affect the data
respondents will experience the online form. These changes should improve the quality of responses
we receive from those using the online form, and with 70 percent of the population expected to use
the online form, the overall quality should improve. A similar approach to imputation for missing
items will be used as was applied in the 2013 Census.
New geographies
A new statistical geography, the Statistical standard for geographic areas 2018 (SSGA18), has been
developed, and replaces the 1992 standard which was published as the New Zealand Standard Areas
Classification 1992 (NZSAC92). Meshblocks remain as the lowest level of geographical area for
census data outputs including for usual residence outputs.
SSGA18 has new statistical geographies – statistical area 1 (SA1) and statistical area 2 (SA2) and
urban and rural areas built up from meshblocks. The new statistical area 1 has no equivalent in the
NZSAC92 classification, SA2 statistical areas replace area units, and there is a new urban and rural
area classification. SSGA18 will be used for publishing 2018 Census geographical outputs.
Geographical output data from the 2006 and 2013 censuses will be rebased on the new geographies
so comparisons across time of geographical outputs derived from the usual residence variable
shouldn’t cause issues with data quality.
Online optimisation
The online form has undergone significant redevelopment in the lead up to the 2018 census with the
aim of ensuring a good respondent experience and utilising available technologies to improve data
quality. Respondents were asked to confirm their census night address linked to their access code.
Once they confirmed the address, they could refer to this address when answering the usual
residence question. If the address is different from the one where they were on census night they
were able to start typing the address and then select from an as-you-type list. We are expecting
these development changes will improve the quality of responses for responses collected online.
Imputation
In 2013, we only used imputation when geocoding of usual residence on the paper or internet form
to the Census Dwelling Frame failed. The same method is planned to be employed in 2018, and we
expect geocoding success rates to be between 95 and 98 percent. In cases where a valid address is
not given, and geocoding fails, imputation will be used based on the approach taken in 2018. An
address from the dwelling form will be imputed if possible, failing this donor imputation will be used.
Real-world changes
We expect very little of the change in the data in 2018 to arise from changes to census processes or
methodology. We expect there will be some real-world changes, for example growing populations of
usual residents in Auckland, Waitemata, Selwyn, and Queenstown-Lakes, accompanied by declines
in Grey, Wairoa, and Buller districts.
142018 Census: Changes and how they might affect the data
Census night address
Priority 1 variable
Moderate real-world change, minor data collection change
As well as asking about usual residence address, the census asked about what address respondents
were at on census night. This question has not changed since the 2013 Census. While the concept
has not changed, there have been changes to how the information is collected in the online census
form. As we expected, the majority of respondents to complete their census online, we expect some
mode effect on the data. However, we expect the online uptake to result in higher quality data.
Online optimisation
Respondents who completed their census online were asked to confirm the address they are
presented with (which is linked to their unique access code) is their census night address. If the
address is incorrect they are able to enter the correct address. An as-you-type address field is
enabled to help respondents to enter the correct address, if required.
Geographical output data from the 2006 and 2013 censuses will be rebased on the new geographies
so comparisons across time of geographical outputs derived from the census night address variable
shouldn’t cause issues with data quality.
Ethnicity
Priority 1 variable
Moderate real-world change, minor data collection change
Ethnicity is a high priority variable due to its importance for many of our customers and data users.
The ethnicity concept or question has not changed since the 2013 Census, although with the
modernised census approach there have been changes to the collection methodology and
processing which may have an impact on the data series.
Online optimisation
In particular, the design of the online form is expected to improve the quality of data we receive
from respondents. As ethnicity is a priority 1 variable, respondents using the online form were
required to answer the question before they could submit their census form. Additionally, there was
as-you-type functionality for typing in an ethnicity. We anticipate that this will result in fewer non-
identifiable response and more detailed ethnic group responses.
The paper form had no such checks, and field collectors were not checking paper forms for
completeness. This may lead to a decrease in the quality of responses on the paper forms. However,
as we expect a 70 percent online uptake, the decrease in quality from paper responses should be
mitigated by the improvements in the online collection.
Imputation
Imputation is planned in 2018 with the aim of improving data quality. The imputation method in
2018 will use a combination of administrative data and donor imputation to assign one or more
ethnicities to a missing response. Where possible, missing ethnicities will be found using an
administrative dataset (IDI). As the IDI is likely to only record high level or level 1 ethnic groupings,
152018 Census: Changes and how they might affect the data
where the IDI produces a level 1 ethnicity response, donor imputation will only consider donors with
the same high level ethnicities.
It is expected that this imputation method will produce higher quality, and more detailed ethnicity
data than in previous censuses.
Collection methodology
Some significant changes to the collection methodology in 2018 may have an impact on the data. In
response to the changing collection methodologies, we are carrying out targeted response strategies
to encourage groups who have traditionally had high levels of non-response in the census to
complete their census forms. These targeted groups include Māori and Pacific populations.
Targeted strategies for the 2018 Census were designed to reduce the differences in response rates
between Māori and Pacific populations and the general population. A successful targeted strategies
campaign is likely to result in an increase in the proportion of respondents who are of Māori and/or
Pacific ethnicity. If this happens, it is likely that the census data will be more in line with Stats NZ
population projections and the Post Enumeration Survey (PES) results.
Real-world changes
Aside from an expected increase in the proportion of the population reporting that they are Māori
or Pacific ethnicity, we expect the proportion of the European population will decline slightly from
2013 and an increase in both Asian and Middle-Eastern, Latin American and Africa (MELAA)
populations. These changes are expected to come about as a result of real-world changes.
Māori descent
Priority 1 variable
Minor real-world change, moderate data collection change
We expect a significant increase in data quality for the Māori descent variable. The Māori descent
variable typically has a very high non-response rate. In the 2013, non-response for this variable was
about 10 percent.
Māori descent question was made a mandatory question for online respondents; respondents were
not be able to progress until they answered the question. There were no such checks on the paper
form and the extensive test of the census form in Whanganui in April 2017, demonstrated a
moderate non-response on the paper form, although at 2 percent it was much lower than the 2013
Census.
The only change to the Māori descent question was in the ordering of the response categories.
There are three possible responses to the question about Māori descent: ‘yes’, ‘don’t know’, and
‘no’. In 2013, the order of options was ‘yes’, ‘no’, and ‘don’t know’. In 2018, the ‘no’ and ‘don’t
know’ options were switched. The reason for this change was primarily a decision related to the
routing associated with this question. The change in routing should have no impact on the data for
this variable.
162018 Census: Changes and how they might affect the data
Online optimisation
As we expect approximately 70 percent of respondents to complete the census online, where Māori
descent is a mandatory question, we expect to see some substantial changes to the data. We expect
the proportion of ‘not stated’ to decline. It is difficult to estimate, but based on the proportion of
non-responses on the paper forms in 2013, the rate of non-response could reasonably be something
like three to four percent.
We expect that as a result of not allowing respondents to skip the Māori descent question on the
primary mode (the online form), we will see an increase in the proportion of the population
answering ‘no’ to the Māori descent question. In the 2013 Census, 95 percent of respondents who
did not answer the Māori descent question also gave no iwi information. It is supposed that
respondents who are not of Māori descent feel that the question is not applicable to them and skip
this and the iwi question. As a result of the increase in ‘no’ responses to the question we expect to
see a decrease in the proportion of respondents indicating that they are of Māori descent.
Imputation is planned to resolve these residual categories (including non-responses). For electoral
purposes, imputation is planned for residual categories (non-response and response unidentifiable)
and for ‘don’t know’ responses. Imputation will use, in order, the response to the 2013 Census,
Department of Internal Affairs birth records, if the respondent answered the iwi question, and lastly
if the respondent indicated Māori ethnicity in the 2018 Census.
Iwi affiliation
Priority 2 variable
Moderate real-world change, moderate data collection change
The iwi variable collected in census has undergone some significant changes since the 2013 Census.
The iwi question asked in 2018 is similar to what was asked in 2013. In 2013, the English and
bilingual forms asked respondents to list their ‘iwi’ and ‘rohe’. In 2018, the English form asks for ‘iwi’
and ‘region’ while the bilingual form asks for ‘iwi’ and ‘rohe’. We expect that the English form may
result in respondents entering regions more in line with Stats NZ geographies (eg Northland), while
on the bilingual form we may get ‘rohe’ responses akin to Māori electorate boundaries (eg Te Tai
Tokerau).
In 2006 and 2013 respondents completing the iwi question could refer to a list of iwi on the back of
the individual form. In the 2018 Census the list of iwi for those filling the paper form will be on a
separate sheet of paper (at the back of the guide notes), adding burden to some respondents.
However, experience was optimised for online respondents, including an as-you-type list for the iwi
question. When a respondent starts typing in an iwi, the response field generates possible
suggestions from the Stats NZ iwi classification in a drop-down list, which respondents select from
the list or write in a response if they choose. We expect that the use of the as-you-type function will
improve the quality of responses.
Changes to the classification
The most significant change since the 2013 Census is the changes to the iwi classification Stats NZ
uses. The updated iwi classification was released in September 2017 with 33 new iwi added to the
classification. The changes to the iwi classification will likely impact on the number recorded in each
iwi.
172018 Census: Changes and how they might affect the data
It is difficult to predict how the new classifications will change the distribution of respondents across
iwi. We expect the number of respondents that know at least one of their iwi to increase as the
population of Māori descent increases. In 2013, 83 percent of respondents to the Māori descent
question reported at least one iwi, and we expect the 2018 census data to be comparable.
We expect that the largest iwi will continue to be the largest iwi, despite the likelihood of losing
members to smaller iwi that were previously classified as part of them.
Collection methodology
The new collections approach, with targeted strategies encouraging Māori to engage in the census,
may lead to an increase in the numbers of respondents reporting that they belong to one or more
iwi. In particular areas such as the Far North, Whangarei, Rotorua, and Gisborne are targeted
response areas and have higher proportions of Māori than New Zealand on average.
Birthplace
Priority 2 variable
Moderate real-world change, minor-moderate data collection change
Country of birth has been collected in previous censuses. The question has changed slightly – no
longer asking for the current or present name of the country where the respondent was born. This
change could have a small impact on the data for countries that had a former name or border
changes. We expect the impact to be small, given the number of cases this is likely to affect,
although this will something we will check during evaluations.
Imputation
Where possible, imputation is planned for the birthplaces variable when a respondent’s intention is
not clear or there is no response. Responses will be imputed from administrative data from the 2013
Census, Department of Internal Affairs’ births data, or Ministry of Business, Innovation and
Employment data on recent arrivals. The impact of imputation will largely depend on where the non-
respondents were born.
There have been no other significant changes to the processing system.
Real-world changes
We expect moderately significant changes to the real-world data due to the relatively high levels of
immigration in the last five years since the 2013 Census. We expect that the proportion of
respondents born in New Zealand will decrease from the 2013 Census. The proportions of
respondents in born all other regions is expected to increase with the possible exception of those
born in Australia.
Usual residence one year ago
Priority 2 variable
New question, so no real-world change or data collection change
‘Usual residence one year ago’ is a new variable for the 2018 Census. Previously the census asked
about the usual residence respondents lived at five years ago. We expect there to be some
182018 Census: Changes and how they might affect the data
similarities in the patterns we observe in the data between the usual residence one year ago and five
years ago.
Non-response and respondent burden
In the 2013 Census, the non-response rate for the usual residence five years ago was 3.5 percent.
The usual residence five years ago question was accompanied by a significant amount of respondent
burden, likely contributing to the non-response rate. The respondent burden was part of the
decision to ask usual residence one year ago instead of five years ago. We predict this change will
lower the non-response rate for this question.
We expect the distribution of data to be similar to the 2013 Census data for usual residence five
years ago, although we expect a higher proportion of respondents to be living in the same residence
one year ago compared to five years ago. We expect that younger people, particularly those aged 15
to 29, will be less likely to live in the same residence one year ago when compared to older people.
Differences by age
People aged under 15 years will likely have a similar mobility pattern to their parents’ cohort (30 to
64 years). In 2013, the proportion of young people aged 15 and under who were not born five years
ago was 36 percent, clearly the proportion of this group not born one year ago will be much lower,
with those aged between 1 and 5 years distributed between living in the same usual residence one
year ago, somewhere else in New Zealand, and overseas.
We decided not impute responses to the usual residence one year ago question in the 2018 Census.
Legally registered relationship status
Priority 2 variable
Minor real-world changes, minor data collection changes
The 2018 Census collected information on legally registered relationship statuses. Legally registered
relationship status differs from social marriage, and excludes de facto couples, unless respondents
have been previously legally married.
The legal relationship status question has not changed since the 2013 census, and the way the data
is processed for this variable has not had any significant changes.
We expect that there will be some movement in the data for legally registered relationship status as
a result of real-world changes. Fewer people are getting married, meaning a larger proportion of
respondents are likely to report they have never been married. We also expect the proportion of
people reporting that they are divorced and separated will decline, at least in part as a result of the
declining marriage rate.
Partnership status in current relationship
Priority 2 variable
Minor real-world change, minor data collection change
The variable ‘Partnership status in current relationship’ is derived from the living arrangements
question and the legally registered relationship status questions. While there has been a small
change to the living arrangements question – opposite sex and same sex civil union partners and de
192018 Census: Changes and how they might affect the data
facto partners are now collected in the same category as legal husbands and wives – partnership
status will be output in primarily the same manner as in 2013.
Derivation
As a result of the change to the living arrangements question, we had to change the derivation used
in 2013. We do not expect that this will have a significant impact on the data quality.
Imputation is not being used for this variable in 2018.
Real-world change
Real-world changes in partnering are expected to the most salient change in this variable since 2013
(with the absence of significant data collection changes). While the real-world changes are the most
significant change to this variable, the changes we expect to see are likely to be relatively minor and
in line with trends seen over previous censuses. It is expected that rates of marriage will continue to
decline slightly, while the rates of those who are partnered but not married are likely to increase.
Civil union partnerships have previously made up a very small proportion of all partnerships (0.2
percent in 2013), and this is likely to decline slightly with the legalising of same-sex marriage.
Household composition, family type, extended family type, and
child dependency status
Priority 2 variable
Minor real-world change, major data collection change
Household composition, family type, extended family type, and child dependency status are a set of
variables to describe the relationships between individuals within the household. These variables are
derived from two questions in the dwelling form and one question on the individual form, see figure
1.
While household status, family type, extended family type, and child dependency status are the
main variables derived from these questions, other outputs are derived, including number of
children in a household and adult children.
The derived variables have not changed since the 2013 Census, nor have the questions used to
derive these variables. The way the variables are derived has changed.
Processing system changes
We made some significant changes to the processing system in the 2018 Census. Previously, the
processing system assigned each individual within a household four values according to their
position and role in the household. The combination of these values, along with age, sex, and work
and labour force status in some cases, were used to derive a household composition. If applicable,
family type and extended family type and child dependency status were derived using the same
values.
In the 2018 Census processing system, households are arranged in to matrices in order to determine
their household composition, family and extended family type, and child dependency status. The
new approach uses a similar approach to other Stats NZ household surveys.
202018 Census: Changes and how they might affect the data
Figure 1
1. Household composition, family type, extended family type and child dependency status questions, dwelling form and individual form, 2018 Census
Household composition, family type, extended family type and child
dependency status questions, dwelling form and individual form, 2018 Census
Imputation
We plan to use imputation, as it is often not possible to determine all the relationships in the
household with the information provided by the respondents alone. In these cases donor imputation
will be used to fill information that is missing from the household, though this will not override the
information provided by the household.
212018 Census: Changes and how they might affect the data
The change to the processing system is significant for the family and household variables – they have
the potential to impact on data quality. Before we implemented the changes, we ran the 2013
Census data through the new processing system. The data from the new system looks comparable to
the data generated from the 2013 processing system.
There are unlikely to be any significant real-world changes to the derived variables. It appears that
the number of ‘couples without children’ is increasing in size and proportion, and numbers of
‘couples with children’ and ‘single parents with children’ are declining. However, these changes are
slow and are continuing in line with previous censuses.
Main means of travel to education and Educational institution
address
Priority 2 variable
New question, so no real-world change or data collection change
‘Travel to education’ and ‘Educational address’ are new variables for the 2018 Census. It is therefore
difficult to predict how this question will be answered by respondents, and what, if any, issues there
may be. The two tests run before the 2018 Census (one in 2016 and one in 2017) as well as
information from the ‘travel to work variable’ can give some insight into how the new approaches to
collection and processing may affect these variables. See figure 2 for questions from 2018 Census
form.
Figure 2
2. Travel to education and educational address questions, 2018 Census
Travel to education and educational address questions, 2018 Census
In the 2018 Census, we expect that most respondents will complete their census form online and
that the responses from the online form will be of higher quality than those from the paper form
particularly as multiple responses are not possible online. In Census test 2017 the majority of
responses that could not be coded were multiple responses with the predicted high uptake in the
online mode for the 2018 Census, we expect that the amount of data in ‘not elsewhere included’
(which is made up of response unidentifiable and not stated) will be quite minimal, and perhaps
lower than seen previously for the travel to work question.
222018 Census: Changes and how they might affect the data
Imputation
Where there is no response to the travel to education question, we plan to use donor imputation.
This is expected to further minimise the amount of response unidentifiable or non-response.
The 2018 Census also collected the address of the educational institute. Respondents were asked to
provide as much detail as possible. We expect some differences in data quality between the paper
and online forms for this data as the online form has an as-you-type list to help respondents
complete this question accurately.
Imputation for educational institution address will also be done (using the donor method). This is
expected to help minimise the amount of data in the ‘not elsewhere included’ category.
Highest secondary school qualification
Priority 2 variable
Minor real-world change, minor data collection change
The 2018 Census asked respondents about their highest secondary school qualification, as part of a
suite of questions that aims to understand the qualifications of people living in New Zealand. The
highest secondary school qualification variable has undergone only minor change since the 2013
census. As a result, we expect changes to the way the information is collected and processed will
have little impact on the data.
We expect that the shift to online as the primary mode will improve the data quality. For
respondents whose qualifications are not included in any of the tick box options, there will be an as-
you-type list which we expect will improve the quality and usability of responses. Those aged over
75 years are less likely to respond to this question than other age groups. The propensity for older
age groups to miss or skip this question, combined with their higher likelihood of completing the
questionnaire on paper, may mean that there is a substantial difference in non-response rates for
paper and online modes.
Imputation
Imputation is planned to rectify non-response for this variable. Administrative data held by Ministry
of Education is of high quality for those who have gained New Zealand qualifications since 2001.
Administrative and historic data from the 2013 census will be used, taking the highest qualification
from the Ministry of Education and 2013 Census datasets. As the Ministry of Education dataset was
last updated in December 2016, this will not be an issue for the majority of people who have not
studied in the period between the start of 2017 and census day but we recognise we could miss a
qualification gained in 2017. We assessed the risk of this to the data to be small.
Real-world change
We expect the majority of change will be as a result of real-world change, with an expected increase
in the proportion of high school qualifications gained overseas, and an overall increase in the
proportion of the population with some high school qualification, particularly amongst young people
where more young people are getting high school qualifications.
232018 Census: Changes and how they might affect the data
Post-school qualification
Priority 2 variable
Minor real-world change, moderate/major data collection change
Related to the highest secondary school qualification variable, and part of the suite of questions
around educational attainment referred to Highest secondary school qualification section, is the
post-school qualifications variable. The post-school qualification has undergone significant revision
in order to minimise the burden to respondents, as well as improving the quality of the data. Figure
3 compares the 2013 and 2018 census questions.
Figure 3
3. Post-school qualifications questions, 2013 and 2018 censuses
Post-school qualifications questions, 2013 and 2018 censuses
2013 Census 2018 Census
The most significant and notable change is the move from asking respondents to report their
qualification in a free-text box, to allowing the majority of respondents to simply tick an option, with
a free text box if necessary with a question to indicate whether they gained the qualification in New
Zealand or overseas.
242018 Census: Changes and how they might affect the data
Changes as a result of 2013 Census quality issues
The quality of data collected in the 2013 census was only of a moderate quality, with a relatively
large number of responses coded to unidentifiable. An example noted from 2013 was if respondents
entered ‘Diploma’ in to the qualification box, it was difficult to determine whether this is a level 5 or
6 diploma. Thirteen percent of responses collected in 2013 were residuals, which included
unidentifiable responses and non-responses. We expect that the changes to the 2018 Census
question will reduce the level of residuals.
We expect that the majority of respondents, approximately 70 percent, will complete their census
online. We expect that the online mode will improve the quality of responses, particularly as
respondents cannot select more than one qualification.
As with the question about high school qualifications, older age groups are less likely to respond to
this question. There is some evidence that older age groups, possibly because they are not familiar
with the New Zealand Qualifications Authority (NZQA) qualifications, give responses that are unable
to be coded at a higher rate. We tried to navigate this issue with the as-you-type list online, with the
extensive list of synonyms that may be more familiar to respondents. However, as older people are
more likely to complete their census on paper, responses for older populations, particularly those
aged 65 and over, may be of poor quality.
Real-world change
We expect proportions of respondents with post-school qualifications and the types of qualifications
to change as a result of real-world changes. Data from previous censuses indicates that we may
continue to see an increase in the proportion of the population with some post-school qualification.
We expect the most common qualification will continue to be a bachelor’s degree and level 7
qualification, and we expect the prevalence to increase from the 14 percent of the population in
2013.
We expect to see an increase in post-school qualifications across all age groups from the 2013
census. The exception to this may be the 15–19-year-old age group, as respondents are encouraged
to stay in school as long as practicable.
Field of study
Priority 2 variable
Minor real-world change, Moderate data collection change
The field of study variable relates to the subject of the respondents highest qualification. The
concept asked has not changed since the 2013 Census, however the way the question is asked is
different. In 2013 field of study was asked with the post-school qualification question, with
respondents asked to report their qualification and the subject the qualification was gained in, see
figure 4.
25You can also read