APERC Gas Report 2018 - Asia Pacific Energy Research Centre
←
→
Page content transcription
If your browser does not render page correctly, please read the page content below
APERC Gas Report 2018

           i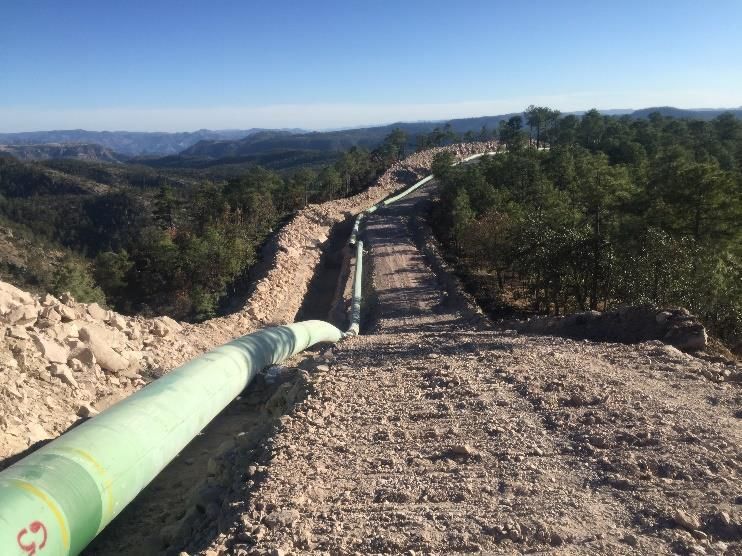
APERC Gas Report 2018

PUBLISHED BY:
Asia Pacific Energy Research Centre (APERC)
Institute of Energy Economics, Japan
Inui Building, Kachidoki 11F, 1-13-1 Kachidoki
Chuo-ku, Tokyo 104-0054 Japan
Tel:    (813) 5144-8551
Fax:    (813) 5144-8555
E-mail: master@aperc.ieej.or.jp (administration)
Website: http://aperc.ieej.or.jp/

©2018 Asia Pacific Energy Research Centre

                                                   ii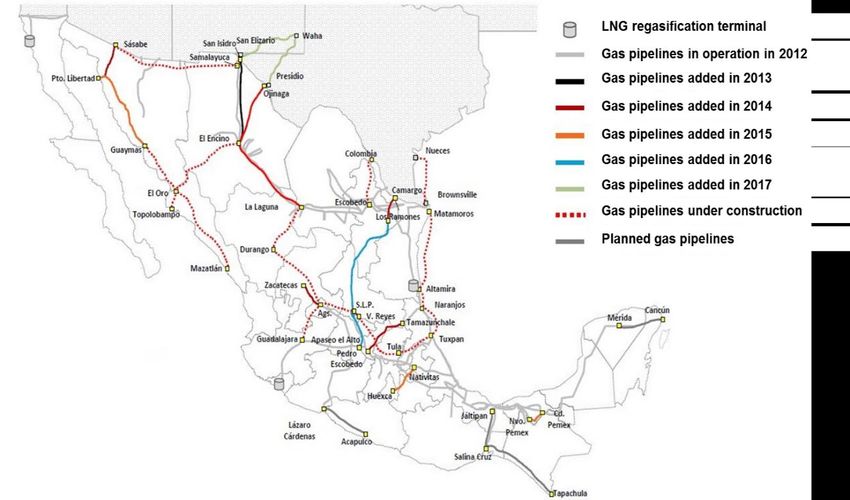
APERC Gas Report 2018

Foreword
Demand for natural gas has been growing globally over the past decade. This growth has
been at even faster rates in the APEC region. The fact that natural gas produces less pollutant
emissions than other fossil fuels, amid growing concerns on climate change and de-
carbonisation, has reflected positively on gas consumption. Moreover, the so-called shale
revolution is impacting the gas sector well beyond the border of North America, and is
expected to continue this trend.

The release of this first edition of the APERC Gas Market Report reflects both the ongoing
importance of gas to the APEC region and the state of flux the sector currently finds itself in.
This report is part of the first series of APERC Reports, along with the Coal Report 2017 and
Oil Report 2018. Fossil fuels, and in particular gas, are still an important pillar of the power
and industry sectors and will remain a sizable component of the energy mix in most APEC
economies for many years to come.

I would like to express my sincere gratitude to the authors and contributors for their time
and effort in writing and publishing this report. However, I would also like to note that the
views expressed in this paper are those of the authors and not necessarily of APERC.

Takato OJIMI

President

Asia Pacific Energy Research Centre

April 2018

                                               iii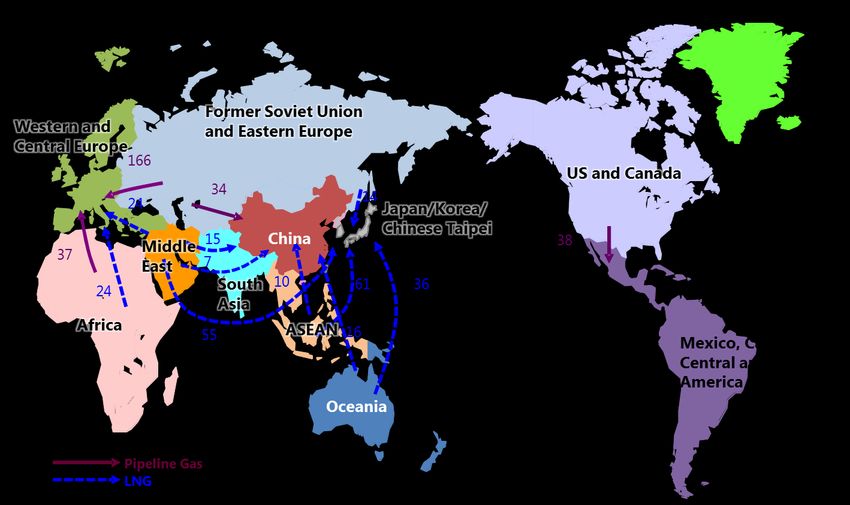
APERC Gas Report 2018

Acknowledgements
We are grateful for the full support and insightful advice from Expert Group on Clean Fossil
Energy members. We also wish to thank the administrative staff of APERC and IEEJ, as this
study could not have been completed without their assistance.

Authors and contributors

         APERC:       James M. KENDELL ● Diego RIVERA RIVOTA

         IEEJ:        Yoshikazu KOBAYASHI ● Hiroshi HASHIMOTO ● Koichi UENO ●

                      Yosuke KUNIMATSU ● Hideo SAKODA ● Kimiya OTANI

Editor

         Diego RIVERA RIVOTA

                                             iv
APERC Gas Report 2018
Contents
Foreword ............................................................................................................................................iii
Acknowledgements ..........................................................................................................................iv
Abbreviation and Acronyms ....................................................................................................... vii
List of Figures .................................................................................................................................. viii
List of Tables ......................................................................................................................................ix
Summary and key trends ................................................................................................................. 1
Section 1: Gas Demand .................................................................................................................. 3
1-1. World and APEC Natural Gas Demand .......................................................................... 3
1-1-1 Overview .......................................................................................................................... 3
1-1-2 United States ................................................................................................................... 4
1-1-3 Russia ............................................................................................................................... 4
1-1-4 China ................................................................................................................................ 4
1-1-5 Japan ................................................................................................................................ 6
1-1-6 Korea ................................................................................................................................ 6
1-2 World LNG Demand ............................................................................................................ 7
1-3 Gas Demand Outlook ......................................................................................................... 9
Section 2. Gas Supply................................................................................................................... 12
2-1 World and APEC Natural Gas Supply ............................................................................ 12
2-1-1 Overview ........................................................................................................................ 12
2-1-2 United States ................................................................................................................. 14
2-1-3 Russia ............................................................................................................................. 14
2-1-4 Canada........................................................................................................................... 15
2-1-5 China .............................................................................................................................. 15
2-1-6 Australia......................................................................................................................... 15
2-2 World LNG Supply ............................................................................................................. 16
2-3 Future Outlook ................................................................................................................... 18
Section 3. Gas Trade ..................................................................................................................... 20
3-1 Gas Imports in the World and the APEC region ......................................................... 20
vAPERC Gas Report 2018
3-2 Gas Exports in the World and the APEC region ......................................................... 23
3-3 Gas Trade outlook in the World and the APEC region ............................................. 25
Section 4. Gas Prices ................................................................................................................... 27
4-1 Change in Major Natural Gas Prices of the World .................................................... 27
4-2 Future Outlook ................................................................................................................... 28
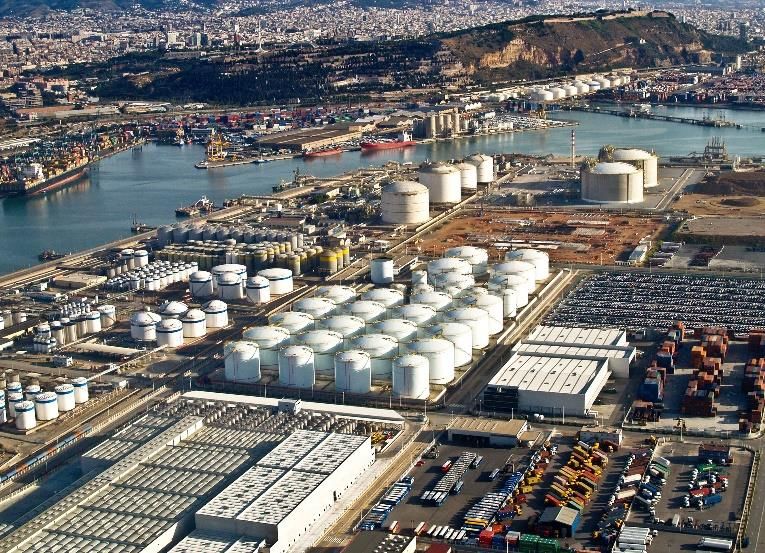
Section 5. Case study: US gas exports to Mexico and Mexico’s gas market reform .... 30
5.-1 Shale Revolution, gas from the US to the World...................................................... 30
5.-2 Mexico’s rapid growing demand facing challenges ................................................. 32
5.-3 Mexico’s energy reform and the birth of a gas market........................................... 35
References ...................................................................................................................................... 39
viAPERC Gas Report 2018
Abbreviation and Acronyms
Abbreviation
Bcm billion cubic metres
GW gigawatts
kWh kilo-Watt hour
Mtoe million tonnes of oil equivalent
Mt million tonnes
USD US Dollar
Acronyms
APEC Asia-Pacific Economic Cooperation
APERC Asia Pacific Energy Research Centre
EIA Energy Information Administration, USA
ESTO Energy Statistic and Training Office, APERC
EU European Union
GDP gross domestic production
IEA International Energy Agency
IEEJ Institute of Energy Economics Japan
NBS National Bureau of Statistics, China
UN Comtrade United Nations Commodity Trade Statistics Database
USA United States of America
USGS United States Geological Survey
viiAPERC Gas Report 2018
List of Figures
Figure 1-1 Natural gas consumption in APEC economies, 2006-2016 ................................................................. 5
Figure 1-2 Changes in natural gas consumption of APEC member economies, 2006-2016 ........................ 6
Figure 1-3 APEC member economies LNG imports, 2006-2013.............................................................................. 8
Figure 1-4 Change in LNG imports of APEC member economies (2006-2016) ................................................. 9
Figure 1-5 Outlook for natural gas consumption in APEC, 2015-2040 ............................................................. 11
Figure 1-6 Outlook for change in natural gas consumption of APEC member economies, 2015-2040 11
Figure 2-1 Natural gas supply of APEC member economies, 2006-2016 ......................................................... 13
Figure 2-2 Change in natural gas supply of APEC member economies, 2006-2016 .................................... 13
Figure 2-3 APEC LNG supply, 2006-2016 ..................................................................................................................... 17
Figure 3-1 Major natural gas trade flows, 2016 ......................................................................................................... 20
Figure 3-2 APEC members’ natural gas imports, 2006-2016 ................................................................................ 23
Figure 3-3 Natural gas exports by APEC members, 2006-2016 ........................................................................... 25
Figure 3-4 Major natural gas trade flows (2030) Reference Scenario ................................................................. 26
Figure 4-1 Trends in major natural gas price indexes, 2015-2017 ...................................................................... 27
Figure 5-1, Total US gas exports (2000-2016, bcf)..................................................................................................... 31
Figure 5-2, Mexico’s Power Generation Fuel Mix (2002-2016, Gwh) .................................................................. 33
Figure 5-3, Mexico’s Gas Demand and Supply (2005-2015, bcm) ....................................................................... 34
Figure 5-4, Mexico’s gas transport network and its additions since 2012 ......................................................... 36
viiiAPERC Gas Report 2018
List of Tables
Table 1-1 APEC member economies natural gas consumption, 2006-2016 ....................................................... 3
Table 1-2 APEC member economies LNG imports, 2006-2016 ............................................................................... 7
Table 1-3 APEC member economies natural gas consumption, 2015-2040 .................................................... 10
Table 2-1 APEC member economies natural gas production, 2006-2016 ........................................................ 12
Table 2-2 APEC LNG exports, 2006-2016 ..................................................................................................................... 17
Table 2-3 APEC economies natural gas supply forecast, 2015-2030.................................................................. 18
Table 3-1 APEC members' natural gas imports, 2016 .............................................................................................. 21
Table 3-2 APEC members' natural gas exports, 2016 .............................................................................................. 24
ixSummary and key trends
World gas demand has grown by 2.2% on average in the past 10 years, while APEC gas
consumption has grown faster, by 2.6% per year on average.
Around 60% of global gas consumption takes place in APEC member economies. In 2006
it was 53%.
The US remains the main gas consumer in the world.
In the last decade, US gas consumption grew by 29% (148 Mtoe) while China’s increased
by 264% (124 Mtoe). They are the largest contributors to the APEC region demand
growth.
World LNG demand has grown by 5.4% on average in the past 10 years, while APEC LNG
imports increased on average by 2.6% per year.
Despite this, APEC LNG demand represented 71% of world imports. China was also the
largest contributor to the APEC region LNG demand growth, followed by Japan.
Worldwide natural gas consumption will increase by an average 1.8% per year, growing
from 2,944 Mtoe in 2015 to 4,550 Mtoe 2040.
APEC gas demand will grow by an average 2.2% per year from 1,663 to 2,854 Mtoe
during the same period.
The US and China will continue to lead gas consumption growth in the APEC region.
The US surpassed Russia in 2012 as the world’s largest producer (shale revolution).
The US and China are the largest contributors to the APEC region production growth.
Conversely, Mexico’s production shrank by 28%, around 12 Mtoe.
World LNG supply has grown by 5.6%, oversupplying the market.
Despite increasing production, APEC LNG exports decreased from 45% of the world’s
exports to 39%.
Australia and Russia contributed31 Mtpa of exports, almost all of the APEC region’s
growth.
World gas imports grew by 2.1% per year from 2006 to 2016.
APEC members’ share of global natural gas imports increased from 35% to 43% in the
last decade.
Only 3 out of 21 APEC members do not trade gas: New Zealand, Viet Nam and the
Philippines.
Japan remains the largest LNG and natural gas importer in the world.
While US imports decreased, it still is the second biggest importer.
Mexico’s imports are growing fast and will probably surpass Korea in the coming years.
1APERC Gas Report 2018
Russia remains the world’s largest gas exporter. In addition, it is building infrastructure
to export to markets other than its traditional destination, Europe.
Canada still exports massive volumes to the US, but they decreased by 18% during the
last decade.
The US more than tripled natural gas exports including pipeline deliveries and LNG
exports.
Australia nearly tripled its LNG exports during the same period.
Possible upward trend in Asian LNG prices as long-term contracts are linked to crude oil
prices, which are expected to gradually rise in the future.
However, there is uncertainty over importing companies, which might want to renew
contracts at lower prices, opting for short-term lower prices or spot contracts.
Despite LNG demand growth, pushed mainly by China, LNG markets will continue to be
oversupplied with new capacity additions.
Because of this, the Asian LNG spot price is forecasted to stay at or below $6/MMBtu,
increasing the gap with long-term contract prices.
Gas prices in Europe have a mixed future. In the short run, prices will have a downward
tendency because of slow demand growth and intensified competition from exporters.
In the mid-term, however, the North Sea’s production decline and demand for power
generation will pressure natural gas prices in Europe, and they will recover to the level
of $7/MMBtu at around 2020.
Gas prices in the United States are expected to be lower in the near future. On the other
hand, the recovery of the oil price might raise development and production costs. The
start of LNG exports on the US Gulf Coast may also add upward pressure on the domestic
price, but prices are expected to remain below $4/MMBtu in the mid-term.
2APERC Gas Report 2018
Section 1: Gas Demand
1-1. World and APEC Natural Gas Demand
1-1-1 Overview
World natural gas consumption has continued to grow by an average of 2.2% per year over the past
10 years since 2006, increasing from 2,421 Mtoe (2,535 Bcm) in 2006 to 3,001 Mtoe (3,142 Bcm) in
2016 (Table 1-1). APEC gas consumption saw larger growth, increasing by an average 2.6% per year
from 1,297 Mtoe (1,358 Bcm) in 2006 to 1,676 Mtoe (1,755 Bcm) in 2016. APEC accounted for 55.9%
of world natural gas consumption, growing by about 2% from 2006 when it accounted for 53.6% of
consumption. The increase in natural gas consumption in APEC member economies is attributable
mainly to the United States and China, with consumption in these economies alone increasing 273
Mtoe (286 Bcm) from 2006 to 2016. This represents about 47% of the global consumption increase
over the same 10-year period.
Table 1-1 APEC member economies natural gas consumption, 2006-2016
Natural Gas Consumption (Mtoe)
Economy 2006 2007 2008 2009 2010 2011 2012 2013 2014 2015 2016
APEC Total 1,297 1,369 1,390 1,372 1,469 1,537 1,582 1,630 1,666 1,663 1,676
Australia 23 26 29 29 28 30 29 30 32 32 33
Brunei 3 3 3 2 3 3 3 2 3 2 2
Canada 79 79 79 78 79 83 83 86 88 87 85
Chile 6 4 2 3 4 5 4 4 4 4 4
China 47 59 68 75 89 110 123 140 154 159 171
Hong Kong 2 2 3 3 3 2 2 2 2 3 3
Indonesia 29 28 30 34 39 36 35 37 37 38 40
Japan 77 83 84 81 86 100 105 106 107 100 101
Korea 29 31 32 32 39 42 45 48 43 39 41
Malaysia 34 35 38 32 31 32 32 38 38 38 39
Mexico 52 51 52 54 54 57 59 62 61 65 66
New Zealand 3 4 3 4 4 3 4 4 4 4 4
Papua New Guinea 0.1 0.1 0.1 0.1 0.1 0.1 0.1 0.1 0.1 0.2 0.2
Peru 2 3 3 4 5 6 7 6 8 8 8
Philippines 3 3 3 3 3 3 3 3 3 3 3
Russia 359 366 366 350 383 396 387 386 385 364 354
Singapore 6 6 7 7 7 7 8 9 9 9 9
Taiwan 9 10 11 10 13 14 13 13 14 15 15
Thailand 27 28 31 29 33 31 35 38 38 38 38
United States 502 543 541 535 556 569 595 606 627 646 650
Vietnam 5 5 6 7 8 8 8 9 9 10 10
World Total 2,421 2,527 2,593 2,536 2,736 2,791 2,842 2,894 2,911 2,944 3,001
APEC Share 53.6% 54.2% 53.6% 54.1% 53.7% 55.1% 55.7% 56.3% 57.2% 56.5% 55.9%
Sources: International Energy Agency (IEA), World Energy Balances 2017; Asia Pacific Energy Research Centre, Energy Balance
Table
3APERC Gas Report 2018
1-1-2 United States
The United States was the largest primary energy consumer in the world as of 2006, but its overall
energy consumption has declined in recent years, and was surpassed by the rapidly growing economy
of China in 2009. In contrast, domestic natural gas production has increased rapidly since 2006 due
to the shale revolution, which drove down gas prices and increased its competitiveness with coal in
the electricity generation sector. Additionally, the Obama administration policies promoting natural
gas as a cleaner energy and regulations on coal-fired power generation encouraged a coal-to-gas
shift as a measure to combat climate change. As a result, the ratio of natural gas in primary energy
consumption rose from 23%, in 2006, to 30% in 2016, with gas consumption increasing by 29%, or
650 Mtoe (681Bcm), compared to 2006. This is equivalent to 20% of global natural gas consumption.
1-1-3 Russia
Russia is the second largest natural gas consumer in the world after the United States. Russia’s power
generation capacity mainly comprises gas-fired power plants that use its abundant domestic
resources. For this reason, reforming the overreliance on natural gas and the power supply and
demand structure have been central issues in energy policy and power development in Russia. By
implementing policies focused on nuclear and coal power generation, Russia reduced the proportion
of natural gas in primary energy consumption from 54% in 2007 to 51% in 2015. Additionally, overall
domestic primary energy consumption also continued to decline because of the economic downturn
from 2012 onwards, which has affected natural gas demand. As a result, gas demand in 2016 was
slightly below the demand level in 2006. Gas consumption has scarcely increased in the last decade.
Russia has recently started new initiatives, such as introducing combined cycle gas turbines (CCGT).
1-1-4 China
Energy consumption in China continues to grow rapidly because of economic development, making
it the world’s largest energy consumer since 2009. Although growth has slowed in recent years, China
consumes approximately 1.4 times more primary energy than the United States, the second largest
consumer. The massive quantity of domestically produced coal is its main source of primary energy,
accounting for more than 60% of energy consumption. However, China’s shift to natural gas enhances
its energy security, combats environmental pollution and reduces CO2 emissions. China has grown to
become the third largest natural gas consumer in the world. Its primary energy consumption share of
natural gas has grown from 2.5% in 2006 to 5.3% in 2015. The Thirteenth Five-Year Plan, announced
in March 2016, sets forth specific numerical targets in its energy consumption, reducing the ratio of
coal in its primary energy consumption to 58% or less and increasing the ratio of natural gas to 10%
4APERC Gas Report 2018
or more in 2020, which is expected to further accelerate the shift to natural gas. The laying of pipelines
is a crucial factor for boosting domestic gas demand. China has recently built, at least, these major
pipelines:
1. The 3,839-kilometer-long West–East Gas Pipeline carrying natural gas from Xinjiang in the
west to Shanghai in the east, in 2005;
2. The 4,978-kilometer-long West–East Gas Pipeline II from Xinjiang to Guangzhou and Hong
Kong, China in 2011; and
3. The 5,220-kilometer-long West–East Gas Pipeline III from Xinjiang to Fuzhou, in 2015.
Figure 1-1 Natural gas consumption in APEC economies, 2006-2016
Source: IEA, World Energy Balances 2017
5APERC Gas Report 2018
Figure 1-2 Changes in natural gas consumption of APEC member economies, 2006-2016
Vietnam
United States
Thailand
Taiwan
Singapore
Russia
Philippines
Peru
Papua New Guinea
New Zealand
Mexico
Malaysia
Korea
Japan
Indonesia
Hong Kong
China
Chile 2011-2016
Canada
2006-2011
Brunei
Australia
-60.0 -40.0 -20.0 0.0 20.0 40.0 60.0 80.0 100.0
(Mtoe)
Source: IEA, World Energy Balances 2017
1-1-5 Japan
Japan is the world’s largest LNG-importer and the fourth natural gas consumer, supplying
approximately 97% of its natural gas demand with imported LNG. Since the 1970’s oil crises, it has
been promoting the use of alternative energies in order to reduce its dependence on imported oil. As
a result, the proportion of oil for power generation has significantly declined while increasing the ratio
of coal, natural gas and nuclear power. This has pushed up the demand for natural gas.
As a consequence of the Great East Japan Earthquake in March 2011, all Japan’s nuclear power plants
were shut down, dramatically increasing the demand for natural gas as a substitute fuel. This has
resulted in a rapid expansion of the natural gas share of primary energy consumption from about 17%
to more than 23%, two years after the earthquake. Consumption of natural gas decreased slightly
after 2015, because of the restarting of the Sendai Nuclear Power Plant and the Ikata Nuclear Power
Plant, as well as the decline in the overall primary energy consumption. Going forward, uncertainty
arises in forecasting gas demand as Japan pushes to restart nuclear power plants and adopt renewable
energies.
1-1-6 Korea
Korea almost totally covers its gas demand with imports. Natural gas consumption has continued to
6APERC Gas Report 2018
grow, but since 2013, the demand for nuclear power, oil, and coal has risen, while gas consumption
has slightly dropped. According to the 12th Long-Term Natural Gas Supply and Demand Plan for 2015
to 2029, gas demand for the residential sector will increase by 2.06% annually, but overall demand is
forecasted to decrease by 4.17% annually with the start of operations of new coal-fired and nuclear
power plants.
However, with the election of President Moon Jae-in in May 2017, who has stated his opposition to
nuclear and coal power, natural gas is expected to grow again as an alternative energy. The 3rd
National Energy Basic Plan, reflecting President Moon’s energy pledge, is expected to be formulated
in 2018.
1-2 World LNG Demand
World LNG imports increased by an average 5.4% per year from 131 million tons per annum (Mtpa),
in 2006, to 222 Mtpa, in 2016. APEC LNG imports were below the world’s growth rate, increasing by
an average 4.8% per year from 99 Mtpa in 2006, to 158 Mtpa in 2016. In addition, APEC accounted
for 71.3% of global LNG imports in 2016, with the majority of these volumes produced within the
APEC region. However, APEC’s LNG demand as a share of global demand has decreased by about 4%
compared with 75.5% in 2006. This means that LNG demand outside APEC is increasing, for example
in India, Pakistan and Bangladesh.
Table 1-2 APEC member economies LNG imports, 2006-2016
LNG Import (Mtpa)
Economy 2006 2007 2008 2009 2010 2011 2012 2013 2014 2015 2016
APEC Total 99 110 107 107 126 143 145 158 156 150 158
Australia 0 0 0 0 0 0 0 0 0 0 0
Brunei 0 0 0 0 0 0 0 0 0 0 0
Canada 0 0 0 1 1 2 1 1 0 0 0
Chile 0 0 0 0 2 2 3 3 2 2 3
China 1 3 3 5 8 10 13 15 17 17 21
Hong Kong 0 0 0 0 0 0 0 0 0 0 0
Indonesia 0 0 0 0 0 0 0 0 0 0 0
Japan 57 62 62 60 64 75 79 80 80 75 76
Korea 23 23 26 23 30 32 33 37 34 30 31
Malaysia 0 0 0 0 0 0 0 4 3 3 2
Mexico 1 2 2 2 4 2 3 5 5 7 8
New Zealand 0 0 0 0 0 0 0 0 0 0 0
Papua New Guinea 0 0 0 0 0 0 0 0 0 0 0
Peru 0 0 0 0 0 0 0 0 0 0 0
Phillippines 0 0 0 0 0 0 0 0 0 0 0
Russia 0 0 0 0 0 0 0 0 0 0 0
Singapore 0 0 0 0 0 0 0 1 1 1 1
Taiwan 7 7 8 8 10 11 10 10 11 12 12
Thaliand 0 0 0 0 0 1 1 1 1 1 2
United States 11 14 6 8 8 6 3 2 1 1 1
Vietnam 0 0 0 0 0 0 0 0 0 0 0
World Total 131 141 140 156 190 209 206 205 206 212 221
APEC Share 75.5% 78.2% 76.3% 68.8% 66.4% 68.1% 70.7% 77.0% 75.7% 70.8% 71.3%
7APERC Gas Report 2018
Source: IEA, World Energy Balances 2017; Cedigaz, Natural Gas in the World
In 2006, there were six APEC member economies importing LNG; this number increased to 11 in 2016.
By volume, Japan, Korea and China account for most of the LNG imports among APEC member
economies, with these three economies importing 128 Mtpa of LNG in 2016. This is equivalent to 58%
of worldwide LNG imports and 81% of APEC LNG imports.
Demand for natural gas in China is growing rapidly. As domestic production is not enough to meet
demand, China continues to import gas via pipeline and LNG. In 2016, 67.2% of natural gas demand
was supplied with domestic production, 16.4% with LNG imports and 16.4% with pipeline imports.
The first domestic LNG receiving terminal in China began operation in 2006, and 13 LNG receiving
terminals have begun operations in the past decade. It is expected that natural gas demand will
increase in the future, and more regasification terminals are planned.
The United States, once a net LNG importer, has seen an annual decline in the amount of imported
LNG because of the increase in domestic natural gas production. In 2016, exports from Sabine Pass
LNG began and have been growing rapidly. Like the United States, Canadian production of
unconventional gas has progressed, but while the Canaport LNG receiving terminal began operation
in 2009, it only imported LNG from 2009 to 2013. There are several LNG export projects currently
being considered on the Canadian west coast that have their eyes set on the Asian LNG market.
Figure 1-3 APEC member economies LNG imports, 2006-2013
Source: IEA, World Energy Balances 2017; Cedigaz, Natural Gas in the World
8APERC Gas Report 2018
Figure 1-4 Change in LNG imports of APEC member economies (2006-2016)
Vietnam
United States 2011-2016
Thaliand 2006-2011
Taiwan
Singapore
Russia
Phillippines
Peru
Papua New Guinea
New Zealand
Mexico
Malaysia
Korea
Japan
Indonesia
Hong Kong
China
Chile
Canada
Brunei
Australia
-10 -5 0 5 10 15 20
(Mtpa)
Source: IEA, World Energy Balances 2017; Cedigaz, Natural Gas in the World
New Zealand, The Philippines and Viet Nam are the only APEC economies that do not trade natural
gas. However, the two latter economies are planning the construction of LNG receiving terminals. The
Philippines is expected to start imports around 2019 and Viet Nam after 2020. Australia became the
world’s second largest LNG exporter in 2016. Three LNG export projects in eastern Australia have
started operations. However, this has caused a shortage of natural gas and high prices for the
domestic market in this Australian region. To counter the shortfall, AGL Energy, an Australian electricity
and gas company, is considering the construction of a floating LNG receiving terminal near Melbourne,
Victoria, aiming to start construction in 2019 and begin operations in 2020.
1-3 Gas Demand Outlook
According to the Asia Pacific Energy Research Centre’s (APERC) APEC Energy Demand and Supply
Outlook 6th Edition, worldwide natural gas consumption will increase by an average 1.8% per year,
growing from 2,944 Mtoe (3,082 Bcm) in 2015, to 4,550 Mtoe (4,763 Bcm) in 2040. APEC gas demand
is expected to increase by an average 2.2% per year from 1,663 (1,741) to 2,854 Mtoe (2,988 Bcm)
during the same period.
9APERC Gas Report 2018
Table 1-3 APEC member economies natural gas consumption, 2015-2040
Natural Gas Consumption (Mtoe) 2015-2040
Economy 2015 2020 2030 2040 Change Change %
APEC Total 1,663 2,014 2,429 2,854 1,191 71.6%
Australia 32 35 42 51 18 57.2%
Brunei 2 3 4 4 2 94.6%
Canada 87 95 114 128 41 46.9%
Chile 4 5 6 7 3 86.7%
China 159 320 489 610 452 285.0%
Hong Kong 3 3 5 7 4 157.0%
Indonesia 38 54 81 118 81 212.9%
Japan 100 95 90 102 2 1.6%
Korea 39 53 58 61 21 53.9%
Malaysia 38 40 49 58 20 53.4%
Mexico 65 92 123 150 85 131.4%
New Zealand 4 4 4 4 -0 -8.2%
Papua New Guinea 0.2 0.8 2.1 4.5 4.3 2232.7%
Peru 8 9 14 20 12 149.0%
Philippines 3 4 5 6 3 111.2%
Russia 364 419 434 443 78 21.5%
Singapore 9 10 12 12 3 34.0%
Taiwan 15 13 21 21 7 44.1%
Thailand 38 44 58 71 34 88.8%
United States 646 704 802 961 315 48.7%
Vietnam 10 10 16 16 7 71.9%
World Total 2,944 3,179 3,845 4,550 1,606 54.6%
APEC Share 56.5% 63.3% 63.2% 62.7% - -
Source: APERC, APEC Energy Demand and Supply Outlook 6th Edition
The APEC outlook expects demand for gas to increase significantly, mainly in the United States and
China. In addition, OECD members in the APEC region will increase their demand on average 1.4%
per year, and non-OECD economies will increase 4.4% per year. While demand for natural gas is
growing globally, gas demand in Japan, the world’s largest LNG importer, has hit a peak and is
expected to maintain its current levels by 2040.
10APERC Gas Report 2018
Figure 1-5 Outlook for natural gas consumption in APEC, 2015-2040
(Mtoe)
3,000
Other
Malaysia
2,500
Korea
2,000 Thailand
Japan
1,500 Indonesia
Canada
1,000 Mexico
Russia
500 China
United States
0
2015 2020 2030 2040
Source: APERC, APEC Energy Demand and Supply Outlook 6th Edition
Figure 1-6 Outlook for change in natural gas consumption of APEC member economies, 2015-2040
Vietnam
United States
Thailand
Taiwan
Singapore
Russia
Philippines
Peru
Papua New Guinea
New Zealand
Mexico
Malaysia
Korea
Japan
Indonesia
Hong Kong
China
Chile
Canada
Brunei 2015-2040
Australia
-100 0 100 200 300 400 500
(Mtoe)
Source: APERC, APEC Energy Demand and Supply Outlook 6th Edition
11APERC Gas Report 2018
Section 2. Gas Supply
2-1 World and APEC Natural Gas Supply
2-1-1 Overview
Table 2-1 APEC member economies natural gas production, 2006-2016
Natural Gas Production (Mtoe)
Economy 2006 2007 2008 2009 2010 2011 2012 2013 2014 2015 2016
APEC Total 1,409 1,429 1,476 1,425 1,523 1,582 1,595 1,638 1,672 1,696 1,710
Australia 36 38 40 42 44 48 46 52 53 56 74
Brunei 11 11 11 10 10 11 11 10 10 9 9
Canada 155 150 145 135 132 132 130 130 138 139 146
Chile 2 1 1 2 2 1 1 1 1 1 1
China 49 58 67 71 80 88 93 101 109 113 115
Hong Kong 0 0 0 0 0 0 0 0 0 0 0
Indonesia 65 62 64 67 75 71 67 67 66 65 67
Japan 3 4 4 3 3 3 3 3 2 2 3
Korea 0 0 0 0 0 0 0 0 0 0 0
Malaysia 55 54 57 52 51 53 51 58 59 58 59
Mexico 43 43 42 44 43 42 41 40 37 34 31
New Zealand 3 4 3 4 4 3 4 4 4 4 4
Papua New Guinea 0 0 0 0 0 0 0 0 2 2 3
Peru 2 3 3 4 8 12 12 12 13 13 14
Philippines 3 3 3 3 3 3 3 3 3 3 3
Russia 526 522 535 479 540 553 541 554 531 524 529
Singapore 0 0 0 0 0 0 0 0 0 0 0
Taiwan 0 0 0 0 0 0 0 0 0 0 0
Thailand 19 20 23 21 25 22 26 28 29 26 25
United States 432 450 470 480 495 531 558 564 606 636 616
Vietnam 6 6 7 7 8 8 8 9 9 10 10
World Total 2,447 2,511 2,613 2,536 2,715 2,788 2,837 2,896 2,935 2,976 2,998
APEC Share 57.6% 56.9% 56.5% 56.2% 56.1% 56.7% 56.2% 56.6% 57.0% 57.0% 57.0%
Source: International Energy Agency (IEA), World Energy Balances 2017; Asia Pacific Energy Research Centre, Energy Balance
Table
Over the past decade, the world’s natural gas supply has continued to expand, following demand.
Table 2-1 shows natural gas supply from 2006 to 2016 according to the IEA’s World Energy Balances
2017. World supply increased by an average 2.1% per year from 2,447 Mtoe (2,562 Bcm) in 2006 to
2,998 Mtoe (3,139 Bcm) in 2016. APEC gas supply also increased by an average 2.0% per year from
1,409 Mtoe (1,475 Bcm) in 2006 to 1,710 Mtoe (1,790 Bcm) in 2016. APEC’s share of world supply did
not change significantly, marginally decreasing from 57.6% in 2006 to 57.0% in 2016. APEC member
economies, supply growth was concentrated in the United States, China and Australia, accounting
alone for an increase of 288 Mtoe (302 Bcm) from 2006 to 2016, about 30% of the world supply
increase.
12APERC Gas Report 2018
Figure 2-1 Natural gas supply of APEC member economies, 2006-2016
Source: International Energy Agency (IEA), World Energy Balances 2017; Asia Pacific Energy Research Centre, Energy Balance
Table
Figure 2-2 Change in natural gas supply of APEC member economies, 2006-2016
Source: IEA, World Energy Balances 2017; Cedigaz, Natural Gas in the World
13APERC Gas Report 2018
2-1-2 United States
Until the late 2000s, due to the increase in domestic demand and levelling off of domestic production,
the US government estimated that it would need to import nearly 400 Mtpa of LNG by 2030.
Consequently, some pipelines and LNG receiving terminals started construction for importing natural
gas. However, the shale revolution changed circumstances, increasing dramatically the United States
unconventional gas production, especially shale gas. In 2011, with the increase in production, the
United States produced more gas than in any other time in its history, exceeding the 1973 record
production levels. In 2012, the US surpassed Russia to become the world’s largest supplier.
There are numerous LNG export projects planned to come online in the US in the future, and the
supply of natural gas is expected to increase under the Trump administration’s An America First Energy
Plan, which expects to increase employment and lower trade deficits by ramping up the production
of shale oil and gas. Although United States LNG exports are losing an expected price advantage
because of the sharp drop in international crude oil prices and the subsequent decline of Asian LNG
prices in recent years, US LNG exports have no restrictions on destination. US LNG exports may
contribute to revitalizing LNG markets.
2-1-3 Russia
Russia remains as one of the world’s leading natural gas suppliers, despite little increase in its
production from 2006 to 2016. Currently, most of the gas produced in Russia is supplied to Europe
via pipeline. In 2006, 2009, and 2015, Russia cut off its gas exports to Ukraine over disputes on gas
pricing, triggering gas shortages in some parts of Europe, where Russian piped gas exports transit
through Ukraine. These actions forced some European governments to take measures to mitigate
their dependence on Russia by substituting their imports with LNG imports, especially by procuring
LNG in the spot market. However, Europe still remains heavily reliant on Russian gas imports. This is
due to several reasons. First, the North Sea gas fields, which have been the main source of gas in
Europe up to now, continue to age and decrease their production. Second, the Dutch Groningen gas
field, the largest in Europe, is also in decline. Finally, LNG projects in the United States, which are
expected to increase supply in the future, only started exporting in 2016. Under these circumstances,
Russia is working to build the Nord Stream II and the Turkish Stream pipelines to increase its European
exports while developing new gas fields at home.
China is expected to be a key destination for Russian gas exports. As previously mentioned, China is
securing a variety of gas supply options by importing piped gas, LNG, and developing domestic
unconventional gas. This has put Russia in a difficult position. However, Russian piped gas exports to
China will start when the Power of Siberia pipeline comes into stream. Similarly, Russia is also expected
to export LNG to China from the recently finished Yamal LNG terminal and the Sakhalin 2 LNG terminal,
14APERC Gas Report 2018
currently under expansion and expected to be concluded after 2020.
2-1-4 Canada
As of 2016, Canada was the world’s fifth largest natural gas supplier, but its supply volume has
decreased from 155 Mtoe (162 Bcm) in 2006 to 146 Mtoe (153 Bcm) in 2016. Canada, originally, did
not consume much natural gas, exporting by pipeline to the United States more than 50% of
production. However, due to the sharp increase in shale gas in the United States, Canadian gas exports
have decreased. Canada has plans to export LNG to Asia and other markets. In 2014, 20 LNG projects
were proposed in the province of British Columbia alone. Nevertheless, after oil prices went down, no
projects have moved forward with a final investment decision as December 2017.
2-1-5 China
China’s natural gas consumption is forecasted to continue increasing, and the government is
proceeding to expand the production of natural gas along with it. The Chinese government has set a
goal of increasing natural gas consumption so that it represents at least 10% of primary energy
consumption by 2020, improving energy security and decreasing pollutant emissions.
China’s natural gas supply sources can be roughly divided into domestic production, imports via
pipeline and LNG imports. With respect to domestic natural gas production, in October 2013 China’s
National Energy Administration announced its shale gas industry policy, positioning shale gas
development as a national strategically emerging industry, and implementing support measures such
as subsidies, allowances for producers and tax exemptions for facilities that import gas from abroad
as a result of exploration and development. Based on this policy, Chinese companies are proceeding
to develop unconventional natural gas. In 2016, coalbed methane (CBM) and shale gas combined
produced around 15 Bcm (14 Mtoe), with the Chinese government planning to raise this to about
40Bcm (38Mtoe) by 2020.1 China imports gas via pipeline from Turkmenistan, Kazakhstan, Uzbekistan
and Myanmar. Piped imports from Russia will begin when the Power of Siberia pipeline, currently
under construction, is completed around 2019, with a maximum import capacity of 38 Bcm (36 Mtoe).
China has been importing LNG since 2006, and imports have increased annually. LNG import volumes
in 2016 were 37.4% higher than the previous year.
2-1-6 Australia
In Australia, natural gas production has dramatically increased in the past few years as many
1
Presentation made by the National Energy Administration of China at the 5th Unconventional Natural Gas Forum held in
Brisbane, Australia on 23 February 2017.
15APERC Gas Report 2018
liquefaction projects have recently come online. These large-scale projects include the QCLNG project
in 2014, the GLNG project in 2015, the Gorgon LNG project in 2016 and the Australia Pacific LNG
project. More liquefaction projects are scheduled to start by 2020, and supply is expected to continue
increasing in the upcoming years.
However, some changes in domestic regulations in Australia in recent years may affect gas supply. In
August 2016, the government of the south-eastern state of Victoria announced a policy to indefinitely
prohibit advanced shale gas drilling technology, such as hydraulic fracturing (fracking). The ban
applies to onshore drilling but excludes offshore oilfields, with possibility of future restrictions on new
developments. In July 2017, the Australian government announced it would implement the Australian
Domestic Gas Security Mechanism (ADGSM), which can impose LNG export restrictions if there is an
imminent domestic gas supply shortage. Only one project in eastern Australia has been affected by
this mechanism, and the impact on the international gas market has been limited.
2-2 World LNG Supply
World LNG supply has increased by an average 5.6% per year over the past 10 years, increasing from
130 MTPA in 2006 to 224 MTPA in 2016. APEC’s LNG supply is below the world’s growth rate, increasing
by an average 4.1% per year from 58 MTPA in 2006, to 87 MTPA in 2016. For both, the world and
APEC, the LNG supply growth rate exceeds that of natural gas production, indicating that LNG
transactions have become more active. APEC’s LNG share of global LNG supply decreased from 44.6%
in 2006, to 38.7% in 2016. However, APEC’s share is expected to recover as Australia and the United
States are expected to increase their LNG supply.
Australia and Russia are the fastest growing economies, as both alone increased supply by 31 MTPA
from 2006 to 2016, accounting for the majority of APEC’s growth in LNG supply. As mentioned, the
fact that many liquefaction projects in Australia have come online has led to an increase in the supply
of LNG.
LNG supply in Indonesia and Malaysia, traditional LNG suppliers, declined and remained flat,
respectively. While LNG is an important export industry in both economies, domestic demand for
natural gas has also increased in recent years. This has resulted in efforts to direct production to
domestic markets. Moreover, some LNG import terminals have already started operation in both
economies.
US LNG exports grew dramatically during 2016 from about less than one bcm up to around four bcm,
driven mainly by shale gas production. These volumes are expected to continue increasing
significantly and most probably going to the European and Asian markets.
16APERC Gas Report 2018
Figure 2-3 APEC LNG supply, 2006-2016
Source: IEA, World Energy Balances 2017; Cedigaz, Natural Gas in the World
Table 2-2 APEC LNG exports, 2006-2016
LNG Export (Mtpa)
Country 2006 2007 2008 2009 2010 2011 2012 2013 2014 2015 2016
APEC Total 58 58 57 62 73 78 73 77 76 78 90
Australia 11 13 12 14 16 18 17 21 21 23 32
Brunei 7 6 7 6 6 6 6 6 5 6 5
Canada 0 0 0 0 0 0 0 0 0 0 0
Chile 0 0 0 0 0 0 0 0 0 0 0
China 0 0 0 0 0 0 0 0 0 0 0
Indonesia 22 20 20 19 21 20 17 17 15 15 16
Japan 0 0 0 0 0 0 0 0 0 0 0
Korea 0 0 0 0 0 0 0 0 0 0 0
Malaysia 18 18 18 18 20 22 20 21 21 21 20
Mexico 0 0 0 0 0 0 0 0 0 0 0
New Zealand 0 0 0 0 0 0 0 0 0 0 0
Papua New Guinea 0 0 0 0 0 0 0 0 0 1 0
Peru 0 0 0 0 2 4 4 5 4 4 4
Philippines 0 0 0 0 0 0 0 0 0 0 0
Russia 0 0 0 4 8 8 9 9 9 9 10
Singapore 0 0 0 0 0 0 0 0 0 0 0
Taiwan 0 0 0 0 0 0 0 0 0 0 0
Thailand 0 0 0 0 0 0 0 0 0 0 0
United States 1 1 1 1 1 1 0 0 0 0 4
Vietnam 0 0 0 0 0 0 0 0 0 0 0
W o r ld T o t al 130 140 140 154 189 204 205 208 209 216 224
APEC Share 44.6% 41.9% 40.6% 39.9% 38.5% 38.2% 35.4% 37.1% 36.2% 36.0% 40.3%
Source: IEA, World Energy Balances 2017; Cedigaz, Natural Gas in the World
17APERC Gas Report 2018
2-3 Future Outlook
The APEC Energy Demand and Supply Outlook 6th Edition forecasts global natural gas supply to grow
from 2,976 Mtoe (3,116 Bcm) in 2015, to 4,550 Mtoe (4,764 Bcm) in 2040. APEC’s gas supply will
increase from 1,696 Mtoe (1,776 Bcm) to 2,620 Mtoe (2,743 Bcm) during the same period, an
expansion of about 50%. Supply volumes are forecasted to grow in APEC member economies,
especially in the United States, China, Australia and Russia by 746 Mtoe (781 Bcm) altogether from
2015 to 2040.
Table 2-3 APEC economies natural gas supply forecast, 2015-2030
National Gas Puroduction (Mtoe) 2015-2040
Economy 2015 2020 2030 2040 Change Change %
APEC Total 1,696 2,015 2,392 2,620 923 54.4%
Australia 56 57 76 102 45 80.2%
Brunei 9 12 13 15 6 59.3%
Canada 139 155 170 171 32 23.1%
Chile 1 1 1 1 0 47.0%
China 113 216 330 347 234 208.0%
Hong Kong 0 0 0 0 0 -
Indonesia 65 69 63 63 -3 -4.4%
Japan 2 3 3 3 1 33.6%
Korea 0 0 0 0 0 48.1%
Malaysia 58 53 53 51 -7 -12.1%
Mexico 34 68 104 146 112 325.9%
New Zealand 4 4 4 4 -0 -7.2%
Papua New Guinea 2 7 7 7 5.4 277.7%
Peru 13 32 50 58 46 359.7%
Philippines 3 3 3 3 0 4.4%
Russia 524 556 599 629 105 20.1%
Singapore 0 0 0 0 0 -
Taiwan 0 0 0 0 -0 -1.7%
Thailand 26 17 12 12 -14 -54.5%
United States 636 749 886 998 362 56.8%
Vietnam 10 12 17 8 -1 -11.8%
World Total 2,976 3,181 3,847 4,550 1,574 52.9%
APEC Share 57.0% 63.3% 62.2% 57.6% - -
Source: APERC, APEC Energy Demand and Supply Outlook 6th Edition
In the United States, natural gas production is expected to grow, as numerous LNG projects are
scheduled to start operations and the Trump administration favours reducing regulatory burden for
the oil industry and shale gas production increases. In response to higher domestic consumption,
18APERC Gas Report 2018
China is expected to increase its domestic natural gas production and both pipeline and LNG
imports.
A key element for expanding Russia’s gas supply is export pipelines construction. The Turk Stream
pipeline construction, connecting Russia and Turkey, began in May 2017. Progress has been made
on the Nord Stream II pipeline, expanding the capacity of the underwater connection between
Russia and Germany, as a result of a financing agreement between Nord Stream 2 AG and five
European energy companies (ENGIE, OMV, Shell, Uniper, and Wintershall) in April 2017. Furthermore,
the 3,000 km-long Power of Siberia pipeline, linking Russia and China is also under construction and
expected to be operational by 2019. The completion of these pipelines will significantly expand
Russia’s gas export capacity.
A non-APEC member economy to take particular notice of is Qatar, the world’s largest LNG exporter.
Since 2005, Qatar has had a moratorium, essentially a self-imposed restraint from any new
development on its massive North Field. However, in April 2017 it lifted the moratorium and has
increased production since then. State-owned oil company Qatar Petroleum announced that it
would increase its LNG production from 77 MTPA to 100 MTPA by 2024. Qatar’s aim appears to be
to maintain its market share against Australia, the United States, Russia and other competitors.
As mentioned, global natural gas supply is expected to increase in the short to medium term
because of several LNG projects coming online and the construction of new pipelines. However, due
to excess supply and the decline in Asian LNG prices in recent years, investment in the upstream
sector has slowed down. There were virtually no final investment decisions (FID) made for new
projects in 2016. In the medium term, global gas supply and demand will face a hard time with
possible shortages and uncertainty if these trends continue.
19APERC Gas Report 2018
Section 3. Gas Trade
According to the World Energy Balances 2017 by IEA, internationally traded gas volumes, as a whole,
grew by 2.1% per year from 2006 to 2016, measured at the import end. 2 The share of LNG of total
internationally traded gas increased during the same period from 23% in 2006 to 32% in 2016,
because of a yearly 5.4% growth rate for LNG and a significantly slower growth of pipeline trade of
0.7% per year. This means that more gas is transported via LNG than it was 10 years ago, resulting in
a stronger dependence between producers and consumers.
Among the 21 APEC members, 8 economies are net gas exporters, 10 are net importers and 3 do not
trade gas. These economies are New Zealand, the Philippines, and Viet Nam; the latter two are
expected to begin imports of LNG in the coming years.
Figure 3-1 Major natural gas trade flows, 2016
Source: IEEJ Outlook 2018
3-1 Gas Imports in the World and the APEC region
Natural gas imports in the world as a whole grew by 2.1% per year from 734 Mtoe (889 bcm), in 2006
2
At the export end, the growth rate was 2.3% per year according to the same IEA statistics.
20APERC Gas Report 2018
to 907 Mtoe (1,098 bcm) in 2016. During the same period, natural gas imports by APEC members
increased by 4.1% per year, faster than the world average, from 259 Mtoe (313 bcm) to 386 Mtoe (467
bcm). As a result, APEC members’ share of global natural gas imports increased from 35% 43% in the
last decade.
During the same period, natural gas consumption grew by 2.6% per year in APEC member economies
and by 2.2% per year in the world, respectively. The share on imports out of total gas consumption,
which used to be lower for the APEC members at 20% than for the world as a whole at 30%. However,
it crept up to 23% for the APEC members, while the share of the world as a whole stayed at the same
level.
The APEC region, which includes some of the largest natural gas producers and used to be self-
sufficient for their natural gas supply, has increased dependence on imports as they have increased
natural gas consumption faster than the world average. However, total gas production in the region
is still bigger than total consumption but some of these volumes are exported to other regions, mainly
Europe. At the same time, some APEC members import LNG from non-APEC economies in the Middle
East, Africa, South America, and Europe.
Table 3-1 APEC members' natural gas imports, 2016
Bcm
Japan 95
United States 66
People's Republic of China 58
Korea 38
Mexico 34
Canada 16
Chinese Taipei 15
Thailand 12
Singapore 9
Russian Federation 7
Malaysia 6
Australia 6
Chile 4
Hong Kong (China) 3
Unit: billion cubic meters. Calculated from the figures in Mtoe in the source.
Source: The World Energy Balances 2017, IEA
Japan is the largest LNG and natural gas importer in the world. Japanese LNG imports peaked in 2014
and decreased slightly in the last two years. From 2006 to 2016, Japan’s natural gas imports increased
by 34%, or 30 bcm, representing a 2.9% per year growth on average.
21APERC Gas Report 2018
The United States, which is expected to be a major LNG exporter to the global market soon, is still a
net gas importer. It is connected to its neighbours, Canada and Mexico, with extensive pipeline
networks. Only in 2016, the US imported around 83 Bcm from Canada. However, US total gas imports
(including LNG) shrunk by nearly 30%, or 34 Bcm, from 2006 to 2016.
China is rapidly emerging as one of the largest importers of natural gas in the world from its self-
sufficient status in 2005. About 33% of natural gas consumed in China in 2016 came from imports.
Canada is one of the largest producers of natural gas in the world, although still some volumes from
the United States make their way into Canada, in exchange for even larger volumes coming from the
north. Russia, the world’s largest natural gas exporter, also imports small volumes of natural gas via
pipeline. Malaysia, which exports significant volumes of LNG from the eastern state of Sarawak,
offtakes gas from the joint development areas with Viet Nam and Thailand, as well as some LNG.
Australia, which is expected to soon become the world’s top LNG exporter, receives gas from the joint
development area with Timor Leste, which in turn is converted into LNG for exports. In addition, there
is a proposal to install an LNG receiving terminal in the state of Victoria. Hong-Kong, China receives
natural gas from a China's offshore gas field via pipeline.
Among the 14 APEC members that import natural gas, only Japan, the United States, China, Korea,
Mexico, and Chinese Taipei were LNG importers in 2006. By 2016, Canada, Thailand, Singapore,
Malaysia, and Chile also developed LNG import terminals. While APEC LNG imports decreased during
the period as a share of world LNG imports, LNG consumption in the APEC region grew from 13%, in
2006, to 17% in 2016.
22APERC Gas Report 2018
Figure 3-2 APEC members’ natural gas imports, 2006-2016
Sources: The World Energy Balances 2017, IEA
3-2 Gas Exports in the World and the APEC region
Exports of natural gas in the world grew by 2.3% per year from 730 Mtoe (884 bcm) in 2006, to 918
Mtoe (1,112 bcm) in 2016. During the same period, APEC members’ gas exports increased slower than
the world average by 1.9% per year, from 350 Mtoe (424 bcm) in 2006 to 421 Mtoe (509 bcm) in 2016.
As a result, the share of APEC members in the global natural gas exports declined slightly from 48%
in 2006, to 46% in 2016. During the same period, natural gas production grew by 2.0% per year in the
APEC region and by 2.1% per year in the world, respectively. Gas exports as a share of total gas
production did not change much in the APEC region, staying at 25%, while slightly increased globally
from 30% to 31% from 2006 to 2016.
23APERC Gas Report 2018
Table 3-2 APEC members' natural gas exports, 2016
Bcm
Russian Federation 168
Canada 66
United States 51
Australia 39
Indonesia 28
Malaysia 26
Papua New Guinea 10
Brunei Darussalam 6
Peru 5
People's Republic of 3
China
Chile 0.3
Mexico 0.02
Viet Nam 0
Note: Viet Nam ceased gas delivery from the joint development area with Malaysia in 2008.
Unit: billion cubic meters. Calculated from the figures in Mtoe in the source.
Source: The World Energy Balances 2017, IEA
Russia has been the world’s largest natural gas exporter for decades. In addition to major gas pipeline
infrastructure connected to Europe and former Soviet Union countries, Russia added an LNG export
terminal in the Pacific region in 2009. This APEC member also developed another LNG export plant in
the Arctic region, Yamal LNG, which started operations in December 2017. Canada still exports massive
volumes of natural gas to the United States via pipeline, but the exported volumes to its southern
neighbour decreased by 18%, or 18 bcm, between 2006 and 2016. On the other hand, the United
States more than tripled natural gas exports during the same period, including pipeline deliveries to
Canada and Mexico, as well as LNG exports from the Gulf of Mexico.
Australia nearly tripled its LNG exports during the same period. Other traditional LNG exporters in the
APEC region like Indonesia, Malaysia, and Brunei continued exporting similar gas volumes during the
same period. During the last decade, Peru and Papua New Guinea emerged as new LNG exporters,
mostly targeting to other APEC member markets. Chile re-exports to Argentina some of its regasified
imported LNG. Mexico exports some gas volumes to the United States but imports are much larger
than exports. Viet Nam ceased to deliver gas from the joint development area with Malaysia in 2009.
24APERC Gas Report 2018
Figure 3-3 Natural gas exports by APEC members, 2006-2016
Source: The World Energy Balances 2017, IEA
3-3 Gas Trade outlook in the World and the APEC region
The United States, which used to be a significant LNG importer, has decreased LNG imports rapidly
because of the rise in domestic gas production. Moreover, it is rapidly increasing its exports and is
expected to become a net gas exporter. Canada also has increased its own gas production and has
imported meaningful volumes of LNG since inaugurating its only LNG receiving terminal in 2009.
In 2016, Russia exported 17% of the world’s total gas exports via pipeline to Europe. While LNG trade
used to be dominated by Southeast Asia exporters to Japan and Korea, the global LNG trade flows
have been diversified in recent years along with increasing LNG production projects in places like
Qatar and Australia. With the arrival of new LNG exporters like Peru, Papua New Guinea or
Mozambique, trade patterns are also expected to be more diversified in the future.
Looking ahead toward 2030, the majority of natural gas exports are expected to come from Oceania
and North America, where numerous LNG projects are planned to start operations between 2020 and
2025. As for absolute volumes of exports, Russia and the Former Soviet Union economies are expected
to continue being the largest gas-exporting region. New pipeline projects to China and Europe and
LNG export terminals, such as Yamal LNG, will further increase the region’s exports.
25APERC Gas Report 2018
Beyond 2030, international natural gas trade growth is expected to slow down. Slower gas demand
growth in OECD countries and increasing unconventional gas production in China and Latin America
should reduce import requirements in those regions. North American LNG supply, considered one of
the most important global LNG supply sources towards 2040, should represent a significant part of
natural gas supply in the APEC region. As for pipeline gas trade, while Russian exports to Europe are
expected to slow down along with stagnant demand in the region, global trade is expected to grow
steadily. Besides, by 2040, some pipeline proposals, linking Central Asia to South Asia and the Middle
East with South Asia, may eventually materialize.
Figure 3-4 Major natural gas trade flows (2030) Reference Scenario
Source: IEEJ Outlook 2018
26APERC Gas Report 2018
Section 4. Gas Prices
4-1 Change in Major Natural Gas Prices of the World
The world’s major natural gas price indexes in 2016 and 2017 can be said to be generally stable,
although they have been showing an upward trend. The Japan LNG import price increased from
around $6/MMBtu to around $8/MMBtu from 2016 to 2017. This reflected the moderate rise in
international crude oil prices, which rose from $30/bbl. to $50/bbl. during the same period. Most of
the LNG traded in the Asia-Pacific region is based on long-term contracts, and since the trading price
of long-term contracts is still overwhelmingly linked to the price of crude oil, LNG prices in the Asia-
Pacific region are strongly influenced by crude oil price trends.
Figure 4-1 Trends in major natural gas price indexes, 2015-2017
16 $/mmbtu
14
12
Japan LNG
Cocktail
10 Japan spot
8 NBP
6 Henry Hub
4 Japan Crude
Cocktail
2
0
2015 2016 2017
Sources: Ministry of Finance of Japan, Agency of Natural Resources of Energy of Japan, U.S. Energy Information Administration,
Intercontinental Exchange
However, although traded volumes at spot prices are not necessarily large in the region, the Asian
LNG spot price has lingered at a considerably low level compared with the average Japan LNG import
price. This reflects the surplus in supply in the Asian LNG market in recent years. As a consequence,
and the price difference between the average import price and the Japanese spot price has doubled
from 2016 to 2017. As mentioned, LNG long-term contract prices in Asia mirror crude oil prices, and
with its continued rise, LNG excess supply in the international market will persist, while spot prices are
expected to remain comparatively low.
27You can also read