A New Water Governance Model Aimed at Supply-Demand Management for Irrigation and Land Development in the Mendoza River Basin, Argentina - MDPI
←
→
Page content transcription
If your browser does not render page correctly, please read the page content below
water
Article
A New Water Governance Model Aimed at
Supply–Demand Management for Irrigation and
Land Development in the Mendoza River
Basin, Argentina
Mario Salomón-Sirolesi 1, * and Joaquín Farinós-Dasí 2
1 Facultad de Ingeniería, Universidad Nacional de Cuyo, Centro Universitario,
Ciudad de Mendoza M5502JMA, Argentina
2 Departamento de Geografía e Instituto Interuniversitario de Desarrollo Local, Universidad de Valencia.Av.
Blasco Ibáñez, 28 (3ª planta), 46010 Valencia, Spain; Joaquin.Farinos@uv.es
* Correspondence: salomonmario@yahoo.com.ar; Tel.: +54-261-4685181
Received: 26 January 2019; Accepted: 27 February 2019; Published: 5 March 2019
Abstract: This study aimed at achieving an organizational solution for improving the governance
of water and land use and, consequently, improving the supply–demand water balance.
Related modeling applied to diverse scenarios focus on water and land use development in the
Mendoza River basin. A strategic analysis of water organization was performed using causal analysis,
producing a Strategic Map (SM) and designing a Balanced Scorecard (BS). To assess the basin’s water
resources supply and demand, the Water Evaluation and Planning (WEAP) model was applied to
the Administrative Management Units existing in the basin, taking into consideration the water
availability and the granted water rights. The application of the organizational and governance model
to various scenarios referring to 2030 show that by reordering allocations and water use criteria,
implementing a better farm irrigation water management, improving capacity building of existing
human resources, and adopting more adequate hard- and software for dams and canal management,
it will be possible to accommodate demand in 2030 better than at present despite climate change
impacts on demand and supply. In addition, users’ participation will be enhanced.
Keywords: water and land management; water users’ organization; water balance; supply–demand
balance model; organizational analysis; participatory management
1. Introduction
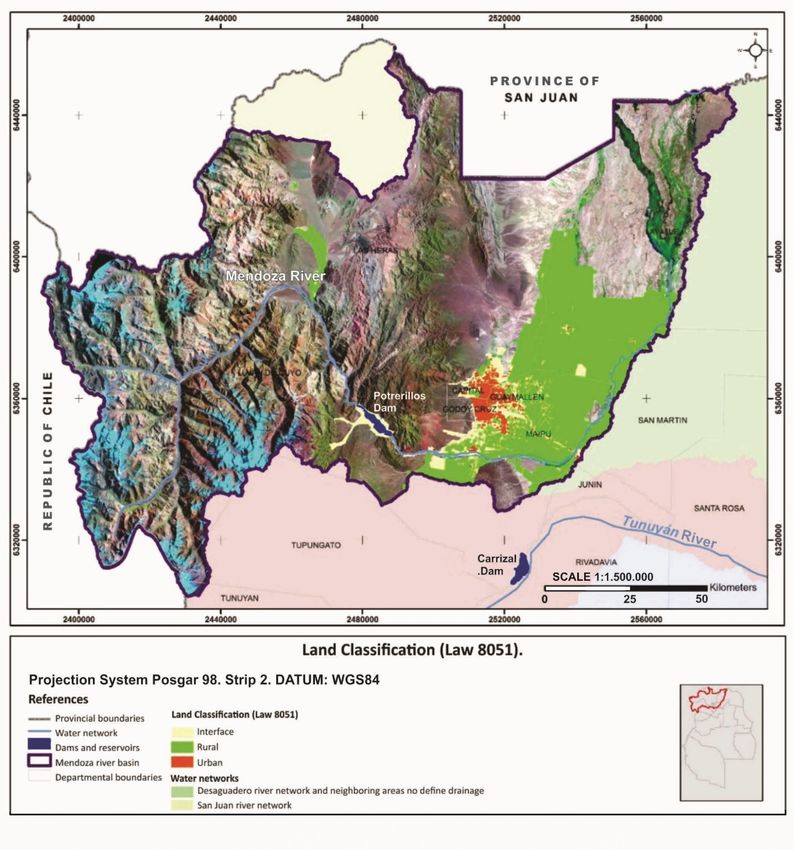
The water governance model currently used in the Mendoza River basin, Argentina (Figure 1),
brings about imbalance and unevenness of management inadequate for an area in full transformation.
Spatio-temporal effects of great intensity and magnitude refer to the limited autonomy and
self-sufficiency of local management organizations, the inadequate distribution and use of water
resources, the separate management of water and land, the impact of territorial, economic,
and productive competitiveness, the degradation of soils, all affecting crops production and causing
poor service to users [1]. The water management model emerged in the nineteenth century, derived
progressively very top–down and technocratic, but functional to the corporate external as well as
internal interests. As a result, hierarchical, highly centralized power of decisions does not comply
with the principle of accountability. Improved control would be feasible through an administrative
decentralization process by watersheds and subareas. The primal social contract for the water
administration in Mendoza implemented by the traditional and conservative elite in 1884, in a time of
great and rapid agricultural expansion, does not fit well in current conditions; besides, it has caused
Water 2019, 11, 463; doi:10.3390/w11030463 www.mdpi.com/journal/water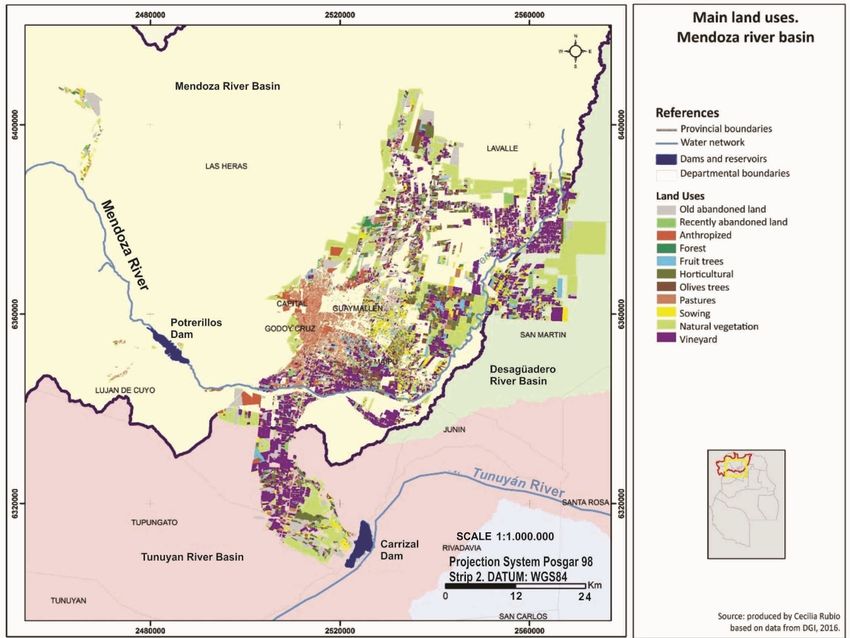
Water 2019, 11, 463                                                                                                          2 of 17

very negative consequences, difficult to correct, to the territorial–hydrological system. As emblematic
cases, demonstrating such trends: a) despite having passed a century since then, it still lacks the
implementation        of water balances as well as legislative changes facilitating reallocation of water
      Water 2018, 10, x FOR PEER REVIEW
                                                                                                                              rights;
                                                                                                                        2 of 17
b) loss of water rights in productive areas because use changes from agricultural to recreational ones,
affecting the functioning of the system as a whole; c) groundwater overexploitation and speculative
use ofwater
        water rights;   b) lossfor
                 resources       of more
                                    water than
                                           rights40inyears,
                                                       productive
                                                               whichareas
                                                                       has because
                                                                            caused use
                                                                                     the changes    from
                                                                                          loss of the      agricultural
                                                                                                        aquifer              to
                                                                                                                   productivity
      recreational    ones,  affecting the functioning    of the system   as a whole; c) groundwater
and quality; and d) failure to consolidate autonomous water organizations for productive local units,    overexploitation
      and speculative use of water resources for more than 40 years, which has caused the loss of the aquifer
according to appropriate monitoring processes.
      productivity and quality; and d) failure to consolidate autonomous water organizations for
     The consequences of this model’s 19th century view, extemporaneous today, affect social,
      productive local units, according to appropriate monitoring processes.
economic,The  andconsequences
                     productive of  dimensions
                                        this model’s for19th
                                                          not century
                                                               ensuring    efficient
                                                                         view,        administration
                                                                                extemporaneous      today,and    satisfaction
                                                                                                              affect  social, of
the demand
      economic, [2].andAppropriate
                          productive practices
                                       dimensions  forforthe
                                                           notsustainable    management
                                                               ensuring efficient             of water
                                                                                    administration    andinsatisfaction
                                                                                                             the basin include
                                                                                                                             of
real-time   water measurement,
      the demand      [2]. Appropriateefficient
                                          practicesapplication     of irrigation
                                                     for the sustainable           modules
                                                                           management          and plans,
                                                                                           of water  in the uniformity
                                                                                                             basin includein the
application
      real-timeofwater
                   water,measurement,
                            clean production      associated
                                           efficient            with
                                                      application      water quality,
                                                                   of irrigation modulesimproved     land
                                                                                            and plans,      levelinginfor
                                                                                                        uniformity         thebetter
      application
performance           of water, clean
                 of irrigation,          productiontoassociated
                                   soil mulching                    with water quality, use
                                                         reduce evapotranspiration,         improved    land leveling
                                                                                                of adequate      irrigationfor flow
rates,better  performance
       monitoring               of irrigation,
                        of soil moisture   and soil
                                                 plantmulching     to reduce
                                                         water status,   properevapotranspiration,
                                                                                  design of irrigation  use   of adequate
                                                                                                          units,   conservation
      irrigation
of drains,   andflow     rates, of
                    training     monitoring   of soil operators
                                    water system       moisture andand plant  water
                                                                          users     status,
                                                                                 [3,4].      proper design
                                                                                        Meanwhile,             of irrigation
                                                                                                         the main      issue is to
      units, conservation of drains, and training of water system operators and users [3,4]. Meanwhile, the
implement a governance model that provides for improved participatory management through local
      main issue is to implement a governance model that provides for improved participatory
water user organizations.
      management through local water user organizations.

                                             Figure 1. Mendoza River basin [5].
                                               Figure 1. Mendoza River basin [5].

      Water2018, 10,x; doi:FOR PEER REVIEW                                                      www.mdpi.com/journal/water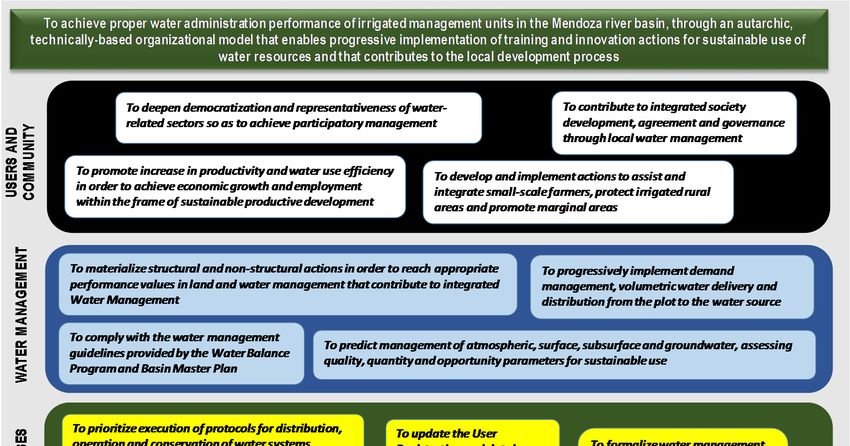
Water 2019, 11, 463                                                                                 3 of 17

      It is worthy of notice that, as part of the decentralization process implemented by the end
of the 20th century [6], the Mendoza River Water User Organizations (WUOs) contributed not
only to establishing a new governance, but also to the integrated process of regional development,
namely evidencing that water management is a critical factor in a semiarid region [7]. WUOs had
highly influenced the elaboration of the Land Use Law and the Strategic Development Plan
(SDP), the execution of which required an effective supply–demand water balance implementation,
restructuring of granted rights, respect for basin autonomy, effective representation and participation
of the different water users, and consensual reformulation of the instruments necessary to achieve
integrated water management [8]. In this process, there appears that, in the absence of the State,
community management and associative modes have been efficient in supplying water at a local
scale [9]. Territorial governance is thus a nonexclusive governmental dimension, where public
participation influences decision-making and the social and spatial structure of processes involved [10].
Thus, under high social and public control, land and water governance strategies and integrated
management services are expected to ensure strategic and productive territorial development [11].
      The main objective of this paper was the formulation of a participatory organizational model
consistent with current requirements of users, as well as with the water supply–demand balance
modeling, in order to reach an equitable and sustainable water resources availability and use in the
Mendoza River basin. It is foreseen that the organizational governance proposal will contribute
to achieving greater efficiency and effectiveness in the water and land use together with the
implementation of the administrative act when considering different prospective modalities relative to
various context scenarios. Accordingly, objectives include the identification of strategies to promote
the decentralized management of water, namely those referring to the ways in which WUOs may
implement water demand management actions based on present supply–demand water balance issues.
      The strategic formulation of the governance model was carried out by defining the organizational
identity through the determination of the mission, vision, values, and strategies of WUOs.
The organizational analysis was developed through the preparation of a strategic map [12] and
the linking of the WUOs through the design of the Integral Scorecard (IS) [13]. Secondly, the available
water resources of the Mendoza River basin [14] were assessed through updated water balance (WB)
studies [15] and the application of the Water Evaluation and Planning model (WEAP) [16]. The latter
tool allows contrasting water supply and demand considering a distribution system marked by
spatial and temporal variability. An adjusted modeling approach [17] was used for different scenarios
according to the peculiarities of the basin relative to each of the basin’s Administrative Management
Units (AMUs) and considering the availability of water and the granted uses [18,19]. Based on the
constitutional law of Mendoza, which previses the water balance and assesses for the reallocation
of rights, three scenarios have been considered in water modeling: i) trend, which is to continue
with the allocation of water without changing the category of agricultural rights in use and with the
current efficiencies; ii) possible, which is to equate the agricultural rights in use and delivery of 100%
of the endowment improving the efficiencies, and iii) contrasted, which is to distribute the water with
100% to all the rights registered whatever the use and improving the efficiencies. For this purpose,
different criteria for irrigation planning were analyzed [20], irrigation requirements and scheduling
were considered [21], and strategies for water management were identified [22].

2. The Study Area
     The Mendoza River basin is located in the Andean Central West Region of Argentina, covering an
area of 19,553 km2 with a population of 1,170,000 inhabitants [23]. It includes a densely populated
sector corresponding to the urbanized oasis, an intensive irrigated area, and areas of great natural
value as well as areas with more extensive uses such as units of mountain range, premountain range,
and non irrigated alluvial plains (Figure 1). River flows, namely those aimed at the supply of the urban
and irrigated areas, are regulated by the Potrerillos Dam [24].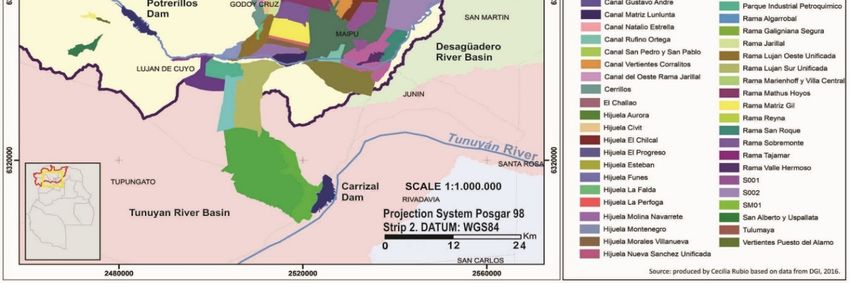
thus considering that such organization is a constituent part of the development of a continuous,
dynamic process. The sequential chart proposed includes several stages and steps corresponding to
the main timings, which have been adapted from the strategic map method [12], to identify, organize,
and describe strategies within the context of the water management model (Table 1).
Water 2019, 11, 463                                                                                      4 of 17
                             Table 1. Sequential description of organizational analysis [12].

                                Stages                   Steps                  Description
     With the aim to achieve a systematized knowledge of the basin with snow-glacial regime, it must
                                              Mission              Why do we exist?
be considered that the main contribution, represented by snowfall, its accumulation–compaction,
                                               Vision           What do we want to do?
                 Organizational
and freezing–melting            identity
                       phases, generates directValues
                                                flows complemented,       to a lesser  extent, with rainfall
                                                                What is important   to us?
contributions. These flows cause surface runoff,
                                              Strategy as well as  subsurface
                                                                     Our game plan groundwater flows
                                                                                 and
corresponding to   the various   components
                Organizational analysis      of  the  basin
                                           Strategic map     water
                                                                 Translate the(Figure
                                                                    balance     strategy2), which must be
assessed in orderOrganizational
                  to obtain a comprehensive  knowledge
                                linkage Balanced           of water
                                                   scorecard   To act,supply [14].
                                                                       measure,  and focus

         Figure 2. Main water balance components and physical processes in the Mendoza River basin.

3. Formulation  of thewe
     At this stage,    Organizational
                          proceeded to Model
                                          describe stakeholders involved in the proposed water
organization, based
     The strategic   on the of
                   analysis present
                               watersituation and envisaging
                                     organization            the future
                                                   was performed  usingone
                                                                        the [25].
                                                                            causalThe required
                                                                                    analysis   water
                                                                                             method,
management    objectives have  also been   considered in order to understand   the complexities and
thus considering that such organization is a constituent part of the development of a continuous,
dynamic process. The sequential chart proposed includes several stages and steps corresponding to
the main timings, which have been adapted from the strategic map method [12], to identify, organize,
Water2018, 10,x; doi:FOR PEER REVIEW                                      www.mdpi.com/journal/water
and describe strategies within the context of the water management model (Table 1).

                              Table 1. Sequential description of organizational analysis [12].

                              Stages                      Steps                    Description
                                                        Mission                 Why do we exist?
                                                         Vision              What do we want to do?
                      Organizational identity
                                                         Values              What is important to us?
                                                        Strategy                  Our game plan
                  Organizational analysis            Strategic map            Translate the strategy
                  Organizational linkage           Balanced scorecard       To act, measure, and focus

    At this stage, we proceeded to describe stakeholders involved in the proposed water organization,
based on the present situation and envisaging the future one [25]. The required water management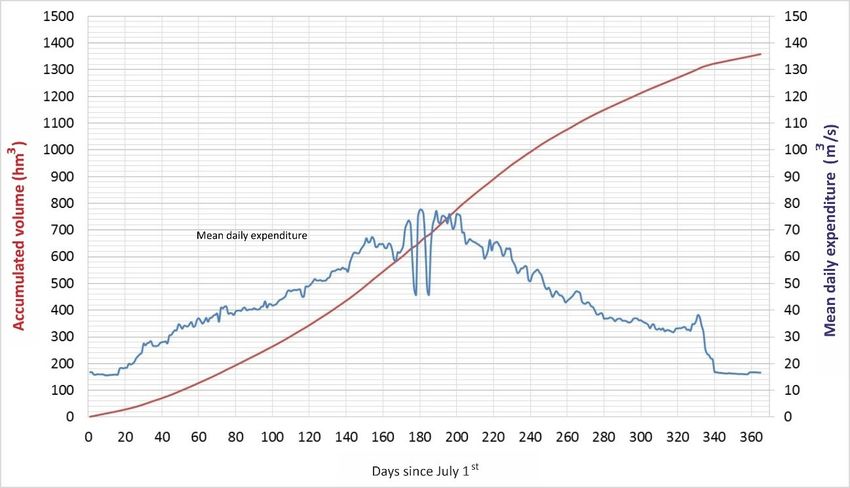
Water 2019, 11, 463                                                                                   5 of 17

objectives have also been considered in order to understand the complexities and problems of managing
the Mendoza River basin mainly in terms of making compatible the balance between supply and
demand. At this stage:

•     Mission is highlighted as the base of the water governance, the reason for its existence and its
      purpose, which is reflected in its activities.
•     Vision, in turn, presents an image of the future, the course desired to be adopted and that enables
      knowing what is to be accomplished.
•     Values allow knowing which aspects are important to water governance and constitute the
      reference framework for its image within the community. Values define the set of bases and
      principles that regulate water management of the organization and allow the building of the
      institutional philosophy [26].
•     Strategy is the set of ordered actions that are developed in a dynamic way, according to the
      context and the capabilities available to implement them. It describes how a water organization
      intends to create values in the organization in relation to the services it offers, as well as to
      their implementation. The strategy covers various topics in a simultaneous and complementary
      manner, depending on their implementation timings, with operational processes usually being
      quicker than those that include the application of innovation processes. It also requires a specific
      link between the users and the values proposed to meet their needs [27].

      A Strategic Map (SM) presents a causality structure enabling identification of components and
interrelations of the organizational model’s strategy with the aimed processes and results. It also
allows assessing, measuring, and improving the most critical processes leading to their successful
implementation. It makes it possible to conduct a strategic analysis, interpret the development stage
of the strategy, and visualize the connection between tangible and intangible assets. Furthermore,
an SM eases the assessment and selection of strategic options based on quantitative and qualitative
criteria. The strategy’s most critical factor is its efficient implementation, in order to ensure a sustained
creation of value. In turn, this depends on the management of key internal processes, namely
financial, operational, relations with costumers and innovation, and social and regulatory processes.
Strategic maps, therefore, become visualization tools that facilitate the organizational description and
drive the valuation process [13]. SM is thus a tool to measure organizational performance and to
analyze the strategy used. It allows creating value from four different perspectives: a) the financial
perspective, relative to the strategy for growth, profitability, and risk, viewed from the shareholder’s
perspective; b) the customer’s perspective, referring to the strategy to create value and differentiation
from the customer’s viewpoint; c) the process perspective, relative to the strategic priorities of the
different business processes that create satisfaction for clients and shareholders; and d) the learning
and growth perspective, which refers to those intangible assets that are more important to develop
strategies, such as human assets, information capital, and organizational culture.
      The resulting SM makes use of all four perspectives described and is an important tool for strategy
control through continuous monitoring. In addition, it allows explaining the strategy hypotheses in
a coherent, integrated, and systemic way [12]. For the purpose of applying the SM method in this
research, we adopted it by including an additional perspective related to water management, similar to
that adopted in the Water Strategic Plan 2020 [28].
      The Balanced Scorecard (BS) is a procedure corresponding to a management model of strategic
initiatives. One of its main attributes is controlling financial variables jointly with those related to
intangible assets. Using BS requires that objectives and associated indicators, both financial and
nonfinancial, derive from the water organization’s vision and strategy. For this reason, it is a method to
align trends, business units, human resources, and technological means with the water organization’s
strategy [29]. The BS is generally proposed as an organized process involving different perspectives.
Goals to reach are proposed for each perspective, which are causally related to one another. The model
explaining these relationships is the above-mentioned Strategic Map, which describes the strategy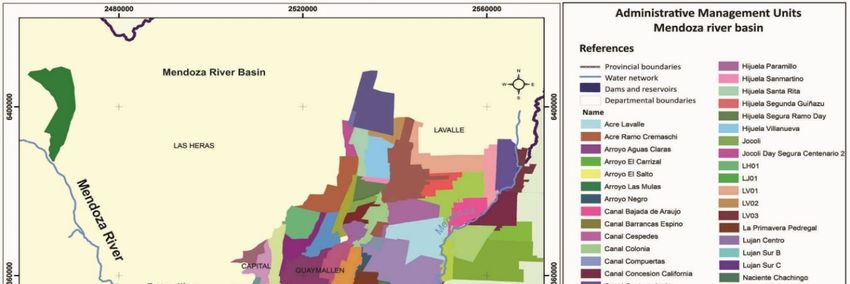
Water 2019, 11, 463                                                                                        6 of 17

hypothesis and raises the connection of the desired results of the strategy with the inducers and their
linkage that will make them possible through relationships in different perspectives [13].
      Social conflicts in the irrigated areas are manifested in: territorial transformations without
planning and regulation, poor service to the irrigator, imbalances and inequities in water distribution,
soil, water, and plant degradation, centralization in organizations, affecting territorial, economics,
and productive competitiveness, with lack of profitability and investments in rural areas under
irrigation and exodus of the peasant population to urban areas.

4. Modeling the Supply–Demand Water Balance

4.1. Water Balance Formulation
     It is understood as the result of an adjusted model that contrasts water supply and demand at
the level of the Administrative Unit of Management (AMU), considering agro-climatic conditions
influencing irrigation demand and also nonagricultural uses [30], the following:

                                                    CWB = GS − GD                                             (1)

where CWB represents the Mendoza River current water balance, GS is the mean Gross Supply from
the river and contributing streams, and GD is the total Gross Demand per AMU, with the total GD per
AMU defined as the sum of water demand per crop type:

                                              GD = Σ (RA × RC × ETc × Ef)                                     (2)

where RA is the registered area having water rights per type of use in the AMU, RC is the reduction
coefficient of water allocation depending upon the category of the granted water rights, ETc is crop
evapotranspiration per type of land use, and Ef is the current global irrigation efficiency.
     The AMUs were defined according to the available surface and groundwater sources of supply,
as well as the existent channel network. Complementarily, we considered the catchment and channeling
infrastructure, irrigation performance [31], edaphic conditions [32], and predominant land and water
uses. The distribution system in the Mendoza River basin was analyzed, and existing WUOs were
grouped into different AMUs according to their sources of water supply, the modality of operation of
the system, and homogeneity criteria of management (Figure 3).
     The WEAP model (Water Evaluation and Planning) [16] was adopted for calculating the
supply–demand water balance. For the estimation of irrigation efficiency [4], two components were
analyzed: the transport and distribution efficiencies through the canal system, and the irrigation
application efficiencies relative to the farm fields [33]. Field efficiency studies were analyzed and
compared with observed ones, particularly referring to the Mendoza River basin [34,35]. The following
modeling parameters were considered: registered areas, reduction coefficients according to category of
water rights, and average irrigation efficiencies (Table 2).

                Table 2. Water rights to irrigation water use and efficiencies. Mendoza River basin.

                                                  Permanent      Temporary      Public Town
                  Categories of Use                                                           Urban Uses
                                                 Water Rights   Water Rights     Irrigation
                  Surface area (ha)                 42,147         40,195           3,087       6,498
           Allocation reduction coefficient            1             0.8             0.8          1
             Farm application efficiency                                    51.4%
              Canal transport efficiency                                    81.8%
                  Global efficiency                                         42.0%
The AMUs were defined according to the available surface and groundwater sources of supply,
as well as the existent channel network. Complementarily, we considered the catchment and
channeling infrastructure, irrigation performance [31], edaphic conditions [32], and predominant
land and water uses. The distribution system in the Mendoza River basin was analyzed, and existing
Water
WUOs 2019, 11, 463
were 7 of 17
grouped into different AMUs according to their sources of water supply, the modality
of operation of the system, and homogeneity criteria of management (Figure 3).
Water 2018, 10, x FOR PEER REVIEW 7 of 17
The WEAP model (Water Evaluation and Planning) [16] was adopted for calculating the supply–
demand water balance. For the estimation of irrigation efficiency [4], two components were analyzed:
the transport and distribution efficiencies through the canal system, and the irrigation application
efficiencies relative to the farm fields [33]. Field efficiency studies were analyzed and compared with
observed ones, particularly referring to the Mendoza River basin [34,35]. The following modeling
parameters were considered: registered areas, reduction coefficients according to category of water
rights, and average irrigation efficiencies (Table 2).
Table 2. Water rights to irrigation water use and efficiencies. Mendoza River basin.
Permanent Temporary Public town Urban
Categories of use
water rights
water rights irrigation uses
Surface area (ha) 42,147 40,195 3,087 6,498
Allocation reduction coefficient 1 0.8 0.8 1
Farm application efficiency 51.4%
Canal transport efficiency 81.8%
Figure 3.
Global efficiencyAdministrative Management Units in the Mendoza River basin.
42.0% River basin.
4.2. Water Supply
4.2. Water Supply
In assessing surface water resources, we considered the mean supply from river and streams,
in In assessing
Water2018, surface
10,x; doi:FOR
accordance with PEER
the water
REVIEW
provisionsresources, we considered
of Provincial Laws 386 theand
mean
430,supply
whichfrom riveritand
as astreams,
www.mdpi.com/journal/water
mention in
reference
accordance with the
value for average provisions
flows [36]. The ofmean
Provincial
waterLaws
supply386from
and the
430,Mendoza
which mention
River wasit asobtained
a reference value
from the
for average flows [36]. The mean water supply from the Mendoza River was obtained
study of water volumes recorded at the Guido gauging station, located upstream of the Potrerillos from the study
of water volumes
Reservoir before therecorded
exit to at
thethe Guidovalley
fluvial gauging station,
in the located upstream
pre-mountain of the Potrerillos
massif (Figure 4). Reservoir
before the exit to the fluvial valley in the pre-mountain massif (Figure 4).
Figure 4. Mean daily
daily water
wateruse
usecurve
curveand
andaccumulated
accumulatedvolume
volumeat at Potrerillos
Potrerillos Dam.
Dam. (average
(average values
values for
for 1 July
1 July 20062006 toJune
to 30 30 June 2015).
2015).
The series of hydrologic years considered for modeling corresponds to the 2006–2015 period,
which has been considered highly representative, and includes data on precipitation, operation, and
spills. Yearly data of that period varies from rich to poor in terms of flow. In addition, for the same
period, real-time nival and meteorological data from the Horcones and Toscas stations in the HighWater 2019, 11, 463 8 of 17
Water
The2018, 10, x FOR
series PEER REVIEWyears considered for modeling corresponds to the 2006–2015 8period,
of hydrologic of 17
which has been considered highly representative, and includes data on precipitation, operation,
and spills. Yearly data of that period varies from rich to poor in terms of flow. In addition, for the same
volumes were computed from daily records, the average historical spills were assessed, and the
period, real-time nival and meteorological data from the Horcones and Toscas stations in the High
average historical discharges were estimated with monthly frequencies for the Cipolletti Dam [5].
Cordillera are made available to increase the integral hydrological knowledge of the basin. There is also
The operation of dams and reservoirs is dependent upon weather conditions, service provided by
information for this period about the operation of the Potrerillos Dam and Reservoir, the stabilization
some branch canals, occurrence of rainfall, or compensatory measures that make the rules of
of management,
operation be dynamicand theandcalibration
varyingof hydro-mechanical
from one cycle to other.equipment. Average historical volumes were
computed from daily
An analysis wasrecords,
made ofthe theaverage
operationshistorical
carriedspills
out inwere assessed,period.
the modeling and theThe average historical
recorded and
discharges
modeled volumes discharged by the Potrerillos Dam were compared (Figure 5) and the quality of of
were estimated with monthly frequencies for the Cipolletti Dam [5]. The operation
dams and reservoirs
simulations is dependent
performed was assessedupon with
weatherthe conditions,
Nash–Sutcliffe service provided
modeling by some
efficiency branch [37],
indicator canals,
occurrence
resulting of NSErainfall,
= 0.82.orThis
compensatory measuresthe
coefficient expresses thatrelative
make the rules of of
magnitude operation
the meanbesquare
dynamic and
error
varying from
relative one
to the cycle todata
observed other.
variance. The maximum value is NSE = 1.0, which can only be achieved
An analysis
if there is a perfectwasmatch
madebetween
of the operations
all observedcarried out in values.
and simulated the modeling
The closerperiod. The of
the values recorded
NSE
andaremodeled
to 1.0, the better discharged
volumes are the estimates
by theof discharges.
Potrerillos Dam Thewere
obtained NSE value
compared (Figure is 5)
quite
andhigh and
the quality
of therefore
simulations indicates
performedthat the
was simulation
assessed model
with the provides confidentmodeling
Nash–Sutcliffe results. Computations took into
efficiency indicator [37],
consideration the spill losses (Table 3).
resulting NSE = 0.82. This coefficient expresses the relative magnitude of the mean square error relative
to the observed data variance. The maximum value is NSE = 1.0, which can only be achieved if there is
a perfect match between allTable 3. Averages spills at Potrerillos Dam, 2006–2015.
observed and simulated values. The closer the values of NSE are to 1.0,
the better are the estimates of discharges. TheSpills obtained
(hmNSE
3) value is quite high and therefore indicates
that the
Augsimulation
Sep modelNov
Oct provides Decconfident
Jan results.
Feb Computations
Mar Apr May took Jun
into consideration
Jul Annualthe spill
65.0 94.6
losses (Table 3). 124.9 161.4 182.8 163.3 128.4 96.7 73.6 70.8 57.8 41.4 1260.7
Figure
Figure 5. Validation
5. Validation of recorded
of recorded andand modeled
modeled volumes
volumes discharged
discharged byby thePotrerillos
the PotrerillosDam,
Dam,2006–2015.
2006–
2015.
Table 3. Averages spills at Potrerillos Dam, 2006–2015.
4.3. Water Demand
Spills (hm3 )
For estimation of water demand, various indicators of the water use performance were used
Aug Sep Oct Nov Dec Jan Feb Mar Apr May Jun Jul Annual
[38]. Interactions between surface water and groundwater could not be omitted [3]. Demand and
65.0 94.6 124.9 161.4 182.8 163.3 128.4 96.7 73.6 70.8 57.8 41.4 1260.7
groundwater supply were estimated in a complementary manner for all AMUs considering
groundwater use or a conjunctive use of surface and groundwater. In the case of conjunctive use, it
4.3.was
Water Demand
taken into account that groundwater pumping was only carried out in those fields equipped
with wells and it was assumed that this pumped water was used to satisfy seasonal deficits due to
For estimation of water demand, various indicators of the water use performance were used [38].
scarce supply by the canal system [5].
Interactions between surface water and groundwater could not be omitted [3]. Demand and
Land use in agricultural areas has been characterized adopting representative crops for each
groundwater supply were estimated in a complementary manner for all AMUs considering
AMU. Irrigation requirements were determined through the Kc-ETo approach that combines the
groundwater use or a conjunctive use of surface and groundwater. In the case of conjunctive use,
reference evapotranspiration ETo with a crop coefficient characteristic of each crop [3,39]; net
it was taken into account that groundwater pumping was only carried out in those fields equipped
irrigation demands were computed by considering the local agricultural calendars for each type of
with
cropwells and it wastested
as previously assumed thatreferred
[40]. The this pumped
WEAPwater was[16]
software used to satisfy
accepts seasonal
that the Kc-ETodeficits
approachdue
is to
scarce supply by the canal system [5].
calculated externally by the user [41]. Thus, ETo was calculated using the FAO-PM method [39]; crop
coefficients (Kc) and other parameters (e.g., crop phonological dates, soil characteristics) were
obtained from literature [3,39,40] and adjusted to the AMU areas based upon existing field data [34].
Water2018, 10,x; doi:FOR PEER REVIEW www.mdpi.com/journal/waterWater 2019, 11, 463 9 of 17
Land use in agricultural areas has been characterized adopting representative crops for each
AMU. Irrigation requirements were determined through the Kc-ETo approach that combines the
reference evapotranspiration ETo with a crop coefficient characteristic of each crop [3,39]; net irrigation
demands were computed by considering the local agricultural calendars for each type of crop as
previously tested [40]. The referred WEAP software [16] accepts that the Kc-ETo approach is calculated
externally by the user [41]. Thus, ETo was calculated using the FAO-PM method [39]; crop coefficients
(Kc) and other parameters (e.g., crop phonological dates, soil characteristics) were obtained from
Water 2018, 10, x FOR PEER REVIEW 9 of 17
literature [3,39,40] and adjusted to the AMU areas based upon existing field data [34]. For those
computations, available climate data were used and spatially distributed using the method of Thiessen
polygons
For those[42]. These data
computations, allowed
available computing
climate data werecrop evapotranspiration
used and estimating
and spatially distributed effective
using the method
precipitation,
of Thiessen which directly
polygons [42]. contribute
These datatoallowed
meet crop demandscrop
computing [43],evapotranspiration
as well as other useful precipitation
and estimating
that may influence
effective the efficiency
precipitation, of water
which directly use [44].toSpatial
contribute information
meet crop demandswas [43],then obtained
as well with
as other a GIS
useful
tool. Data were used as input to the model built in the WEAP software [35]. It
precipitation that may influence the efficiency of water use [44]. Spatial information was then was therefore possible
to obtained
characterizewithanda GIS tool.
map theData
main were
landused
usesas(Figure
input to 6)the
andmodel
waterbuilt
and in the WEAP
irrigation software [35].
requirements forItthe
was therefore
Mendoza Riverpossible to characterize
basin after aggregating and map the
results main land
relative to alluses
AMUs.(Figure
Thus,6) and
thewater and irrigation
volumetric demand
requirements
distribution wasfor the Mendoza
assessed for all River basin
selected after
series aggregating
and AMUs. The results relativewas
procedure to all AMUs. Thus,
replicated the
for diverse
volumetric demand distribution was assessed for all selected series and AMUs.
hydrologic years in the 2006–2015 period, with inclusion of demand variability depending on each The procedure was
replicated
year’s weather for conditions.
diverse hydrologic years in the 2006–2015 period, with inclusion of demand variability
depending on each year’s weather conditions.
Figure6.6.Main
Figure Main land
land uses.
uses. Mendoza
MendozaRiver
Riverbasin.
basin.
4.4.4.4.
Supply–Demand Relationships
Supply–Demand Relationships
Supply
Supply and
and demand
demand relationshipshave
relationships havebeen
beendetermined
determinedforforthe
thecurrent
currentsituation
situationconsidering
considering all
all granted
granted waterwater rights,
rights, the current
the current irrigation
irrigation efficiency,
efficiency, andrules
and the the rules of operation
of operation of reservoirs,
of reservoirs, canals,
canals,
and and diversion
diversion dams. To dams. To we
this end, thisconsidered
end, we considered two key indicators
two key indicators for achieving
for achieving an
an appropriate
appropriate supply–demand balance in the Mendoza River basin—demand dissatisfaction
supply–demand balance in the Mendoza River basin—demand dissatisfaction and demand coverage and
demand coverage (percent of demand covered by the supply)—to estimate the percent guarantee of
irrigation water [45], for which the reference value for the region is 81% [46]. Demand dissatisfaction
corresponds to the difference between the water volume required to meet gross demand and the
amount of supply available to satisfy such demand. This factor also allows determining the missing
water volume (i.e., that cannot be covered by the available supply) [47]. There is also a link to the
failure total, which is the summation of the monthly failures expressed in volume, understandingWater 2019, 11, 463 10 of 17
(percent of demand covered by the supply)—to estimate the percent guarantee of irrigation water [45],
for which the reference value for the region is 81% [46]. Demand dissatisfaction corresponds to the
difference between the water volume required to meet gross demand and the amount of supply
available to satisfy such demand. This factor also allows determining the missing water volume
(i.e., that cannot be covered by the available supply) [47]. There is also a link to the failure total, which
is the summation of the monthly failures expressed in volume, understanding that a failure occurs
when, in a certain month, supply does not suffice to meet the gross demand. The demand coverage
corresponds to the percentage of gross demand effectively satisfied by the available supply, considering
the monthly coverage for each AMU. It is computed as the difference to 100% of the ratio between
failure and gross demand expressed in percentage. This value is lower than the global annual coverage
because, although annual supply could have been enough to meet annual demand, when performing
a monthly analysis, it became evident that the unevenness of such supply throughout the year results
in months with deficit and others with surplus [22].
The global annual balance is calculated from the summing to the year of the volumes of supplies
and demands. It indicates whether the annual supply–demand balance is deficient, excessive,
or balanced. In turn, the global annual coverage is the percent value of the ratio between annual
supply and annual gross demand. That coverage is limited to 100 percent to take into consideration
that monthly surpluses or deficits are unevenly distributed throughout the year. Deficits for each AMU
are computed monthly and expressed in hm3. The demand dissatisfaction is expressed in terms of
ratios between water volume and area, the latter referring to where water is lacking, and is expressed
in mm during the whole cycle. Another indicator is the percentage of gross demand met by the
available supply, which corresponds to the inverse of the demand dissatisfaction when expressed in
percentage [30].
5. Governance Organization and Forecasted Supply–Demand Balance
5.1. Governance Organizational Model
Mission, vision, values, and strategy are defined for the organizational water management model
in an irrigated area of the Mendoza River basin with high social and environmental dynamics:
Mission: Building up an organizational model for local water management that responds to the
socio-economic requirements of the land and water users of the irrigated area in the Mendoza River
basin, particularly considering the users’ participation through WUOs and AMUs.
Vision: Ensuring sustainable water use and productivity by achieving appropriate water demand
management in a context of climate variability and territorial transformation in the Mendoza
River basin.
Values: Responsibility with the community and the environment; effective participation of
users; technical administrative efficiency in management; transparency in actions and communication;
integrity and equity; commitment to local and territorial development.
Strategy: Achieving proper water administration performance in irrigated management units
in the Mendoza River basin, using an autarchic, technically based organizational model that enables
progressive implementation of training and innovation actions for sustainable use of water resources
in the territory and that contributes to the local development process.
The proposed organizational model refers to an institution of public nature but not state-run,
and with significant alliance with the private sector. Therefore, it must be taken into account that
while for public sector organizations, it is relevant to analyze the system water use and management
performance in order to achieve the defined mission with the highest level of success, for the private
sector organizations, more importance is given to water and land productivity. Considering the
above-mentioned aspects, objectives were grouped in agreement with key organizational dimensions,
and to determine causal connections between objectives and perspectives, that is, cause–effectWater 2019, 11, 463 11 of 17
relationships, through building a strategic map of the organizational and governance model for
Water 2018, 10, x FOR PEER REVIEW 11 of 17
the Mendoza River basin (Figure 7).
Figure
Figure 7. 7.Summary
Summaryofofthe
thestrategic
strategic map
map ofof the
the organizational
organizational model
modelfor
forwater
watergovernance
governancein in
thethe
irrigated area of the Mendoza River
irrigated area of the Mendoza River basin. basin.
Amongthe
Among themost
most important
important aspects
aspectsofof
thethe
methodological adaptation
methodological of theof
adaptation Strategic Map (SM)
the Strategic Map
and of a Balanced Scorecard (BS), the financial perspective was taken as the basis of the
(SM) and of a Balanced Scorecard (BS), the financial perspective was taken as the basis of the organizational
model because
organizational financial
model and financial
because socio-economic variables have variables
and socio-economic a great relevance
have a greatin institutional
relevance in
functioning. The following indicators were therefore adopted: (i) financial self-sufficiency,
institutional functioning. The following indicators were therefore adopted: (i) financial self-sufficiency, ratio
between the income resulting from water rights fees and the costs of operation, maintenance, and
ratio between the income resulting from water rights fees and the costs of operation, maintenance,
management of the water system [45]; (ii) performance of channel water allocation, ratio between
and management of the water system [45]; (ii) performance of channel water allocation, ratio between
effective and predicted recovery of water fees [45]; and (iii) monetary efficiency in water use,
effective and predicted recovery of water fees [45]; and (iii) monetary efficiency in water use, computed
computed as the ratio of costs per volume of water allocated [48]. These indicators are used per every
as the ratio of costs per volume of water allocated [48]. These indicators are used per every AMU.
AMU. The learning and growth perspective is next in importance relating to the implementation of
The learning and growth perspective is next in importance relating to the implementation of modern
modern technical management, thus improving the capacity building of human resources and
technical management,
modernizing the hard-thus improving
and software the water
of the capacity building of human resources and modernizing
system.
the hard- andwater
These software of the water
management system.
issues definitely support technological innovation and are paramount
to implement and develop both the learning process and the quality of the organizational processes.
In addition, BS was methodically executed around different perspectives whose achievable aims were
Water2018, 10,x; doi:FOR PEER REVIEW www.mdpi.com/journal/waterWater 2019, 11, 463 12 of 17
These water management issues definitely support technological innovation and are paramount
to implement and develop both the learning process and the quality of the organizational processes.
In addition, BS was methodically executed around different perspectives whose achievable aims were
proposed. The organizational model that explains those relations in the strategic map helps describe
the strategy’s hypothesis aimed at fully achieving the water management goals.
5.2. Scenarios for Simulation
Forecasted supply–demand water balance alternatives were analyzed for the 2030 horizon.
The Demand Dissatisfaction and Demand Coverage indicators were used. Three future scenarios (Table 4)
were proposed in addition to the current one (Sc0):
• Sc1 – when temporary water rights allow the use of up to 80% of the available water (i.e., RC = 0.80)
• Sc2 – when temporary water rights allow the use of up to 100% of the available water (i.e., RC = 1.0)
• Sc3 – when irrigation aims at satisfaction of the total registered area, including land where irrigation was
previously abandoned
The forecasts on the availability of surface water resources as influenced by climate change
consider a reduction of snowfall of 20% by 2080, and an increase in air temperature of 4 ◦ C for the
next century [49]. For modeling purposes, an average reduction rate of snowfall close to 0.31% per
year was adopted [50]. This decrease, together with the increase in temperature, induces a change in
the basin hydrology that, on average and for the projected period of analysis, shall modify the flow
regime and requires adaptability in the use of the water [51,52] because there would be higher flows
in winter and lower ones in summer compared to present [53]. The induced variation of climate and
hydrologic behavior in the context of global climate change [54,55] requires assessing water balance
changes and related impacts on different categories of water rights in terms of area and/or water
allocation. The cultivation of land presently abandoned but that could have water rights was not
considered except for scenario Sc3.
Table 4. Main characteristics of scenarios used for supply–demand water balance modeling, Mendoza
River basin.
Climate-Change- Efficiency of RC of Temporary
Scenarios for the 2030 Horizon
Affected Variables Water Use Water Rights
Sc0 – Current water use and governance Present condition 51% 0.80
Sc1 – Temporary water rights with Reduced snowfall, 59% 0.80
RC = 80% higher temperature in
Sc2 – Temporary water rights with lowlands,
59% 1.00
RC = 100% increased
evapotranspiration
Sc3 – Water service to the total
59% 1.00
registered area
Factors commonly taken into account for developing and simulating all scenarios (Table 4) consist
of: (i) an improved irrigation water management providing for a reasonable efficiency of water use of
59% without requiring structural changes in the canal system; (ii) a decrease in mountain snowfall that
would lead to the variation of the river flow regime, thus to adaptation changes in water supply; (iii) an
increase in temperature in the lowlands that likely will cause variable increases in evapotranspiration
and demand for water, depending on the type of water use; (iv) variation in land use, namely referring
to the distribution of areas cropped and urbanized; and (v) changes in management and operation of
the basin water system, mainly relative to the governance issues, improvement of the AMUs, and more
effective participation of users through the respective WUOs.Water 2019, 11, 463 13 of 17
5.3. Forecasts for Supply–Demand Water Balance for the 2030 Horizon
The previously defined gross demand, the supply and failure total, the percent coverage
of demand by supply (including total failures), the global supply–demand balance, and global
annual coverage of demand by supply were estimated using WEAP for both agricultural and other
consumptive uses. Results relative to the considered scenarios are presented in Table 5.
Table 5. Comparing results for supply–demand water balance scenarios for the 2030 horizon, Mendoza
River basin.
Registered Global Global
Gross Supply Failure Demand
Scenarios for the 2030 Cropped Annual Annual
Demand Total Total Coverage
Horizon Area Balance Coverage
(hm3 ) (hm3 ) (hm3 ) (%)
(ha) (hm3 ) (%)
Sc0 – Current water use
54,720 955.49 1131.05 −34.26 96.4% 175.57 100%
and governance
Sc1 – Intermittent water
54,720 793.09 1040.47 −4.07 99.5% 247.38 100%
rights, RC = 0.8
Sc2 – Intermittent water
59,342 866.30 1042.79 −5.58 99.4% 176.49 100%
rights, RC = 1.0
Sc3 – Service to the total
76,534 1170.44 1049.65 −170.74 85.4% −120.79 86%
registered area
The current balance (Sc0) does not include the abandoned old lands, but does take into account
the factors of the current climate and the existing efficiency in the farm, which reaches an average
value of 51.4%. Analyzing the indicators produced when modeling with scenario Sc1 (temporary water
rights and RC = 0.8), it was observed that indicators are generally better than those obtained for the
current condition (Table 5) despite global change-influenced climate and hydrologic variables for the
2030 horizon, resulting in increased demand and more varied water supply. That improvement is likely
due to higher farm application efficiency, 59% vs 51%, and to an optimized operation of reservoirs
and diversion dams, which are expected to contribute to decreasing failures and improving the water
supply distribution service, thus resulting in an increased guarantee of irrigation water availability.
For Sc2 (temporary water rights and RC = 1.0), there is a larger registered cropped area due
to transformation of temporary into permanent water rights. An increase in annual gross demand
of 73.21 hm3 occurs and there is a negligible increase of 1.51 hm3 in the sum of failures, while the
base water supply remains the same. An improved supply is considered due to improvements
in water distribution and global efficiency, which are expected to keep failures, demand coverage,
and global annual coverage at levels similar to Sc1. However, the global annual balance diminishes.
Notwithstanding, analyzed in general, this difference continues to be positive for average years.
The modality Sc3 is for a scenario where the whole of the granted area in the basin is predicted
to have irrigation, thus including all abandoned lands, recently or not. The sum of failures reaches
then a high value of 170.74 hm3 , particularly important due to high demand when river runoff is low.
Demand coverage falls to 85% while the gross demand increases about 215 hm3 and the global annual
coverage reaches 86%. But even so, these values are above the regional reference value of the irrigation
water guarantee percentage. Thus, scenario Sc3 requires adopting additional measures not considered
in this study.
6. Conclusive Remarks
A strategic formulation of the organizational model was defined after performing a strategic
analysis of the organization. Designing the strategic map of the organization from the perspective
of users and the community and relating to new perspectives on water management, processes,
learning and knowledge, and finance responded well to objectives. Moreover, in the proposed
organizational and governance model, the effective participation of users was considered as the main
basis for formulating institutional cross-sectoral (horizontal/integral) policies. That participation isWater 2019, 11, 463 14 of 17
aimed at concrete decision-making by all stakeholders involved in every circumstance concerning
water management. The result is that the designed SM for the Mendoza River basin is aimed at
supporting sustainable productive development and satisfaction of socio-economic requirements
through an appropriate supply–demand management and adopting volumetric water delivery to
users. The Administrative Units of Management (AMUs) were adopted to manage water at local level,
and the areas of influence of the WUOs were reformulated accordingly.
The evaluation of the water resources of the Mendoza River basin was performed and an analysis
was made of the operations carried out in the modeling period of 2006–2015. The recorded and
modeled volumes at the Potrerillos dam were compared. A high value of 0.82 for the Nash–Sutcliffe
modelling efficiency indicator of goodness of fit was obtained, which allowed considering that the
available supply was confidently assessed. The demand was estimated on basis of previous studies
and used the updated methodology of FAO56 guidelines. The balance supply-demand was computed
with model WEAP. For the modeling period of 2006–2015 three scenarios were tested and compared
with the base one referring to present conditions. It was observed that more requiring scenarios
than present were evaluated positively but not a scenario where irrigated areas would increase much
to include presently abandoned ones. Positive results were obtained due to the new organization
and governance model, which assumed decentralized water management through the AMUs, users’
participation with the Water User Organizations (WUOs), and increased global water efficiency due
to improved water management and canal transport and deliveries through adopting innovative
approaches related to hard- and software, as well as capacity building.
Author Contributions: M.S.-S. made the characterization of the study basin and the coordination in modeling the
water balance and J.F.-D. formulated the model of water governance. Both authors wrote the article.
Acknowledgments: Luis S. Pereira, University of Lisbon for advising on irrigation modernization and
management and revising the last version of the article, Joan Mateu and Joan Romero, Universitat de València,
and Antonio Rico Amorós, Universidad de Alicante, for contribution of theoretical framework. José Álvarez;
Carlos Sánchez; Juan Pina, and Bernardo Herrera for their strategic contributions of the Water 2020 Plan in
the water management of Mendoza that were considered in the article. Jorge Chambouleyron, Cecilia Rubio,
Elena Abraham, Juan Satlari, Guillermo Cuneo, Gonzalo Muñiz, and Nora Mustoni for the collaboration and
scientific review of the materials and methods used; Elma Montaña, Christopher Scott, and Facundo Martin for
the conceptual vision of the science and policy dialogue considered in the formulation of the model.
Conflicts of Interest: The authors declare to have no conflicts of interest.
References
1. Salomón, M.; Álvarez, J. Preservación y Promoción de Zonas Irrigadas en el Marco del Plan Agua 2020 y Plan de
Ordenamiento Territorial de Mendoza. I Jornadas Nacionales de Investigación en Ciencias Sociales. Cambio Climático
y Desarrollo Sostenible en las Ciencias Sociales; Facultad de Ciencias Políticas, Universidad Nacional de Cuyo:
Mendoza, Argentina, 2016.
2. Salomón, M.; Rosell, M.; Thomé, R.; Albrieu, H.; López, J.; Ruiz Freites, S.; Yapura, J. El Aporte de la GIRH a
Través de las Organizaciones de Usuarios en el Ordenamiento Territorial y Desarrollo Estratégico de Mendoza. XXI
Congreso Nacional del Agua; CONAGUA: Resistencia, Chaco, 2011; Chapter 2; pp. 42–58.
3. Pereira, L.S.; de Juan, J.A.; Picornell, M.A.; Tarjuelo, J.M. El Riego y sus Tecnologías; Centro Regional de
Estudios del Agua, Universidad de Castilla-La Mancha: Albacete, Spain, 2010; 296p, Available online:
http://crea.uclm.es/crea2/sp/index.php (accessed on 16 September 2018).
4. Chambouleyron, J. Riego y Drenaje. Técnicas Para el Desarrollo de una Agricultura Regadía Sustentable Mendoza;
Editorial Universidad Nacional de Cuyo, EDIUNC: Mendoza, Argentina, 2005; 1026p.
5. Departamento General de Irrigación (DGI). Datos y estadísticas Cuencas de Mendoza. Dirección de Gestión
Hídrica; Dirección de Recaudación y Finanzas: Mendoza, Argentina, 2016.
6. Salomón, M.; Ruiz Freites, S. La Descentralización en la Administración del Agua. In Proceedings of the XX
Congreso Nacional del Agua, Mendoza, Argentina, 9–13 May 2005.
7. Salomón, M. El desafío del riego frente a la escasez hídrica en Mendoza. In Proceedings of the VI Jornadas
de Riego y Fertirriego, Luján de Cuyo, Mendoza, Argentina, 7–9 November 2012; Facultad de Ciencias
Agrarias, Universidad Nacional de Cuyo: Mendoza, Argentina, 2012.Water 2019, 11, 463 15 of 17
8. Domínguez, J. Hacia una Buena Gobernanza Para la Gestión Integrada de los Recursos Hídricos. VI Foro Mundial del
Agua. Documento Temático de las Américas: Los Mensajes Clave de las Américas. Los Marcos Legales e Institucionales
del agua dan Certidumbre a los Agentes Sociales y Favorecen el Financiamiento para el Sector Hídrico, Ordenamiento
Territorial y Desarrollo Estratégico de la Cuenca del Rio Mendoza, Argentina. Adopción de la Ley de Ordenamiento
Territorial, Integrando los Principios de la GIRH World Water Fórum; Colegio de México: Mexico City, Mexico,
2011; Volume 1, pp. 22–23.
9. Farinós, J. Gobernanza Territorial Para el Desarrollo Sostenible: Estado de la Cuestión y Agenda; Boletín de la A.G.E.
Nº 46; Asociación de Geógrafos Españoles: Madrid, Spain, 2008; Volume 46, pp. 11–32.
10. Pedregal Mateos, B.; Laconi, C.; Mancilla García, M.; Orozco Frutos, G.; Figueroa, A.; Cabello Villarejo, V.;
Moral Ituarte, L. Collaborative mapping of wáter conflicts in Andalusia, Spain. In Proceedings of the Open
Science Conference Pecs II, Oaxaca, Mexico, 7–10 November 2017.
11. Romero, J.; Farinós, J.; Presentación en Romero, J.; Farinós, J. (Eds.) Gobernanza Territorial en España.
Claroscuros de un Proceso a Partir del Estudio de Casos; Publicaciones de la Universidad de Valencia/Instituto
Interuniversitario de Desarrollo Local, Colección Desarrollo Territorial: Valencia, Spain, 2006; pp. 15–19.
12. Kaplan, R.; Norton, D. Mapas Estratégicos. Convirtiendo los Activos Intangibles en Resultados Tangibles;
Harvard Business Review Press: Barcelona, Spain, 2004; ISBN 9781591391340.
13. Bustos, G. Mapa de Objetivos Organizacionales: Una Generalización del Mapa Estratégico; Pontificia Universidad
Católica de Valparaíso: Valparaíso, Chile, 1997.
14. Abraham, E.; Salomón, M.; Rubio, C.; Soria, D. Aportes Metodológicos para Evaluación Hidrológica de Cuencas
Andinas. Estudio Cuenca Río Mendoza; Revista Zonas Áridas; Centro de Investigaciones de Zonas Áridas,
Universidad Nacional Agraria La Molina: Lima, Perú, 2010; Chapter 1; pp. 9–33.
15. FAO-PNUD. Planes Directores de Ordenamiento de los Recursos Hídricos de la Provincia de Mendoza.
Informe Principal Plan Cuenca Río Mendoza; Proyecto PNUD/FAO/ARG/00/008; FAO-PNUD:
Mendoza, Argentina, 2004.
16. Stockholm Environment Institute (SEI). WEAP (Water Evaluation and Planning). Available online: http:
//www.weap21.org/ (accessed on 8 February 2017).
17. Morábito, J.; Hernández, J.; Martinis, N. Fornero, L. Modelación Hidrológica de la Cuenca Norte de Mendoza;
IT Nº 146; Centro Regional Andino (CRA): Mendoza, Argentina, 2012.
18. Piccone, L.; Salomón, M. El manejo del Agua de Riego en la Provincia de Mendoza. Ejemplo de usos y
Aprovechamiento de Aguas en el Gran Mendoza; Mendoza en el 2000; Facultad de Ciencias Agrarias, Universidad
Nacional de Cuyo, Centro Coordinador de Ediciones Académicas: Mendoza, Argentina, 1994; Chapter 12;
pp. 97–103.
19. GWP. Manual para la Gestión Integrada de Recursos Hídricos en Cuencas”. Network of Basin Organizations.
Global Water Partnership International, 1st ed.; Empresa Gráfica Mosca: Paris, Republiqué Française, 2009; 111p.
20. Estrada, F.; Luján García, L. Criterios de Garantía en la Planificación de Regadíos; CEDEX (Centro de Estudios y
Experimentación de Obras Públicas): Madrid, Spain, 1993.
21. Pereira, L. Necessidades de agua e programação da rega: Modelação, avanços e tendências. In Modernización
de Riegos y Uso de Tecnologías de Información (Taller Internacional, La Paz, Bolivia, September 2007); Ruz, E.,
Pereira, L.S., Eds.; CYTED and PROCISUR/IICA: Montevideo, Uruguay, 2008; pp. 14–16.
22. Balairón Pérez, L. Gestión de Recursos Hídricos; Politext: Barcelona, Spain, 2002; Volume 89.
23. INDEC. Censo 2010. Año del Bicentenario; Instituto Nacional de Estadísticas y Censos (INDEC):
Buenos Aires, Argentina, 2010.
24. Salomón, M.; Abraham, E.; Sánchez, C.; Rosell, M.; Thomé, R.; López, J.; Albrieu, H. Análisis de los Impactos
Ambientales Generados por las Presas Sobre los Sistemas de Riego. In Tecnologías para o uso Sustentável da Água
em Regadió; Cuenca Río Mendoza, P.L., Brea Victoria, F., Paredes, P., García, M., Palacios, E., Torrecillas, A.,
Eds.; Edições Colibri: Lisboa, Portugal, 2008; Chapter 5.7; pp. 122–128.
25. Godet, M. Prospectiva Estratégica: Problemas y Métodos, 2nd ed.; Cuaderno Nº 20; Ediciones: Donostia-San
Sebastián, Spain, 2007.
26. Matus, C. Política, Planificación y Gobierno. Organización Panamericana de la Salud; Organización Mundial de la
Salud, Fundación Altadir, ILPES: Buenos Aires, Argentina, 1987; pp. 242–359.
27. Miklos, T.; Arroyo, M. Prospectiva y Escenarios para el Cambio Social; Serie Working Papers; FCPS-UNAM:
Mexico City, Mexico, 2008.You can also read