Planning Year 2014 LOLE Study Report - Loss of Load Expectation Working Group (LOLEWG) - Vectren
←
→
Page content transcription
If your browser does not render page correctly, please read the page content below
Planning Year 2014
LOLE Study Report
Loss of Load Expectation Working Group (LOLEWG)

MISO 2014 LOLE Study Report                                                                                                        November 1, 2013

Contents
1      Executive Summary .............................................................................................................................. 5
    Study Enhancements ................................................................................................................................ 6
    Acknowledgements ................................................................................................................................... 6
2      LOLE Study Process Overview ............................................................................................................. 7
    2.1       Future Study Improvement Considerations .................................................................................. 7
3      Transfer Analysis .................................................................................................................................. 9
    3.1       Calculation Methodology and Process Description....................................................................... 9
       3.1.1          Tiered generation pools ........................................................................................................ 9
       3.1.2          Redispatch .......................................................................................................................... 10
    3.2       Power Flow Models and Assumptions ........................................................................................ 12
       3.2.1          Tools used ........................................................................................................................... 12
       3.2.2          Inputs required .................................................................................................................... 12
       3.2.3          Power Flow Modeling .......................................................................................................... 12
       3.2.4          General Assumptions .......................................................................................................... 13
    3.3       Results ........................................................................................................................................ 15
       3.3.1          Out-Year (2018 and 2023) .................................................................................................. 19
4      Loss of Load Expectation (LOLE) Analysis ......................................................................................... 29
    4.1       LOLE Modeling Input Data and Assumptions ............................................................................. 29
    4.2       MISO Generation ........................................................................................................................ 29
       4.2.1          MISO Midwest ..................................................................................................................... 29
       4.2.2          MISO South ......................................................................................................................... 31
    4.3       MISO Load Data ......................................................................................................................... 31
       4.3.1          Load Forecast Uncertainty .................................................................................................. 32
    4.4       External System .......................................................................................................................... 34
       4.4.1          Development of the External Model Import Tie Capability .................................................. 35
       4.4.2          External Zones Base PRM and Adjustments ...................................................................... 36
       4.4.3          Loss of Load Expectation Analysis and Metric Calculations ............................................... 38
       4.4.4          MISO LOLE Analysis and PRM Calculation ....................................................................... 38
       4.4.5          LRZ LOLE Analysis and Local Reliability Requirement Calculation ................................... 39
5      MISO System Planning Reserve Margin Results ............................................................................... 40
    5.1       Planning Year 2014-2015 MISO Planning Reserve Margin Results .......................................... 40
       5.1.1          Comparison of PRM Targets Across Five Years ................................................................ 41
    5.2       Future Years 2015 through 2023 Planning Reserve Margins ..................................................... 41

                                                                              2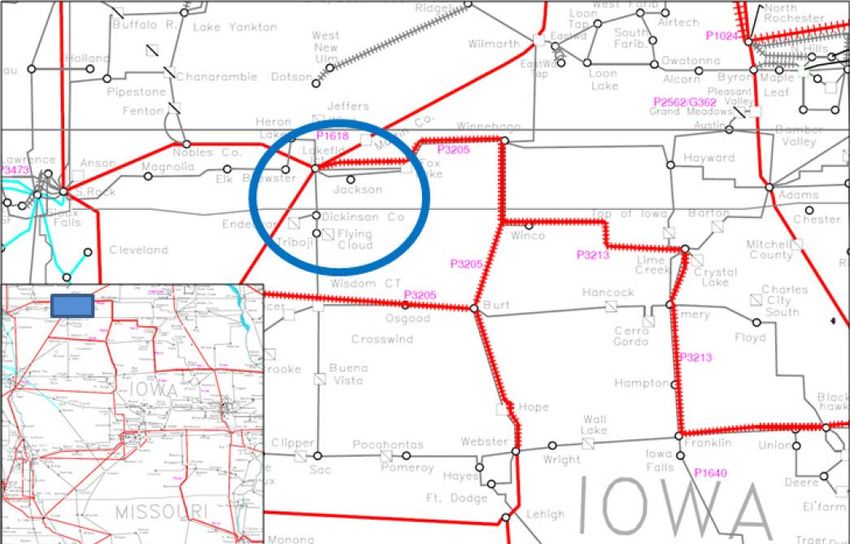
MISO 2014 LOLE Study Report                                                                                                       November 1, 2013

6      Local Resource Zone (LRZ) Analysis – LRR Results ......................................................................... 43
    6.1        Planning Year 2014-2015 Local Resource Zone (LRZ) Analysis ............................................... 43
Appendix A: Load Forecast Uncertainty ..................................................................................................... 45
    A.1        LFU Methodology for Planning Year 2014 .................................................................................. 45
       A.1.1          Historical Data Used in the Model ....................................................................................... 45
       A.2        MISO LFU results .................................................................................................................... 49
Appendix B: Comparison of Planning Year 2013 to 2014 .......................................................................... 50
    B.1.       Waterfall Chart Details ................................................................................................................ 53
       B.1.1          Tariff Construct .................................................................................................................... 53
       B.1.2          MISO Midwest LFU Correction ........................................................................................... 54
       B.1.3          External Enhancements ...................................................................................................... 54
       B.1.4          Midwest Internal Changes ................................................................................................... 54
       B.1.5          Midwest External Changes ................................................................................................. 54
       B.1.6          UCAP to ICAP (ICAP Waterfall Chart Only) ....................................................................... 54
       B.1.7          MISO South Addition ........................................................................................................... 55
       B.1.8          LRZ LFU (Zonal Construct) ................................................................................................. 55
Appendix C: Transfer Analysis .................................................................................................................... 56
    C.1: Tier Maps ......................................................................................................................................... 56
    C.2: 2014 Detailed Results ..................................................................................................................... 61
Appendix D            Compliance Conformance Table......................................................................................... 79
Appendix E            Acronyms List Table ............................................................................................................ 84

                                                                              3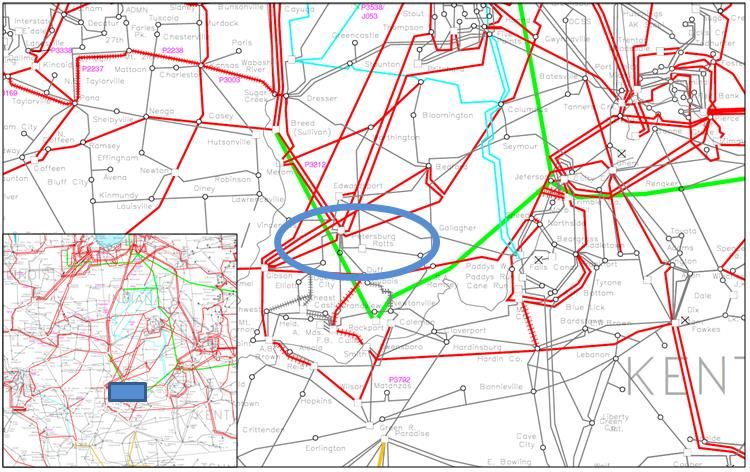
MISO 2014 LOLE Study Report                                                        November 1, 2013

Revision History

                      Reason for Revision                          Revised by:       Date:
Final Posted                                                     MISO Staff      11/1/2013
Updated Tables 1.1-1, 6.1-1, 6.1-2, and 6.1-3. Changes reflect   MISO Staff      2/7/2014
the physical location of pseudo-tied capacity

                                                   4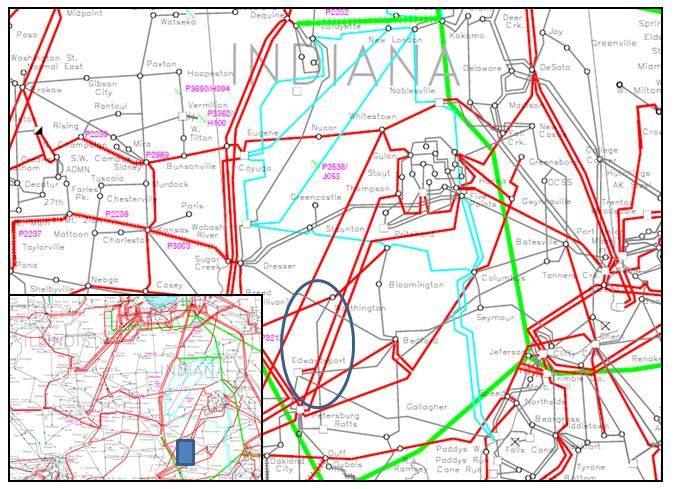
MISO 2014 LOLE Study Report November 1, 2013
1 Executive Summary
Midcontinent Independent System Operator (MISO) conducts an annual Loss of Load Expectation
(LOLE) study to determine a Planning Reserve Margin Unforced Capacity (PRMUCAP), zonal per-unit
Local Reliability Requirements (LRR), Capacity Import Limits (CIL) and Capacity Export Limits (CEL). The
results of the study and its deliverables supply inputs to the MISO Planning Resource Auction (PRA). For
2013, the LOLE study underwent significant alterations as the integration of the MISO South region into
the analysis necessitated study process changes.
Key findings and results from the 2013 LOLE study include:
A PRMUCAP of 7.3 percent being applied to the Load Serving Entity (LSE) coincident peaks has
been established for the planning year starting June 2014 and ending May 2015
The use of the GE Multi-Area Reliability Simulation (MARS) software for Loss of Load analysis
provided results applicable across the MISO market footprint, while any impacts due to
transmission limitations will be addressed in the PRA
This report provides the PRA with the overall 7.3 percent PRMUCAP requirement, the per-unit LRR
values and the initial zonal CIL and CEL for each Local Resource Zone (LRZ). The CILs and
CELs may be adjusted within the PRA to assure that the resources cleared in the auction can be
reliably delivered simultaneously.
In accordance with the MISO Tariff, the reliability objective of an LOLE study is to determine a
minimum planning reserve margin that would result in the MISO system experiencing a less than
1
one day loss of load event every 10 years. The MISO analysis shows that the system would
achieve this reliability level when the amount of installed capacity available is 1.148 times that of
the MISO system coincident peak.
Zonal-based deliverables are set forth in the LOLE charter (Table 1.1-1)
LRZ- LRZ- LRZ- LRZ- LRZ- LRZ- LRZ- LRZ- LRZ-
RA and LOLE Metrics 1 2 3 4 5 6 7 8 9
MISO PRMUCAP 7.3% 7.3% 7.3% 7.3% 7.3% 7.3% 7.3% 7.3% 7.3%
LRR UCAP per unit of LRZ Peak
1.107 1.153 1.147 1.182 1.198 1.116 1.152 1.293 1.124
Demand
Capacity Import Limit (CIL) (MW) 4,347 3,083 1,591 3,025 5,273 4,834 3,884 1,602 3,585
Capacity Export Limit (CEL) (MW) 286 1,924 1,875 1,961 1,350 2,246 4,517 3,080 3,616
Table 1.1-1: 2014 Planning Resource Auction deliverables
1
A one-day loss of load in 10 years (0.1 day/year) is not necessarily equal to 24 hours loss of load in 10 years (2.4 hours/year).
5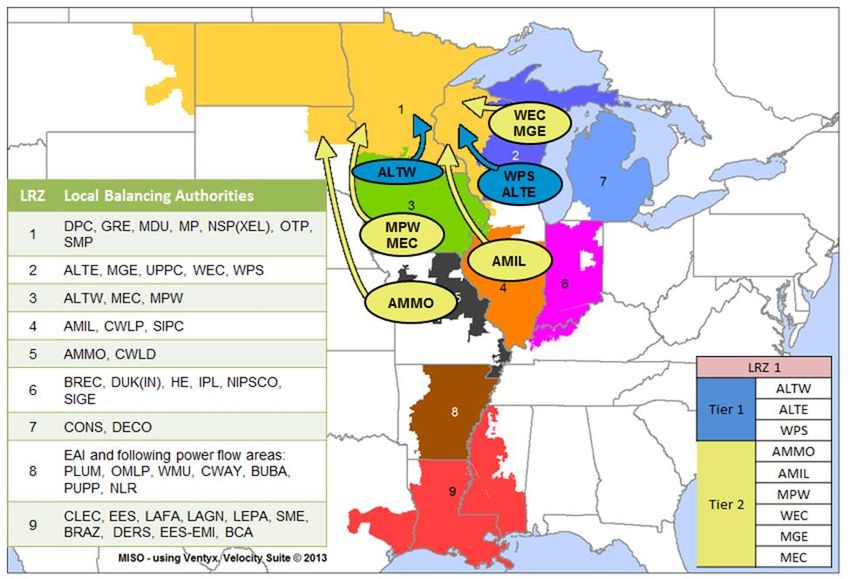
MISO 2014 LOLE Study Report November 1, 2013
Study Enhancements
For the 2014-2015 planning year, significant changes were made to LOLE study due to MISO South’s
integration into MISO. The addition of MISO South added a large amount of generation and load to the
MISO footprint as well as two new LRZ (Figure 1.1-1). Modeling enhancements became necessary in
order to mature and stabilize the planning reserve margin and reliability requirements.
MISO enhanced the LOLE analysis as follows:
The adjustment of capacity for a particular study area to meet 0.1 days per year LOLE was
aligned with the MISO Tariff
The Load Forecast Uncertainty (LFU) calculation was refined and improved and the LFU
modeling methodology was improved for consistency between the MISO and LRZ LOLE analyses
The amount of external support MISO can receive in times of need was enhanced so that a more
accurate reflection of this support is modeled
The transfer analysis methodology used to determine the CIL and CEL values went through many
improvements
All of these enhancements are discussed in further detail throughout this report.
Acknowledgements
The stakeholder review process played an integral role in this study and the collaboration of the Loss of
Load Expectation Working Group (LOLEWG) was much appreciated by the MISO staff involved in this
study. Stakeholder review was especially valuable this year as the MISO Resource Adequacy zonal
construct was implemented for the second annual PRA as well as the integration of MISO South.
Figure 1.1-1: Local Resource Zones (LRZ)
6
MISO 2014 LOLE Study Report                                                                  November 1, 2013

2 LOLE Study Process Overview
In compliance with Module E-1 of the MISO Tariff, MISO performed its annual Loss of Load Expectation
(LOLE) study to determine the Planning Reserve Margin (PRM) on an unforced capacity (UCAP) basis for
the MISO system and the per-unit Local Reliability Requirements (LRR) of Local Resource Zone (LRZ)
Peak Demand for the planning year 2014-2015.

In addition to the LOLE analysis, a transfer analysis was performed to determine Capacity Import Limits
(CIL) and Capacity Export Limits (CEL). The CIL is used in conjunction with the LOLE analysis results in
the Planning Resource Auction (PRA). The 2014-2015 per-unit LRRUCAP values determined by the LOLE
                                                              2
analysis will be multiplied by the updated LRZ Peak Demand forecasts submitted for the 2014-2015
Planning Resource Auction to determine each LRZ’s LRR. Once the LRR is determined, the CIL values
are subtracted from the LRR to determine each LRZ’s Local Clearing Requirement (LCR) consistent with
                3
Section 68A.6 of Module E-1. Table 2.0-1 shows an example calculation pursuant to Section 68A.6 of
                                   4
the current effective Module E-1. The actual effective PRM Requirement (PRMR) will be determined
when the updated LRZ Peak Demand forecasts are submitted in the 2014-2015 PRA and the
simultaneous feasibility test is complete, which ensures CIL and CEL values are not violated.

       Local Resource Zone (LRZ) EXAMPLE                         Example LRZ            Formula Key
                                     Installed Capacity (ICAP)        17,442   [A]
                                    Unforced Capacity (UCAP)          16,326   [B]
                           Adjustment to UCAP {1d in 10yr}                50   [C]
                 Local Reliability Requirement (LRR) (UCAP)           16,376   [D]=[B]+[C]
                                            LRZ Peak Demand           14,270   [E]
                   LRR UCAP per-unit of LRZ Peak Demand               114.8%   [F]=[D]/[E]
                                   Capacity Import Limit (CIL)         3,469   [G]
                                   Capacity Export Limit (CEL)         2,317   [H]

          Proposed PRA (UCAP) EXAMPLE                            Example LRZ            Formula Key
                              Forecasted LRZ Peak Demand              14,270   [I]
                  Forecasted LRZ Coincident Peak Demand               13,939   [J]
                  Local Reliability Requirement (LRR) UCAP            16,382   [K]=[F]x[I]
                          Local Clearing Requirement (LCR)            12,913   [L]=[K]-[G]
                                  Zone's System Wide PRMR             14,957   [M]=[1.073]X[J]

                                             Effective PRMR           14,957 [N]= Higher of [L] or [M]
                                             Effective PRM       7.3% [O]=[N]/[J]-1
                                     Table 2.0-1: Example LRZ calculation

     2.1 Future Study Improvement Considerations
The calculation of the 2014 MISO PRM values captures firm external capacity purchases and sales in the
accounting of the installed and unforced capacity values. These firm transactions are treated differently

2
  https://www.misoenergy.org/_layouts/MISO/ECM/Redirect.aspx?ID=158707
3
  https://www.misoenergy.org/Library/Tariff/Pages/Tariff.aspx#
4
  Effective Date: November 1, 2013

                                                           7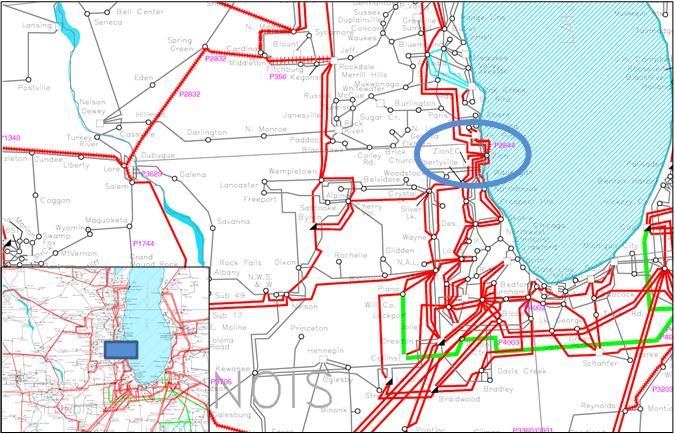
MISO 2014 LOLE Study Report November 1, 2013
for the LRZ LOLE analysis. External sales to PJM Interconnection were derated from the available
capacity in that particular LRZ. However, firm purchases were not modeled as required by the MISO
5
Tariff. Section 68A.5 of Module E-1 of the MISO Tariff states the LRR should be determined “without
consideration of the LRZ’s CIL.” MISO realizes there is an inconsistency here and that there is potential
for possible improvements in future studies.
The LOLE analysis utilizes a five-year Equivalent Forced Outage Rate Demand (EFORd) value to
determine the PRM and LRR values. This differs from what resources use as their forced outage rate in
the PRA. In the PRA, resources use a three-year XEFORd value, which excludes impacts for outages
that were caused by events Outside Management Control (OMC). The reasons for these differences can
be discussed for future studies.
Industry standard practice in the adjustment of capacity to meet 0.1 days per year LOLE is to add a
perfect negative or positive unit within the model. However, the MISO tariff explicitly describes a different
methodology in determination of LRZ LRR. Understanding the tariff methodology and possible future
changes to the adjustment methodology should be discussed for future LOLE studies to address any
impact of this inconsistency.
Currently, the LCR = LRR – CIL, which is a linear relationship. Further analysis is needed to refine the
relationship of CIL to LCR. A future goal is to provide a range of LCRs depending on a range of support
available to each zone. Analysis to derive a more representative LCR as a function of CIL should be
investigated.
MISO LOLE analysis utilizes Operating Reserves in the calculation of the PRM values rather than holding
them aside. In other words, the PRMR does not procure sufficient Planning Resources to hold Operating
Reserves during a LOL event. This assumption should be revisited for consideration in future studies;
including how other RTOs handle these requirements.
The 2014 study modeled all Network Resources and Energy Resources in the determination of the PRM.
This approach should be validated prior to future studies.
Demand Response and Wind Generation Resource modeling in the LOLE analysis should be revisited
based on the Independent Market Monitor’s (IMM) 2012 State of the Market Recommendations. Modeling
Behind-the-Meter-Generation (BTMG) with an Installed Capacity (ICAP) and its associated forced outage
rate could be implemented to align with Capacity Resource qualification. Additionally, treatment of wind
resources in the LOLE analysis, and the capacity credit for qualified wind resources should be reviewed.
As the CIL and CEL study process matures, MISO expects to identify additional improvements. Possible
improvements for the 2014 study include:
MISO to create model summaries at the zonal or area level to facilitate model review
Setting MISO wind dispatch to capacity credit levels
July 15 effective date for the near-term model
Administration of all changes to models through Model On-Demand (MOD)
Adding Interregional coordination requirements at the start of the study
5
https://www.misoenergy.org/Library/Tariff/Pages/Tariff.aspx#
8
MISO 2014 LOLE Study Report November 1, 2013
3 Transfer Analysis
3.1 Calculation Methodology and Process Description
Transfer analysis is used to establish Capacity Import Limits (CILs) and Capacity Export Limits (CELs) for
Local Resource Zones (LRZs) in the Planning Reserve Margin (PRM) study for the 2014-2015 planning
year. The objective of this study is to determine how import capability for each zone can potentially delay
the build of additional capacity. There were significant enhancements to this year’s analysis. This includes
consideration of all facilities under MISO functional control, regardless of the voltage level, as potentially
limiting and utilizing MISO generation local to a zone for import limit analyses. For this planning year an
effort was made to more thoroughly document study assumptions, procedures, progress and results
through Business Practice Manual (BPM) language and Loss of Load Expectation Working Group
(LOLEWG) meeting materials.
Other improvements to the transfer analysis include the following enhancements, which help more
accurately represent the capacity import and export limits of each LRZ.
Excluding additional units from transfer analysis based on machine parameters
Redispatch options considered for mitigation
Setting MISO import level to net firm level
An additional improvement was the determination of capacity import and export limits for five-year and
10-year timeframes. These results are useful for planning and indicate what changes can be expected
based on future modifications to the system.
3.1.1 Tiered generation pools
To determine an LRZ’s import or export limits, a generation-to-generation transfer is modeled from a
source subsystem to a sink subsystem. For import limits, the limit is determined for the sink subsystem.
Import limits are found by increasing MISO generation resources in close electrical proximity to the LRZ
under study while decreasing generation inside the LRZ under study (Figure 3.1-1).
Tier 1 – Generation in the MISO areas with ties to the LRZ under study
Tier 2 – Tier 1 plus generation in MISO areas with ties to Tier 1
Figure 3.1-1: Tiered import illustration
9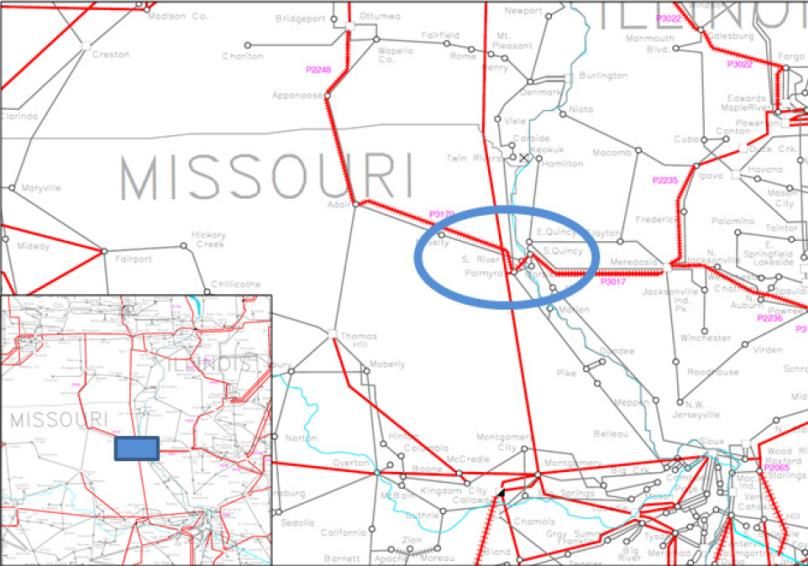
MISO 2014 LOLE Study Report November 1, 2013
Import limit studies are analyzed first using Tier 1 generation only. If a constraint is identified, redispatch
is tested. If redispatch mitigates the constraint completely and an additional constraint is not identified, the
limit is the adjusted available capacity in Tier 1 plus any base import or minus any base export. Available
capacity must be adjusted to account for changes due to redispatch. If a constraint is not identified using
Tier 1 generation only, Tier 2 generation is then considered using the same redispatch process. If
constraints are identified using Tier 1 generation, Tier 2 generation is not needed to determine the zone’s
import limit.
Stakeholders voiced concern over the tiered approach; however the following reasons support the
application of this methodology:
The tiered approach reduces the likelihood of limits due to remote constraints, which occurred in
previous studies
The prior methodology utilized all MISO and seam-area generation for each import scenario
The tiered approach pools Generation Resources for import studies providing a prudent
transmission limit using only local MISO generation
More accurate representation of the conservative transfer limits in effect during emergency
situations
The tiered approach was not applied to export studies. Generation within the zone being studied for an
export limit is being ramped up. Constraints are expected to be near the zone because the generation
being ramped up is in a more concentrated area than import studies.
3.1.2 Redispatch
Redispatch was completed similarly to redispatch for baseline reliability projects, which is referenced in
6
Section J.5.1.1 of the Transmission Planning Business Practice Manual (BPM) . The common
assumptions are as follows:
Only shift factors greater than 3 percent are considered
No more than 10 conventional fuel units or wind plants will be used
Redispatch limited to 2,000 MW total
Nuclear units are excluded
Figure 3.1-2 summarizes the redispatch assumptions for import scenarios.
6
BPM 020 – Transmission Planning: https://www.misoenergy.org/_layouts/MISO/ECM/Redirect.aspx?ID=19215
10MISO 2014 LOLE Study Report November 1, 2013
MISO
Tier 1* Redispatch for an import
LRZ Under
Study
Eligible to scenario considers all
increase for
generation in the MISO
redispatch
footprint to decrease.
*Tier 2 as applicable IMPORT Redispatch
Scenario
Figure 3.1-2: Import Redispatch Scenario
For import redispatch scenarios, all MISO generators studied outside of the zone will be considered as
ramped down. Only units in the tier used to identify the constraint are considered as ramped up. Initially,
only MISO generation in the constraint-identified tier was considered to ramp up and down but, based on
stakeholder feedback and MISO review, this assumption was too restrictive for constraints near zonal
borders. This new process ensures that resources are in the vicinity of the study area. It is unreasonable
to assume ramping down a unit with a significant impact on the constraint by 2 MW, for example, can be
offset by ramping up a far-away unit by 2 MW. Generation within the importing zone is decreased,
therefore it is not considered for redispatch.
For export redispatch scenarios, only generation within the zone being studied is considered to be
ramped up or down (Figure 3.1-3).
Figure 3.1-3: Export Redispatch Scenario
11MISO 2014 LOLE Study Report November 1, 2013
3.2 Power Flow Models and Assumptions
3.2.1 Tools used
Siemens PTI Power System Simulator for Engineering (PSS E), Version 32.2.0 and Power System
Simulator for Managing and Utilizing System Transmission (PSS MUST), Version 11.0.1 were utilized for
the transfer analysis.
3.2.2 Inputs required
The study required power flow models and PSS MUST Input files. PSS MUST contingency files from
7
Coordinated Seasonal Assessment (CSA) and MTEP reliability assessment studies were used (Table
3.2-1). Single-element contingencies in MISO and seam areas were evaluated in addition to submitted
files.
Contingency files
Model used
2014-15 Planning Year 2013 Summer CSA
5-year-out peak MTEP13 study
10-year-out peak MTEP13 study
Table 3.2-1: Contingency files per model
PSS MUST subsystem files include LRZ, Tier 1 and Tier 2 definitions. Refer to Appendix C for maps
containing Tiers used for this study. The PSS MUST monitored file includes all facilities under MISO
functional control.
Table 3.2-2 summarizes when the inputs required are available. These dates will be reasonably
consistent for future studies.
Input(s) Available for LOLE PRM Analyses Date
8
Appendix A Project Info September 15, 2012
6
MTEP 5- and 10-Year Models February 15, 2013
9
Access Planning 1-Year Model February 2013
Summer CSA Contingency files May 31, 2013
MTEP NERC TPL contingencies June 2013
Table 3.2-2: Input availability dates
3.2.3 Power Flow Modeling
Three summer peak models were required for the analysis: 2014, 2018 and 2023. All models were built
using MISO’s Model on Demand (MOD) model data repository, each with an effective date and base
assumptions (Table 3.2-3).
7
Refer to sections 4.3.4 and 4.3.6 of the Transmission Planning BPM for more information regarding MTEP PSS MUST input files.
https://www.misoenergy.org/_layouts/MISO/ECM/Redirect.aspx?ID=19215
8
Refer to MTEP Information Exchange Document: https://www.misoenergy.org/_layouts/MISO/ECM/Redirect.aspx?ID=115852
9
Information regarding model progress presented at sub-regional planning meetings
12MISO 2014 LOLE Study Report November 1, 2013
Load and
Planning Effective
Projects Applied External Modeling Generation
Year Date
Profile
2014-15 6/1/2014 Approved MTEP12 A ERAG MMWG Summer Peak
2018 7/15/2018 Approved MTEP12 A ERAG MMWG Summer Peak
2023 7/15/2023 Approved MTEP12 A ERAG MMWG Summer Peak
Table 3.2-3: Model assumptions
Several types of units had to be modified so their participation in transfers would be prudent.
Nuclear units were excluded from all transfers; therefore dispatch changes were not made to
these units
Must-run, self-scheduled, system support resources and hydro generating units identified using
the MTEP Regional Merit Dispatch file were also excluded from transfers
MISO South Voltage and Local Reliability units (historically Reliability Must Run units) had their
dispatches fixed per posted operating guides
System conditions such as load, dispatch, topology and interchange have an impact on transfer
capability. In addition to the dispatch exclusions, generators with negative Pmin values were modified so
that the Pmin was either set to zero or its MOD profile dispatch if that value was negative. This ensured
these units were not used to transfer power.
Relying on seam areas beyond firm commitments was a drawback of the prior methodology. Net firm
reservations were modeled this year and external units were not included in any transfers beyond the firm
level. Stakeholders voiced concern about not including externals beyond the firm level. MISO believes the
net firm modeling is appropriate because there is no certainty for any non-firm transactions if MISO is in a
loss-of-load event. Also, if MISO is in a loss-of-load event, it is possible adjacent regions could be as well.
MISO import levels in the base case will be set to the level of firm transactions.
Stakeholder review of models and input files was requested through LOLEWG meetings and by notices
sent to these MISO groups: Planning Advisory Committee, Planning Subcommittee and the Regional
Expansion Criteria and Benefits (RECB) Task Force. Files were made available on the MTEP ftp site.
Feedback regarding transmission facilities modeling and ratings was sought.
3.2.4 General Assumptions
PSS MUST uses the power flow model and associated input files to determine the import and export
limits of each LRZ by determining the transfer capability. Transfer capability measures the ability of
interconnected power systems to reliably transfer power from one area to another under certain system
conditions and is used as an indicator of transmission strength. The incremental amount of power that
can be transferred will be determined through First Contingency Incremental Transfer Capability (FCITC)
analysis. FCITC analysis provides information to calculate the Total Transfer Capability (TTC), which
indicates the total amount of power able to be transferred before a constraint is identified. TTC is the base
power transfer plus the incremental transfer capability (Equation 3.2-1).
( )
Equation 3.2-1: Total Transfer Capability
13MISO 2014 LOLE Study Report November 1, 2013
Facilities were flagged as potential constraints for loadings of 100 percent or more of the normal rating for
North American Electric Reliability Corporation (NERC) Category A conditions and loadings of 100
percent or more of the emergency rating for NERC Category B contingencies. Available capacity in
source subsystems was noted to ensure machine limits were respected in the analyses.
Linear FCITC analysis identifies the limiting constraints using a minimum Distribution Factor (DF) cutoff of
3 percent, meaning the transfer and contingency must increase the loading on the overloaded element by
3 percent or more.
FCITC requires a defined transfer level, which is the amount of power that will be transferred from the
source subsystem to the sink subsystem. The transfer level is determined by the available export
capability of the source subsystem. This will ensure that machine limits in the source subsystem are not
violated.
A pro-rata dispatch is used, which ensures all available generators will reach their max dispatch level at
the same time. The pro-rata dispatch is based on the MW reserve available for each unit and the
cumulative MW reserve available in the subsystem. The MW reserve is found by subtracting a unit’s base
model generation dispatch from its maximum dispatch, which reflects the available capacity of the unit.
Table 3.2-4 and Equation 3.3-2 show an example of how one unit’s dispatch is set, given all machine data
for the source subsystem. MISO wind resources are excluded from source dispatch by setting the
maximum dispatch level of each unit to its current dispatch level in the power flow model (Maximum
Dispatch = Unit Dispatch value).
Base Reserve MW
Minimum Maximum
Model (Unit
Unit Unit
Machine Unit Dispatch Max
Dispatch Dispatch
Dispatch – Unit
(MW) (MW)
(MW) Dispatch Min)
1 20 20 100 80
2 50 10 150 100
3 20 20 100 80
4 450 0 500 50
5 500 100 500 0
Total Reserve 310
Table 3.2-4: Example subsystem
( )
( )
= 25.8
Equation 3.3-2: Machine 1 dispatch calculation for 100 MW transfer
14MISO 2014 LOLE Study Report November 1, 2013
3.3 Results
The results for each LRZ consist of a list of constraints and their corresponding FCITC values up to the
requested transfer level. The constraint with the smallest FCITC was used to determine the CIL and CEL.
Invalid constraints were identified for several reasons, such as outdated ratings, invalid contingencies,
solution tolerance settings, or associated operating guides that mitigate the constraint. The CIL and CEL
are the TTC of the corresponding limiting constraint. Section 3.5 of the Resource Adequacy BPM
provides additional information regarding how the CIL impacts the Local Clearing Requirement
calculation. Constraints and associated limits for each planning year were presented and reviewed
through the LOLE Working Group. This activity occurred in the meetings that took place in July through
October 2013.
Initial results were presented at the July 17, 2013, LOLEWG meeting. It was later determined that
generation profiles were inappropriately applied to the model. The intent was to align power flow and
probabilistic load and generation profiles. The model used for the July 17 results aligned generation
profiles but did not align load profiles between what is submitted in Module E Capacity Tracking (MECT)
tool and Model on Demand. Load and generation profiles are aligned in the Simultaneous Feasibility
Study completed as part of the auction. The model was updated using consistent information from Model
on Demand as appropriate for power flow models. This model rework resulted in some time delay in
providing updated Capacity Import Limits.
Draft Capacity Import and Export Limits were presented at the September 4, 2013, LOLEWG meeting
with the updated model. The details pertaining to the results for each zone are presented in Appendix C:
Transfer Analysis. During the September 4 LOLEWG meeting much discussion ensued regarding the
tiered approach that had been presented at the June, July and August LOLEWG meetings with requests
for feedback. Feedback received in this discussion supported that generation considered for redispatch
scenarios should include all MISO generation. Previously, the generation considered for redispatch
focused on generation within the source and sink areas. MISO agreed with this feedback and applied it
uniformly for each zone. The zones that were impacted by this change are zones 2, 3 and 8.
Detailed constraint and redispatch information for all 2014 limits is found in Appendix C: Transfer Analysis
of this report. A summary of the 2014 Capacity Import Limits is in Table 3.3-1.
15MISO 2014 LOLE Study Report November 1, 2013
14-15 Figure Initial Generation
Monitored Contingent
Zone Tier Limit 3.3-1 Limit Redispatch Details
10 Element Element 11
(MW) Map ID (MW) MWs Area
9 generators in
Lime Creek – 161 Barton – Adams
1 1 4,347 kV 161 kV
1 4,292 68 ALTW, WPS,
and ALTE
10 generators
Turkey River – Genoa – Seneca
2 1 3,083 Stoneman 161kV 161 kV
2 2,859 162 in ALTW, XEL
and DPC
10 generators
Palmyra 345/161 Hills – Sub T – in AMMO,
3 1 1,591 kV transformer Louisa 345 kV
3 0 366
GRE, and
ALTE
Tazewell 345/138 Tazewell 345/138
4 1 3,025 kV transformer 1 kV transformer 2
4 3,025 Not applicable
Hot Springs EHV
Carpenter – 9 generators in
5 1 5,273 – Arklahoma 115 5 4,712 539
Arklahoma 115 kV EAI
kV
Wheatland –
Jefferson –
6 1 4,834 Petersburg 345
Rockport 765 kV
6 4,834 Not applicable
kV
Zion Station – 10 generators
Pleasant Prairie –
7 2 3,884 Zion Energy
Zion 345 kV
7 2,587 318 in NIPS, WEC,
Center 345 kV and AMIL
10 generators
Vienna – Mt Olive Mt Olive – in CLECO,
8 1 1,602 115 kV Eldorado 500 kV
8 578 678
AMMO, and
EES
Walnut Grove – Perryville – Baxter
9 1 3,585 Swartz 115 kV Wilson 500 kV
8 3,585 Not applicable
Table 3.3-1: Planning Year 2014–2015 Capacity Import Limits
10
The 14-15 Limit represents the limit after redispatch has been considered.
11
The Initial Limit represents the limit before considering redispatch.
16MISO 2014 LOLE Study Report November 1, 2013
Figure 3.3-1: 2014 CIL map
17MISO 2014 LOLE Study Report November 1, 2013
Tiers were not applied to export scenarios; exports were evaluated from the zone under study to the
MISO footprint. Table 3.3-2 summarizes the 2014 Capacity Export Limits.
Figure Generation
14-15 Initial
Monitored Contingent 3.3-2 Redispatch Details
Zone Limit Limit
Element Element Map
(MW) (MW) MWs Area
ID
10 generators
Lakefield - Webster 345 kV
1 286 Dickinson 161 kV Station
1 48 515 in GRE, NSP,
and DPC
10 generators
Zion Station - Zion
Pleasant Prairie - in NIPS,
2 1,924 Energy Center 345
Zion 345 kV
2 1,371 318
kV WEC, and
AMIL
Oak Grove - Nelson - Electric
3 1,875 Galesburg 161 kV Junction 345 kV
3 1,875 Not Applicable
Pontiac - Loretto 12
4 1,961 345 kV
345-L8014_T_-S 4 1,961 Not Applicable
10 generators
Palmyra 345/161 kV Hills - Sub T - Louisa
5 1,350 Transformer 345 kV
5 793 238 in AMMO and
CWLD
Amo - Edwardsport Gibson - Wheatland
6 2,246 345 kV 345 kV
6 2,246 Not Applicable
Benton Harbor
Benton Harbor - Cook
7 4,517 345/138 kV
345 kV
7 4,517 Not Applicable
Transformer
Russellville East - Arkansas Nuclear
8 generators
8 3,080 Russellville North one - Ft. Smith 500 8 3018 674
161 kV kV in EAI
10 generators
Winnfield 230/115 Montgomery -
9 3,616 kV Transformer Clarence 230 kV
9 2,051 832 in EES, SME,
CLECO
Table 3.3-2: Planning Year 2014–2015 Capacity Export Limits
12
345-L8014_T_-S
Close 272260 PONTIAC; B 138 272261 PONTIAC; R 138Z1
Open 270717 DRESDEN; R 345 270853 PONTIAC; R 345 1
Open 270853 PONTIAC; R 345 275210 PONTIAC;2M 138 1
Open 272261 PONTIAC; R 138 275210 PONTIAC;2M 138 1
Open 275210 PONTIAC; 2M 138 275310 PONTIAC; 2C34.5 1
18MISO 2014 LOLE Study Report November 1, 2013
Figure 3.3-2: 2014 CEL map
3.3.1 Out-Year (2018 and 2023)
This is the first LOLE PRM study that contains out-year transfer analyses, and targets the years 2018 and
2023. The goal of providing this information is for long-term planning purposes. Out-year constraints will
be considered in the development of the MISO Transmission Expansion Plan and presented at Sub-
Regional Planning Meetings. These results may indicate how changes in available capacity and the
transmission system impact CELs, CILs and Local Clearing Requirements (LCR).
The transfer study methodology for the near-term and out-year studies are the same, except redispatch is
not applied in the out-year studies since they are indicative of limits the LOLEWG may see in the future.
19MISO 2014 LOLE Study Report November 1, 2013
The 2018 out-year scenario included MTEP Appendix A projects through MTEP12 with in-service dates
by July 15, 2018. Impactful projects include Multi-Value Projects that are estimated to be in service within
this time frame. The projects highlighted in yellow in Figure 3.3-3 are in service in 2018.
Figure 3.3-3: MVPs in service in the 2018 out-year scenario
20MISO 2014 LOLE Study Report November 1, 2013
Out-year 2018 CIL were originally presented at the September 16, 2013, LOLEWG meeting. Import Limits
for zones 2, 3 and 6 were updated in the October 2, 2013, LOLEWG meeting. On October 4, the
LOLEWG was informed of updated limit calculations, which were made due to the inadvertent exclusion
of certain data. The details are also posted with the October 2, 2013, LOLEWG meeting materials. Table
3.3-3 summarizes the 2018 CIL and the detailed results are in the Appendix.
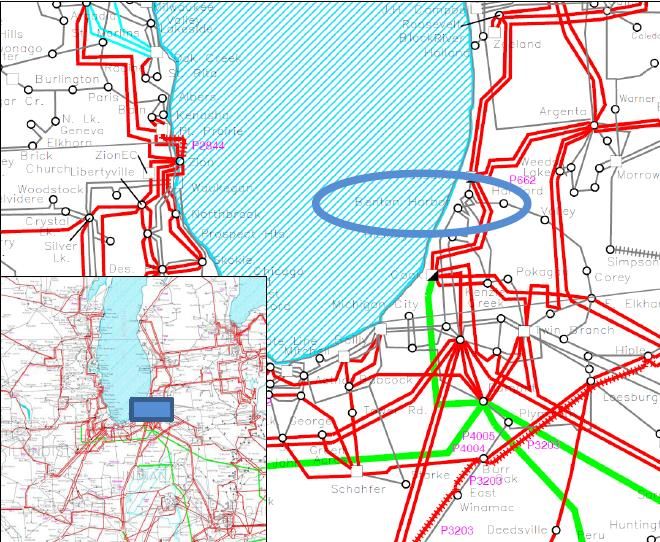
2018 Figure
Zones Tier Limit Monitored Element Contingent Element 3.3-4 Map
(MW) ID
Adams – Mitchell County 345
1 2 3,551 Lime Creek – Worth County 161 kV 1
kV
2 1 2,437 Turkey River – Stoneman 161 kV Seneca – Genoa 161 kV 2
3 2 5,985 Sub 3456 – Nebraska City 345 Sub 3455 – Sub 3740 345 kV 3
No transmission limit - value reflects generation in Tiers 1 & 2 plus
4 2 11,662 N/A
base import
5 2 3,465 White Bluff – Keo 500 kV Sheridan – Mabelvale 500 kV 4
6 1 4,874 Wheatland – Petersburg 345 kV Jefferson – Rockport 765 kV 5
Zion Station – Zion Energy Center
7 2 2,922 Pleasant Prairie – Zion 345 kV 6
345 kV
8 1 1,110 Winnfield – Jeld Wen 115 Hartburg – Mt Olive 500 kV 7
9 1 3,972 Dodson – Jeld Wen 115 kV Hartburg – Mt Olive 500 kV 7
Table 3.3-3: 2018 Capacity Import Limits
21MISO 2014 LOLE Study Report November 1, 2013
Figure 3.3-4: 2018 CIL map
22MISO 2014 LOLE Study Report November 1, 2013
Out-year 2018 CEL were originally presented in the October 2, 2013, LOLEWG meeting. Updated results
were provided on October 4, 2013, and remaining updates were presented at the October 21, 2013,
LOLEWG meeting. Similar to the 2014 results, tiers were not considered for 2018 export scenarios. Table
3.3-4 summarizes the 2018 CEL.
2018 Figure
Zones Limit Monitored Element Contingent Element 3.3-5
(MW) Map ID
1 2,499 Briggs Rd – Mayfair 161 kV Briggs Rd – LaCrosse – Genoa 161 kV 1
2 1,582 Zion Station – Zion Energy Center 345 kV Pleasant Prairie – Zion 345 kV 2
3 2,983 Cordova – Nelson 345 kV Quad Cities – H471 345 kV 3
4 3,010 No transmission limit – value reflects available generation in zone plus base export N/A
5 2,181 No transmission limit - value reflects available generation in zone plus base export N/A
Cayuga – Frankfort 230 kV and
6 1,639 Lafayette – Tricounty 230 kV 4
Frankfort 230/69 kV transformer
7 4,813 Benton Harbor 345/138 kV transformer Benton Harbor – Cook 345 kV 5
8 2,180 Butterfield (Woodlawn Rd) – Haskell 115 kV Sheridan - Mabelvale 500 kV 6
9 2,295 Winnfield 230/115 kV Montgomery - Clarence 230 kV 7
Table 3.3-4: 2018 Capacity Export Limits
23MISO 2014 LOLE Study Report November 1, 2013
Figure 3.3-5: 2018 CEL map
The 2023 out-year scenario included MTEP Appendix A projects with in-service dates by July 15, 2023. A
more detailed review of the 2023 model was required due to generation assumptions in 10-year-out
planning models for external areas. Through the review, additional generation without associated
transmission facilities was found in the ComEd Co., Louisville Gas and Electric Co. and Tennessee Valley
Authority systems. MISO believes that through increased interregional coordination through the FERC
1000 effort it will be able to expedite the out-year model review in the future. Also, as documented as a
future improvement, MISO intends to start more in-depth coordination with external areas at the onset of
the study.
Out-year 2023 CIL was originally presented in the October 2, 2013, LOLEWG meeting for a subset of
zones. Remaining limits and updates were presented at the October 21, 2013, LOLEWG meeting. Table
3.3-5 summarizes the 2023 CIL and the detailed results are in Appendix C: Transfer Analysis.
24MISO 2014 LOLE Study Report November 1, 2013
2023 Figure
Zones Tier Limit Monitored Element Contingent Element 3.3-6
(MW) Map ID
1 1 2,805 Lime Creek – Worth County 161 kV Adams – Mitchell County 345 kV 1
Lockport – Kendall 345 kV red
2 1 1,257 Lockport – Kendall 345 kV blue circuit 2
circuit
3 1 1,017 Maywood – Spencer 345 kV Meredosia – Pawnee 345 kV 3
No transmission limit ‐ value reflects generation in Tiers 1 & 2 plus base
4 2 11,339 N/A
import
Grand Tower – Campbell Hill Jct
5 1 4,278 Perryville – Grand Tower 138 kV 4
– Steeleville 138 kV
Benton Harbor 345/138 kV
6 1 4,514 Benton Harbor – Cook 345 kV 5
transformer
Dequine – Meadow Lake 345 kV Dequine – Meadow Lake 345 kV
7 2 253 6
circuit 2 circuit 1
8 1 1,094 Winnfield – Jeld Wen 115 Hartburg – Mt Olive 500 kV 7
Fancy Point 230/500 kV
9 1 4,050 Coly 500/230 kV transformer 8
transformer
Table 3.3-5: 2023 Capacity Import Limits
25MISO 2014 LOLE Study Report November 1, 2013
Figure 3.3-6: 2023 CIL map
The out-year limit tables will be presented at the appropriate sub-regional planning meetings. It will then
be determined if further analysis is required.
The 2023 constraint for Zone 3’s CIL was not identified as limiting for any other transfer and is
significantly more limiting than 2018’s constraint. The main difference between the 2018 and 2023
scenario causing this difference is generation dispatch specific to that area. Several hundred megawatts
of generation dispatched in the 2023 model that interconnected in the area of the constraint were offline
in the 2018 model.
Zone 7’s 2023 CIL is significantly more limiting than 2018. The constraint is in PJM’s system and has
been identified in prior MISO studies including MTEP13 NERC Transmission Planning (TPL) analyses.
The monitored element is approaching its limit in 2018 and 2023 without the transfer. It was not identified
as the limiting constraint in 2018 because the base flow is less than 2023; however in 2018 the post-
contingent flow is still approaching the limit. One major difference between the 2018 and 2023 power flow
26MISO 2014 LOLE Study Report November 1, 2013
models that could be causing the base flow differences is generation dispatch level in Zone 7, which is
much higher in 2023. This causes Zone 7 to be an exporter, while it is an importer in 2018. Only one
additional generator was found in the 2023 model, so the additional dispatch was primarily due to
increases in dispatch of units offline in 2018 and online in 2023.
A potential improvement for subsequent studies is for MISO to provide model summaries by zone or area.
The intent of the summary is to aid in the identification of modeling concerns by the reviewing
transmission owner. This improvement will identify modeling concerns early in the study so they can be
resolved before final posting of the report, which will ensure the appropriate constraints are reviewed in
the Sub-Regional Planning Meetings.
Out-year 2023 CEL was originally presented in the October 2, 2013, LOLEWG meeting for a subset of
zones. Remaining limits and updates were presented at the October 21, 2013, LOLEWG meeting. Table
3.3-6 summarizes the 2023 CEL and the detailed results are in the Appendix C: Transfer Analysis.
2023 Figure
Zones Limit Monitored Element Contingent Element 3.3-7
(MW) Map ID
1 1,203 No transmission limit - value reflects available generation in zone plus base export N/A
2 1,199 No transmission limit - value reflects available generation in zone plus base export N/A
3 3,462 No transmission limit - value reflects available generation in zone plus base export N/A
4 1,808 Loretto – Wilton 345 kV Pontiac – Dresden 345 kV 1
5 1,771 No transmission limit - value reflects available generation in zone plus base export N/A
6 1,020 No transmission limit - value reflects available generation in zone minus base import N/A
7 3,695 Plano - Electric Jct. 345 kV blue circuit Plano - Electric Jct. 345 kV red circuit 2
Arkansas Nuclear One - Ft. Smith
8 284 Russelville North - Russleville East 161 kV 3
500 kV
Arkansas Nuclear One - Ft. Smith
9 321 Russelville East - Russleville South 161 kV 3
500 kV
Table 3.3-6: 2023 Capacity Export Limits
27MISO 2014 LOLE Study Report November 1, 2013
Figure 3.3-7: 2023 CEL map
28MISO 2014 LOLE Study Report November 1, 2013
4 Loss of Load Expectation (LOLE) Analysis
4.1 LOLE Modeling Input Data and Assumptions
MISO utilizes a program developed by General Electric called Multi-Area Reliability Simulation (MARS) to
calculate the LOLE for the applicable planning year. GE MARS uses a sequential Monte Carlo simulation
to model a generation system and assess the system’s reliability based on any number of interconnected
areas. GE MARS calculates the annual LOLE for the MISO system and each Local Resource Zone (LRZ)
by stepping through the year chronologically and taking into account generation, load, load modifying and
energy efficiency resources, equipment forced outages, planned and maintenance outages, load forecast
uncertainty and external support.
The GE MARS model builds are the most time-consuming tasks of the Planning Reserve Margin (PRM)
study. Many cases are built to model different scenarios and to determine how certain variables impact
the results. The base case models determine the MISO PRMICAP, PRMUCAP and the Local Reliability
Requirements (LRR) for each LRZ for years one, five and 10.
4.2 MISO Generation
4.2.1 MISO Midwest
Thermal Units
MISO’s PowerGADS is the source for much of the data used in the PRM study. PowerGADS provides
unit specific information such as:
Generator Verification Test Capacities (GVTC)
Monthly Net Dependable Capacities (NDC)
Unit Forced Outage Rates (EFORd and XEFORd as defined by IEEE 762)
Planned Maintenance Factor (average number of events and duration)
Thermal units are only included in the study if they have a Commercial Pricing Node (CPNode) (March
2013 Commercial Model) and are not on a long-term outage. The GVTC values, along with the monthly
NDC values, are used to determine the capacity profile for each unit except in cases where a unit is new
to the commercial model. New units used the commercial model Pmax value for each month’s capacity.
The utility submitting the data into MISO’s PowerGADS along with the CPNode associated with each unit
help determine which LRZ the unit should be included.
Forced outage rates and planned maintenance factors were calculated over a five-year period (January
2008 to December 2012) and modeled as one value. Some units did not have five years of historical data
in PowerGADS, but if they had at least 12 months of data then unit-specific information was used. If a unit
had less than 12 months of unit-specific data in PowerGADS, then that unit was assigned the
corresponding MISO class average forced outage rate and planned maintenance factor. If a particular
MISO class had less than 30 units, then a North American Electric Reliability Corp. (NERC) class average
forced outage rate was used.
29MISO 2014 LOLE Study Report November 1, 2013
Nuclear units have a fixed maintenance schedule, which was pulled from Ventyx PowerBase and was
modeled for each of the study years.
Sales
This year’s LOLE analysis incorporated firm sales to PJM. For units with capacity being sold to PJM, the
monthly capacities were reduced by the megawatt amount being sold. This totaled 2,721 MW for
Planning Year 2014-2015 and 2,877 MW for Planning Years 2018-2019 and 2023-2024.
Attachment Y
Generating units that have filed suspensions or retirements (as of June 5, 2013) through MISO’s
Attachment Y process and have been approved are accounted for in the LOLE analysis. Future
retirement and suspension dates are added to the model and the unit was retired or suspended as of the
Attachment Y date. Suspensions coming back online during the study period were also accounted for with
an installed date set at the suspension end date.
Future Generation
Future thermal generation and upgrades were added based on unit information in the MISO Generator
Interconnection Queue. Only units with a signed interconnection agreement (as of July 1, 2013) were
included in the LOLE model. These new units were assigned class average forced outage rates and
planned maintenance factors based on their particular unit class. Units that were upgraded during the
study period reflected the MW increase for each month beginning the month the upgrade was finished.
Future wind generation was not included in the LOLE analysis.
Intermittent Resources
Intermittent resources such as run-of-river hydro, biomass and wind were explicitly modeled as demand-
side resources. Non-wind intermittent resources such as run-of-river hydro and biomass provide MISO
with up to 15 years of historical summer output data during hours ending 15:00 EST through 17:00 EST.
This data is averaged and modeled in the LOLE analysis as unforced capacity for all months. Each
individual unit is modeled and put in the corresponding LRZ.
Each wind-generating CPNode received a capacity credit based on its historical output from MISO’s top
eight peak days in past years. The megawatt value correlating to each CPNode’s wind capacity credit
was used for each month of the year. If a unit was new to the commercial model and did not receive a
wind capacity credit as part of the 2013 Wind Capacity Credit analysis, then that unit was given the
MISO-wide wind capacity credit of 13.3 percent as established by the 2013 Wind Capacity Credit
Effective Load Carrying Capability (ELCC) analysis. The capacity credit established by the ELCC analysis
determines the maximum percent of the wind unit that can receive credit in the PRA while the actual
amount could be less. This value was applied to the maximum capacity value in the commercial model
and used for all months in the year. Aggregate megawatt values for wind generating units are then
determined for MISO and each LRZ. The detailed methodology for establishing the MISO-wide and
individual CPNode Wind Capacity Credits can be found in the 2013 Wind Capacity Credit Report.
30MISO 2014 LOLE Study Report November 1, 2013
Load Modifying Resources
Behind-the-meter generation and demand response data came from the Module E Capacity Tracking
(MECT) tool. These resources were explicitly modeled as energy-limited resources. Behind-the-meter
generation is modeled as monthly unforced capacity with a monthly energy and aggregated by LRZ.
Each demand response program was modeled individually with a monthly capacity and energy, which is
limited to the number of times each program can be called upon as well as limited by duration.
4.2.2 MISO South
The 2014-2015 planning year LOLE analysis incorporated MISO South for the first time, as that region
will fully integrate into MISO in December 2013. MISO South companies were asked to submit up to five
years (January 2008 to December 2012) of data into MISO’s PowerGADS. For the companies that
submitted at least 12 consecutive months of data ending with December 2012, unit-specific information
was used in the LOLE model. Approximately 80 percent of the MISO South units used unit-specific
information and the other 20 percent received class average forced outage rate and planned
maintenance factors.
Summer installed capacity values that were submitted into PowerGADS along with NDC values were
used to determine the monthly profiles for each unit. If a unit did not submit any information into
PowerGADS, then the summer installed capacity value was assumed for all months.
In future years, MISO expects to more accurately model MISO South units with actual unit-specific GVTC
and forced outage rate information for nearly all of MISO South. Also, behind-the-meter generation and
demand response will be modeled in future years because that information will be submitted in the MECT
tool. This information was not available at the time of the 2014-2015 LOLE analysis.
4.3 MISO Load Data
For the 2014-2015 LOLE analysis, the hourly LRZ load shape was a product of the historical load shape
used as well as the 50/50 demand forecasts submitted by Load Serving Entities (LSE) through the MECT
tool. Demand forecasts for MISO South were pulled from Ventyx PowerBase since the data was not
available to MISO at the time of the analysis. In future years, the LOLE analysis will utilize demand
forecasts submitted through the MECT tool for all of MISO.
The non-coincident peak demand forecasts (with transmission losses) by LSEs were aggregated by their
respective Local Balancing Authorities (LBA) and applied to the LBA’s historical load shape in GE MARS.
LRZs 1 through 7 used the 2005 historical load shape while zones 8 and 9 used the 2006 historical load
shape. For MISO Midwest, the 2005 load shape provides a typical load shape for the Midwest region as
well as inherent conservative external support due to external load shapes. With the integration of MISO
South, MISO chose to use the 2006 historical shape as the 2005 shape represented an extreme weather
year for the South region due to Hurricane Katrina. In GE MARS, MISO utilized the ability to input monthly
peaks, which MARS used to modify the historical load shape accordingly in order to adhere to the
monthly peak forecasts that LSE’s submitted. These are shown as the MISO System Peak Demand in
Table 5.1-1 and LRZ Peak Demand in Table 6.1-1.
31MISO 2014 LOLE Study Report November 1, 2013
Direct Control Load Management and Interruptible Demand types of demand response were explicitly
included in the LOLE model as resources. These demand resources are implemented in the LOLE
simulation before accumulating LOLE or shedding of firm load.
4.3.1 Load Forecast Uncertainty
Load Forecast Uncertainty (LFU), a standard deviation statistical coefficient, is applied to base 50/50 load
forecast to represent the various probabilistic load levels. With transition into Module E1 in 2012, MISO
determines two separate requirements: Local Reliability Requirement (LRR) for each zone as well as an
overall MISO-wide Planning Reserve Margin (PRM).
In 2012, MISO began calculating LFU for each Local Resource Zone (LRZ) to derive the LRR by
applying the NERC Bandwidth Method to associated zonal historic demand.
In addition to that, a MISO-wide LFU was calculated and applied to an aggregate MISO load
shape to determine a MISO-wide PRM. In the current LOLE study, enhancements were made to
this LFU determination.
Through this year’s analysis results, it was determined that aggregating the MISO-wide footprint
(including MISO South) into one load shape was no longer prudent in derivation of the MISO-wide PRM
given the large geographic footprint. This is because a MISO-wide LFU applied to every load in MISO,
regardless of its unique LFU and geographic location, misrepresents the local uncertainty in demand. The
misrepresentation of local uncertainty in demand is amplified when applying the old method to such a
large geographic area.
Historically, LFU for the MISO Midwest region had been around 4 percent; this year an LFU of 3.8
percent was calculated for this region. However, with the addition of MISO South companies, the LFU
calculated using the old approach of aggregation into one load shape resulted in about a 3 percent MISO-
wide LFU. Due to cancelation effects, the overall uncertainty is inherently dampened with the older
approach as two large geographic areas with seemingly different weather patterns combine. Lower
procured capacity results from statistically derived lower aggregation, which misrepresents reliability need
in different parts of the system unique to those geographic regions.
MISO identified a new modeling technique, which connected each Local Resource Zone to a central hub
with infinite ties. This enabled MISO to model each LRZs demand and generation uniquely. Use of this
method to derive the MISO-wide PRM better aligns with the zonal construct. The resulting LFU through
modeling in a probabilistic model was determined to be 3.9 percent for the aggregate MISO footprint,
which is in line with previously derived LFU. Further details of this determination are discussed later in this
section. The 3.9 percent compares closely with previously established LFUs by NERC for its Regional
Entity’s respective footprints. The LFU for ReliabilityFirst Corp. (RFC) was 5.0 percent; SERC Reliability
Corp. (SERC) was 3.3 percent, and Midwest Reliability Organization (MRO) was 4.6 percent.
The new method ensures that Local Resource Zone Local Reliability Requirement is established in sync
with MISO-wide PRM using the same model and applying the same zonal LFUs. Modeling the more
granular zonal LFU values appropriately applies each LRZ’s LFU to that LRZ’s load, which was not
previously captured by applying one MISO LFU value for each LRZ. This application of LFU more
accurately reflects the uncertainty impacts of each LRZ’s geographic area.
32You can also read