Appendix - Deep Dive Capital Markets 26 April 2016 - Uniper IR
←
→
Page content transcription
If your browser does not render page correctly, please read the page content below
Appendix – Deep Dive        26 April 2016

Capital Markets S t o r y

Appendix

1. Group
2. European Generation
3. Global Commodities
4. International Power
5. Financial

                         2
Legal structure
Transferal of stake from E.ON SE to Uniper SE Capital raise and allocation to E.ON shareholders
Issuance of
E.ON shareholders 53.35% new E.ON shareholders
shares
100%
E.ON SE E.ON SE
100%
100% 100%
E.ON Beteiligungen Spin-off E.ON Beteiligungen
GmbH GmbH
100% 46.65%
Uniper Beteiligungs Uniper Beteiligungs
Uniper SE Uniper SE
100% GmbH 100% GmbH
46.65% 46.65%
53.35% 53.35%
Uniper Holding Uniper Holding
GmbH GmbH
100% 100%
Uniper SE business units Uniper SE business units
E.ON SE holds 100% in Uniper Holding GmbH through its fully- In return E.ON SE’s shareholders receive one newly issued
owned subsidiaries Uniper SE (46.65%) and Uniper share in Uniper SE for 10 shares held in E.ON SE
Beteiligungs GmbH (53.35%) prior to the spin-off
After the spin-off E.ON SE indirectly holds 46.65% in Uniper SE
E.ON SE then transfers its participation in Uniper Beteiligungs with the remainder of 53.35% being held by E.ON SE’s
GmbH by means of spin-off to Uniper SE shareholders
3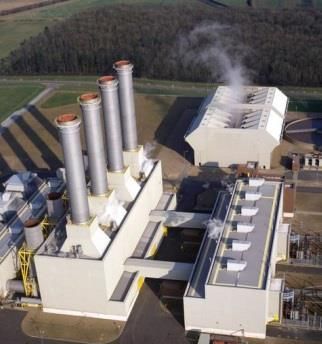
Segment structure

Structural overview

Level           European Generation                 Global Commodities              International Power            Admin / Consolidation
  1

                                                              Coal, Oil,
Level           Swedish
        Hydro               Fossil    Other   Gas     YR      Freight &    Power   Russia                 Brazil
  2             Nuclear
                                                                LNG

                                                                                                                                           4
Organisational structure

Conceptual overview
                              Board setup with distinct functional profiles

  CEO                                                                                                             Avoidance of holding
  Chief Executive Officer                                                                                         structures reduces
                                                                                                                  hierarchies and shortens
                            COO                             CCO                        CFO                        decision processes
                            Chief Operating Officer         Chief Commercial Officer   Chief Financial Officer    (no Group Management)

                                                                                                                  Operational and
   Russia                                                                                                         commercial business
   Integrated                 Asset development,             Customer and market                     Integrated
                                                                                                                  activities grouped.
   governance and              management, and                 facing activities               governance and
                                                                                                                  Governance and
   enabling functions         operational activities                                         enabling functions
                                                                                                                  enabling functions
                                                                                                                  cover all businesses
                                                       Strategy

                                                       Planning                                                   Key processes strongly
                                                                                                                  require cross-functional
                                                      Investment                                                  collaboration
                                           Performance Management

         Integration of all businesses in a single organizational structure avoids duplications
                                         (no Management Units)

                                                                                                                                             5
Appendix

1. Group
2. European Generation
 2.1 Business overview
 2.2 Market deep-dive
3. Global Commodities
4. International Power
5. Financial

                         6
The portfolio is diversified across countries and
technologies

Overview by fuel type
                                        Capacity development (MW)                                                                      Capacity by country2 (%)

                                 4.348                      4.171                     4.179
   Hydro1                                                                                                                              56                                   44

                                 2013                       2014                       2015                                            GER                                  SE

                                 2.511                      2.511                     2.511                                                           100
   Nuclear
                                 2013                       2014                       2015                                                            SE

                                13.490                     12.649                      9.905
                                                                                                                                  41                    20          12              22           5
  Hard coal /
    lignite                                                                                                                     GER                    UK           FR              NL           BE
                                 2013                       2014                       2015
                                                                                                                                                                                         BE 1
                                11.826                     11.706                     11.708
                                                                                                                             32                          40                 8       7        9   4
     Gas
                                                                                                                            GER                          UK                 SE FR NL HU
                                 2013                       2014                       2015

                                 3.957                      3.957                      3.263
    Other
                                                                                                                                            65                         12               20       3

                                 2013                       2014                       2015                                             GER                            UK           SE           FR

                1. Capacity development includes net generation capacities from Hydro LTCs in Austria and Switzerland of 820 MW in 2013, 629 MW in 2014 and 629 MW in 2015;
                capacity by country does not include Hydro LTCs; net generation capacity is reported for a power plant if it has been in operation within a year 2. Based on 2015
                (accounting view)                                                                                                                                                                     7
Integrated energy hubs represent a key driver of
Uniper’s non-wholesale earnings
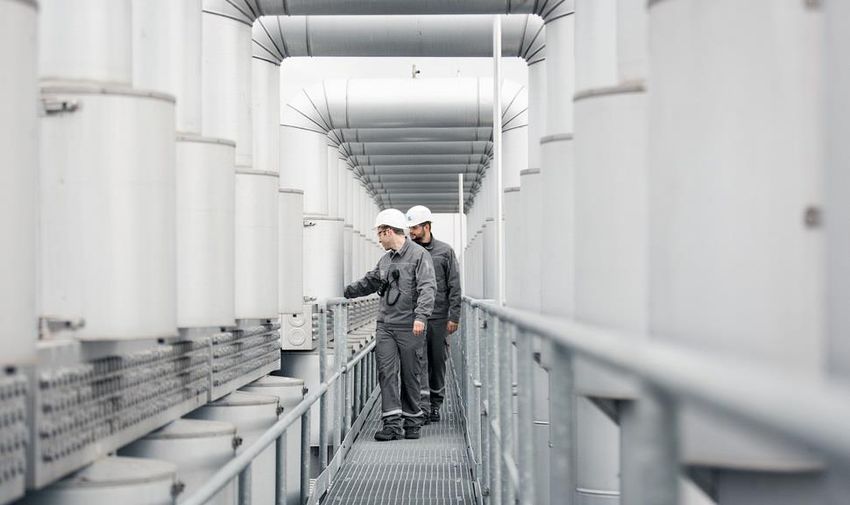
How do energy hubs work Uniper’s energy hubs
• Providing local industries and larger industrial customers
with power, steam, heat and compressed air
• Access to local district heating networks
• Sale of remaining capacity on the wholesale market
• Ability to sell by-products to local customers
(e.g. ash, gypsum)
Example: Maasvlakte Power plant Products delivered
Power, Heat, Third party services,
Maasvlakte
• Power and heat Fuel procurement, Boil-off gas supply
generation Heat, Power, Steam,
Scholven
Pressurized air, District heating
Power, Rail power,
• Provision of third party Schkopau
Energy, Steam
services
Grain Power, Heat
Malmö Power, District heating
• Procurement of fuels
Heat, Power, Steam, Rail Power
Datteln
Pressurized air, District heating
Biowaste
• Supply of boil-off gas Staudinger Power, District Heating, Grid services
Kirchmöser Rail power
8Renewables build-out resulting in increased need for
flexible capacities
Renewables build-out and gas flexibility1 Key considerations
Low feed-in from
1 2 renewables
Significant solar
feed-in 1 Significant renewables feed-
Necessity for gas-
fired production in in with direct impact on
peak hours given electricity production from
low solar feed-in
conventional power plants
Very limited production by
gas-fired power plants in
times of high renewables
feed-in
No response from
other conventional
Decrease of conventional sources
energy production driven by
solar feed-in 1.
2 Gas-fired power plants
required to address hours of
limited renewables
production
0 6 12 18 0 6 12 18 0 6 12 18
Other Gas Wind Solar
Source: EEX Transparency
1. Hourly feed-in split of Solar, Wind and all other fuels from Monday 12/10/2015 0:00h until Wednesday 14/10/2015 23:59 (EEX data) 9Europe’s power markets increasingly introduce
capacity markets
Geographic overview
1 UK: Centralized Capacity Auctions Capacity market introduced / introduction soon
Capacity market currently not expected but
2 Nordics: Strategic reserves with adjustments to energy-only market discussed
phase-out provisions
3 Germany: Grid reserve installed, introduction of a strategic reserve 2
planned
4 Poland: No mechanism, but strategic
reserve discussed
5 Belgium: Strategic reserve / discussion over possible market-wide
mechanism
1
3 4
6 France: Decentralized forward capacity obligation 5
7 Spain & Portugal: Separate capacity payments for availability and
6
investment (phased out in Portugal)
8 Italy: Temporary capacity payments; considering centralized 8
auctions for reliability options 7
10Overview of power price and generation spread
environment in Uniper's key markets
Overview of power prices and generation spreads by market (in €/MWh)1
Germany Sweden UK France Netherlands
59 52 56 52
50 49 45
43 41 40
38 33
32 27 28 28 38 35 38 31 31 32 31 29
30 29
Baseload 21 21 22 21
price2
13 14 15 16E17E18E 13 14 15 16E17E18E 13 14 15 16E17E18E 13 14 15 16E17E18E 13 14 15 16E17E18E
26 23
15 14 13 14
8 9 10 11
4 4 6 4 3 6 5
2 2 1 0 2
Clean
dark
(0) (0) (0) (2)
spread3 (5) (4) (5) (6)
13 14 15 16E17E18E 13 14 15 16E17E18E 13 14 15 16E17E18E 13 14 15 16E17E18E 13 14 15 16E17E18E
15 14 12
8 10 11 6 6 5 5 5 6 5
0 1 3 4 4 4
Clean
spark (3) (2)
(9) (5) (7) (9) (9) (7)
spread4 (16) (13)(19)
13 14 15 16E17E18E 13 14 15 16E17E18E 13 14 15 16E17E18E 13 14 15 16E17E18E 13 14 15 16E17E18E
Source: IHS
1. Average prices for 2013-2015 and projections for 2016-2018E, based on IHS figures from January 2016 2. Nominal prices 3. Based on nominal baseload power
prices, assumed efficiency rate of 37.80% and LHV/heat rate of 8,749 MMBtu per kWh 4. Based on nominal peakload power prices, assumed efficiency rate of
54.53% and LHV/heat rate of 6,204 MMBtu per kWh 11Appendix
1. Group
2. European Generation
2.1 Business overview
2.2 Market deep-dive
3. Global Commodities
4. International Power
5. Financial
12Germany Sweden United Kingdom France Netherlands
German generation portfolio at a glance
Uniper’s electricity production and net capacity
Country generation mix2
in Germany1
2% Other 4% Hydro
2.0 GW 17% 14% Nuclear
25%
Hydro 5.8 TWh 23% Renewables
600
3.2 GW 27%
TWh
Hard Coal 13.0 TWh 51%
10% Gas
0.9 GW 8% 44% Coal
Lignite 4.8 TWh 19%
Source: IHS
Competitive environment3
Nuclear Total capacity 2014 (GW)
3.8 GW 32% 23.9
Gas 1.7 TWh 6%
14.7
14.0
10.1
2.1 GW 18%
Other 0.5 TWh 2%
Percentage of total capacity % RWE Vattenfall Uniper EnBW
Percentage of total volume % Source: IHS
1. Net generation capacity for 2015 (accounting view); net generation capacity is reported for a power plant if it has been in operation within a year; Percentages not
adding to 100% due to rounding 2. 2015 production volume based on IHS; Percentages not adding to 100% due to rounding 3. Actual Uniper capacity compared to
peers’ capacities based on IHS 13Germany Sweden United Kingdom France Netherlands
German hydro fleet
Location1 Key earnings drivers
Capacity 2015 (MW) • Regulated feed-in tariffs for small hydro plants
838 956 • Long-term contracts with industrial customers
RoR
• Hydro factor driving production volume and
wholesale earnings
191
• Development of baseload power price
RoR Storage PSP
• Hydro factor driving production volume and
wholesale earnings
Storage
• Development of baseload power price
• Seasonal price differences
• Price volatility; value of flexibility
• Short-term power price volatility and optionality to
buy at low/negative prices
Run-of-river (RoR) • Network charges with impact on cost of storage
PSP
Storage • Price volatility; value of flexibility
Pumped storage (PSP)
1. Net generation capacity is reported for a power plant if it has been in operation within a year / a power plant is shown on the map if it has been in operation in
2015, excl. smaller hydro plants with less than 5 MW of technical generation capacity 14Germany Sweden United Kingdom France Netherlands
German fossil fleet
Location1 Key earnings drivers
District heating • Non-wholesale contracts with industrial customers
Direct supply and TSO with elements of fixed cost coverage and
capital remuneration
Coal
Partner supply
• District Heating supply to local municipalities
• Development of loan-adjusted Clean Dark Spread
Datteln 4
Scholven
• Non-wholesale contracts with TSO with elements
Dortmund
of fixed cost coverage and capital remuneration
• Development of Clean Spark Spread
Gas
Bochum
Essen • Power price volatility
• Load factor driven by renewables feed-in
• Contracts with TSO with elements of fixed cost
coverage and capital remuneration
Coal-fired plant
Oil
Gas-fired plant
Oil-fired plant
1. A power plant is shown on the map if it has been in operation in 2015 15Germany Sweden United Kingdom France Netherlands
Market environment in Germany
Conventional capacity retirements (GW) Illustrative merit order
4,9 Low RES feed-in
3,7
(10% of installed capacity)
3,2 3,4 3,4 Maximum
2,8 3,1 3,0 Minimum demand
demand
1,5
0,3
2012 2013 2014 2015 2016 2017 2018 2019 2020 2021
hydro lignite nuclear hard coal natural gas oil
Source: IHS Nuclear Coal Gas Other 1 renewables
Renewables build-up (GW)2 High RES feed-in
115 119 125 (60% of installed capacity)
104 110
91 98 Maximum
76 83 Minimum
69 demand
demand
9,8 8,2
6,9 7,1 6,8 5,9 5,6 4,8 5,0 5,1
renewables hydro lignite nuclear hard coal natural gas oil
2012 2013 2014 2015 2016 2017 2018 2019 2020 2021
Source: IHS Capacity additions Total
Hard coal-fired power plants typically acting as price setter in current market environment
Merit order transformation to be driven by a continuously high renewables new-build and the retirement of old hard coal, non-profitable gas-
fired and nuclear power plants
1. Other including Oil, Hydro and other non-renewables 2. Renewables as defined here including Wind on- and offshore, solar PV, solar CSP, combustible
renewables and other renewables (i.e. no hydro included) 16Germany Sweden United Kingdom France Netherlands
Swedish generation portfolio at a glance
Uniper’s electricity production and net capacity
Country generation mix2
in Sweden1
1% Other
17% Renewables
1.6 GW 28%
Hydro 8.7 TWh 40% 1% Gas
42% Hydro
1% Coal
165
TWh
Hard Coal
39% Nuclear
Lignite
Source: IHS
2.5 GW 44% Competitive environment3
Nuclear 12.2 TWh 56% Total capacity 2014 (GW)
0.9 GW 17% 14.4
Gas 0.7 TWh 3%
6.0
5.4
0.7 GW 12% 1.4
Other 0.002 TWh 0.01%
Percentage of total capacity % Vattenfall Uniper Fortum Statkraft
Percentage of total volume % Source: IHS
1. Net generation capacity for 2015 (accounting view); net generation capacity is reported for a power plant if it has been in operation within a year; Percentages not
adding to 100% due to rounding 2. 2015 production volume based on IHS; Percentages adding to more than 100% due to rounding 3. Actual Uniper capacity
compared to peers’ capacities based on IHS 17Germany Sweden United Kingdom France Netherlands
Swedish hydro fleet
Location1 Key earnings drivers
Capacity 2015 (MW) • Hydro factor driving production volume
1,372 • Development of baseload power price (hydro fleet
fully exposed to merchant market)
RoR
193
0
RoR Storage PSP
• Hydro factor driving production volume
• Development of baseload power price (hydro fleet
fully exposed to merchant market)
Storage
• Seasonal price differences
Run-of-river (RoR)
Storage
1. Net generation capacity is reported for a power plant if it has been in operation within a year / a power plant is shown on the map if it has been in operation in
2015, map excl. smaller hydro plants with less than 5 MW of technical generation capacity 18Germany Sweden United Kingdom France Netherlands
Swedish nuclear fleet
Location1 Key earnings drivers
• Development of baseload power price (including
Central European prices due to market coupling)
• Hydro factor with impact on merit order and
Nuclear
resulting achieved price
• Weather conditions esp. in the winter driving
Site MW1 Stake
demand for electricity due to heat requirements
Oskarshamn 3 1,400 55%
• Safety and environmental investments required to
Oskarshamn 2 638 55%
be made from a regulatory perspective
Oskarshamn 1 473 55%
Forsmark 1 984 9%
Forsmark 2 1,120 9%
Swedish Nuclear Fund
Forsmark 3 1,167 11% Government sets fees based
on SSM’s2 recommendation,
Ringhals 1 881 30%
currently 0.04 SEK/kWh
Ringhals 2 865 30% Nuclear power Nuclear Waste
companies Fund
Ringhals 3 1,063 30% SSM approves reimbursement
from the Fund
Ringhals 4 1,115 30%
Jointly established SKB3 to manage and
dispose of all radioactive waste from NPP
Nuclear plant (Majority-owned) Final repository Agency costs
SKB Decommissioning
Nuclear plant (Minority-owned) Transportation etc.
Encapsulation plant
R&D
Central interim storage ability
for spent nuclear fuel
1. A power plant is shown on the map if it has been in operation in 2015 2. Swedish Radiation Safety Authority 3. Swedish Nuclear Fuel and Waste Management
Company 19Germany Sweden United Kingdom France Netherlands
Swedish fossil fleet
Location1 Key earnings drivers
Capacity 2015 (MW)
• Load factor driven by hydro factor and renewables
949
feed-in
662
• Development of Clean Spark Spread
• Power price volatility with benefit from price spikes
Gas
• District Heating supply to local municipalities
Gas Oil
• Participation in strategic reserve scheme
compensated by the TSO
Oil
Gas-fired plant
Oil-fired plant
1. Net generation capacity is reported for a power plant if it has been in operation within a year / a power plant is shown on the map if it has been in operation in
2015 20Germany Sweden United Kingdom France Netherlands
Market environment in Sweden
Conventional capacity development (GW) Illustrative merit order
Low RES feed-in
(10% of installed capacity) Maximum
demand
Minimum
30,6 30,8 30,9 31,0 30,2 30,5 29,9 29,1 28,2 27,8 demand
2012 2013 2014 2015 2016 2017 2018 2019 2020 2021
natural gas
renewables hydro nuclear
hard coal
oil
Source: IHS Nuclear Coal Gas Other 1
Renewables build-up (GW)2 High RES feed-in
(60% of installed capacity)
Maximum
14 14 15 Minimum
12 12 13 demand
10 11 demand
8 9
1,5 0,8 1,1 0,8 0,8 0,7 0,7 0,7 0,6 0,5
natural gas
hard coal
renewables hydro nuclear oil
2012 2013 2014 2015 2016 2017 2018 2019 2020 2021
Source: IHS Capacity additions Total
Swedish power system driven by large share of low variable cost capacities
Power prices therefore significantly impacted by renewables feed-in volume as well as production volume from hydro plants (driven by hydro
factor)
1. Other including Oil, Hydro and other non-renewables 2. Renewables as defined here including Wind on- and offshore, solar PV, solar CSP, combustible
renewables and other renewables (i.e. no hydro included) 21Germany Sweden United Kingdom France Netherlands
Market environment in Sweden: Perspective on
strategic reserve
Strategic reserve development (MW) Related costs from strategic reserve
Karlshamn 2/3 Costs for the TSO (€m)1
2.000
1.750 1.750 power plant contracted
18
1.500 1.500 16
583 362 464
531 1.000 12
874 11
750
1.364 8
1.309 1.255
958
626
10/11 11/12 12/13 13/14 14/15 15-17 17-19 2025
Procured production resources Max. TSO procurement 2010 2011 2012 2013 2014
Procured demand response
Source: Ministry of the Environment and Energy Sweden Source: Svenska Kraftnät (Swedish TSO)
Description of strategic reserve Recent developments
TSO procures strategic reserve to address extraordinary Extension of strategic reserve likely necessary because nuclear
situations primarily in winter (production capacities, demand power operators are planning a gradual but large-scale phase
reduction capacities) out triggered by sustained drop in Nordic wholesale prices
No impact on market price of electricity (bids above highest Risk of supply shortages in central and southern parts of
commercial bid) Sweden if nuclear switch-off overlaps with loss of strategic
reserve
Strategic reserve initially targeted to be phased-out and replaced
Measures to handle capacity challenges required due to high
with market solution until 2020, however currently challenging
weather-dependency driven by its large share of hydro power
due to difficulties to increase demand response and potential
and electrical heating
deficit in power balance if old capacities are phased out
The future strategic reserve might entail some environmental
requirements – decision on extension until at least 2025
expected in May 2016
1. Average EUR/SEK exchange rate over the respective calendar year period 22Germany Sweden United Kingdom France Netherlands
UK generation portfolio at a glance
Uniper’s electricity production and net capacity
Country generation mix2
in UK1
1% Other 2% Hydro
21%
Renewables 18% Nuclear
Hydro
333
2.0 GW 28% TWh
Hard Coal 5.2 TWh 34%
29% Gas 29% Coal
Lignite
Source: IHS
Competitive environment3
Nuclear Total capacity 2014 (GW)
4.6 GW 66% 13.2
Gas 8.2 TWh 54% 11.1 11.1
7.4
0.4 GW 6%
Other 1.8 TWh 12%
Percentage of total capacity % EDF SSE RWE Uniper
Percentage of total volume % Source: IHS
1. Net generation capacity for 2015 (accounting view); net generation capacity is reported for a power plant if it has been in operation within a year 2. 2015
production volume based on IHS 3. Actual Uniper capacity compared to peers’ capacities based on IHS 23Germany Sweden United Kingdom France Netherlands
UK fossil fleet
Location1 Key earnings drivers
• Clean Dark Spread after coal taxes (steam fleet
Capacity 2015 (MW) currently primarily exposed to merchant market)
Coal
4,635 • Non-wholesale earnings from ancillary services to
2,000 National Grid
360 • Proceeds from introduction of capacity market
34
Coal Gas Oil Biomass
• Development of Clean Spark Spread (currently
limited contribution of wholesale earnings)
Gas
• Non-wholesale earnings from ancillary services to
National Grid; heat supply to industrial customers
• Proceeds from introduction of capacity market
Biomass plant2
• Non-wholesale earnings from biomass facility
(e.g. ROCs)
Coal-fired plant
Other
Gas-fired plant
Oil-fired plant
1 Net generation capacity is reported for a power plant if it has been in operation within a year / a power plant is shown on the map if it has been in operation in 2015
2. Uniper’s UK biomass plant is currently in process of being decommissioned 24Germany Sweden United Kingdom France Netherlands
Market environment in the UK
Conventional capacity development (GW) Illustrative merit order
Low RES feed-in
78,2 74,4 (10% of installed capacity)
71,9 68,3 63,9 63,4 64,8 65,7 62,9 61,5 Minimum Maximum
demand demand
2012 2013 2014 2015 2016 2017 2018 2019 2020 2021
renewables nuclear hard coal natural gas oil
Source: IHS Nuclear Coal Gas Other 1 hydro
Renewables build-up (GW)2 High RES feed-in
41 43 (60% of installed capacity)
36 39
31 33 Maximum
27 Minimum
demand demand
21
13 17
5,9
4,9 4,5
3,6 4,1 3,0
2,2 2,3 2,5 2,0
2012 2013 2014 2015 2016 2017 2018 2019 2020 2021 renewables hydro nuclear hard coal natural gas oil
Source: IHS Capacity additions Total
Economics of conventional generation have changed significantly over the last years driven by the increase of the regulatory carbon price
floor which has put pressure on hard coal fired plants to the benefit of gas-fired capacities
Structural changes to capacity structure expected in the medium-term driven by politically announced phase-out of coal capacities until 2025
and further expansion in capacities from wind and solar
1. Other including Oil, Hydro and other non-renewables 2. Renewables as defined here including Wind on- and offshore, solar PV, solar CSP, combustible
renewables and other renewables (i.e. no hydro included) 25Germany Sweden United Kingdom France Netherlands
Market environment in the UK: Perspective on capacity
markets
Auction results Successful and unsuccessful plants
19.4
18.0
CCGT 22,3 8,8
49,3 46,4 49,3 46,4 Coal / Biomass 9,2 4,5
1st
Nuclear 7,9
5.3 GW 5.5 GW auction
Uniper Uniper 2
capacity capacity CHP 4,2 0,5
Other 5,7 1,8
'14 '15 '18 / '19 '19 / '20
Auction year Delivery year1 £/KW Clearing price
Uniper results CCGT 21,8 5,4
Killingholme 1 & 2 not contracted
1st auction (gas-fired, 802 MW registered in auction) Coal / Biomass 4,7 3,1
87% of Uniper capacity contracted
2nd
Nuclear 7,6
auction
All registered plants compensated 2
2nd auction 100% of Uniper capacity contracted CHP 4,2 0,1
Possible capacity auction to take place 2017/18 Other 8,1 2,8
DECC launched a market consultation on 1 March
Developments 2016 proposing to contract higher volumes of
capacity at an earlier point of time and tighten Unsuccessful (GW)
Source: National Grid Successful (GW)
delivery incentives at the same time
1. Delivery year starts in October and ends in September of the subsequent year 2. Combined Heat and Power, including autogeneration 26Germany Sweden United Kingdom France Netherlands
French generation portfolio at a glance
Uniper’s electricity production and net capacity
Country generation mix2
in France1 0% Other
7% Renewables 11% Hydro
3% Gas
1% Coal
Hydro
535
1.2 GW 56%
TWh
Hard Coal 3.8 TWh 63%
Lignite 77% Nuclear
Source: IHS
Competitive environment3,4
Nuclear Total capacity 2013 (GW)
96
0.8 GW 39%
Gas 2.0 TWh 34%
5
0.1 GW 4% 3
Other 0.2 TWh 3%
Percentage of total capacity % EDF ENGIE Uniper
Percentage of total volume % Source: IHS
1. Net generation capacity for 2015 (accounting view); net generation capacity is reported for a power plant if it has been in operation within a year; Percentages not
adding to 100% due to rounding 2. 2015 production volume based on IHS; Percentages not adding to 100% due to rounding 3. Excluding mothballed plants 4.
Actual Uniper capacity compared to peers’ capacities based on IHS 27Germany Sweden United Kingdom France Netherlands
French fossil fleet (incl. renewables)
Location1 Key earnings drivers
Capacity 2015 (MW)
1,190 • Development of Clean Dark Spread
828 • Proceeds from ancillary services
Coal
• Proceeds from introduction of capacity market
94
2
Coal Gas RES
• Proceeds from introduction of capacity market
Gas
• Regulated earnings from French solar and wind
Renewables
portfolio
Coal-fired plant
• Upcoming earnings from commissioning of
Gas-fired plant Provence IV biomass plant
Renewables
1. Net generation capacity is reported for a power plant if it has been in operation within a year / a power plant is shown on the map if it has been in operation in
2015 2. Renewable energy sources, including wind and solar 28Germany Sweden United Kingdom France Netherlands
Market environment in France
Conventional capacity development (GW) Illustrative merit order
115,5 114,2 113,3 112,0 111,9 112,0 110,2 110,5 109,4 109,2 Low RES feed-in
(10% of installed capacity) Maximum
demand
Minimum
demand
2012 2013 2014 2015 2016 2017 2018 2019 2020 2021
renewables nuclear hard coal oil
Source: IHS Nuclear Coal Gas Other 1 hydro natural gas
Renewables build-up (GW)2 High RES feed-in
36
33 (60% of installed capacity) Maximum
30
27 demand
24
21
19 Minimum
15 17
13 demand
2,5 2,7 2,9 2,9 3,3 3,2
2,0 2,0 2,3
1,4
2012 2013 2014 2015 2016 2017 2018 2019 2020 2021
renewables hydro nuclear hard coal oil
Capacity additions Total natural gas
Source: IHS
French electricity market primarily driven by nuclear capacities, however, nuclear share might come down in the mid-term due to political
intervention (ongoing discussions about reducing nuclear production share to 50% by 2025)
Capacity closures relating to old conventional power plants (hard coal, gas, oil) and an increasing renewable share to drive merit order
changes
1. Other including Oil, Hydro and other non-renewables 2. Renewables as defined here including Wind on- and offshore, solar PV, solar CSP, combustible
renewables and other renewables (i.e. no hydro included) 29Germany Sweden United Kingdom France Netherlands
Market environment in France: Perspective on capacity
markets
Mechanism envisaged Capacity stack (2017)
45.000 FIT and price taker gas CHP,
Demand FIT diesel engine
40.000
Generation Nuclear
Suppliers
(€/MWh per year)
capacities 35.000 Capacity credits are expected to trade in Renewables
Missing money
the €10,000 – 18,000/MW range in the
30.000 best years X Storage
Fuel and diesel engine
25.000 CCGT
Fuel oil ST
20.000
Coal ST
15.000 Implicit DSR (EJP)
Offer of 10.000
Price-setting technologies X Explicit DSR
Capacity Suppliers’ LFO CTs
capacity 5.000
markets obligation Gas CTs
certificates 0 XX Non-FIT CHP
0 20 40 60 80 100 demand
Derated capacity offered
Source: Ministère de l'Écologie, du développement durable, et de l’énergie Source: IHS
Description of mechanism
Establishment of a capacity market as of 2017 driven by prevailing security of supply risks:
Obligation of all capacity owners to commit on their forecasted availability during peak periods (3 years in advance for existing capacities)1
Technology neutrality and equal treatment of demand-side management and production
Penalty regime for not being available during peak periods
Obligation for suppliers to own capacity certificates corresponding to consumption of own clients during peak periods1
Exchange of capacity certificates beginning four years ahead of delivery year, the price of the certificates is determined on market
principles without central bidding process
No impact on energy-only merit order as capacity certificates are traded apart from the energy market
The time schedule for introducing the CRM is dependent on the current enquiries by EU COM in the context of State Aid Guidelines
1. Short peak periods (100-250 hours per year) corresponding to the period at risk in terms of security of supply – the mechanism thus targets periods of high
consumption 30Germany Sweden United Kingdom France Netherlands
Dutch generation portfolio at a glance
Uniper’s electricity production and net capacity
Country generation mix2
in the Netherlands1
1% Other 4% Nuclear
15% Renewables
Hydro
105 33% Coal
2.1 GW 68% TWh
Hard Coal 9.9 TWh 86%
48% Gas
Lignite
Source: IHS
Competitive environment3
Nuclear Total capacity 2014 (GW)
1.0 GW 32%
4.3
Gas 1.6 TWh 14%
3.2
2.6 2.3
Other
Percentage of total capacity % GDF SUEZ Uniper RWE Vattenfall
Percentage of total volume % Source: IHS
1. Net generation capacity for 2015 (accounting view); net generation capacity is reported for a power plant if it has been in operation within a year; 2. 2015
production volume based on IHS; Percentages adding to more than 100% due to rounding 3. Actual Uniper capacity compared to peers’ capacities based on IHS 31Germany Sweden United Kingdom France Netherlands
Dutch fossil fleet
Location1 Key earnings drivers
• Development of Clean Dark Spread
• Non-wholesale contracts with industrial customers
with elements of fixed cost coverage and capital
remuneration
Coal
• Heat supply
Capacity 2015 (MW)
2,140
1,005
• District Heating supply to local municipalities
Coal Gas
Gas
Coal-fired plant
Gas-fired plant
1. Net generation capacity is reported for a power plant if it has been in operation within a year / a power plant is shown on the map if it has been in operation in
2015 32Germany Sweden United Kingdom France Netherlands
Market environment in the Netherlands
Conventional capacity development (GW) Illustrative merit order
Low RES feed-in
(10% of installed capacity)
Minimum Maximum
demand demand
24,3 23,4 22,1 23,1 21,9 21,3 21,5 22,7 22,7 22,6
2012 2013 2014 2015 2016 2017 2018 2019 2020 2021
renewables
hydro
nuclear
hard coal natural gas oil
Source: IHS Nuclear Coal Gas Other 1
Renewables build-up (GW)2
High RES feed-in
(60% of installed capacity)
Minimum Maximum
demand demand
13 14
10 11
7 9
5 5 6
4
1,2 1,3 1,2 1,6 1,6 1,5
0,3 0,6 0,6 0,9
hydro
nuclear
renewables hard coal natural gas oil
2012 2013 2014 2015 2016 2017 2018 2019 2020 2021
Source: IHS Capacity additions Total
Dutch energy market has been very well supplied over the last years due to significant capacities having been commissioned in the recent
past and imports relating to excess renewable production in Germany and the Nordics
Given the current supply situation, the Dutch regulator is currently not considering a capacity market
1. Other including Oil, Hydro and other non-renewables 2. Renewables as defined here including wind on- and offshore, solar PV, solar CSP, combustible
renewables and other renewables (i.e. no hydro included) 33Appendix
1. Group
2. European Generation
3. Global Commodities
3.1 Business overview
3.2 Market development
4. International Power
5. Financial
34Gas midstream Yuzhno Russkoye COFL Power
Uniper's integrated gas position allows for additional
optimisation earnings
Trading around flow Time spread optimisation Hub-to-hub optimisation
Illustration of seasonal gas price
movements
GTF
Hub supply
Winter Winter Winter
Hub sales
Integrated position steering & trading
TTF
NBP GP1
Wholesale ZEE
LTC Flow
Sales NCG CEGH
PEG
Hub sales PSV
Hub supply Summer Summer
AOC
Wholesale margin Summer-Winter Intrinsic value
Intra-year
Monetisation of flexibility Extrinsic value
Extrinsic value
Cost leadership Asset-backed position trading Asset-backed position trading
Portfolio size and flexibility as well as experience and expertise provide competitive advantages
1. Gaspool 35Gas midstream Yuzhno Russkoye COFL Power
Uniper is one of the largest operators of gas storages in
Europe…
Location of Uniper’s gas storage assets1 Market share in Uniper’s markets (bcm)2
25
Kiel
Rönne
Harsefeld Reitbrook Kraak
Etzel
Krummhöm 8
28%
Nüttermoor 5
Huntorf
21%
Rehden 3%
Kalle
Epe Uelsen Bernburg
Katarina Germany Austria Uk
Staßfurt
Xanten
Allmenhausen Uniper Competitors
Bad Laustädt Source: GSE
Kircheilingen Burgraff-Bensdorf
Eynatten
Competitive landscape
STEGAL
Reckrod Top European storage operators 2015 (bcm)2,3
Stockstadt
Eschenfelden
Hähnlein
Frankenthal 16
Sandhausen
NetConnect 11
9 8
Germany
Bierwang
Gas pipeline Fronhofen-
Wolfersberg 7Fields
limensee
Gas storage Breitbrunn/
Schmidhausen
Inzenham Eggstätt
Uniper gas storage STOGIT Storengy Uniper NAM
Source: IHS Source: GSE
1. Excluding UK storage asset in Holford; based on 31/12/15 2. Operational facilities 3. Excluding Russia and Ukraine 36Gas midstream Yuzhno Russkoye COFL Power
…operating a well-balanced portfolio of seasonal, mid-
and fast churn gas storages
Gas storage portfolio at a glance Key value drivers
Storage Country Capacity1 Main applications • Storage can enable time arbitrage value to be
captured - gas is injected at times of low prices
Epe L-Gas 0.4 Peak shaving and withdrawn at times of higher prices
Krummhörn 0.2 Peak shaving Arbitrage • For seasonal storage this is usually summer
Nüttermoor 0.1 Peak shaving and peak winter months, for mid and fast churn
storage (peak shaving) arbitrage vale can be
RönneGas midstream Yuzhno Russkoye COFL Power
Uniper owns three pipeline participations…
OPAL BBL Transitgas
Germany
Bacton Rodersdorf Wallbach
France Lostorf
Balgzand Däniken Austria
Ruswil
United
Kingdom Switzerland
Amsterdam
Griespass
London Netherlands Italy
Key metrics Key metrics Key metrics
Stake 20%1 Stake 20%1,2 Stake 3%1
Capacity (100%) 36.5 bcm/a Capacity (100%) 16 bcm/a Capacity (100%) 18 bcm/a
Start-up date 2011 Start-up date 2006 Start-up date 1974
Business description Business description Business description
• Runs from the Nord Stream landfall point • 235km gas pipeline through the Southern • Pipeline system with a combined length
in Northern Germany over c. 470km part of the North Sea, connecting the of c.292km, crossing Switzerland from
south to the end point at the German- Netherlands and the UK North to South, with a connection to the
Czech border • Capacity marketed via standardised French grid in the West and the Italian
• Pro-rata transmission capacity long-term auctions for certain products (forward grid in the South
marketed to customers flow, interruptible forward flow, • Constructed, maintained and operated by
• Technical operation provided by majority interruptible reverse flow) Transitgas AG, which is a partnership
owner OPAL Gastransport which is • The other partners in BBL are Gasunie between Swissgas (51%), FluxSwiss
indirectly owned by Wintershall and (60%) and Fluxys (20%) (46%) and Uniper (3%).
Gazprom
Source: OPAL Gastransport GmbH Source: BBL Company Source: Transitgas AG
1. Stake as of 31/12/15 2. Stake held by means of Bruchteilsgemeinschaft through 100% subsidiary Lubmin-Brandov Gastransport GmbH 38Gas midstream Yuzhno Russkoye COFL Power
…and participates in the Nord Stream II project
Pipeline location Ownership
Finland Nord Stream I Nord Stream II
Current Nord Engie 9% Gazprom 51% Engie 10%
Sweden Estonia Russia Gazprom 50%
Stream I twin Gasunie 9%
pipelines OMV 10%
Latvia Nord Stream II Wintershall Shell 10%
route options 15.5%
Denmark under investigation Wintershall
Lithuania 10%
Russia Belarus Uniper / E.ON 15.5%2 Uniper 10%
Germany Poland
Source: Nord stream AG, Nord Stream 2 AG Source: Nord Stream AG, Nord Stream 2 AG
Key statistics Nord Stream II roadmap
Nord Stream I Nord Stream II • Since 2011: Feasibility study and preparation work
COD 2011/12 2019E • Signing of shareholders’ agreement on 4th September 2015
Length (km) 1,224km ~1,200km • Ongoing procurement and tender processes
• Surveys and engineering to take place until mid-2017
Capacity 55 bcm/a 55 bcm/a
• Environmental impact assessments and permitting until end of
Investment volume €7.4bn ~€8.0bn1 2017
Uniper / E.ON share 15.5%2 10% • Construction of both lines in 2018 and 2019
• Planned COD in late 2019
Uniper stake Disposal to E.ON Ownership
Source: Nord Stream AG, Nord Stream 2 AG Source: Nord Stream 2 AG
1. 30% equity contribution from shareholders and 70% external project finance 2. As of 31/12/15 39Gas midstream Yuzhno Russkoye COFL Power
Long-standing and fruitful partnership with Gazprom
LTCs Gazprom negotiation
• 1970: first LTC • 1973: Start of gas • 1974-1998: • 2006: Prolongation • 2012: Settlement • 2015/16: In June 2015,
between deliveries to Signing of of major LTCs until of 2010 price E.ON, Gazprom and other
Soyuzneftegaz Germany additional 2035 review partners sign memorandum
and Ruhrgas contracts of intent to build Nord
Stream II
• Project with total
envisaged investment
volume of ~€8.0bn
1970
2016
1998-2003 Since 2005 2008
• SPV will be set up with an
expected capitalization of
30% equity and 70% debt
• 2016: agreement on price
Gazprom stake Nord Stream I & II Yuzhno Russkoye
adjustments to LTCs
• 1998-2003: E.ON Ruhrgas • 2005: E.ON Ruhrgas decides to • 2008: E.ON swaps part of its reached
builds up equity participation participate in the Nord Stream 6.4% stake in Gazprom against • Prices adjusted on the
in Gazprom to 6.4% pipeline project 25% minus one share in basis of current market
• 2.9% of total equity returned • 2011-2012: commissioning of Yuzhno Russkoye gas field conditions
to Gazprom as part of Nord Stream I (Lines 1 & 2) • LTCs derisked for the
E.ON’s acquisition of a • 2015: In June, E.ON, Gazprom upcoming years
stake in Yuzhno Russkoye and other partners sign
• Sale of remaining 3.5% in memorandum of intent to build
2010 as part of portfolio Nord Stream II
streamlining
40Gas midstream Yuzhno Russkoye COFL Power
Yuzhno Russkoye: An attractive upstream investment
with long-term production outlook
Key facts Description
• Ownership: Uniper (25%)4, Gazprom (50%), Wintershall (25%)
• Field commissioning in October 2007 • Owns and operates Yuzhno Russkoye
gas field
• Concession area of 900 sq. km (80 km long and 12 km wide)
• 2P reserves of 610 bcm1 of gas containing 98% methane gas • Uniper’s 25%4 stake is accounted for at-
• Plateau production until early 20s: ~25bcm (since late 2009) SNGP2 equity and Uniper receives dividends
• Natural decline expected from Cenomanian layer thereafter with licence accordingly
expiring post 2035
• Uniper’s 25% share of production is sold
• Additional capex requirements for production from deeper layers in mid- at cost-plus price to YGRM
term
Source: SNGP
Current contractual structure • Fully consolidated3
Operates
asset
Dividends • Gas bought from SNGP resold to
SNGP
Gazprom
Compensation for Asset
Uniper operation costs Gas YGRM • Contractual make-up year 2016 leading
plus margin
to one-time reduction of allocated gas
YGRM production volumes which have been
Dividends
received and over-produced against plan
Gas proceeds Gas
between 2009 and 2015
Gazprom
Source: SNGP Source: SNGP
1. As per Swap Agreement 2009 2. OAO Severneftegazprom 3. Economic interest of 99.9% 4. As of 31/12/15 41Gas midstream Yuzhno Russkoye COFL Power
COFL consists of an established global coal arbitrage
portfolio...
Global coal arbitrage business case Flexibility and optionality as basis for arbitrage
• Direct access to coal miners
Coal quality Transport Supply
• Minority stakes in US hard coal exporters
flexibility flexibility flexibility
Javelin5 and Exporting Commodities Int.6
Internal
demand • Access to different coal qualities through
Coal quality diversified sourcing portfolio
flexibility
• Ability to blend different coal qualities
Coal
miners Transport and • Ability to store / transport coal between different
storage locations along with flexible logistics (splitting
flexibility vessels & cargos, time charters, bunkers)
External • Extraction of portfolio value requires information
customers Network and
on port congestion, weather, port stocks, river
Supply Storage expertise
navigation, rail/barge availability
flexibility flexibility
• Back-to-back hedging of physical supply
Hedging positions without price exposure
Control of entire value chain • Natural and flexible physical short position
Value chain and expertise1 Uniper vs steam coal imports in key markets7
~$352 ~$203 ~$454 mt
Costs 43
Coal
Coal for Bunker Dis- 28
Loading Logistics sale at
production operating purchase charging 17
market 11 8
vessel
Uniper Netherlands France UK Germany
Source: IHS
1. Per ton of seaborne coal shipped to Europe 2. FOB vessel cash cost for coal from Indonesia (Source: Harum Energy) 3. Certain margin elements already
included 4. API2 as of 21/04/16 5. Minority stake of 28% as of 31/12/15 in London based Javelin Global Commodities Holdings LLP acting as primary marketer of
hard coal for US based Murray Energy 6. Minority stake of 49% as of 31/12/15 in Exporting Commodities International LLC a commodity trader engaged in the
import and export of hard coal in the US 7. Based on 2015; Seaborne steam coal imports 42Gas midstream Yuzhno Russkoye COFL Power
... and an LNG business which is developing from
existing regas positions to global arbitrage
Perspective on key contracts and target
Overview of Uniper’s LNG activities
business profile
• Flexible medium term contract for delivery of up to 10bcm over
5-year term (starting in 2014)
Goldboro Qatargas
• Delivery to Rotterdam, utilizing Uniper’s regasification position
Freeport Qatargas • Priced at Continental European gas hub basis
RasGas
• Flexible medium-term contract for delivery of up to 2bcm over
Rasgas 3-year term (starting in 2014)
• Delivery to Isle of Grain utilizing Uniper’s regasification position
• Offtake of 0.8 mtpa of LNG over 20 years
• COD planned for Q4 2018
Freeport • 20-year contract with Gulf South Pipeline Company for the
shipment of natural gas on the to-be-built Coastal Bend Header
project1
• Participation in Goldboro LNG project in Nova Scotia
• Offtake of 5 mtpa of LNG over 20 years
Gate Goldboro
(3 bcm) • Based on market prices of natural gas in Western Europe
• COD planned for 2021, however, final investment decision not
Isle of Grain
taken yet
(1.7 bcm)
Huelva Develop high quality partnerships to leverage Uniper’s wider capabilities
Existing
(access) Barcelona (access)
Cartagena (access) Securing intrinsic value (sales activities)
regas facilities Monetization of extrinsic flexibility (global arbitrage)
1. The pipeline is intended to serve the liquefaction terminal near Freeport 43Gas midstream Yuzhno Russkoye COFL Power
Power desks engage in the marketing and optimisation
of internal and external generation and sales positions
Uniper European
Generation / Wholesale
Forward and Prompt Short-term and Delivery
Uniper Global Commodities
Market
E.ON
Forward and Prompt Short-term and Delivery
• Diverse asset base enabling a portfolio approach for optimisation • Power plant dispatch and active market optimisation by
across market channels, commodities and countries marketing assets in primary & secondary reserve as well as
intraday markets and real time trading
• Protect underlying intrinsic value of generation assets by hedging
generation profiles with standard products • Experienced optimiser & dispatchers with good track record
• In-depth grid congestion knowledge provides opportunity for
• Capture extrinsic value by delta hedging and dynamic forward
proactive dispatch and imbalance management
hedging through structured financial contracts
• 24/7 shifts for dispatch and intraday trading covering Germany,
• Management of tradable Uniper sales and generation positions UK, Benelux, France & Nordics
across European power markets taking on price risks and manage
positions such as spark and dark spreads, time spreads and cross-
border spreads
44Appendix
1. Group
2. European Generation
3. Global Commodities
3.1 Business overview
3.2 Market development
4. International Power
5. Financial
45European gas supply development shows a decreasing indigenous production and decreasing gas demand European gas supply by source (bcm)1 European LNG imports over time (bcm)1
Global LNG demand expected to grow over next years

Overview of global LNG flows                                                                   Development of global LNG demand (bcm)1

                                                                                                                                       52       557
                                                                                                                            59

                                                                                                                 103

                                                                                                     344
                              Key routes           Other routes

Market developments
• Global trade grows significantly with new markets and new
  production capacities in North America and Australia reducing
  Qatar's dominance on global markets

• Europe acts as the balancing market for LNG following the
  growth in trade

• China and India drive the demand growth in Asia; current
  dominant markets South Korea and Japan growing at much                                            2015       2016-18E   2019-22E   2023-25E   2025E
  lower pace
                                                                                             Source: IHS

              1. Original source unit is mmt; conversion rate mmt LNG into bcm natural gas: 1 mmt = 1.38 bcm                                            47
Global coal market expected to grow over the next
years driven by increasing demand from Asian markets
Overview of global coal flows Development of steam coal demand (mmtpa)
44 1.035
65
907 18
849
702
Source: IHS Key routes Other routes
Market developments
• Global coal demand driven primarily by global economic growth
• Decreasing demand from Europe compensated by increasing
demand from Asia-Pacific Market 206 185
• Share of Pacific Basin in global coal market increasing from 77%
in 2015 to 82% in 2025 2015 16-18E 19-22E 23-25E 2025E
Atlantic basin Pacific basin
Source: IHS
48Coal prices under pressure over the last years, however,
fundamentals indicate potential for a recovery
Coal price development ($/t)1 Global revenue pool ($bn)2
+83%
160
140
120 94
100
80
51
60
40
20
0
2010 2011 2012 2013 2014 2015 2016 16E 17E 18E 19E 20E 2015 2025E
API II Coal (1Y) API IV Coal (1Y)
Source: Bloomberg, IHS Source: IHS
1. 2016-25E IHS projections for ARA Coal (nominal $/t) 2. Based on IHS-projections for global steam coal demand and nominal ARA coal price 49Appendix
1. Group
2. European Generation
3. Global Commodities
4. International Power
5. Financial
50Russia Brazil
Russian generation portfolio at a glance
Uniper’s electricity production and net capacity
Country generation mix2
in Russia1Russia Brazil
Market environment in Russia
Pricing zone 1 Pricing zone 2
Illustrative merit order Illustrative merit order
Hydro
Nuclear
Coal
Hydro
Coal
Gas
• Commissioning of new capacities significantly impacting merit • Pricing zone primarily consists of hydro and coal fired capacities
order structure
• Electricity volume produced from hydro plants is one of the key
• Old gas fired plants typically acting as price-setters on energy-
price drivers due to its impact on required production from coal
only market
fired plants
• Price development of fuel and therefore gas price indexation
therefore with significant impact on electricity price development
Capacity development (GW)1
2015 2016 2017 2018 2019 2020 2021
Thermal 158.4 160.2 159.7 161.2 162.0 162.0 162.0
Hydro 47.7 47.9 47.9 48.3 48.7 48.7 48.7
Nuclear 26.3 27.1 27.9 30.1 30.3 31.5 30.5
RES (Wind + PV) 0.0 0.1 0.3 0.6 0.9 0.9 0.9
232.5 235.3 235.7 240.3 241.9 243.1 242.1
Source: Russian system operator / Ministry of Energy
1. For a given year, numbers may not exactly add up to the total number due to rounding effects 52Russia Brazil
Regulatory environment in Russia: KOM auctions
Description Demand curve
KOM1 mechanism applies to all capacities which are not subject KOM-established price
Point 1 Defined by Russian regulator
to the CSA2 system
The 1st and 2nd pricing zone are subject to the same rules,
Price
differences relate to price points which define the demand curve
Functioning of the capacity auction: Point 2
Regulator defines the demand curve based on two points with Demand +12%
Demand
bottom and an upper (bottom + 12%) capacity demand levels
and with respective prices
Capacity
Supply curve is defined by the submitted bids, no bids above Source: National Electricity Market Council
the price of point 1 (maximum price) are allowed
Resulting KOM price is defined by the interception of supply
and demand curves, or (if supply is too low and there is no Price establishment mechanism
interception) by the point on the demand curve which KOM-established price
corresponds to the aggregated supply
Demand
Pricing zone 1 (kRUB/MWh) Pricing zone 2 (kRUB/MWh)
Price
210 Point 1
189 182 186 190 Capacity
under CSA,
150 Point 1 150 Point 2 nuclear
and hydro
110 113 113 111 110 Point 2
capacities Maximum
Minimum
2016 2017 2018 2019 2016 2017 2018 2019
Source: System operator Source: National Electricity Market Council Capacity
1. Capacity market for existing capacity 2. Capacity supply agreement for new capacity 53Russia Brazil
Regulatory environment in Russia: Capacity supply
agreements
Description Composition of the capacity payment
Applies to new power generation capacities which are subject to the
government’s CSA campaign (built 2007 or later) 1.
1 Reference capex level depending on unit
Capacity prices are set on a long-term contractual based on individual characteristics (e.g. price zone, fuel)
capacity selling agreements (CSAs)
Under the agreements generators are obliged to commission new
capacity with predefined characteristics in a predetermined time frame
In return, they receive a 10-year stream of payments enabling a
2.
2 Reference operating costs depending on unit
predictable return on investment characteristics
The price level is significantly above the typical results on the KOM
markets in order to stimulate investments into new-builds
3 Reference property tax expense
3.
Illustrative determination of WACC
Government bond yield (%) Rate of return (T+1; %)
Link to government bond 4.
4 Full costs associated to connection to
Defined by yield for inflation protection
Russian regulator electrical and gas networks
16,5
13,0
12,0 4,5
8,5 4,5 5.
5 Rate of return on invested capital (annually
12,0
8,5 adjusted)
T0 T1 T1 T2
Basic rate of return of 13%
6.
6 Other factors
Recalculation if actual bond yield deviates from 8.5% reference level
54Russia Brazil
Market environment Russia: Oil price-RUB correlation
Oil price vs RUB FX rate development1 RUB-denominated oil price2
140 5000
120 4500
100 4000
80 3500
60 3000
40 2500
20 2000
2011 2012 2013 2014 2015 2016 2011 2012 2013 2014 2015 2016
Oil price (Brent) USD/RUB EUR/RUB Oil price (Brent in RUB)
Source: Bloomberg Source: Bloomberg
• Historical correlation between oil price and RUB exchange rate has been high
1. Rebased to price on 01/01/11 2. Calculated oil price in RUB; Brent Crude oil price per barrel multiplied by corresponding FX rate 55Russia Brazil
Brazilian business consists of a minority stake in
ENEVA and a 50% direct stake in Pecem II
Eneva’s assets ENEVA’s access to fuel resources
Pecem II BPMP • Stake: 100%5
Operational
(MW, Uniper pro-rata)4 PGN • Stake: 27%2
Gas3
227 • All blocks located in Parnaiba Basin
173 Seven • Primarily indirect investments through BPMP
licenses and PGN
In operation /
• Proved coal reserves of up to 152mt
Coal
under construction Seival
Under development mine • Adjacent to Sul and Seival power plant projects
Coal Gas
Source: ENEVA (map) Source: ENEVA
ENEVA Pecem II
Top-3 private thermal power generator in Brazil 334 MW state-of-the art
4.9 GW development pipeline in conventional and renewables hard coal-fired power
Upstream asset base within gas and coal plant
Has demonstrated high
Restructuring completed with capital structure having been availability since
rebalanced commissioning
Uniper stake: 12.3%6 Uniper stake: 50%1
Source: ENEVA
1. Stake in Pecém II Participações SA as of 31/12/15; the other 50% are owned by ENEVA SA – thus, Uniper holds an indirect stake in Pecem II of 56.2% 2.
Parnaiba Gas Natural S.A.; stake as of 31/12/15 via ENEVA SA; one of the largest gas producers in Brazil 3. ENEVA ensures access to gas resources via
participations in 7 blocks in the Parnaiba Basin, either directly or through its subsidiaries BPMP and PGN 4. Based on 2015 5. BPMP Parnaíba; stake as of 31/12/15
via ENEVA SA 6. Stake in ENEVA SA as of 31/12/15 56Appendix
1. Group
2. European Generation
3. Global Commodities
4. International Power
5. Financial
5.1 Historical financials
5.2 Risk management
5.3 Management incentives
57Uniper Group: Key P&L items at a glance
Key P&L items
€m 2013 2014 2015
Sales 94,750 88,225 92,115
Adjusted EBITDA 2,227 1,966 1,717
Economic depreciation and amortization / reversals1 (1,179) (1,140) (916)
Adjusted EBIT 1,048 826 801
Non-operating adjustments (1,950) (3,858) (4,210)
EBIT (902) (3,032) (3,409)
Net interest income / expense (171) (128) 48
Income taxes (60) 348 (396)
Net income / loss after income taxes (1,133) (2,812) (3,757)
Attributable to the E.ON Group (1,173) (2,550) (4,085)
Attributable to non-controlling interests 40 (262) 328
Source: Combined financial statements
1. Economic depreciation and amortization/reversals include operating depreciation and amortization 58Uniper Group: Combined statement of income as
reported
Combined statements of income
€m 2013 2014 2015
Sales including electricity and energy taxes 95,097 88,522 92,338
Electricity and energy taxes (347) (297) (223)
Sales 94,750 88,225 92,115
Changes in inventories (finished goods and work in progress) (17) (64) 4
Own work capitalized 81 81 46
Other operating income 4,572 9,462 10,825
Cost of materials (91,256) (84,501) (89,306)
Personnel costs (1,442) (1,329) (1,260)
Depreciation, amortization and impairment charges (2,191) (5,209) (5,357)
Other operating expenses (5,082) (9,319) (10,524)
Income / loss from companies accounted for under the equity method (340) (388) 60
Income / loss before financial results and income taxes (925) (3,042) (3,397)
Financial results (148) (118) 36
Income taxes (60) 348 (396)
Net income / loss after income taxes (1,133) (2,812) (3,757)
Attributable to the E.ON Group (1,173) (2,550) (4,085)
Attributable to non-controlling interests 40 (262) 328
Source: Combined financial statements
59Uniper Group: Details on non-operating adjustments
Non-operating adjustments Impairments by segments
Goodwill (2015)
€m 2013 2014 2015
€0.3bn
International
Power €2.1bn
Net book gains / losses (21) - 38 European
Generation
€2.4bn
Fair value measurement of derivative financial
319 1,167 511
instruments
Restructuring / cost management expenses 1 (142) (211) (137)
Property, Plant & Equipment (2015)4
Non-operating impairments / reversals 2 (1,225) (4,484) (4,199) €0.3bn
Global
Commodities
Miscellaneous other non-operating earnings3 (881) (330) (423)
€2.0bn €1.7bn
Non-operating adjustments (1,950) (3,858) (4,210) European
Generation
Source: Combined financial statements Source: Combined financial statements
1. In 2015, restructuring/cost management expenses included depreciation and amortization amounting to €18m (2014: €14m, 2013: €14m). 2. Non-operating
impairments/reversals consist of non-operating extraordinary impairments and reversals triggered by regular impairment tests. The total non-operating
impairments/reversals and economic depreciation and amortization/reversals deviates from the depreciation and amortization reported in the income statement
since the two items also include impairments on companies accounted for under the equity method and other financial assets and a small portion as described in
footnotes 1 and 3 is included in restructuring/cost management expenses and the miscellaneous other non-operating earnings. 3. In 2014, miscellaneous other non-
operating earnings included impairments on assets held for sale amounting to EUR 97 million. 4. Contribution of International Power not shown due to immateriality 60
(€26m)Uniper Group: Combined balance sheet (1/2)
Balance Sheet of the Uniper Group - Assets
€m 2013 2014 2015
Goodwill 6,372 4,911 2,555
Intangible assets 3,258 2,436 2,159
Property, plant and equipment 19,778 15,717 14,297
Companies accounted for under the equity method 1,897 1,401 1,136
Other financial assets 1,306 927 558
Equity investments 1,127 743 369
Non-current securities 179 184 189
Financial receivables and other financial assets 3,604 4,104 3,029
Operating receivables and other operating assets 1,985 3,158 4,687
Income tax assets 17 14 9
Deferred tax assets 1,040 1,355 1,031
Non-current assets 39,257 34,023 29,461
Inventories 2,888 2,297 1,734
Financial receivables and other financial assets 10,499 11,475 8,359
Trade receivables and other operating assets 18,726 23,205 23,085
Income tax assets 146 206 296
Liquid funds 896 412 360
Assets held for sale 98 2 228
Current assets 33,253 37,597 34,062
Total assets 72,510 71,620 63,523
Source: Combined financial statements
61You can also read