Barclays CEO Energy-Power Conference - Alan Armstrong, President & Chief Executive Officer September 8, 2021
←
→
Page content transcription
If your browser does not render page correctly, please read the page content below

Barclays CEO Energy-
     Power Conference
     Alan Armstrong, President & Chief Executive Officer
     September 8, 2021

WILLIAMS © 2021 The Williams Companies, Inc. All rights reserved.   NYSE: WMB I Williams Virtual ESG Event I NYSE:  WMB
                                                                                                             1/19/2021    | www.williams.com
                                                                                                                       I www.williams.com  1
Large-scale, irreplaceable natural gas infrastructure

                                                                                                                                                      Handling
                                                                                                                                                      ~30%                             Transco
                                                                                                                                                                                      Nation’s largest
                                                                                                                                                    of nation’s                     and fastest growing
                                                                                                                                                                                      major pipeline
                                           Wamsutter                                                                                                natural gas
                                                                                                                      Marcellus
                          Southwest
                          Wyoming
                                                                                                                       + Utica                     1.26 million MT                  More than doubled
                                                   DJ Basin
                                                                                                                                                  CO2 avoided each                   contracted capacity
                                           Piceance
                                                                                                                                                  day by combusting                 to 17.9 Bcf/d in 2020
                                                                                                                                                  29.8 MMDth of gas                   from 8.5 Bcf/d in
                                                                                                                                                        v. coal1                            2008
                                                             Anadarko
                                                                                                                                                    Fee-based G&P
                                                                                                                                                                                      Natural gas
                                                                                                                                                    business with
                                                                                                                                                                                    focused strategy
                                                Permian
                                                                                    Haynesville
                                                                     Barnett                                                                        geographical
                                                                                                                                                  diversity, serving                    provides a
                                                                                                                                                                                       practical and
                                                                                                                                                            14
                                                              Eagle Ford

                                                                                                                                                                                    immediate path to
                                                                                                                                                   key supply areas                  reduce emissions
                                                                                            Deepwater
                                                                                           Gulf of Mexico

                                 1Coal   and natural gas plant emissions rate and heat rate assumptions per EIA.

WILLIAMS © 2021 The Williams Companies, Inc. All rights reserved.                                                  NYSE: WMB I Barclays CEO Energy-Power Conference I September 08, 2021 I   www.williams.com   2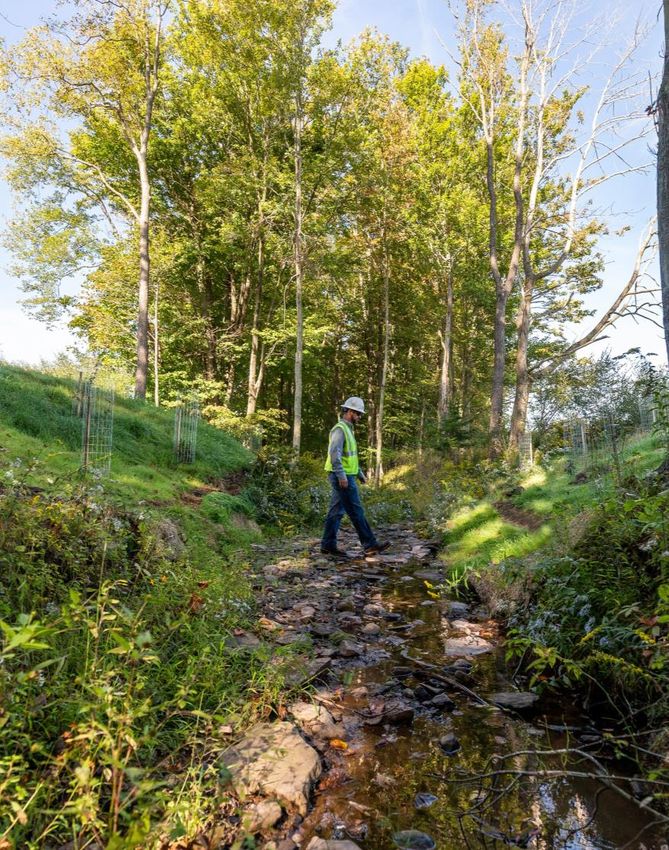
Why Williams?

                   Financial strength                                                        Focus on long-term
                       & stability                                                            shareholder value
                    Reliable earnings, durable cash                                            Return capital to shareholders and
                    flow and a healthy balance sheet                                           pay attractive dividend

                   Position of growth                                                       Sustainable strategy
                    Ability to invest in high-return                                           Leverage natural gas strategy to
                    growth projects, emission reduction                                        help build a clean energy future
                    projects and renewables

WILLIAMS © 2021 The Williams Companies, Inc. All rights reserved.          NYSE: WMB I Barclays CEO Energy-Power Conference I September 08, 2021 I   www.williams.com   3
Williams is a unique
investment opportunity

NYSE: WMB | www.williams.com
Reliable earnings and healthy balance sheet
                                    Adjusted Earnings Per Share ($/Shr)                                                 AFFO ($MM) & Dividend Per Share ($/Shr)

                                                                                                                                                $3,611         $3,638          $3,800
                                                                                   $1.09 - $1.25

    ~14%
                                                                           $1.10                                                $2,965
                                        $0.79
                                                         $0.99
                                                                                                                                  $1.36
                                                                                                                                                  $1.52           $1.60          $1.64                Healthy
       CAGR                                                                                                                                                                                        AFFO SUPPORTING
    TO MIDPOINT                                                                                                                                                                                     DIVIDEND WITH
      OF 2021G                                                                                                                                                                                     AMPLE COVERAGE

                                                                                                                                                                                                   Excess Cashflow        Dividend/Shr

                                        2018             2019               2020      2021G                                      2018            2019            2020          2021G               Total Dividends1

                                                Adjusted EBITDA ($MM)                                                                 Net Debt-to-Adjusted EBITDA2

      ~5%                                                                                                                                                                                                 ~13%
                                                                              $5,200 - $5,400                                      4.80x
                                                                      $5,105                     Expecting
                                                      $5,015                                     high-end of                                                                                          IMPROVEMENT
       CAGR                                                                                                                                        4.39x           4.35x
                                       $4,638
                                                                                                 ‘21 Guidance                                                                                          IN LEVERAGE
    TO MIDPOINT                                                                                  range
Williams generates steady growth in volumes and Adj. EBITDA
                                 Quarterly Growth: Williams Continuing Segment Adj. EBITDA, Contracted Transmission Capacity and
                                                Gathering Volume vs. Crude Oil and Natural Gas Commodity Prices
                     160

                     140                                                                                                                                                                                                Adj. EBITDA
                                                                                                                                                                                                                        Capacity +
                                                                                                                                                                                                                        Volume
                     120                                                                                                                                                                                                Oil Price
   Indexed to 100

                                                                                                                                                                                                                        Natural Gas
                     100
                                                                                                                                                                                                                        Price

                       80

                       60

                       40
                                        2015                        2016                2017                         2018                          2019                         2020                        2021

                            WTI Oil Price1                        Henry Hub Natural Gas Price 2                     Continuing Segment                            Contracted Transmission Capacity &
                                                                                                                    Adj. EBITDA3                                  Gathering Volume4
Note: This slide contains non-GAAP financial measures. A reconciliation of all non-GAAP financial measures used in this presentation to their nearest GAAP comparable financial measures are included at the back of this presentation.
1Source: EIA, monthly avg. price of NYMEX WTI Crude Oil prompt-month contract 2Source: EIA, monthly avg. price of NYMEX Henry Hub Natural Gas prompt-month contract 3Sum of West, Northeast G&P and Transmission & Gulf of Mexico

segment Adj. EBITDA; 4 Sum of gathering volumes and avg. daily firm reserved capacity for regulated transportation (converted from Tbtu to Bcf at 1,000 btu/cf) for West, Northeast G&P and Transmission & Gulf of Mexico segments.

                    WILLIAMS © 2021 The Williams Companies, Inc. All rights reserved.                                       NYSE: WMB I Barclays CEO Energy-Power Conference I September 08, 2021 I             www.williams.com          6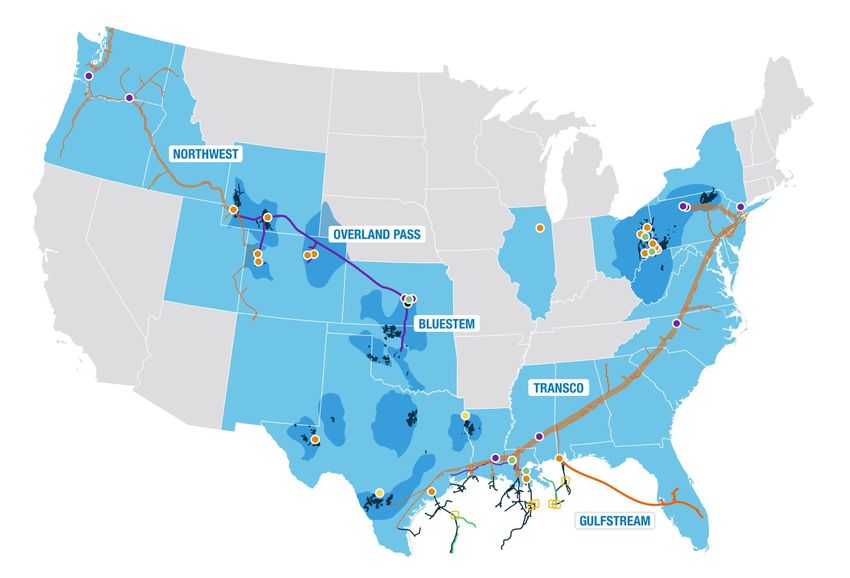
Base business to generate significant cash flow
                    5-YEAR CUMULATIVE EXCESS CASH FLOW GROWTH POTENTIAL1                                                                                 EXERCISE EVALUATES EXCESS CASH FLOW
                                                                    Illustrative Example                                                                       POTENTIAL THROUGH 2026
                $10
                                                                                                                                                                                    Assumptions
                                                                                                                                                      Capex in-line with recent levels
                                                                                                                                                      Annual Growth and Maintenance Capex of ~$1.2
                                                                                                                                                      billion and ~$400 million, respectively, based on
                                                                                                                                                      2020 and 2021G averages
  Billion ($)

                 $5                                                                                                                                   Leverage ratio remains constant
                                                                                                                                                      Debt-to-Adj. EBITDA held flat at ~4.20x

                                                                                                                                                      Modest Adj. EBITDA growth
                                                                                                                                                      3.5% Adj. EBITDA growth in-line recent capital
                                                                                                                                                      deployment and based on historical CAGR (‘19-‘21
                                                                                                                                                      high-end Guidance range)
                 $0                                                                                                                                   Up to 5.0% Adj. EBITDA growth based on historical
                                 2022                       2023               2024                  2025                    2026                     CAGR (‘18-‘21 high-end Guidance range)
                             Excess Cash Flow Assuming up to 5.0% Annual Adj. EBITDA Growth
                                                                                                                                                      Dividend growth
                             Excess Cash Flow Assuming 3.5% Annual Adj. EBITDA Growth                                                                 Aligned with Adj. EBITDA growth rate
1Assumes  EBITDA growth based off the high-end of updated 2021 Adj. EBITDA guidance range of $5.2 billion to $5.4 billion. Excess Cash flow is defined as Available Funds from Operations (AFFO) plus incremental leverage less
Dividends, Growth Capex and Maintenance Capex. Assumes 2021 baseline of AFFO is high-end of 2021G of $3.9 billion.

           WILLIAMS © 2021 The Williams Companies, Inc. All rights reserved.                                         NYSE: WMB I Barclays CEO Energy-Power Conference I September 08, 2021 I          www.williams.com            7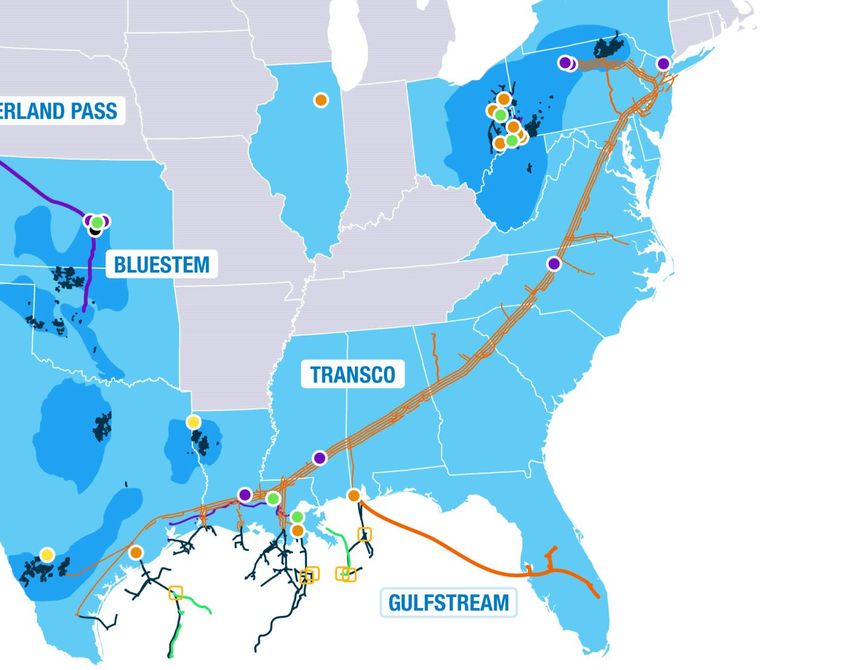
Thoughtful and disciplined approach to capital allocation
                                                                          CAPITAL ALLOCATION PRIORITIES

1               Balance Sheet                                           Protect long-term health of balance sheet and investment-grade rating

                                                                        Preserve long-standing commitment to shareholder returns;
2                    Dividends                                          Dividend growth rate aligned with Adj. EBITDA growth

3                      Reinvest                                         ~$1.20B annually in high-return growth capex

        Emissions Reduction
4         & Renewables
                                                                        ~$0.30B annually in emissions reduction capital while generating regulated return;
                                                                        ~$0.25B annually seeking renewables projects while leveraging existing footprint

                                                                        Seek arbitrage within capital structure by allocating excess cash for deleveraging
5            Investor Returns                                           or buybacks

    WILLIAMS © 2021 The Williams Companies, Inc. All rights reserved.                             NYSE: WMB I Barclays CEO Energy-Power Conference I September 08, 2021 I   www.williams.com   8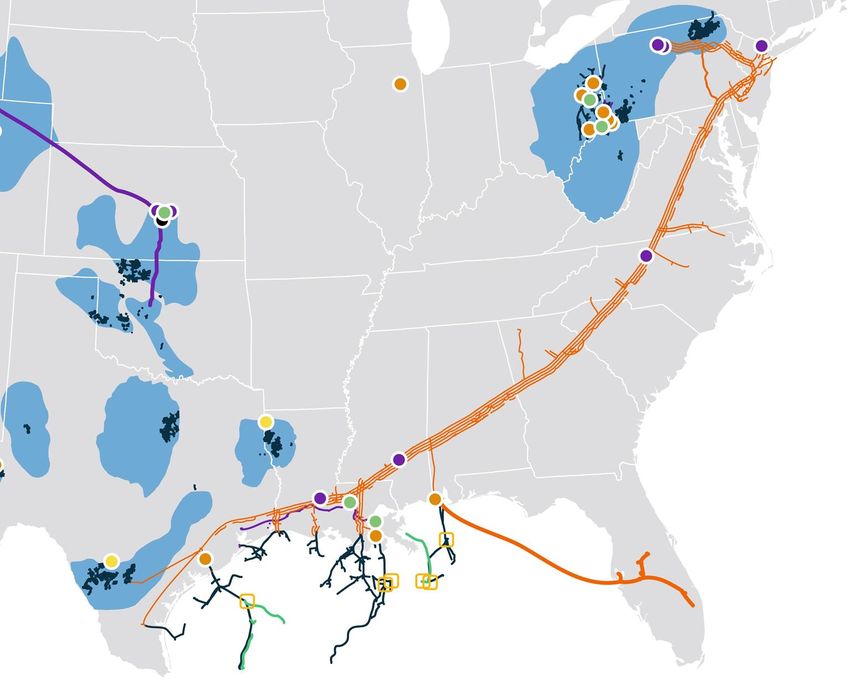
Williams in a
position of growth

NYSE: WMB | www.williams.com
High-return growth project opportunities
                                            across Williams’ portfolio

    Transmission                                         Deepwater                    Northeast                              Haynesville &
       Growth                                          GOM Expansion                    G&P                                   Wamsutter
      Projects                                            Projects                     Growth                                G&P Growth
o Robust backlog of high-                          o 5 high-return expansion   o Large, established footprint                o Established infrastructure
  return, demand pull                                projects in execution       with strong customer base                     near growing demand
  growth opportunities                                                                                                         centers
                                                   o Many opportunities with o Increasing margin through
                                                     minimal capital required   scale and efficiency                         o Upstream JVs to drive
o 5 projects in execution
                                                                              o Continued free cash flow                       additional volume growth
  with 25+ transmission                            o Annual Adj. EBITDA
                                                                                generation expected                            to midstream and
  projects in development                            expected to double by
                                                                                                                               downstream assets
                                                     2025

  WILLIAMS © 2021 The Williams Companies, Inc. All rights reserved.                    NYSE: WMB I Barclays CEO Energy-Power Conference I September 08, 2021 I   www.williams.com   10
Executing significant portfolio of
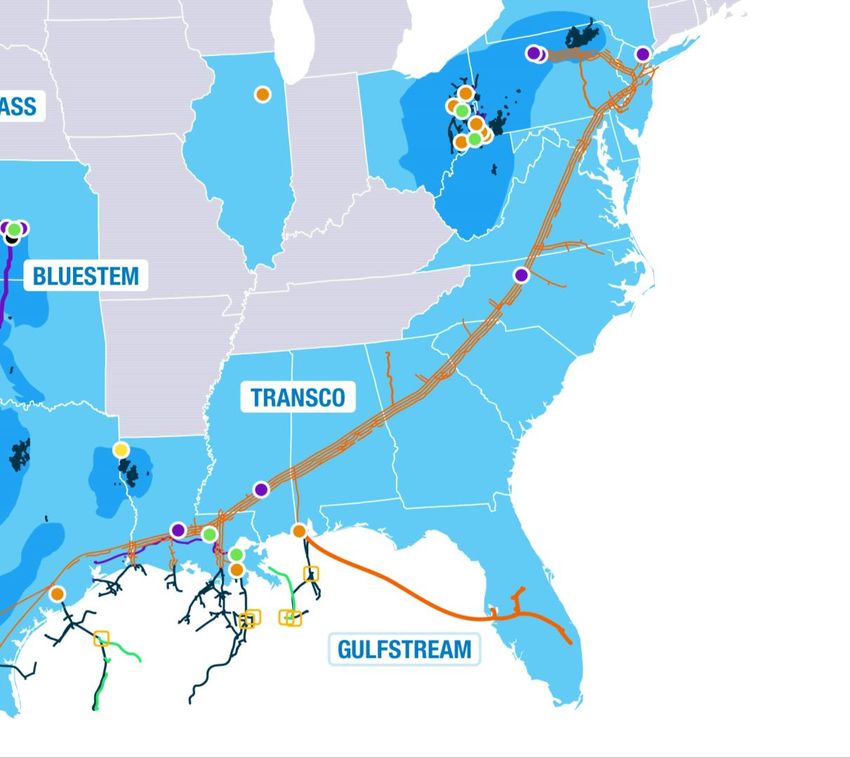
gas transmission growth projects
Williams’ U.S. Asset Map, Highlighting Natural Gas
Transmission Pipeline Expansion Projects
Leidy South
WILLIAMS’ GAS TRANSMISSION
582 MMcf/d PIPELINE PROJECTS IN EXECUTION
Regional
Energy Access
2.1 ~6x ~$1.5B
829 MMcf/d
Mid-Atlantic Bcf/d EBITDA Capital
Expansion
~100 MMcf/d Capacity Multiples Investment
Southside Reliability
Enhancement
Up to 508 MMcf/d
Enough incremental
natural gas to serve
Gulfstream Ph. VI
78 MMcf/d 10.4 MILLION
American homes
annually
WILLIAMS © 2021 The Williams Companies, Inc. All rights reserved. NYSE: WMB I Barclays CEO Energy-Power Conference I September 08, 2021 I www.williams.com 11Unique Deepwater opportunities available
due to incumbent position
Recent Deepwater Project Milestones
Western Gulf Eastern Gulf Discovery
Whale Ballymore Taggart Signed Definitive
Agreements:
Positive FID 2Q 2021 Under existing Positive FID June
dedication 2020 • Spruance first flow
Signed Definitive Agreement target in 1Q 2022
In facility- Signed Definitive
Under existing dedication planning Agreement • Anchor first flow target
discussions in 2Q 2024
Project execution underway • Target first flow • Shenandoah target
• Target first flow in 2024 • Target customer in 3Q 2022 customer FID 3Q 2021;
FID 1Q 2022
first flow 4Q 2024
• Target first flow in
4Q 2024
Sources: Customer press releases, media outlets and Williams estimates
WILLIAMS © 2021 The Williams Companies, Inc. All rights reserved. NYSE: WMB I Barclays CEO Energy-Power Conference I September 08, 2021 I www.williams.com 12Natural gas demand drives our strategy NYSE: WMB | www.williams.com
Natural gas demand resilient in 2020
                                            Total demand averaged 93.8 Bcf/d in 2020 compared to 94.2 Bcf/d in 2019,
                                                  Slight decline primarily driven by milder winter weather in 2020

              POWER GEN                                                                                                                                               LNG & MEXICAN
                                                                     INDUSTRIAL                                      RES / COM
                                                                                                                                                                      EXPORTS
Bcf/d                                                   Bcf/d                                          Bcf/d                                                Bcf/d
 35                                                        35                                            35                                                    35
                                 +3.0%
 30                                                        30                                            30                                                    30

                                                           25                                            25                            -9.6%
 25                                                                                                                                                            25
                                                                                    -2.2%

 20                                                        20                                            20                                                    20

 15                                                        15                                            15            2,235                                   15
                                                                                                                       HDD                                                              +17.5%
                                                                                                                      Jan-Mar
 10                                                        10                                            10                           -14%                     10
                                                                                                                                        1,925
   5                                                        5                                             5                             HDD                     5
                                                                                                                                       Jan-Mar

   0                                                        0                                             0                                                     0
               2019              2020                                  2019        2020                               2019             2020                                 2019        2020

                                      LOWER-48 NATURAL GAS DEMAND + EXPORTS 2019 v. 2020 COMPARISON
    Source: S&P Global Platts, ©2020 by S&P Global Inc.; Note: Pipeloss/Fuel demand is excluded from the charts. Note that HDD is U.S. population-weighted Heating Degree Days.

 WILLIAMS © 2021 The Williams Companies, Inc. All rights reserved.                                            NYSE: WMB I Barclays CEO Energy-Power Conference I September 08, 2021 I   www.williams.com   14
Lower-48 natural gas demand grows by 18 Bcf/d
through 2030; Largely attributable to export growth
Lower-48 Natural Gas Cumulative Demand Growth By Sector EXPECTED GROWTH ‘20-‘30
40
(‘20–‘30)
LNG Exports, +12.1 Bcf/d
35
Total Demand
Forecast
30
1.7% Mexican Exports, +1.9 Bcf/d
25 CAGR ‘20 – ‘30
Transport/Other, +2.5 Bcf/d
Bcf/d
20
15
Residential/Commercial, +2.1 Bcf/d
10
5 Power, -4.3 Bcf/d
0 77
Bcf/d
Industrial +3.5 Bcf/d
-5
2015 2017 2019 2021 2023 2025 2027 2029
Source: Wood Mackenzie 1H ’21
WILLIAMS © 2021 The Williams Companies, Inc. All rights reserved. NYSE: WMB I Barclays CEO Energy-Power Conference I September 08, 2021 I www.williams.com 15N.A. LNG export projects expected to drive an additional
14 Bcf/d of natural gas demand growth through 2030
Sabine Pass Cove Point Corpus Christi
Williams’ Asset Map + Third-party Liquefaction Plants
Cameron Elba Island Freeport
Calcasieu Pass Golden Pass Plaquemines
LNG Canada Woodfibre LNG 2nd wave Gulf Coast
Forecasted Monthly LNG
Export Volumes
20,000
In MMcf/d
Forecast
LNG export
volumes to grow by
2nd Wave 15,000
MMcf/d
+12 Bcf/d
along
Transco states 10,000
through 2030
5,000
0
Source: Wood Mackenzie 1H ’21
WILLIAMS © 2021 The Williams Companies, Inc. All rights reserved. NYSE: WMB I Barclays CEO Energy-Power Conference I September 08, 2021 I www.williams.com 16Production growth across Williams
assets outpaces market rate
LOWER-48 + GOM NATURAL WILLIAMS NATURAL GAS
GAS WELLHEAD PRODUCTION GATHERING VOLUMES
Bcf/d Bcf/d
110 16
-0.4%
100 +5.9%
14
90
12
80
10
70
60 8
1H ‘20 1H ‘21 1H ‘20 1H ‘21
STRATEGICALLY POSITIONED: CONNECTING BEST SUPPLIES TO BEST MARKETS
Source: ©2021 IHS Markit. All rights reserved. The use of this content was authorized in advance. Any further use or redistribution of this content is strictly prohibited without prior written permission by IHS Markit.
Note: Williams gathering volumes include 100% of operated assets
WILLIAMS © 2021 The Williams Companies, Inc. All rights reserved. NYSE: WMB I Barclays CEO Energy-Power Conference I September 08, 2021 I www.williams.com 17Northeast remains largest and most
economic gas basin
Remaining Risked Natural Gas Reserves Held By Major U.S. Producers ~90%
By Henry Hub Natural Gas Breakeven Prices1 remaining gas
Tcfe reserves
350 under $3.25
are in Northeast
300 & Haynesville
250
~80%
200 of Williams’ operated
gathering volumes
150 from Northeast
(Marcellus and Utica) &
Haynesville as of 2Q ‘21
100
50
0
< $2.50 < $2.75 < $3.00 < $3.25
Marcellus Utica Haynesville Mid-Continent Rockies Remaining Gulf Coast Other
Note: Other = West Coast, gas-directed Permian, and non-Marcellus/Utica Northeast. Source: Wood Mackenzie 3Q ‘21 NACPAT; Note that Wood Mackenzie NACPAT data only includes information
for major producers, making up ~55% of total U.S. natural gas production in ‘20. 1Type well Henry Hub natural gas breakeven price ($/mcf) at 10% discount rate.
WILLIAMS © 2021 The Williams Companies, Inc. All rights reserved. NYSE: WMB I Barclays CEO Energy-Power Conference I September 08, 2021 I www.williams.com 18Committed to sustainable operations NYSE: WMB | www.williams.com
Strong performance across several key
                                               ESG ratings and rankings

                             Williams’ ESG Risk Rating places it in the                                                                            Ranked in the top 7% of industry peer
                              top 4% of the Refiners and Pipelines                                                                                  group and included in Dow Jones
                               industry assessed by Sustainalytics                                                                                 Sustainability Index North America
                                                    As of June 1, 2021                                                                                             As of November 13, 2020

                              Recognized with a ‘B’ score for its
                                                                                                                                                        As of 2021, Williams received
                              commitment to transparency and
                                                                                                                                                         an MSCI ESG Rating of BBB,
                          governance around climate change, ranking
                                                                                                                                                            illustrating its ongoing
                          above the sector average of ‘C’ and North
                                                                                                                                                        emphasis on ESG developments
                              America regional average of ‘D’
                                                                                                                                                                          As of May 2021
                                               As of December 15, 2020
The use by Williams of any MSCI ESG Research LLC or its affiliates (“MSCI”) data, and the use of MSCI logos, trademarks, service marks or index names herein, do not constitute a sponsorship, endorsement, recommendation, or promotion of
Williams by MSCI. MSCI services and data are the property of MSCI or its information providers and are provided ‘as-is’ and without warranty. MSCI names and logos are trademarks or service marks of MSCI.

WILLIAMS © 2021 The Williams Companies, Inc. All rights reserved.                                                           NYSE: WMB I Barclays CEO Energy-Power Conference I September 08, 2021 I                   www.williams.com        20
Closing remarks NYSE: WMB | www.williams.com
Williams is a unique investment opportunity

                                                                                                                                                       FOCUS ON LONG-TERM
                        PREDICTABILITY
           22 consecutive quarters meeting or beating                                                                                                  SHAREHOLDER VALUE
                 consensus EBITDA estimates1
                       DURABLE CASH FLOWS
                                                                                                                                                                                OPPORTUNISTIC BUYBACK
                    98% fee-based earnings; Minimal
                                                                                                                                                                                 PROGRAM ANNOUNCED
                      commodity price exposure
                                                                                                                                                                               Board approved up to $1.5B of
                                    GROWTH                                                                                                                                           share repurchases
                              8 consecutive years of
                                                                                                                  SUSTAINABLE                                                ATTRACTIVE DIVIDEND
                               Adj. EBITDA growth
                                                                                                                  VALUE                                             4-yr annual dividend CAGR of 8% (‘17-’21G);
                      FINANCIAL FLEXIBILITY                                                                                                                                      7% dividend yield2
                Free cash flow generation in 2020 and                                                            CREATION
                                2021G                                                                                                                                           SUSTAINABILITY
                                                                                                                                                                                 1st
                                                                                                                                                                             N.A. midstream company to set
             INVESTMENT GRADE CREDIT RATINGS                                                                                                                     aggressive climate targets; Meaningful progress
             S&P: BBB (Stable), Moody’s: Baa2 (Stable),                                                                                                             in emissions reductions already achieved
                        Fitch: BBB (Stable)
                                                                                                                                                                          GROWTH AND RETURNS
                                                                                                                                                                   25+ natural gas transmission expansion
                                                                                                                                                              opportunities through 2030 with attractive returns
                      FINANCIAL STRENGTH                                                                                                                                           VIABLE STRATEGY
                      & STABILITY                                                                                                                                          Natural gas strategy committed to a
                                                                                                                                                                                   clean energy future
Notes: This slide contains non-GAAP financial measures. A reconciliation of all non-GAAP financial measures used in this presentation to their nearest GAAP comparable financial measures are included at the back of this presentation. 1 Williams’ adjusted
EBITDA exceeded or was within 2% of the consensus estimate for EBITDA in each quarter 1Q 2016–2Q 2021. 2 2021G annual dividend of $1.64 per share divided by WMB closing stock price as of 9-3-21.

      WILLIAMS © 2021 The Williams Companies, Inc. All rights reserved.                                                             NYSE: WMB I Barclays CEO Energy-Power Conference I September 08, 2021 I                      www.williams.com               22
NYSE: WMB | www.williams.com Appendix
Who we are

NYSE: WMB | www.williams.com
A leader in energy infrastructure with a
                                           long-term sustainable strategy

OUR MISSION
Committed to being the leader in providing
infrastructure that safely delivers natural gas
                                                                                                      Authentic                     Safety Driven
products to reliably fuel the clean energy economy

WHO WE ARE
Safely and responsibly handle ~30% of the natural
gas in the United States that is used every day to                                                    Reliable                       Responsible
heat our homes, cook our food and generate our                                                       Performers                       Stewards
electricity

WILLIAMS © 2021 The Williams Companies, Inc. All rights reserved.   NYSE: WMB I Barclays CEO Energy-Power Conference I September 08, 2021 I   www.williams.com   25
Gas transmission business built on high credit-quality,
demand-pull customer base
Firm Contracted Capacity By Credit Rating Profile Of Williams 2020 Gas
Customer Type1 Transmission Revenue From Top 100 Customers2
4%
1%
12% 13%
Utilities/Power Investment
Grade
66%
8% LNG / Industrial
High Yield
86%
Producer
9% Utilities / Power
Customers Marketer Not Rated
Investment
Other Grade
Customers
1 Includes firm reserved capacity of Transco, Northwest Pipeline, and Gulfstream at 100%
2 Transco, Northwest Pipeline and 50% of Gulfstream revenue earned from Top 100 customers company-wide.
WILLIAMS © 2021 The Williams Companies, Inc. All rights reserved. NYSE: WMB I Barclays CEO Energy-Power Conference I September 08, 2021 I www.williams.com 26Northeast G&P: Large, established footprint
in nation’s largest gas supply basin
Ohio River Supply Hub (ORSH) Susquehanna River
OVM JV Natural Gas Gathering Supply Hub (SRSH)
OVM JV
Ohio Valley Midstream & Utica East Ohio SUSQUEHANNA SUPPLY
Midstream: LMM & Marcellus South
> Operated joint venture
HUB
Cardinal & Flint
> 1.3 Bcf/d of gathering capacity; liquids-rich Susquehanna Supply Hub > 462 miles of pipeline
> 1.9 Bcf/d of processing capacity Bradford Supply Hub > 4.3 Bcf/d of gathering capacity;
> 258,000 bpd fractionation and de-ethanization Blue Racer Midstream dry gas
capacity
Gas Plant BRADFORD
LMM & Marcellus South Fractionator SUPPLY HUB2
Laurel Mountain Midstream:
> Operated joint venture > 733 miles of pipeline
> 1,145 miles of pipeline; 0.9 Bcf/d gathering > 4.0 Bcf/d of gathering capacity;
capacity; dry gas dry gas
Marcellus South:
> Operated joint venture BLUE RACER
> 325 miles of pipeline; 1.0 Bcf/d gathering
capacity; liquids-rich
MIDSTREAM3
UTICA1 > Non-operated joint venture
> 723 miles of gathering pipeline in
Cardinal:
dry/rich gas
> Operated joint venture
> 1.2 Bcf/d of processing capacity
> 378 miles of pipeline; 0.8 Bcf/d gathering
> 134,000 bpd fractionation
capacity; liquids-rich
capacity
Flint:
> 260 miles of NGL and condensate
> 95 miles of pipeline; 0.5 Bcf/d gathering
transport
capacity; dry gas
Note: Figures represent 100% capacity for operated and non-operated assets, including those of which Williams has proportional ownership. All data as of December 31, 2020 in addition to an Oak Grove TXP III processing plant
expansion in March 2021, adding 200 MMcf/d of capacity. Data excludes Aux Sable and Pennant Midstream information.
1Gathering and processing statistics for Utica Supply Hub do not include Blue Racer 2Primarily cost-of-service based contracts 3Non-operated joint venture
WILLIAMS © 2021 The Williams Companies, Inc. All rights reserved. NYSE: WMB I Barclays CEO Energy-Power Conference I September 08, 2021 I www.williams.com 27Northeast G&P systems have delivered substantial growth
and poised for continued free cash flow generation
Northeast G&P Gathering Volumes (2012 - 2Q 2021 YTD)
10
9
Volume growth
8
7 280%
since ‘12
6
Bcf/d
5
4 > Large-scale position
3 in leading basin
drives volume
2
growth
1
> 2021 volumes on
0
pace to meet high
2012 2013 2014 2015 2016 2017 2018 2019 2020 2Q YTD
end of expectations
Dry Gas Wet Gas 2021
Note: Volumes exclude non-operated equity method investments and include 100% of volumes from operated assets
WILLIAMS © 2021 The Williams Companies, Inc. All rights reserved. NYSE: WMB I Barclays CEO Energy-Power Conference I September 08, 2021 I www.williams.com 28Williams positioned to benefit as market calls
on most economic gas supplies
Northeast G&P Adjusted EBITDA per Mcf 2
Northeast contains ~80% of $0.52 $0.52
economic gas-directed reserves1 $0.48
Increasing Adj. EBITDA per MCF
$0.41
driven by scale, efficiency, $0.40
$0.39
and business mix
2016 2017 2018 2019 2020 2021
2QYTD
Note: This slide contains non-GAAP financial measures. A reconciliation of all non-GAAP financial measures used in this presentation to their nearest GAAP comparable financial measures are included at the back of this presentation.
1Wood Mackenzie 3Q ‘21 NACPAT; Refers to gas-directed reserves under $3.25/Mcf. Note that Wood Mackenzie NACPAT data only includes information for major producers, making up ~55% of total U.S. natural gas production in ‘20.
2Includes 100% of consolidated asset volumes and proportional volumes of operated equity-method investments; Excludes non-operated JV Adjusted EBITDA and gathered volumes
WILLIAMS © 2021 The Williams Companies, Inc. All rights reserved. NYSE: WMB I Barclays CEO Energy-Power Conference I September 08, 2021 I www.williams.com 29West business segment: Diverse portfolio of assets
poised for continued free cash flow generation
Broad and Diverse Portfolio
• Stable G&P business supported by broad portfolio of supply
areas, customers and contracts
• Irreplaceable system with over 9,500 miles of gas gathering pipeline1
• Averaging ~3.6 Bcf/d of gas gathering volumes since 2016
Free Cash Flow Generation
• Portfolio generating steady and stable cash flow each quarter
• West Segment Adj. EBITDA less total Capex2 ~$670MM in 2020
Driving Growth in Core Supply Areas
• Upstream JVs in Wamsutter and Haynesville designed to drive
volume growth to midstream and downstream assets
1Includes 100% of both consolidated and equity-method investments per Williams 2020 10K. 2West Segment capital expenditures and purchases of and contributions to equity-method investment.
WILLIAMS © 2021 The Williams Companies, Inc. All rights reserved. NYSE: WMB I Barclays CEO Energy-Power Conference I September 08, 2021 I www.williams.com 30Recent accomplishments
Record Performance Achieved record quarterly natural gas gathering volumes of 13.79 Bcf/d in 2Q ‘21
Published 2020 Sustainability Report and responded to the CDP Climate Change Questionnaire
ESG Reporting to provide key stakeholders with continued insight into Williams sustainable practices and ESG
performance
Strategic Partnerships – Announced upstream joint ventures with Crowheart in Wamsutter and GeoSouthern in
Haynesville which enhance the value of Williams’ midstream and downstream infrastructure;
Crowheart and GeoSouthern Effective 3Q 2021
Strategic Acquisition – Completed acquisition of Sequent on July 1st increasing Williams’ natural gas pipeline and
Sequent Energy Management storage optimization opportunities as well as marketing footprint to 8 Bcf/d from 1 Bcf/d
Transco – Filed FERC Application in March 2021 for an 829 MMcf/d1 pipeline expansion to connect
Marcellus natural gas supplies with Northeast demand in time for the 2023-2024 winter
Regional Energy Access heating season
Transco – Construction underway on 582 MMcf/d1 expansion connecting Appalachia natural gas supplies
with Atlantic Seaboard demand; Brought 125 MMcf/d1 of capacity on line in November 2020
Leidy South with the remaining 457 MMcf/d1 expected to be complete in 4Q 2021
Deepwater – Reached agreement in June 2021 with producer customers Beacon and ShenHai to provide
services from the Shenandoah offshore development to Williams’ Discovery infrastructure in
Shenandoah Development the central Gulf of Mexico; Expected to come on line as early as late 2024
Deepwater – Signed definitive agreements in July 2021 once producer customer Shell reached FID for an
expansion project to provide services from the Whale offshore development to Williams’
Whale Expansion Project Perdido infrastructure in the Western Gulf of Mexico; Expected to come on line in 2024
Completed seventh RNG connection to Williams’ assets in July; Now serving three dairy farms
New Energy Ventures – and four landfills producing RNG. Solar projects progressing as planned with 16 unique
RNG & Solar Projects projects on track to be placed in-service within Williams’ footprint by end of 2023, totaling
$285 million capital spend.
Awarded ~$1 million grant from the Wyoming Energy Authority to continue the feasibility
New Energy Ventures – study and development of a green hydrogen hub near Williams’ operations in Wyoming.
Purpose of the study will be to identify water impacts associated with green hydrogen
Wyoming Hydrogen Hub production within the region, as well as studying the impacts of hydrogen blending on existing
natural gas infrastructure
1 Dekatherms converted to cubic feet at 1,000 cubic feet = 1 dekatherm .
WILLIAMS © 2021 The Williams Companies, Inc. All rights reserved. NYSE: WMB I Barclays CEO Energy-Power Conference I September 08, 2021 I www.williams.com 31Williams is a unique investment opportunity NYSE: WMB | www.williams.com
Free cash flow generation enhances
                                                              financial flexibility
                                                       2020                                                                                     2021 Guidance
                                                                                                                                                                         Free Cash Flow1
                                                                 Free Cash      Flow1
                                                                       $0.212 B                                                                                               $0.250 B

                                                                       Total                                                                                                Total
                                                                      Capital                                                                                              Capital
                                Available                          Expenditures2                                                        Available                       Expenditures2
                               Funds From                              $1.485 B                                                        Funds From                            $1.55 B
                               Operations                                                                                              Operations
                                 $3.638 B                                                                                                   $3.8 B                           Dividends
                                                                       Dividends
                                                                                                                                                                               $2.0 B
                                                                       $1.941 B

1FreeCash Flow is Available Funds From Operations less common dividends paid less Capital Investments. 2 Includes increases to property, plant and equipment; purchases of businesses net of cash acquired; and purchases of
and contributions to equity-method investments. Note: This slide contains non-GAAP financial measures. A reconciliation of all non-GAAP financial measures used in this presentation to their nearest comparable GAAP financial
measures is included at the back of this presentation.

        WILLIAMS © 2021 The Williams Companies, Inc. All rights reserved.                                           NYSE: WMB I Barclays CEO Energy-Power Conference I September 08, 2021 I           www.williams.com            33
Stable and diversified Adj. EBITDA,
limiting exposure to any one basin
$5.1 B 2020 ADJ. EBITDA
Other Onshore Oil Basin1Substantially fee-based business with limited volatility
2020 Actuals - Gross Margin1
2%
98% Gross Margin from Fee-based Revenue
Gas & Liquids Transportation
Deepwater Gas Services
29% Minimum Volume Commitments (MVCs) & other protected2
44%
Cost of Service agreements
Volume-driven G&P
NGL & Other Commodity Exposure
10%
11% 4%
1Includes our proportional ownership of the gross margin of our equity-method investments. Excludes certain regulated revenues, which are related to tracked operating costs.
2MVC revenue includes revenue level guaranteed by MVC and excludes any revenue on volumes exceeding MVC. MVC revenue also includes amortization of upfront payments associated with canceled MVCs.
WILLIAMS © 2021 The Williams Companies, Inc. All rights reserved. NYSE: WMB I Barclays CEO Energy-Power Conference I September 08, 2021 I www.williams.com 35Scale and operational excellence
increase operating margin
Operating Margin Ratio
Creating efficiency & 71% 71%
advantage with focused scale
67%
64%
Driving more revenue to 62%
the bottom line 60%
Continuing to drive
improvement
2016 2017 2018 2019 2020 2021
1
2Q YTD
Operating margin ratio = Operating margin/gross margin; Excludes depreciation and amortization expense, impairment charges and other items included in Other Income/(Expense), which are primarily non-cash.
1Excludes upstream operations
WILLIAMS © 2021 The Williams Companies, Inc. All rights reserved. NYSE: WMB I Barclays CEO Energy-Power Conference I September 08, 2021 I www.williams.com 36Business performance tied to contracted
transmission capacity and gathering volume
Williams Quarterly Adj. EBITDA vs. Contracted Transmission Capacity and Gathering Volumes
Four Corners
Jackalope Sale
Sale
Apr. ‘19
$1,600 Oct. ‘18 40
Canada Sale Geismar Sale
Sept. ‘16 Jul. ‘17
$1,400 35
Adj. EBITDA ($MM)
$1,200 30
$1,000 25
Bcf/d
$800 20
$600 15
$400 10
$200 5
$0 0
2015 2016 2017 2018 2019 2020 2021
Commodity Margin2 Other Adj. EBITDA Contracted Transmission Capacity
Fee-based Adj. EBITDA1
and Gathering Volume3
Note: This slide contains non-GAAP financial measures. A reconciliation of all non-GAAP financial measures used in this presentation to their nearest GAAP comparable financial measures are included at the back of this presentation.
1Sum of West, Northeast G&P and Transmission and Gulf of Mexico segment Adjusted EBITDA excluding commodity margin 2Commodity Margin of West, Northeast G&P, and Transmission and Gulf of Mexico segments
3Sum of gathering volumes and average daily firm reserved capacity for regulated transportation (converted from Tbtu to Bcf at 1,000 btu/cf) for West, Northeast G&P, and Transmission and Gulf of Mexico segments
WILLIAMS © 2021 The Williams Companies, Inc. All rights reserved. NYSE: WMB I Barclays CEO Energy-Power Conference I September 08, 2021 I www.williams.com 37Exceptional 2020 performance in the
face of significant headwinds
2020 PERFORMANCE 2020 OBSTACLES CLEARED
Record Adj. EBITDA, $5.1B COVID-19 global pandemic
Record DCF, $3.4B
Record gathering volumes, 13.2 Bcf/d1 Oil price collapse
Record transmission contracted capacity, 23 Bcf/d2
Debt-to-Adj. EBITDA reduced to 4.35x Depressed NGL prices
Free Cash Flow, $212 million3
Active hurricane season in Gulf of Mexico
Improved Operating Margin for 6th consecutive year
Key ESG ratings and rankings improved
Major customer bankruptcies
Improved credit ratings
Continued strength in project execution
Exceeded Pre-COVID-19 Guidance Midpoints On All Key Metrics In 2020
Note: This slide contains non-GAAP financial measures. A reconciliation of all non-GAAP financial measures used in this presentation to their nearest comparable GAAP financial measures is included at the back of this presentation. 1Williams 2020
natural gas gathering volumes exclude Blue Racer Midstream. 2 Revised to include daily maximum peak capacity on Northwest Pipeline. Dekatherms converted to cubic feet at 1,000 cubic feet = 1 dekatherm. 3Free Cash Flow is Available Funds
From Operations less common dividends paid less Capital Investments
WILLIAMS © 2021 The Williams Companies, Inc. All rights reserved. NYSE: WMB I Barclays CEO Energy-Power Conference I September 08, 2021 I www.williams.com 38Consistently delivering on our promises
2020 RESULTS EXCEED GUIDANCE MIDPOINTS
In $Billions except for percentages,
ratios and per share amounts 2020 GUIDANCE RANGES vs. RESULTS
Adjusted
Diluted EPS1 $1.20
$0.95 $1.08 $1.10
Adjusted
Net Income1 $1.160 $1.310 $1.333 $1.460
Adjusted EBITDA $4.950 $5.100 $5.105 $5.250
Distributable Cash Flow (DCF) $3.050 $3.250 $3.356 $3.450
Guidance Actual
Growth Capex $1.0 - $1.2
Prior guidance:
$1.1 - $1.3 Bn $1.119
Dividend Growth Rate Guidance Actual
5% annual growth 5%
Dividend Coverage Ratio Guidance Midpoint Actual
(DCF Basis) ~1.7x 1.73x
Consolidated Debt / EBITDA2 Guidance Actual
4.4x 4.35x
1From continuing operations attributable to Williams available to common stockholders
2Book Debt-to-Adjusted EBITDA ratio does not represent leverage ratios measured for WMB credit agreement compliance or leverage ratios as calculated by the major credit ratings agencies. Consolidated debt is net of cash on hand.
Note: This slide contains non-GAAP financial measures. A reconciliation of all non-GAAP financial measures used in this presentation to their nearest GAAP comparable financial measures are included at the back of this presentation.
WILLIAMS © 2021 The Williams Companies, Inc. All rights reserved. NYSE: WMB I Barclays CEO Energy-Power Conference I September 08, 2021 I www.williams.com 39Williams in a position of growth NYSE: WMB | www.williams.com
Pursuing deep and diverse set of transmission
                                       growth opportunities
                                                                        PROJECTS IN DEVELOPMENT
  Williams’ Asset Map, Highlighting Northwest,
  Transco, & Gulfstream Natural Gas Pipelines                                        Type of                             # of            Capex        Capacity Estimated
                                                                                     Project                           Projects          ($Bn)         (Bcf/d)    ISDs

                                                                                     Transporting Natural
                                                                                     Gas to Power                           9             $4               3          ‘24-’30
Northwest                                                                            Generation Facilities
Pipeline

                                                             Transco                 Transporting Natural
                                                             Pipeline                Gas to LNG Export                      9             $4               6          ‘24-’26
                                                                                     Facilities
                                                                        Gulfstream
                                                                        Pipeline
                                                                                     Transporting Natural
                                                                                     Gas to Industrial                    12              $3               3          ‘23-’31
                                                                                     Facilities/LDC
   Note: Updated as of August 2021

   WILLIAMS © 2021 The Williams Companies, Inc. All rights reserved.                    NYSE: WMB I Barclays CEO Energy-Power Conference I September 08, 2021 I   www.williams.com   41
Deepwater Gulf of Mexico projects in execution
WHALE BALLYMORE SHENANDOAH
> Increased utilization of existing > Increased utilization of existing > Increased utilization of existing
Asset
pipelines; Downstream gas pipelines; Downstream gas pipelines; Downstream gas
Synergies processing and NGL Fractionation
processing processing and NGL Fractionation
High-quality > Shell (60%, operator); > Chevron (60%, operator); > Beacon (31%, operator); Navitas
Customers Chevron (40%) Total (40%) ShenHai (49%); HEQ (20%)
Risk > Use existing capacity; Fixed rate of > Use existing capacity; Fixed rate of > Use existing capacity; Fixed payments
Mitigation return on new capital investment return on new capital investment on new capital investment
> Combined reserves: ~525 Mmboe > Combined reserves: ~300 MMboe > 380 Bcf (100-104 MMcf/d)
Large-scale > Oil: 360 MMbbls (100–140 Mbpd) > Oil: 75 Mbpd
Reserves > Gas: 985 Bcf (200–240 MMcf/d) > Gas: 40 MMcf/d
> Reached FID: 2Q 2021; First flow > Target FID: 1Q 2022; First flow in > Reached FID: 3Q 2021; First flow
Timeline in 4Q 2024
in 2024 4Q 2024
Location > Western Gulf of Mexico > Eastern Gulf of Mexico > Central Gulf of Mexico
WILLIAMS © 2021 The Williams Companies, Inc. All rights reserved. NYSE: WMB I Barclays CEO Energy-Power Conference I September 08, 2021 I www.williams.com 42Deepwater Gulf of Mexico projects in execution continued
TAGGART ANCHOR
> Increased utilization of capacity - > Increased utilization of existing
Asset
production handling, oil/gas pipelines; Downstream gas
Synergies
gathering, gas processing processing and NGL Fractionation
High-quality > LLOG (100%, operator) > Chevron (63%, operator);
Customers Total (37%)
Risk > Use existing capacity, zero capital > Use existing capacity; Producer to
Mitigation investment build tie-back and incur capital
> Combined reserves: ~32 MMboe
Large-scale > Gas: 75 Bcf (25 MMcf/d)
> Oil: 12 Mbpd
Reserves
> Gas: 26 MMcf/d
> Reached FID: 2Q 2020; First flow > Reached FID: 4Q 2019; First flow
Timeline
3Q 2022 2Q 2024
Location > Eastern Gulf of Mexico > Central Gulf of Mexico
WILLIAMS © 2021 The Williams Companies, Inc. All rights reserved. NYSE: WMB I Barclays CEO Energy-Power Conference I September 08, 2021 I www.williams.com 43Finalized upstream JV with GeoSouthern in Haynesville
Enhancing Value of Haynesville Midstream Infrastructure through Strategic Upstream JV
FINALIZED JV PARTNER IN HAYNESVILLE Caddo Williams Natural Gas
Gathering System
• GeoSouthern to purchase 50% of existing South Mansfield PDP and Williams Acreage
GeoSouthern Acreage
commits to long-term development plan
Bossier
• Proven in-basin operator committed to optimizing and developing
South Mansfield acreage Bienville
UNLOCKS SIGNIFICANT MIDSTREAM VALUE
LOUISIANA
• Williams continues to gather and treat all South Mansfield production
TEXAS
• GeoSouthern’s right to earn additional interests is contingent on De Soto
Red River
development over time and satisfaction of $50 million drilling carry
• Williams to market all production through fixed fee arrangements
FUTURE DEVELOPMENT OPPORTUNITIES Natchitoches
• Williams controls volumes for downstream opportunities Shelby
Sabine
• Assets in close proximity to Transco pipeline LA
• Opportunity to source and deliver responsibly produced natural gas EXPERIENCED IN-BASIN PRODUCER
TO DRIVE VALUE TO WILLIAMS
in partnership with GeoSouthern MIDSTREAM ASSETS
Transco
Enlarged
Map Area
WILLIAMS © 2021 The Williams Companies, Inc. All rights reserved. NYSE: WMB I Barclays CEO Energy-Power Conference I September 08, 2021 I www.williams.com 44Finalized upstream JV with Crowheart in Wamsutter
Enhancing Value of Midstream & Downstream Infrastructure through Strategic Upstream JV
Northwest
Pipeline
1.2 MM OF CONTIGUOUS ACREAGE
IN WAMSUTTER TO BRING ENHANCED WY
VALUE TO WILLIAMS ASSETS OPPL
o Consolidates over 1.2 million contiguous net acres and 3,500 wells
Sweetwater SIMPLIFIED o Crowheart to operate upstream assets; Williams continues to own
Enlarged
OPERATING and operate midstream assets
Map Area STRUCTURE o Eliminates price sensitive contracts by consolidating numerous
G&P contracts into simple, fixed fee structure
OPPL
STRATEGIC o Crowheart initially owns a 25% interest; can increase interest in
new development through performance
Echo Springs CONTRACT
o Williams retains significant governance and various rights,
FRAMEWORK including undeveloped acreage and surface rights
Carbon o Promotes drilling activity and increased gathering volumes
NGL volumes dedicated to Williams, increasing OPPL, Bluestem
Williams Echo Springs ENHANCED o
and downstream fractionation utilization
ASSET VALUE
Processing Plant
Williams Natural Gas
Gathering System o Opportunity to source and deliver responsibly produced gas and
Overland Pass (OPPL)
NGL Pipeline
expand renewable development
Williams Acreage WYOMING
Crowheart Acreage COLORADO
WILLIAMS © 2021 The Williams Companies, Inc. All rights reserved. NYSE: WMB I Barclays CEO Energy-Power Conference I September 08, 2021 I www.williams.com 45Sequent Energy Management acquisition
Enhanced Optimization of Natural Gas Portfolio and Expansion into New Customers and Services
Closed transaction in July to purchase Sequent for total consideration of $134 million, which
includes $84 million working capital acquired, subject to post-closing adjustment
Increases Williams’ natural gas pipeline marketing footprint to over 8 Bcf/d
Enhances Williams’ natural gas pipeline and storage optimization opportunities
Significant opportunity to better source and deliver responsibly produced natural gas
Enables expansion into new gas-fired power generation, LNG export and RNG customers
Complements current geographic footprint of core pipeline transportation and storage business
Welcomes a talented workforce and industry leading platform complementary to Williams’ culture
WILLIAMS © 2021 The Williams Companies, Inc. All rights reserved. NYSE: WMB I Barclays CEO Energy-Power Conference I September 08, 2021 I www.williams.com 462021 Guidance Ranges
FINANCIAL METRIC 2021 GUIDANCE Initial Guidance, Feb. ‘21
Adjusted Net Income1 $1.325 Bn - $1.525 Bn $1.200 Bn - $1.500 Bn
Adjusted Diluted EPS1 $1.09 - $1.25 $0.99 - $1.23
Adjusted EBITDA $5.2 Bn - $5.4 Bn $5.050 Bn - $5.350 Bn
Available Funds from Operations (AFFO) $3.7 Bn - $3.9 Bn $3.550 Bn - $3.850 Bn
AFFO per share $3.04 - $3.20 $2.92 - $3.16
Dividend Coverage Ratio (Based on AFFO) 1.9x (midpoint) 1.85x (midpoint)
Debt-to-Adjusted EBITDA2Growing natural gas demand drives our competitive strategy NYSE: WMB | www.williams.com
Natural gas fulfilling 34% of global
                                            energy demand growth through 2040
                                                                     Total Global Energy Consumption By Fuel ‘15-’40
         300
                                                                                                                                                                       Global Energy
                        +39 QBtu
                         Or 19%                                                                                                                                       Demand (QBtu)
         250
                                                                                                                                                                                           799
                                                   +59 QBtu                                                                                                             621
         200                                        Or 46%
                                                                              -31 QBtu
 QBtu

                                                                              Or -19%
         150

                                                                                                      +91 QBtu                                                         2015               2040
         100                                                                                          Or 506%

                                                                                                                                +10 QBtu                 +6 QBtu
                                                                                                                                 Or 25%                  Or 15%                  +4 QBtu
           50
                                                                                                                                                                                 Or 15%

             0
                       Crude Oil                   Natural Gas                   Coal                Solar & Wind                  Hydro                 Biomass                 Nuclear

                                                      2015             2020                 2025                2030              2035              2040
Source: S&P Global Platts, ©2021 by S&P Global Inc. Used with permission from Platts. July 2021 Most Likely Case.

 WILLIAMS © 2021 The Williams Companies, Inc. All rights reserved.                                              NYSE: WMB I Barclays CEO Energy-Power Conference I September 08, 2021 I   www.williams.com   49
Renewables remain a small part of the total energy mix
2020 Total Global Energy Electricity only accounts
Consumption by Sector 2020 Global Power
Generation by Fuel Type
for ~20% of total
end-use energy
Transportation
consumption
Natural
24%
Gas,
Coal, 21% Wind,
Non- 38%
8% 5.6%
Energy Solar,
11% Electricity 2.7%
20% AND
Hydro, Nuclear, 10%
Distribution &
17% 1 Wind & Solar only
Own Use Other Renewables , 3% account for
9%
Liquids, 3%
8% of total global
power generation
Industrial Res/Com
18% 18%
1Other Renewables include Geothermal & Tidal
Source: S&P Global Platts, ©2021 by S&P Global Inc. Used with permission from Platts. July 2021 Most Likely Case.
WILLIAMS © 2021 The Williams Companies, Inc. All rights reserved. NYSE: WMB I Barclays CEO Energy-Power Conference I September 08, 2021 I www.williams.com 50Gas transmission pipelines ideally positioned for
U.S. domestic and international demand
Northwest
Pipeline
Cove Point
Legend Transco
3rd Party LNG
Export Terminal
Population per sq. mile
50 or less
50-100 Elba Island
100-200
200-300
Cameron Gulfstream
300 or more
Sabine Pass
Freeport
Source: Data based off 2012 Census estimates
Corpus Christi
WILLIAMS © 2021 The Williams Companies, Inc. All rights reserved. NYSE: WMB I Barclays CEO Energy-Power Conference I September 08, 2021 I www.williams.com 51Transco is the premier transmission provider to
growing LNG market
Transco Natural Gas Volumes Serving
Williams’ asset map, showing
LNG Facilities In Bcf/d
third-party LNG facilities
(Jan. ’17 – Jul. ’21)
2.50
Cameron
Cove Point 2.00 Elba Island
Freeport
1.50 Corpus Christi
Cove Point
1.00
Elba Island 0.50 Sabine Pass
Cameron
Sabine Pass
Freeport
0.00
Corpus
Christi
Source: IHS Markit
WILLIAMS © 2021 The Williams Companies, Inc. All rights reserved. NYSE: WMB I Barclays CEO Energy-Power Conference I September 08, 2021 I www.williams.com 52Natural gas plays critical role in reducing emissions
Total U.S. Energy CO2 Emissions vs. Natural Gas Market Share
6,200 35%
Natural Gas as % of Total Primary Energy
6,000 30%
5,800
25%
Consumption
5,600
MM Tons CO2
CO2 Emissions Decline 20%
5,400
15%
5,200
10%
5,000
4,800 5%
4,600 0%
Source: U.S. Energy Information Administration, December 2020
WILLIAMS © 2021 The Williams Companies, Inc. All rights reserved. NYSE: WMB I Barclays CEO Energy-Power Conference I September 08, 2021 I www.williams.com 53Transco best positioned to support power
generation shift to gas from coal
Williams’ U.S. Asset Map, Highlighting Third-party Operating Coal Plants
77 Equates to
Coal Plants;
75 GW
+11.8
Bcf/d natural
Net Summer
Capacity
gas1
Equates to
Equates to
386 MM 84 MM
cars off the road
mt CO2 reduction annually
Operating coal plant in Transco Pipeline states
Sources: Coal plant data per Velocity Suite; Coal and natural gas plants emissions rates and heat rate assumptions per EIA; Metric tons of CO2 emitted by a typical passenger vehicle per year per EPA
1Using 6,800 Btu/kWh heat rate, 100% plant utilization
WILLIAMS © 2021 The Williams Companies, Inc. All rights reserved. NYSE: WMB I Barclays CEO Energy-Power Conference I September 08, 2021 I www.williams.com 54Market relies heavily on Northeast to
meet growing demand
U.S. Natural Gas Production Totaling ~90 Bcf/d By Region
(Last Twelve-Month Average: Sept ’20 – Aug ‘21)
35
30 ~65% From gas-
25 directed drilling
20
Bcf/d
15
10
5
0
Growth over Last Decline over Last
From Oil-directed Drilling From Gas-directed Drilling Twelve Months Twelve Months
Source: Wood Mackenzie Aug ‘21 Short-term Outlook for Production and Wood Mackenzie 1H 2021 Long-term Outlook for Associated Gas vs. Gas-Directed Percentage Breakouts by Supply Area;
Note: “Other” category includes West Coast, Williston Basin, Northeast vertical, Gulf Coast vertical and San Juan. Last 12-month date range is Sept ‘20 – Aug ‘21.
WILLIAMS © 2021 The Williams Companies, Inc. All rights reserved. NYSE: WMB I Barclays CEO Energy-Power Conference I September 08, 2021 I www.williams.com 55Natural gas forward curve improvement versus 1 year ago
Henry Hub Curve up 50% since Sept ‘20
Sept. ‘21 – Dec. ’22 Curve Avg.
9-3-2020 9-3-2021
% Change
Curve Curve
$5.50 $2.71 $4.08 +50%
$5.00
$4.50
$4.00 Sept. 3, 2021
$/MMBtu
Forward Curve
$3.50
$3.00 Sept. 3, 2020
Forward Curve
$2.50
Actual Price
$2.00
$1.50
Source: NYMEX
WILLIAMS © 2021 The Williams Companies, Inc. All rights reserved. NYSE: WMB I Barclays CEO Energy-Power Conference I September 08, 2021 I www.williams.com 56Committed to sustainable operations NYSE: WMB | www.williams.com
Committed to a clean energy future
                       Williams recognizes the concerns regarding climate change and our strategy provides a
                    practical and immediate path to reduce industry emissions and grow a clean energy economy

                                                                       Right Here, Right Now Opportunities
                                                                    Goal: 56% absolute reduction in company-wide
                                                                           greenhouse gas emissions by 2030
                                                                      Leverage our natural gas-focused strategy and
                                                                       technology that is available today to focus on
                                                                    immediate opportunities to reduce emissions, scale
                                                                      renewables and build a clean energy economy.

                                                                       Future Innovation and Technologies

                                                                          Our path to net zero by 2050 involves a
                                                                         combination of immediate and long-term
                                                                      solutions, including investments in renewables,
                                                                    technology and the best and brightest talent who
                                                                           are committed to doing what is right.

           Note: 56% absolute reduction measured against 2005 emissions

WILLIAMS © 2021 The Williams Companies, Inc. All rights reserved.                              NYSE: WMB I Barclays CEO Energy-Power Conference I September 08, 2021 I   www.williams.com   58
Leading ESG efforts with relentless commitment to
sustainable operations and increased disclosures
Joined ONE Future Joined RNG Coalition
Coalition November 2020 Alan Armstrong
Announced Solar Co-chairs the Energy
June 2019 Project Initiative Infrastructure Council
May 2020 CDP Climate Change
Template
Questionnaire
December 2020
Response
August 2020
Connected 6th RNG
Reinitiated
Interconnection
Disclosures with
2019 Sustainability October 2020
2018 Sustainability
Report Alan Armstrong Report Publishing
June 2019 chairs National July 2020 Added to
Petroleum Council Dow Jones
Study on Evolving Sustainability North
Energy Infrastructure America Index
December 2019 Net Zero Climate November 2020
Commitment
August 2020
2019 – 2020
WILLIAMS © 2021 The Williams Companies, Inc. All rights reserved. NYSE: WMB I Barclays CEO Energy-Power Conference I September 08, 2021 I www.williams.com 59Leading ESG efforts with relentless commitment to
sustainable operations and increased disclosures continued
Signed MoU with
Microsoft for
Clean Energy
Collaboration
Sponsor of 2020 Sustainability
June 2021
Houston Green Report Publishing
Tech Incubator July 2021
February 2021
Connected 7th RNG
Awarded Grant for
Interconnection
Feasibility Study
July 2021
to Evaluate Green
Hydrogen Plant
Joined Clean July 2021
Williams Virtual Energy Hydrogen CDP Climate Change
ESG Event Coalition Questionnaire
January 2021 March 2021 Response
July 2021
2021 YTD
WILLIAMS © 2021 The Williams Companies, Inc. All rights reserved. NYSE: WMB I Barclays CEO Energy-Power Conference I September 08, 2021 I www.williams.com 60Leveraging gas-focused strategy and technology available
today to focus on immediate opportunities to reduce emissions
Williams Goal to 56% Absolute Reduction in Company-wide Greenhouse Gas Emissions By 2030
Measured in Million Metric Tons of Carbon Dioxide Equivalent (Million MT CO2e)
2005-2030
47% Achieved1
From 2005 Baseline of
22.6 million MT CO2e
11.9
11.6
11.2
10.8
10.4
10.0
Optimizing Operational Solar 2030 Goal of
Operations Design Projects 56% Reduction
1As of year-end 2020
WILLIAMS © 2021 The Williams Companies, Inc. All rights reserved. NYSE: WMB I Barclays CEO Energy-Power Conference I September 08, 2021 I www.williams.com 61Key climate commitment drivers
As a midstream industry leader, Williams believes we can successfully sustain
and evolve our business as the world moves to a low carbon future, while also
helping our customers and stakeholders meet their climate goals.
Global Cooperation Technology Investment
Economically Sustainable Regulatory Certainty
Measurable Progress Science Driven
WILLIAMS © 2021 The Williams Companies, Inc. All rights reserved. NYSE: WMB I Barclays CEO Energy-Power Conference I September 08, 2021 I www.williams.com 62Significant improvements in emissions efficiency
Williams Greenhouse Gas Emissions vs. Natural Gas Handled
Significant growth since 2005 40 22.6 25
36.3
– Transmission capacity up over 100% 35
Greenhouse Gas Emissions
(Million metric tons CO2e)
20
– Gathering volumes up nearly 4x 30
Volume + Capacity
Emissions down while business 25 -47%
15
(Bcf/d) 1
scales up 11.94
20
– Improving operations efficiency 14.3 10
15
– Implementing operating practices
10
focused on safety and emissions 5
reductions 5
– Modernizing equipment and 0 0
investing in new technologies 2005 2020
Volume + Capacity GHG Emissions
1For 2005, E&P net volumes: 0.7 Bcfe/d; Firm reserved transmission capacity (Transco, NWP and Gulfstream): 10 Tbtu/d; Gathering volumes: 3.4 Tbtu/d; gas used in power tolling agreements: 0.2 Bcf/d.
For 2020, Firm reserved transmission capacity (Transco, NWP and Gulfstream): 23 Tbtu/d; Gathering volumes: 13.2 Bcf/d. Tbtu converted to Bcf at 1,000 btu per cf.
WILLIAMS © 2021 The Williams Companies, Inc. All rights reserved. NYSE: WMB I Barclays CEO Energy-Power Conference I September 08, 2021 I www.williams.com 63Focused on environmental stewardship and
building strong communities
56% REDUCTION
2020 in company-wide greenhouse gas emissions by 2030 vs 2005 levels of 22.6 million MT
CO2e, working toward net zero carbon emissions by 2050
Sustainability Report
Published July 2021 58% REDUCTION
in reported methane emissions from gas processing plants and transmission compressor
stations since 2012 while increasing throughput volumes by 27% over the same period
33% DECREASE
in all reportable air releases from 2019, surpassing 2020 goal of 10%
$11 MILLION
in contributions to initiatives and organizations that make communities stronger
18,263 HOURS
volunteered by employees to charitable organizations, representing $521,226 in value
Link here for full report
WILLIAMS © 2021 The Williams Companies, Inc. All rights reserved. NYSE: WMB I Barclays CEO Energy-Power Conference I September 08, 2021 I www.williams.com 64Social performance
✓ 26% of our management team is female or ethnic
minority CEO Action for Diversity &
✓ Year over year from 2019-2020, our female
Inclusion Coalition
leadership representation increased from 16% to
Jennifer H. 18%; ethnic minority leadership representation
Project Analyst stayed relatively flat D&I Council
✓ 15% of our office/professional staff is ethnic
minority
✓ 21% of our office/professional staff is female Metrics Dashboard
Mohamed Y. ✓ On average, 27% of our early career program hires
Knowledge Services were ethnic minority and 40% were female over Diversity & Inclusion
the past 5 years
Training and Tools &
✓ 5% voluntary turnover rate Resources
✓ 10% of employees promoted
✓ $10.8 million invested in community
Candid Conversations
Aaron M.
Project Manager Based on 2020 reporting
WILLIAMS © 2021 The Williams Companies, Inc. All rights reserved. NYSE: WMB I Barclays CEO Energy-Power Conference I September 08, 2021 I www.williams.com 65Long history of strong corporate governance
• Williams recognized as a Trendsetter in political disclosure practices and accountability in the 2020
CPA-Zicklin Index
• 12 of 13 Williams Board members are independent
• A gender diverse board since 2008
• Kathleen Cooper was first female Board Chair of major midstream C-Corporation
• Management-level ESG Director appointed to develop and execute strategy
• 10% of Annual Incentive Program targets composed of environmental and safety metrics
• National Diversity Council named Debbie Cowan one of 50 Most Powerful Women in Oil & Gas
• Named 2020 Top Inclusive Workplace by Mosaic
Nancy Buese Vicki Fuller Rose Robeson Stacey Doré Debbie Cowan
Board of Directors Board of Directors Board of Directors Board of Directors SVP & Chief Human
Elected June 2018 Elected July 2018 Elected December 2020 Elected January 2021 Resources Officer
WILLIAMS © 2021 The Williams Companies, Inc. All rights reserved. NYSE: WMB I Barclays CEO Energy-Power Conference I September 08, 2021 I www.williams.com 66Safety is core to our operations
Williams’ Near Miss to Incident Ratio (NMIR) Trend Williams’ Process Safety Incident Trend
Since 2017 Since 2017
Improvement to
25x
-84%
2017 2019 2021 YTD July 2017 2019 2021 YTD July
Note: Near Miss to Incident Ratio (NMIR)= Total number of near misses divided by number of incidents. Near Miss is defined as a reported event where no property was damaged and no personal injury was
sustained, but where, given a slight shift in time or position, damage or injury easily could have occurred. An Incident is defined as an event resulting in injury, measurable release or damage.
WILLIAMS © 2021 The Williams Companies, Inc. All rights reserved. NYSE: WMB I Barclays CEO Energy-Power Conference I September 08, 2021 I www.williams.com 67Stakeholder outreach
2 0 2 0 S U S TAI N A B I L I T Y R E P O R T H I G H L I G H T S
Hosted 70 phone interactions with
Native American tribes
Participated in more than 220
stakeholder engagements
Maintained relationships with more
than 100,000 landowners
Maintaining and strengthening
relationships by understanding local
needs, listening to stakeholder Reached mutual agreements with
priorities and identifying landowners ~93% of the time
opportunities to collaborate
Note: Data is from 2020 Sustainability report (published in 2021)
WILLIAMS © 2021 The Williams Companies, Inc. All rights reserved. NYSE: WMB I Barclays CEO Energy-Power Conference I September 08, 2021 I www.williams.com 68Environmental reporting
2 0 2 0 S U S TAI N AB I L I T Y R E P O R T H I G H L I G H TS
Established ‘21 goal to
53% 10%
53% reduction in
reduce reportable air
environmental notices of
releases by an additional
non-compliance since ‘17
10% from ‘20 levels
33% decrease in
reportable spills to soil 33% 33% reduction in
reportable air releases 33%
and water from ‘19 levels from ‘19 levels
Note: Data is from 2020 Sustainability report (published in 2021)
WILLIAMS © 2021 The Williams Companies, Inc. All rights reserved. NYSE: WMB I Barclays CEO Energy-Power Conference I September 08, 2021 I www.williams.com 69Forward Looking Statements WILLIAMS © 2021 The Williams Companies, Inc. All rights reserved. NYSE: WMB I Barclays CEO Energy-Power Conference I September 08, 2021 I www.williams.com 70
Forward-looking statements
> The reports, filings, and other public announcements of The Williams Companies, Inc. (Williams) may contain or incorporate by reference statements that
  do not directly or exclusively relate to historical facts. Such statements are “forward-looking statements” within the meaning of Section 27A of the
  Securities Act of 1933, as amended (Securities Act), and Section 21E of the Securities Exchange Act of 1934, as amended (Exchange Act). These forward-
  looking statements relate to anticipated financial performance, management’s plans and objectives for future operations, business prospects, outcome of
  regulatory proceedings, market conditions, and other matters. We make these forward-looking statements in reliance on the safe harbor protections
  provided under the Private Securities Litigation Reform Act of 1995.
> All statements, other than statements of historical facts, included in this report that address activities, events, or developments that we expect, believe, or
  anticipate will exist or may occur in the future, are forward-looking statements. Forward-looking statements can be identified by various forms of words
  such as “anticipates,” “believes,” “seeks,” “could,” “may,” “should,” “continues,” “estimates,” “expects,” “forecasts,” “intends,” “might,” “goals,”
  “objectives,” “targets,” “planned,” “potential,” “projects,” “scheduled,” “will,” “assumes,” “guidance,” “outlook,” “in-service date,” or other similar
  expressions. These forward-looking statements are based on management’s beliefs and assumptions and on information currently available to
  management and include, among others, statements regarding:
     – Levels of dividends to Williams stockholders;
     – Future credit ratings of Williams and its affiliates;
     – Amounts and nature of future capital expenditures;
     – Expansion and growth of our business and operations;
     – Expected in-service dates for capital projects;
     – Financial condition and liquidity;
     – Business strategy;
     – Cash flow from operations or results of operations;
     – Seasonality of certain business components;
     – Natural gas, natural gas liquids, and crude oil prices, supply, and demand;
     – Demand for our services;
     – The impact of the coronavirus (COVID-19) pandemic.

   WILLIAMS © 2021 The Williams Companies, Inc. All rights reserved.                 NYSE: WMB I Barclays CEO Energy-Power Conference I September 08, 2021 I   www.williams.com   71
You can also read