Global Simulations of Tidal Disruption Event Disk Formation via Stream Injection in GRRMHD
←
→
Page content transcription
If your browser does not render page correctly, please read the page content below
MNRAS 000, 1–21 (2021)                                Preprint 21 May 2021             Compiled using MNRAS LATEX style file v3.0

                                               Global Simulations of Tidal Disruption Event Disk Formation via
                                               Stream Injection in GRRMHD
                                                   Brandon Curd1?
                                               1    Harvard-Smithsonian Center for Astrophysics, 60 Garden Street, Cambridge, MA 02138, USA

                                               Accepted XXX. Received YYY; in original form ZZZ
arXiv:2105.09904v1 [astro-ph.HE] 20 May 2021

                                               ABSTRACT
                                               We use the general relativistic radiation magnetohydrodynamics code KORAL to simulate the early stages of accretion
                                               disk formation resulting from the tidal disruption of a solar mass star around a super massive black hole (BH) of
                                               mass 106 M . We simulate the disruption of artificially more bound stars with orbital eccentricity e ≤ 0.99 (compared
                                               to the more realistic case of parabolic orbits with e = 1) on close orbits with impact parameter β ≥ 3. We use a
                                               novel method of injecting the tidal stream into the domain. For two simulations, we choose e = 0.99 and inject mass
                                               at a rate that is similar to realistic TDEs. We find that the disk only becomes mildly circularized with eccentricity
                                               e ≈ 0.6 within the 3.5 days that we simulate. The rate of circularization is faster for pericenter radii that come
                                               closer to the BH. The emitted radiation is mildly super-Eddington with Lbol ≈ 3 − 5 LEdd and the photosphere is
                                               highly asymmetric with the photosphere being significantly closer to the inner accretion disk for viewing angles near
                                               pericenter. We find that soft X-ray radiation with Trad ≈ 3 − 5 × 10⁵ K may be visible for chance viewing angles. Our
                                               simulations predict that TDEs should be radiatively inefficient with η ≈ 0.009 − 0.014. These are the first simulations
                                               which simultaneously capture the stream, disk formation, and emitted radiation.
                                               Key words: accretion, accretion discs - black hole physics - MHD - radiative transfer - X-rays: galaxies

                                               1 INTRODUCTION                                                      cently, a handful of TDEs have been observed during the rise
                                                                                                                   to peak (Holoien et al. 2019, 2020; Hinkle et al. 2021). This
                                               Stars orbiting a central black hole (BH) in a galactic nu-
                                                                                                                   bounty of observations is expected to grow significantly in
                                               cleus can sometimes get perturbed such that their orbit
                                                                                                                   the coming years, but the theoretical understanding of TDEs
                                               brings them close enough to the BH to get tidally disrupted.
                                                                                                                   is still catching up in several respects.
                                               Such events, which have been dubbed tidal disruption events
                                               (TDEs) or tidal disruption flares, result in a bright flare which      On the theory side, the general understanding of the ini-
                                               peaks rapidly and is observable for years as it declines. The       tial stellar disruption and stream evolution has been well de-
                                               general theoretical understanding was developed decades ago         veloped (Carter & Luminet 1982; Evans & Kochanek 1989;
                                               (Hills 1975; Rees 1988; Phinney 1989; Evans & Kochanek              Kochanek 1994; Lodato et al. 2009; Brassart & Luminet 2010;
                                               1989). The prediction was that a geometrically thick, cir-          Stone et al. 2013; Coughlin & Nixon 2015; Coughlin et al.
                                               cularized accretion disk will form with a density maximum           2016; Steinberg et al. 2019). In addition, several authors have
                                               near the tidal radius and will generate prompt emission in          simulated the hydrodynamics of the disk formation (Ramirez-
                                               the optical and UV bands with a luminosity that decreases           Ruiz & Rosswog 2009; Guillochon & Ramirez-Ruiz 2013; Sh-
                                               with time following a t−5/3 power law. TDEs provide a rare          iokawa et al. 2015; Bonnerot et al. 2016; Hayasaki et al. 2016;
                                               glimpse into the nature of distant BHs which would ordinarily       Liptai et al. 2019; Andalman et al. 2020; Bonnerot & Lu 2020;
                                               be quiescent and are thus expected to provide a laboratory          Bonnerot et al. 2021). These studies have demonstrated that
                                               for understanding BH physics.                                       the presence of a nozzle shock at pericenter as well as shocks
                                                  Since the initial discovery of TDEs with the X-ray tele-         due to the stream self interacting due to precession and the
                                               scope, ROSAT, TDEs have been discovered in the X-ray, opti-         fallback of material towards the BH will lead to dissipation
                                               cal/UV, and radio (see Komossa 2015 for a review). The pres-        and disk formation. However, the numerical costs of global
                                               ence of outflows, possibly launched by an accretion disk, has       simulations have largely limited authors to studies of artifi-
                                               been inferred in many cases due to radio emission (Alexan-          cially more bound streams or TDEs around lower mass BHs.
                                               der et al. 2016, 2017) and TDEs have also been observed to             The ultimate goal of theoretical studies is to understand
                                               launch jets (Bloom et al. 2011; Burrows et al. 2011; Zauderer       the observed emission properties of TDEs. The emission is
                                               et al. 2011; Cenko et al. 2012; Brown et al. 2015). More re-        presumably linked to the properties of the disrupted stream
                                                                                                                   and the BH, but the parameter space of TDEs is vast and re-
                                                                                                                   quires precise scrutiny. Several authors have investigated the
                                               ?   E-mail: brandon.curd@cfa.harvard.edu                            effect of the orbital parameters on the stream’s binding en-

                                               © 2021 The Authors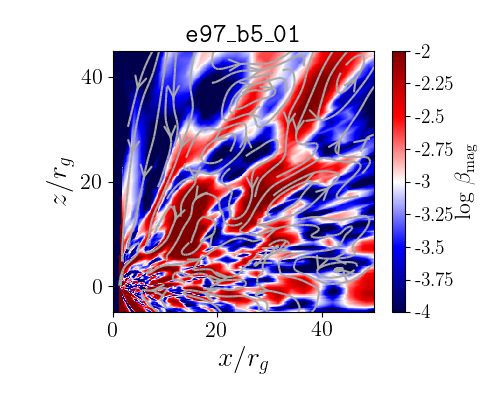
2     Brandon Curd
ergy distribution and the mass fall back rate. If the observed       regard, studying accretion flows forming in a more realistic
luminosity is strongly coupled to the mass fall back rate, it is     manner is of significant interest.
expected that the rise to peak may allow for an independent             Here we apply a new method of injecting the stream on its
determination of the pericenter radius, with stars disrupted         first return to pericenter in order to study the disk formation,
on closer orbits having a sharper rise to peak. Liptai et al.        emission, and photosphere geometry for a close disruption in
(2019) show that the spin of the BH can also delay the peak          a global simulation which accounts for the effects of radiation.
of the luminosity.                                                   We focus on the early stages of disk formation and emission.
   The possibility of determining the parameters of the dis-         Simulating the radiative properties of close TDEs, although
rupted star and the central BH from TDE observations was             such events are expected to be less common, is beneficial to
explored by Mockler et al. (2019). However, without a com-           test our understanding of observed TDEs as they may make
plete library of TDE models it is difficult to break model de-       up an important part of the parameter space for TDEs. For
generacies. Building such a library requires a precise modeling      example, Dai et al. (2015) demonstrated that TDEs for close
of the accretion flow properties. Numerically, this is compli-       orbits around lower mass BHs (MBH < 5 × 10⁶ M ) may be
cated by the large time and distance scales involved. Addi-          the population that produces soft X-ray TDEs. When the
tionally, evolving the radiation with the gas greatly increases      Large Synoptic Survey Telescope (LSST, Ivezić et al. 2019)
computational overhead in global simulations. For this rea-          comes on line, it is expected to observe 10 to 22 TDEs per
son, much of the previous work to study TDEs through sim-            night (Bricman & Gomboc 2020). This would represent an
ulations has focused on the disruption, disk formation, and          unprecedented increase in the number of known TDEs and
accretion flow separately.                                           open up the opportunity to probe the statistics of TDEs. As
                                                                     such, improving the theoretical understanding of the emission
   The precise source of the observed radiation in TDEs has          properties of TDEs across the parameter space is prescient.
not been pinned down theoretically. Dai et al. (2018) pro-              In this work, we consider the tidal disruption of a 1 M
posed a unified model in which an inner accretion flow sup-          star on a close, eccentric orbit around a BH of mass 106 M .
plies X-rays which can be obscured depending on viewing              We present GRRMHD simulations of the TDE disk forma-
angle. This possibility was also explored by Curd & Narayan          tion using a novel method of injecting the stream into the
(2019). On the other hand, Piran et al. (2015) and Jiang             simulation domain by defining the orbital parameters of the
et al. (2016) propose that the outflow from the stream self
                                                                     inflowing gas via TDE theory. Building on previous works,
intersection can alone explain optically identified TDEs. Sim-
                                                                     we expand the computational domain to capture the photo-
ulating the outflow and accretion disk together is necessary
                                                                     sphere and measure the emerging luminosity for this class of
to directly discriminate relative contributions.
                                                                     TDEs. In addition, we for the first time study the effects of ra-
   Radiation is also particularly important in super-                diation on the evolution of the disk when both the incoming
Eddington flows as the gas in such cases is radiation dom-           stream and the forming disk are present in the simulation
inated and the accretion disk may launch outflows with ve-           domain. This has the benefit of allowing us to capture the
locities in excess of 0.1 − 0.4c (Sa̧dowski et al. 2015, 2016b;      photosphere geometry and expected emission throughout the
Jiang et al. 2019). The effects of radiation in the disk forma-      evolution. We note that the incoming stream is artificially
tion has only been studied by Bonnerot et al. (2021) thus far.       more bound in this work (i.e., we consider the stream to be
They included realistic TDE parameters by using an injec-            on an elliptic trajectory with large eccentricity, rather than
tion of the outflow resulting from the stream self-intersection      on a parabolic orbit), but we scale down the density of the
and found that the disk evolved towards a thin disk of nearly        incoming stream to values similar to those expected for near
constant height rather than the thick geometry expected of           parabolic TDEs for four of the simulations that we discuss.
a super-Eddington flow.                                                 The paper is organized as follows. In §2, we provide a brief
   Attempts to simulate the resulting accretion flow in general      overview of the theoretical understanding of TDEs relevant
relativistic radiation magnetohydronynamics (or GRRMHD,              for this work. In §3, we describe the numerical methods em-
Dai et al. 2018; Curd & Narayan 2019) have demonstrated              ployed in the simulations and describe the treatment of ra-
that if TDEs evolve towards a geometrically puffed up accre-         diation as well as the boundary conditions used to inject the
tion disk as is expected in super-Eddington accretion flows,         stream. In §4 and §5, we detail the results for each simulation
the emission will be X-ray dominated or optical/UV domi-             presented herein. We discuss implications of these results in
nated depending on the viewing angle. However, while these           §6 and conclude in §7.
simulations predict emission and outflows that are very simi-
lar to many observed TDEs, there is a significant uncertainty
in the initial conditions and the photosphere radius/geometry        2 TIDAL DISRUPTION EVENT PHYSICS
in particular. Andalman et al. (2020) have demonstrated that
                                                                     Throughout this work, we use gravitational units to describe
even for very close stellar orbits the disk geometry is irregular
                                                                     physical parameters. For distance we use the gravitational
and not likely to be significantly circularized even after sev-
                                                                     radius rg ≡ GMBH /c2 and for time we use the gravitational
eral days; however, this has not been studied for more than
                                                                     time tg ≡ GMBH /c3 , where MBH is the mass of the BH.
a fraction of the fallback time for near parabolic disruptions.
                                                                     Often, we set G = c = 1, so the above relations would be
In addition, it is not entirely clear that the highly super-
                                                                     equivalent to rg = tg = MBH . 1 Occasionally, we restore G
Eddington accretion rates assumed in Dai et al. (2018) and
                                                                     and c when we feel it helps to keep track of physical units.
Curd & Narayan (2019) are applicable in most TDEs since
these studies assumed circularization is highly efficient. As of
this writing, it is still unclear if the nearly circularized disks   1For a BH mass of 106 M , the gravitational radius and time in
that previous studies have found apply in real TDEs. In that         CGS units are rg = 1.48 × 1011 cm and tg = 4.94 s, respectively.

MNRAS 000, 1–21 (2021)
Eccentric TDE Disks in GRRMHD                      3
  We adopt the following definition for the Eddington mass            due to relativistic effects. We adopt a similar method to Dai
accretion rate:                                                       et al. (2015) to quantify this precession. On its first pericenter
          LEdd                                                        passage, the precession angle may be approximated by
ṀEdd =         ,                                      (1)
         ηNT c2                                                                  6π
                                                                      ∆φ =               .                                          (5)
                                  38
where LEdd = 1.25 × 10 (M/M ) erg s           −1
                                                is the Edding-                a(1 − e2 )
ton luminosity, ηNT is the radiative efficiency of a thin disk        Note that we have expressed ∆φ using gravitational units so
around a BH with spin parameter a∗ (which is often referred           the semi-major axis a is given in gravitational radii. Treating
to as the Novikov-Thorne efficiency),                                 the orbits of the incoming stream that has yet to pass through
            r
                       2                                              pericenter and the already precessed stream as ellipses, the
ηNT = 1 − 1 −              ,                               (2)        self intersection between the incoming material and material
                    3rISCO
                           p                                          that has precessed occurs at the radius
and rISCO = 3 + Z2 − (3 − Z1 )(3 + Z1 + 2Z2 ) is the ra-
                                                                                  (1 + e)Rt
dius of the Innermost Stable Circular Orbit (ISCO, Novikov            RSI =                      .                                  (6)
                                                                              β(1 − e cos(∆φ/2))
& Thorne 1973) in the Kerr metric,    where Z1 = 1 + (1 −
                                                                      The initial evolution of the disk is expected to be driven by
                                               p
a2∗ )1/3 (1 + a∗ )1/3 + (1 − a∗ )1/3 and Z2 = 3a2∗ + Z12 . For
a∗ = 0, the efficiency is ηNT = 0.05712.                              dissipation of kinetic energy at this point. As the velocity of
    A star which has been captured by a SMBH will be dis-             the stream elements is greater at smaller radii, the rate of
rupted when it can no longer be held together by its self-            dissipation will also be greater for closer orbits (larger β).
gravity. This occurs at radii less than the tidal radius,
              −2/3
Rt /rg = 47m6        m−1/3
                      ∗    r∗ ,                                (3)
                                                                      3 NUMERICAL METHODS
                            6
where m6 = MBH /10 M is the mass of the SMBH, m∗ =
                                                                      The simulations presented in this work were performed us-
M∗ /M is the mass of the disrupted star, and r∗ = R∗ /R
                                                                      ing the general relativistic radiation magnetohydrodynamical
is its radius. It is common to describe the disruption in terms
                                                                      (GRRMHD) code KORAL (Sa̧dowski et al. 2013, 2014, 2017)
of the impact parameter, β, which is defined as the ratio
                                                                      which solves the conservation equations in a fixed, arbitrary
between the tidal radius and pericenter separation such that
                                                                      spacetime using finite-difference methods. We solve the fol-
β ≡ Rt /Rp . A full disruption occurs for β ≥ 1.
                                                                      lowing conservation equations:
   If hydrodynamical forces are neglected, then the change in
the specific binding energy of the fluid in the star as a result of   (ρuµ );µ = 0,                                                 (7)
the tidal interaction can greatly exceed the internal binding          (Tνµ );µ   = Gν ,                                            (8)
energy of the star (Rees 1988). As a result, a spread in binding
energy is imparted on the stellar material. Stone et al. (2013)        (Rνµ );µ   = −Gν ,                                           (9)
find that the spread in orbital energy ∆ is insensitive to β         where ρ is the gas density in the comoving fluid frame, uµ are
since the energy is essentially frozen in at the tidal radius.        the components of the gas four-velocity as measured in the
This spread is then given by:                                         “lab frame”, Tνµ is the MHD stress-energy tensor in the “lab
                      1/3
                  m6 m∗
                                2/3                                   frame”,
∆ ≈ 4.3 × 10⁻⁴                       c2 .                     (4)
                    r∗                                                                                         1 2 µ
                                                                      Tνµ = (ρ + ug + pg + b2 )uµ uν + (pg +     b )δν − bµ bν ,   (10)
The orbital binding energy of the most/least bound material                                                    2
is given by mb = ∗ −∆/2 and lb = ∗ +∆/2. Here ∗ is the         Rνµ is the stress-energy tensor of radiation, and Gν is the
initial orbital binding energy of the star. For parabolic orbits,     radiative four-force which describes the interaction between
which have ∗ = 0, the spread in binding energy leads to half         gas and radiation (Sa̧dowski et al. 2014). Here ug and pg =
of the mass remaining bound and the other half being ejected.         (γ − 1)ug are the internal energy and pressure of the gas in
However, if the star is on an elliptical orbit (gravitationally       the comoving frame and bµ is the magnetic field four-vector
bound to the SMBH) and has an initial binding energy ∗ <             which is evolved following the ideal MHD induction equation
−∆/2, then all of the stellar material remains bound after           (Gammie et al. 2003).
disruption and returns to pericenter in a finite time.                   The radiative stress-energy tensor is obtained from the
   In this work, we study the tidal stream of a 1M main               evolved radiative primitives, i.e. the radiative rest-frame en-
sequence star around a 106 M SMBH for elliptical (e < 1),             ergy density and its four velocity following the M1 clo-
close (β > 1) orbits. This leads to a disruption where ∗ =           sure scheme modified by the addition of radiative viscosity
−βc2 (1 − e)/2(Rt /rg ) < −∆/2. The orbit of the disrupted           (Sa̧dowski et al. 2013, 2015).
star is assumed to be aligned with the equatorial plane of               The interaction between gas and radiation is described by
the BH spin vector. The orbital period of the most bound              the radiation four-force Gν . The opposite signs of this quan-
material is given by tmb = 2π(−2mb )−3/2 and that of the             tity in the conservation equations for gas and radiation stress-
least bound material by tlb = 2π(−2lb )−3/2 . Thus there is          energy (equations 8, 9) reflect the fact that the gas-radiation
a difference in the arrival times of the most and least bound         interaction is conservative, i.e. energy and momentum are
material of ∆t = tlb −tmb . The commonly used ’fallback time’         transferred between gas and radiation. For a detailed descrip-
is the time it takes for the most bound material to return to         tion of the four-force see Sa̧dowski et al. (2017). We include
pericenter following disruption; therefore, we set the fallback       the effects of absorption and emission via the electron scat-
time to tfallback = tmb .                                             tering opacity (κes ) and free-free asborption opacity (κa ) and
   As it makes its first pericenter passage, the stream precesses     assume a Solar metal abundance for the gas.

                                                                                                              MNRAS 000, 1–21 (2021)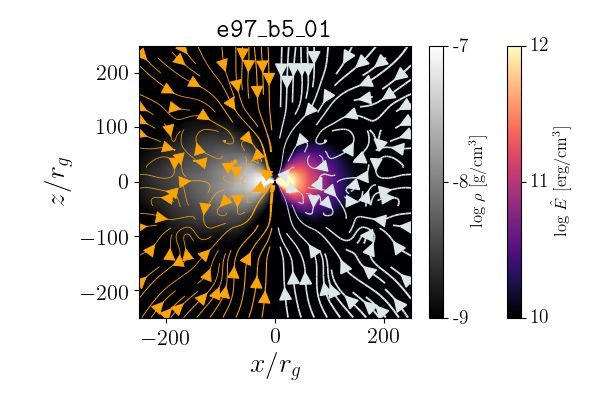
4      Brandon Curd

                              e99_b5_01            e99_b3_01           e97_b5_01             e97_b5_02               e97_b5_03      e97_b5_04

    magnetic field?                no                  no                 yes                  no                        no              no
    radiation?                    yes                 yes                 yes                  no                        yes             no
    e                             0.99                0.99                0.97                0.97                      0.97            0.97
    β                               5                  3                    5                   5                          5               5
    Minj,tot                   0.013 M             0.016 M               1M                  1M                       0.04 M          0.04 M
    Ṁ0 (ṀEdd )                  133                 133               19,330              19,330                       800             800
    a∗                              0                  0                  0.9                 0.9                          0               0
    Nr × Nθ × Nφ            160 × 128 × 128     160 × 128 × 128     160 × 128 × 128     160 × 128 × 128            96 × 96 × 128   96 × 96 × 128
    Rinj (rg )                    200                 400                 500                 500                        200             200
    RSI (rg )                      40                 168                  40                  40                         40              40
    Rmin (rg )/Rmax (rg )     1.8/5 × 104         1.8/5 × 104           1.3/105             1.3/105                   1.8/103         1.8/103
    tfallback (tg )             108,825             179,946             28,830              28,830                     28,830          28,830
    ∆tinj (tg )                 284,925            1,910,084            14,467              14,467                     14,467          14,467
    tmax (tg )                   60,000              60,000             40,000              60,000                     60,000          60,000

Table 1. Simulation parameters and properties of the six simulations. We specify whether the magnetic field and radiation were evolved
with the gas. We also specify the eccentricity (e), impact parameter (β), total mass injected during the injection phase (Minj,tot ), the
peak injection rate of mass into the domain (Ṁ0 ), the spin of the BH (a∗ ), the radius at which mass is injected (Rinj ), the self-intersection
radius of the stream (RSI ), the inner and outer radial boundaries of the simulation box, the resolution of the grid, the fallback time of
the stream (tfallback ), the time at which the least bound material is injected (∆tinj ), and the total run time for each simulation (tmax ).

   We use modified Kerr-Schild coordinates with the inner                  the properties of the injected stream. This is the first work
edge of the domain inside the BH horizon. The radial grid                  in which we employ this numerical setup.
cells are spaced logarithmically in radius and the cells in po-               The simulation domain is initialized with a low density at-
lar angle θ have smaller widths towards the equatorial plane.              mosphere with a density profile that scales with r−2 . The at-
The cells are equally spaced in azimuth. At the inner radial               mosphere is initialized with a constant radiation temperature
boundary (Rmin ), we use an outflow condition while at the                 of Tatm = 105 K. We inject the TDE stream at an interior
outer boundary (Rmax ) we use a similar boundary condition                 boundary (which is henceforth referred to as the ‘injection
and in addition prevent the inflow of gas and radiation. At the            boundary’) Rmin < Rinj < Rmax . The injection boundary
polar boundaries, we use a reflective boundary. We exclude a               radii used in each simulation are shown in Table 1.
small region of the polar angle such that θmin = 0.005π and                   The mass inflow rate at the injection boundary decreases
θmax = 0.995π to reduce computation time near the hori-                    over time following a Ṁ ∝ t−5/3 profile. The exact description
zon where the limit on the time step in the polar azimuthal                of the mass injection is given by:
directions becomes small. We employ a periodic boundary
condition in azimuth and the grid covers −π ≤ φ ≤ π.
   We quantify the resolution of the fastest growing mode                                                        −5/3
                                                                                                     t
of the magnetorotational instability (MRI, Balbus & Hawley                 Ṁinj (t) = Ṁ0                   +1                                 (13)
                                                                                                 tfallback
1991) by computing the quantities:
         2π |bθ |                                                          where Ṁ0 is the peak mass inflow rate, and t is the time
Qθ =        √     ,                                             (11)
        Ωdxθ 4πρ                                                           since the beginning of injection in gravitational units. Since
         2π |bφ |                                                          the disrupted stellar material for the two eccentricities we
Qφ =        √     ,                                             (12)       consider, e = 0.97 and e = 0.99, returns in a finite time, we
        Ωdxφ 4πρ
                                                                           turn off the mass injection after t > ∆tinj = (tlb − tmb ). We
where dxi (the grid cell) and bi (the magnetic field) are both             list the time at which the least bound material is injected for
evaluated in the orthonormal frame, Ω is the angular veloc-                each simulation in Table 1. Note that in our set up, the most
ity, and ρ is the gas density. Numerical studies of the MRI                bound material is injected at the simulation time t = 0. After
have shown that values of Qθ and Qφ in excess of at least 10               the least bound material is injected at t = ∆tinj , we switch to
are needed to resolve the fastest growing mode (Hawley et                  a reflecting boundary condition for the cells at the injection
al. 2011). We discuss later how the MRI evolves in the one                 boundary. All the simulations are run for a total run time of
simulation in which we include a magnetic field.                           tmax = 60, 000M with the exception of e99_b5_01 which has
                                                                           a run time of tmax = 40, 000M . In each case, this duration
                                                                           is longer than ∆tinj for e = 0.97 and so stream injection
3.1 Injection of TDE Stream
                                                                           ceases part-way through these simulations. However, for e =
Previous hydrodynamical simulations of TDE disks have been                 0.99, tmax is less than ∆tinj , and for these simulations stream
performed by starting with smooth particle hydrodynamics                   injection continues up to the end of these simulations.
simulations of the disruption to obtain the initial data. In the              The trajectory of the incoming fluid is determined by its
present work, we inject the TDE stream at an interior bound-               specific binding energy and angular momentum. The angular
ary using a description of the fluid based on TDE theory.                  momentum is fixed to the value corresponding
                                                                                                                 p           to the pericen-
The primary motivation for this approach is the possibility                ter radius of the TDE stream l = 2Rp . The radial velocity
of studying a broad range of TDE disks by simply changing                  is determined from the specific binding energy, which varies

MNRAS 000, 1–21 (2021)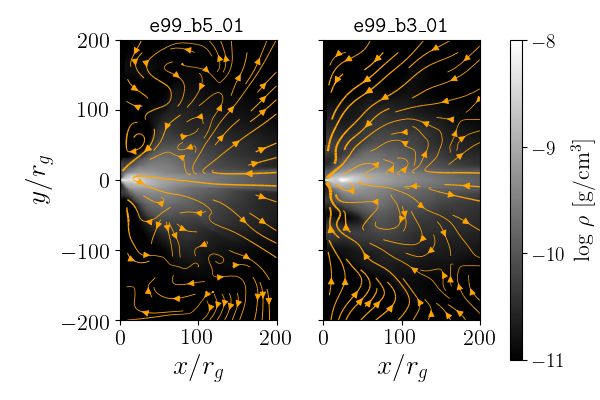
Eccentric TDE Disks in GRRMHD 5
as: 4 NEAR PARABOLIC SIMULATIONS
−2/3
t We first discuss the simulations e99_b5_01 and e99_b3_01.
inj (t) = 0 +1 . (14)
tfallback Although not quite parabolic, the injected streams in these
models are close enough to parabolic to be reasonable rep-
The radial velocity is then set by:
resentations of real TDEs. We focus our discussion on
e99_b5_01, but we contrast results with e99_b3_01 where
s
2
vinj (t) = − + 2inj (t) . (15) key differences arise.
Rinj
These estimates are all based on a Newtonian approximation,
which is sufficiently accurate for our purpose. 4.1 Dynamics
The maximum stream thickness at pericenter can be esti-
As the incoming gas passes through pericenter, it undergoes
mated to be of order (H/R)max = R /Rp ∼ 0.01. Because
relativistic orbital precession and collides and shocks with the
of resolution limitations, especially in the azimuthal φ direc-
incoming stream. The energy available for dissipation in the
tion, we choose to inject gas with a larger scale height of
interaction is determined by the radius of self-intersection.
H/R = 0.05, which still covers only two cells in azimuth. We
For the β = 5 model, the theoretical self intersection radius is
inject the gas with a constant mass density since the reso-
RSI ≈ 40, though we note that the stream appears to spread
lution at the injection point is too poor to include a density
out after the nozzle shock which results in a range of radii
profile.
for self intersection between 10 − 100 rg . The typical collision
The gas temperature is set to Tinj = 105 K at the injection
velocity at the self-intersection point is v ≈ 0.2c. For the
boundary. This temperature is used to set the total pressure
β = 3 model, the self intersection radius is RSI ≈ 168 and
of the stream. For simulations where radiation is included,
the typical collision velocity is slightly lower at v ≈ 0.1c.
we use the initial gas pressure obtained from Tinj to split the
We note that the stream has a significant radial width as
internal energy into gas and radiation energy density by solv-
it passes through pericenter, which is characteristic of eccen-
ing the condition ptot = pgas + prad and finding a new gas and
tric streams. The fluid elements that orbit closer to the BH
radiation temperature which assumes thermal equilibrium of
precess more than those farther away. As a result, the gas ap-
the gas.
pears to fan out as it passes through the nozzle. This effect,
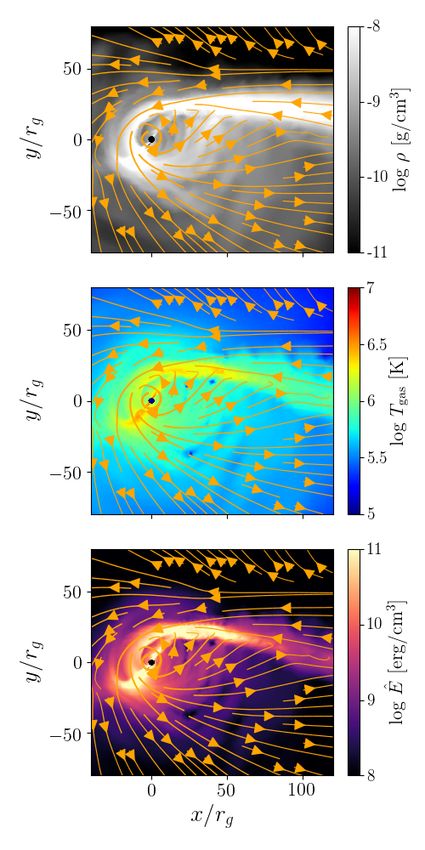
For the simulation where we include a magnetic field
which can be seen in Figure 1, leads to the gas that collides
(e97_b5_01), we inject a magnetic field with a poloidal
with the returning stream having lower density. This is not
field geometry and a magnetic pressure ratio of βmag ≡
expected in realistic TDEs (Bonnerot, Private Communica-
pmag /(pgas + prad ) = 0.01. This choice of βmag guarantees
tion).
that the magnetic field does not impact the gas dynamics as
Due to vertical crossing at pericenter, the gas forms a noz-
the disk forms.
zle region but this feature is poorly resolved in the present
simulations given our choice of grid. Similar to Sa̧dowski et
al. (2016a), we find that this region is not as narrow as in
3.2 Simulation Details
parabolic disruptions in part due to the eccentricity of the
We list the simulations presented in this work in Table 1. treated disruption, but the vertical extent may also be arti-
The name of each simulation is listed in the top row and ficially larger due to the artificial stream thickness that we
each name describes the eccentricity and impact parameter employ. There is some dissipation in the nozzle, which can be
defining the binding energy and angular momentum of the seen in the increase in temperature near pericenter (Figure 1)
incoming material. We also add a numerical tag at the end to but the nozzle region in our simulations is only marginally re-
differentiate simulations with similar disruption parameters. solved (we have 10 cells in the nozzle region). The qualitative
For example, ‘e99_b5_01’ was initialized with e = 0.99 and results are not expected to be impacted by this.
β = 5, which is also indicated in Table 1. The dissipation of kinetic energy in the self-intersection
In this study, we perform simulations in which the binding shock leads to significant heating of the gas, with the inner
energy and angular momentum of the stream are set assum- accretion disk reaching temperatures Tgas ≈ 106 K. This in
ing the disruption of a Sun-like star. For four of the simula- turn causes a strong outflow of gas. A significant fraction of
tions (e99_b5_01, e99_b3_01, e97_b5_03, and e97_b5_04 in the shocked gas becomes more bound and falls directly into
Table 1), we artificially scale down the mass injection rate. the BH. An even larger fraction becomes unbound and gets
For e99_b5_01 and e99_b3_01, the peak mass injection rate ejected in an outflow carrying a significant amount of kinetic
is approximately that expected for a parabolic TDE. Note energy. As discussed in Lu & Bonnerot (2020), the fraction of
that the binding energy and angular momentum for a 1 M gas that becomes unbound due to shocks is sensitive to both
star are maintained in spite of this modification to the in- the stellar parameters and the BH mass, and the maximum
jected stream. For e97_b5_01 and e97_b5_02, we inject a full expected fraction of gas that becomes unbound is 50%. We
solar mass over the course of the mass injection. As we dis- discuss the outflows in our models in more detail in §4.3.
cuss in §5, radiation from the shocks and forming disk is able We show the full evolution of the forming disk for
to diffuse out and push on the gas rather than merely be- e99_b5_01 in Figure 2. We find that there are various epochs
ing advected if the density of the incoming stream is lowered during the evolution of this model (true also for e99_b3_01),
to more realistic values. Since we wish to study the impact such as the t = 40, 000tg epoch shown in the bottom middle
of radiation in the early evolution of TDE disks, we choose panel in Figure 2, where the incoming stream is temporarily
to artificially decrease the stream density in these cases. We disrupted due to the violent self intersection. These events
discuss the consequences of this in §6. are accompanied by significant shock heating and gas being
MNRAS 000, 1–21 (2021)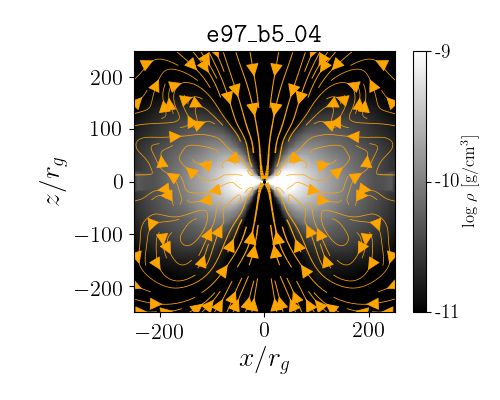
6     Brandon Curd
                                                                      the simulations e99_b5_01 and e99_b3_01 in Figure 4. The
                                                                      resulting disk is puffed up with the density maximum oc-
                                                                      curing between the pericenter radius and the circularization
                                                                      radius (Rcirc ≡ 2Rp ). The entire outflow and disk is radiation
                                                                      pressure dominated, with the disk reaching a pressure ratio
                                                                      βrad ≡ prad /pgas ≈ 105 near the density maximum.

                                                                      4.2 Accretion Disk Properties
                                                                      The dissipation of kinetic energy in the self-intersection shock
                                                                      causes the orbital binding energy of the shocked gas to de-
                                                                      crease. This leads to the formation of a circularized accretion
                                                                      disk which has a lower eccentricity than the injected mate-
                                                                      rial. Secondary shocks in the forming disk (Bonnerot & Lu
                                                                      2020; Bonnerot et al. 2021) and the stream disruption events
                                                                      (Andalman et al. 2020) such as in Figure 2 cause additional
                                                                      dissipation but we do not explicitly track this dissipation rate.
                                                                      Instead, we use the eccentricity as a metric for the efficiency
                                                                      of binding energy dissipation. We track the eccentricity evolu-
                                                                      tion of the disk material over the duration of each simulation
                                                                      by computing the mass weighted eccentricity. The eccentric-
                                                                      ity for each grid point is given by:
                                                                           p
                                                                      e = 1 + 2l2 ,                                               (16)
                                                                      where l = uφ is the specific angular momentum and  =
                                                                      −(1 + ut ) is the specific binding energy. We then compute
                                                                      the mass weighted eccentricity as a function of radius:
                                                                               R 2π R 2π/3 √
                                                                                0    π/3
                                                                                            −gρe dθ dφ
                                                                      hei(r) = R 2π R 2π/3 √           .                      (17)
                                                                                 0    π/3
                                                                                             −gρ dθ dφ
                                                                      We only integrate over a ±π/6 wedge around the equatorial
                                                                      plane (θ = π/2) which includes most of the forming disk. We
                                                                      quantify the disk thickness by estimating the density scale
                                                                      height over a ±π/4 wedge around the equatorial plane:
                                                                            R 2π R 3π/4
                                                                      H      0    π/4
                                                                                        ρ tan(|π/2 − θ|)2 dθdφ
                                                                         =           R 2π R 3π/4               .              (18)
                                                                      R                          ρ dθdφ
                                                                                       0   π/4

                                                                         As shown in Figures 5 and 6, the disk eccentricity decreases
                                                                      substantially over the course of a simulation. Similar to An-
                                                                      dalman et al. (2020), the injected stream constantly delivers
                                                                      gas with high eccentricity so the overall disk never reaches
                                                                      the approximate value for a highly circularized disk of e ≈ 0.3
                                                                      (Bonnerot et al. 2016). As expected based on the total energy
                                                                      dissipated at the circularization radius, e99_b3_01 circular-
                                                                      izes more slowly, decreasing below e = 0.8 after t = 30, 000 tg .
Figure 1. Here we show an equatorial slice of the self intersection
                                                                      The lower eccentricity at radii lower than r = 16 rg is due to
region for e99_b5_01 at t = 3, 000 tg . The colors show the gas
density (top), gas temperature (middle) and radiation energy den-
                                                                      gas contained within the pericenter radius Rp ≈ 16 rg being
sity (bottom). In each panel, the orange arrows show the velocity     relatively unmixed with gas that has yet to circularize.
vectors. The self intersection occurs over a range of radii from         The accretion and outflow rates for each simulation are
10 − 100 rg . The shock is indicated by an increase in temperature    detailed in Figure 7. We compute the total inflow/outflow
and radiation energy density. There is also seemingly a secondary     rate as:
shock near pericenter as indicated by the increase in temperature                  Z π Z 2π
                                                                                            √
and radiation energy density to the left of the BH.                   Ṁin (r) = −            −gρ min(ur , 0)dφdθ.               (19)
                                                                                        0       0

                                                                                        πZ      2π
                                                                                                     √
                                                                                    Z
flung onto a wide range of orbits. Such events were also found        Ṁout (r) =                     −gρ max(ur , 0)dφdθ.        (20)
in a TDE simulation of a star on a close orbit by Andalman                          0       0

et al. (2020). We discuss the properties of the disruptions in        Note the extra −1 in the definition of the inflow rate since the
our simulations in more detail in §6. We also show the final          integrand in this case is negative. In addition, we only con-
state of the disk in the mid plane for e99_b3_01 in Figure 3.         sider fluid elements with positive Bernoulli number to con-
   We show the vertical structure of the disk at the end of           tribute to the outflow since these gas parcels are expected

MNRAS 000, 1–21 (2021)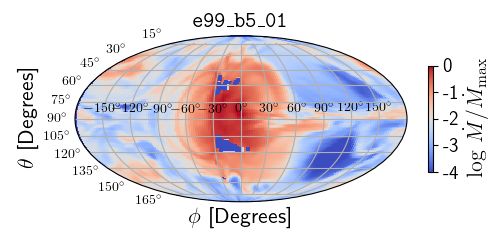
Eccentric TDE Disks in GRRMHD                          7

Figure 2. Here we show selected snapshots of the gas density (colors) for a slice through the mid plane (θ = π/2) for e99_b5_01 to highlight
parts of the evolution. The scale of each image is 400rg × 400rg and the BH is centered in the image. There are multiple events in the
evolution, similar to that shown in the bottom middle panel, where the incoming stream is fully disrupted.

to remain unbound as they travel to infinity. We define the             inflow rate at all radii is nearly in equilibrium (i.e. nearly
Bernoulli number as:                                                    constant) for Rmin < r < Rinj .

         T tt + Rt t + ρut
Be = −                     .                                  (21)
                ρut
                                                                        4.3 Outflows
The density of the outflow is substantial and it remains op-            We show the outflow crossing the shell at r = 1000 rg in the
tically thick for the duration simulated in this work. We de-           bottom panel of Figure 7. The self intersection of the stream
scribe the photosphere in a later section.                              leads to a significant fraction of the shocked gas becoming
   The accretion rate of mass crossing the BH horizon is                unbound, i.e. Ṁout peaks at ≈ 60ṀEdd compared to the peak
several times the Eddington rate in both e99_b5_01 and                  injection rate of 133ṀEdd . As we demonstrate in §5, radiation
e99_b3_01 (Figure 7). The accretion rate of e99_05_01 is                is able to diffuse through the surrounding gas and drives even
nearly twice that of e99_03_01 initially, reflecting that the           more gas to become unbound. The typical velocity of the
dissipation of orbital energy is more rapid for this closer dis-        outflow is v ≈ 0.1c.
ruption. The accretion rate grows as the mean eccentricity of              Periodic behavior is exhibited in the outflow rate of
the disk decreases and appears to saturate after t = 30, 000 tg         e99_b5_01 on top of the overall long term trend. The pe-
for e99_b5_01, which is approximately when the eccentricity             riod is of the order P ≈ 3300 tg and the amplitude of the
in the inner disk reaches its lowest value of e ≈ 0.6 (Figure 5).       variation is nearly 10ṀEdd . As was noted in Sa̧dowski et al.
In e99_b3_01, this saturation appears to occur slightly later           (2016a), this periodic behavior is due to the large angular mo-
at t = 50, 000tg . This increase in accretion rate also appears         mentum transfer in the self-intersection region to the part of
to correlate to the system approaching an inflow/outflow                the stream that is making its first return to pericenter. This
equilibrium. Early in the disk formation, the total mass inflow         sets up a feedback loop. The gas that has already passed
rate as a function of radius for Rmin < r < Rp is constant,             pericenter and precessed, not only causes a shock at the self-
but smaller than the net inflow rate at radii Rp < r < Rinj .           intersection point but also deposits angular momentum. This
At the point that the accretion rate saturates (t > 30, 000 tg          pushes the incoming gas out to larger orbits, which leads to
for e99_b5_01 and t > 50, 000 tg for e99_b3_01), the total              weaker precession and then subsequent self intersection at

                                                                                                                 MNRAS 000, 1–21 (2021)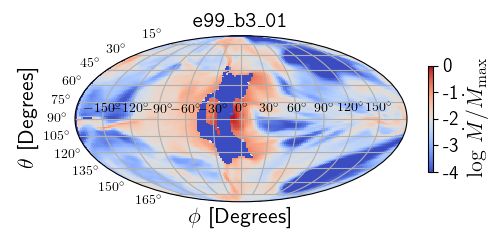
8     Brandon Curd

Figure 3. Here we a snapshot of the gas density (colors) for a slice
through the mid plane (θ = π/2) for e99_b3_01 at t = 60, 000 tg .
The scale of each image is 400rg × 400rg and the BH is centered
in the image.

                                                                        Figure 5. Here we show the mass weighted eccentricity (top) and
                                                                        density scale height of the disk (bottom) at 6 epochs for e99_b5_01.

Figure 4. Here we show time and azimuth averages of the gas
density (colors) and fluid velocity (orange arrows) for e99_b5_01
(left) and e99_b3_01 (right). Each figure is averaged over 59, 000 −
60, 000 tg . The disks are of similar thickness, and the density max-
imum of the disk is near the pericenter radius since the stream still
passes through the disk. Interestingly, e99_b5_01 appears to have
an outflow near the poles while for e99_b3_01 material is falling
inwards near the poles.

larger radii. However, self intersections at larger radii trans-
fer momentum less efficiently, so the incoming stream is then                  Figure 6. The same as Figure 5 but for e99_b3_01.
able to return to its original orbit and undergo stronger rel-
ativistic orbital precession, thus resetting the feedback loop.
The period of the feedback loop is determined by the radius             means that more kinetic energy is available for dissipation
at which the collision occurs. For e99_b5_01, the Keplerian             in the self intersection. Lu & Bonnerot (2020) show that
radius associated with the feedback period is ≈ 65 rg , which           close disruptions launch a more energetic, higher velocity
falls within the region we identify with self-intersection (Fig-        outflow and that the fraction of gas in the outflow that be-
ure 1). For e99_b3_01, the period is P ≈ 8400 tg which cor-             comes unbound is sensitive to the impact parameter. They
responds to a Keplerian radius of ≈ 121 rg .                            predict that the critical BH mass above which more than
   We note that our simulations appear to predict a rather              20% of the inflowing gas becomes unbound for a β = 5 dis-
large outflow at the peak outflow rate (nearly 45% of the               ruption is Mcr ≈ 3 × 10⁵ M while for a β = 3 disruption
injected mass) for a 106 M mass BH. This is owing to the                Mcr ≈ 7 × 10⁵ M . While our simulations exceed this esti-
larger impact parameter (β = 3, 5) in our simulations, which            mated critical mass, we caution that Lu & Bonnerot (2020)

MNRAS 000, 1–21 (2021)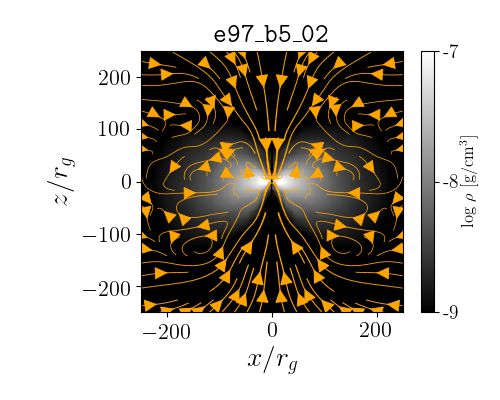
Eccentric TDE Disks in GRRMHD                           9

Figure 7. Here we show the inflow rate of mass crossing the horizon
(top) and the outflow rate of mass crossing r = 1000 rg (bottom)       Figure 8. Here we show the mass outflow of unbound gas (Be > 0)
for e99_b5_01 (black lines) and e99_b3_01 (red lines). Note that       for e99_b5_01 (top panel) and e99_b3_01 (bottom panel) at each
for the outflow rate, we show both the total outflow (solid lines)     point on a spherical surface at r = 1000 rg for a snapshot of the
and the unbound component (dashed lines). Inflow/outflow rates         simulation at t = 30, 000 tg . We normalize the outflow rate at each
are scaled by the peak injection rate given in Table 1. The initial    point by the maximum outflow rate on the surface.
inflow rate of e99_b5_01 is nearly twice that of e99_b3_01, reflect-
ing the much more efficient circularization. The total mass outflow
rates are similar throughout. However, the amount of gas that is
unbound drops over time in e99_b3_01 while e99_b5_01 unbinds
nearly 100% of its outflow.

provide estimates based on streams with the binding energy
for an e = 1 disruption. Our streams are more bound owing
to the choice of e = 0.99, so the corresponding critical mass
for this work is likely slightly higher than the values above.
Nevertheless, the fact that both simulations initially unbind
far more than 20% of the shocked gas suggests that the cor-
responding critical mass for our choice of parameters is lower
than the BH mass of 106 M that we employ. The precise
fraction of gas that becomes unbound is not provided by Lu             Figure 9. The same as Figure 8 but for e99_b3_01 at t = 60, 000 tg .
& Bonnerot (2020) for the parameters in the present work;
however, e99_b5_01 and e99_b3_01 appear to eject a similar
amount of mass at the peak outflow rate (Figure 7) despite             occurs at φ ≈ 180◦ . The poles are situated at θ = 0◦ and
the difference in impact parameter, β.                                 180◦ . We find that the majority of the unbound outflow dur-
   We note that it is possible that the use of the Bernoulli           ing the peak outflow rate is directed radially away from the
number to track unbound gas could in principle over estimate           self-intersection point, roughly back towards the stream in-
the mass of unbound gas in the outflow since the radiation             jection point, but subtending a significant solid angle around
component could simply escape once the gas becomes opti-               this direction. There is also a significant amount of gas flow-
cally thin and not get deposited in kinetic energy. However,           ing near the poles and near pericenter but it contributes less
we find that the specific binding energy alone is net positive in      than 10% of the total outflowing mass at the peak of the
the outflow where regions with positive Bernoulli have been            outflow.
identified, so we find that this result is consistent regardless          While the top panel of Figure 8 is representative of the
of whether or not radiation escapes.                                   unbound outflow in e99_b5_01 throughout its evolution, the
   We perform a Mollweide projection of the unbound outflow            outflow centered on θ ≈ 90◦ , φ ≈ 0◦ in Figure 8 is largely
through a spherical shell at radius r = 1000rg to display the          bound by the end of e99_b3_01 as shown in Figure 9. This
angular distribution of the outflow for a snapshot of the sim-         change is also apparent in Figure 7. While nearly half of the
ulation at t = 30, 000 tg (Figure 8). In the figure, the stream        injected gas becomes unbound throughout the entire evolu-
injection point is located at θ = 90◦ , φ = 0◦ , while pericenter      tion of e99_b5_01, in the case of e99_b3_01 the outflow rate

                                                                                                                MNRAS 000, 1–21 (2021)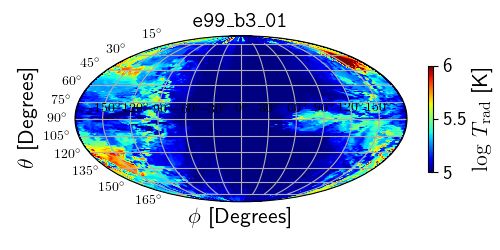
10      Brandon Curd

Figure 10. Here we depict the radiation temperature and photo-          Figure 11. The same as Figure 10 but for e99_b3_01 at t =
sphere of e99_b5_01 at t = 60, 000 tg . We show cross sections of the   60, 000 tg . The stream is injected at x = 400rg , y = z = 0.
radiation temperature (colors), photosphere (blue line), and pho-
ton trapping surface (red dashed line) for the equatorial plane (top
panel) and an aziumuthal slice that intersects the injection point      sion timescale in the accretion disk and outflow to confirm
and pericenter (bottom). The stream is injected at x = 200rg ,          this picture.
y = z = 0.
                                                                           For the accretion disk in e99_b5_01 and e99_b3_01, we
                                                                        estimate the time scales for diffusion and advection within
                                                                        the disk (i.e. regions within H/R = 0.4 for radii r < 100 rg )
of unbound gas drops to nearly 5-10% of the mass injection              as tdif,disk ≈ 3τz (H/R)R and tadv = R/vin . More succinctly,
rate by the end of the simulation (Figure 7). This change in            tdif,disk /tadv ≈ 3τz (H/R)vin . Here (H/R) is the density scale
behaviour is due to the stream deflection described above.              height of the disk (which is approximately 0.4, shown in Fig-
Due to the lower β, the change in collision radius during pe-           ures 5 and 6), τz is the vertically integrated optical depth
riods of stream deflection lead to a large enough decrease              through the disk, and vin is the inflow velocity. The opacity
in dissipated kinetic energy as to substantially decrease the           is estimated using the Thomson scattering opacity, which is
fraction of mass that becomes unbound.                                  κes = 0.34 cm2 g−1 for Solar metallicity. We compute the
                                                                        vertically integrated optical depth as:
                                                                               Z H
                                                                        τz =         ρκes dz.                                       (22)
4.4 Radiation Properties                                                      0

As we discuss in §5, radiation plays an important role in the           For all times after the disk has begun to form (i.e. after the
gas dynamics. The typical picture in super-Eddington accre-             initial peak in the accretion rate in Figure 7), the general de-
tion flows is that radiation is trapped and advected with the           scription of the diffusion and advection times in the following
gas within the optically thick accretion flow, but it can dif-          calculation holds.
fuse more effectively in the outflows. We estimate the diffu-              For radii within r < 20rg the inflow velocity, vin , increases

MNRAS 000, 1–21 (2021)
Eccentric TDE Disks in GRRMHD 11
towards the BH horizon with a minimum value of 2 × 10⁻² c
and a maximum of 0.6c. For r > 20 rg the inflow velocity
is nearly constant with a value of 2 × 10⁻² c. The vertically
integrated optical depth for both e99_b5_01 and e99_b3_01
ranges between 200 < τ < 500 in the forming disk. As a con-
sequence, we find that tdiff /tadv ≈ 4.8 − 12 for radii r > 20rg
while for r < 20rg the ratio increases rapidly. While the ratio
is not significantly larger than unity, it suggests that within
the forming disk, since the inflow velocity is quite large, ad-
vection is the primary radiative transport mechanism.
Outside of the inner accretion disk, the dynamical time is
tdyn = v/R where v is the gas velocity and the diffusion time
is estimated using the radially integrated optical depth:
Z Rmax
τes (R) ≡ ρκes dr, (23)
R
such that tdif,outflow = τes (R)R. The structure of the outflow’s
trapping surface, where the diffusion and dynamical time are
equal, is quite asymmetrical (red dashed line in Figures 10
and 11). Note that for regions interior to the trapping surface
contour tdiff /tadv > 1 while the opposite is true outside of
it. In general, gas near pericenter exhibits a trapping surface
that is close to the radial boundary of the forming disk (100−
200rg ). Outside of this surface, radiation can decouple from
Figure 12. Here we show the photosphere radius (top) and bolo- the gas. On the opposite side of the BH the trapping surface
metric luminosity (bottom), both in physical units, for e99_b5_01 is almost as distant as the photosphere. The fact that gas
and e99_b3_01. In the top panel, we show the minimum (dashed
is able to diffuse near pericenter perhaps explains the weak
line) and maximum (solid line) photosphere radius over time. The
minimum photosphere radius (top panel) shows occasional dips
outflows of gas near pericenter (φ ≈ ±π) in Figure 8.
during epochs where gas at the poles is infalling and the photo- We begin our discussion of the emitted radiation by de-
sphere radius consequently decreases. scribing the photosphere. At each (θ, φ), we integrate radially
inward from Rmax to find the photosphere radius Rph defined
by:
Z Rmax
2
τes (Rph ) ≡ ρκes dr = , (24)
Rph 3
where Rph is the radius at which the optical depth is equal
to 2/3. As we show in Figures 10 and 11, the photosphere of
e99_b5_01 and e99_b3_01 is highly asymmetric and irregu-
larly shaped. The radiation temperature at the photosphere
maintains a nearly constant value of 105 K over the simu-
lation. In general, the photosphere radius is closest to the
accretion disk near pericenter and near the poles while on
the other side of the BH, the side where the self-intersection
occurs, the photosphere radius is much larger.
We obtain the bolometeric luminosity directly from the
radiation stress energy tensor by integrating over the pho-
tosphere. The radiation luminosity is taken as all outgoing
rays of radiative flux at the electron scattering photosphere
(Rτ =2/3 ):
Z 2π Z π
√
Lbol = − −gRtr dθdφ. (25)
0 0
These rays are assumed to reach a distant observer. We show
the minimum/maximum photosphere radius as well as the
radiant luminosity in Figure 12. The bolometric luminosity
is mildly super-Eddington in both e99_b5_01 and e99_b3_01.
Figure 13. Here we show the projection of the radiation temperature
at the thermalization surface (Rth ) for e99_b5_01 (top panel) and We note that e99_b3_01 exhibits a slightly lower luminosity
e99_b3_01 (bottom panel) along each line of sight at t = 60, 000 tg . over its evolution owing to the less energetic self intersection
The figure is discussed in the text. which largely characterizes the energetics of the event.
The radiation temperature at the photosphere of . 105 K
is significantly hotter than that observed in optically identi-
fied TDEs, where typical temperatures are on the order of
MNRAS 000, 1–21 (2021)12 Brandon Curd
∼ (1 − few) × 104 K. However, the duration of time that The estimated efficiency is then η ≈ 0.15ηNT ≈ 0.014. For
we simulate, which is only 3.5 days, may be more analogous e99_b3_01, we find η ≈ 0.15ηNT ≈ 0.009 using a similar ap-
to the beginning of the flare during the rise to peak. For proach.
instance, ASASSN-19bt exhibited bright UV emission with An ongoing curiosity of optically identified TDEs is that
a temperature peak of T ≈ 104.6 K which then decayed to they appear to be either extremely radiatively inefficient, or
T ≈ 104.3 K over several days (Holoien et al. 2019). This they only accrete a small amount (some TDEs suggest only
may indicate that some TDEs in fact start out with hotter 1% at minimum) of the stellar mass that is bound to the BH
emission and quickly cool as the photosphere expands. (Holoien et al. 2014, 2019, 2020). An interesting example is
The geometry of the photosphere is particularly interest- ASASSN-14ae, for which Holoien et al. (2014) estimate the
ing. We find that the minimum photosphere radius (which mass needed to power the observed line emission is at least an
occurs close to pericenter) is only Rph ≈ 3 − 6 × 1013 cm order of magnitude higher than the minimum mass accretion
above and below the disk at late times (see Figure 12). This to power the continuum emission, suggesting a lower radia-
may be an ideal geometry for viewing angle dependent X-ray tive efficiency. Our simulation suggests that around 10-20% of
emission. The radiation temperature in Figure 11 is only ap- the inflowing material actually manages to accrete via an ac-
proximate without detailed radiative transfer, and for such cretion flow while the disk is forming. If the prompt emission
small photosphere radii in the pericenter direction it may be from optical TDEs is thermal emission from the self intersec-
possible for X-rays to reach the photosphere before being ab- tion outflow, the radiative efficiency is indeed expected to be
sorbed, thus emerging as visible radiation. Meanwhile, for an low.
observer viewing the photosphere from the equatorial plane We note that the omission of the magnetic fields in
at the point where the photosphere radius is largest, the X- e99_b5_01 and e99_b3_01 may impact the above result as
rays are expected to be completely absorbed. the turbulence sourced by the MRI may lead to higher ac-
The radiation temperature in the inner accretion flow cretion rates. However, as we discuss in §5, our runs which
reaches Trad ≈ 106 K. In regions where there is not much included the magnetic field replicate the results obtained by
absorption, hot emission may diffuse and reach the scatter- Sa̧dowski et al. (2016a), who showed that hydrodynamical
ing surface. As we do not carry out detailed ray tracing to viscosity dominates the gas dynamics.
determine the frequency dependent spectrum of the accretion
flow, we estimate the emerging photon energy by accounting
for the effects of bound-free absorption along radial trajec- 5 LESS ECCENTRIC MODELS
tories. We did not directly include the effects of bound-free
absorption during the evolution of the simulation, so we per- In the previous section we discussed our primary simulations,
form a post processing of the simulation data taking this e99_b5_01 and e99_b3_01, which correspond to tidal disrup-
additional source of opacity into account. We adopt the gray tions of stars on highly eccentric orbits with e = 0.99. Here
approximation of the absorption due to metals (κbf ) in the we discuss briefly the evolution of less eccentric models with
atmosphere via the model of Sutherland & Dopita (1993) e = 0.97 and β = 5. These simulations were performed to
and assume a Solar metal abundance for the gas. To test the compare the method of injection with previous work done
possibility of X-ray emission, we Rfind the using more bound stars and to illustrate the effects of radi-
∞ p thermalization ra-
dius (Rth ) by computing τeff = R ρ κabs (κes + κabs ) dr, ation in comparison to pure hydrodynamics. In e97_b5_01,
th
where κabs = κbf + κff . In general, the thermalization radius we include the magnetic field to examine if the magnetic field
is smaller than the photosphere radius and near pericenter it becomes dynamically important. We also set the spin of the
comes within < 100 rg of the inner accretion flow along some BH to a∗ = 0.9 to confirm that a jet is not produced dur-
lines of sight. We perform a Mollweide projection of the ra- ing the disk formation if a weak field is present in the TDE
diation temperature (Trad ) at the thermalization radius as a stream. We compare it with e97_b5_02 to illustrate the im-
function of viewing angle for e99_b5_01 and e99_b3_01 at pact of radiation for extremely optically thick TDE disk sim-
t = 60, 000 tg (Figure 13). In regions where the most gas ulations when radiation is included versus pure hydrodynam-
blocks the line of sight and the photosphere radius is near ics. In e97_b5_03 and e97_b5_04, the disruption properties
its maximum (φ ∼ 0◦ in Figure 13), the radiation temper- are the same as in e97_b5_01 and e97_b5_02 but we inject
ature is Trad ≈ 105 K. Near pericenter (φ ∼ ±180◦ in Fig- only 0.04 M . These simulations illustrate the impact of radi-
ure 13), and especially above/below the equatorial plane, the ation in less dense atmospheres on the outflow and accretion
radiation temperature is much hotter and reaches a typical rate. We also compare the disk properties with previous sim-
temperature of Trad ≈ 3 − 5 × 10⁵ K and some regions reach ulations of TDE disks.
106 K. This treatment is only approximate, but suggests that We note that the magnetic field is not relevant for com-
close (β ≥ 3) TDEs around lower mass BHs may be sources parison with models described in §4 nor other simulations in
of soft X-rays near the peak emission. this section, as will be discussed later in this section.
The radiative efficiency for each simulation is computed as:
−1 5.1 Dynamics
Lbol Ṁin
η = ηNT , (26) As described in §3, the TDE stream is injected for a finite
LEdd ṀEdd amount of time. In the simulations of e = 0.97 TDEs, the tail
where ηNT is defined in Equation 2. We use the average lumi- end of the stream is injected at t = ∆tinj = 14, 467 tg , but
nosity and accretion rate for the final 5, 000 tg for each simu- we evolve the simulation beyond this point. The evolution
lation. For e99_b5_01, the radiative luminosity is of the order during the stream injection phase is similar to the higher
Lbol ≈ 5 LEdd and the mean accretion rate is Ṁin ≈ 20 ṀEdd . eccentricity models discussed in §4. We note that due to the
MNRAS 000, 1–21 (2021)Eccentric TDE Disks in GRRMHD 13
Figure 15. Here we show the mass density (left and right) for
Figure 14. Here we show the mass density (left) and radiation en- e97_b5_02 at t = 60, 000 tg (top panel) and e97_b5_05 at t =
ergy density (right) for e97_b5_01 at t = 40, 000 tg (top panel) 60, 000 tg (bottom panel). The orange arrows indicate the gas ve-
and e97_b5_03 at t = 60, 000 tg (bottom panel). The orange ar- locity. We discuss the figures in the text.
rows indicate the gas velocity (left) and the white arrows indicate
radiative flux (right). We discuss the figures in the text.
lower eccentricity, the stream thickness in the orbital plane is
slightly larger than the simulations discussed in §4. This leads
to slightly more expansion of the gas as it passes through
pericenter.
As long as the stream is present, new gas with high ec-
centricity is supplied to the disk and the mean eccentricity
remains close to the initial value injected. The self intersec-
tion shock leads to significant dissipation and a circularized
disk fills radii up to r < 100 rg . There is prompt accretion
both through the accretion disk and of material that directly
accretes onto the BH at angles above/below the disk. This
is indicated for e97_b5_01 by the velocity vectors directed
towards the BH near the pole in Figure 14.
After the stream injection ends, the already mildly circu-
larized disk material continues to interact and circularize. By Figure 16. We show an equatorial slice of the gas density at t =
the end of each simulation, the disk has stopped evolving in 60, 000 tg for e97_b5_03. There are spiral density waves present
terms of its eccentricity and has settled into a disk of nearly and the disk retains asymmetry owing to its eccentricity.
uniform scale height. We show the azimuth averaged vertical
structure of the final stage for each simulation in Figures 14
and 15. We also show the equatorial plane for e97_b5_03 in
Figure 16.
MNRAS 000, 1–21 (2021)You can also read