Stream Health & Water Quality in the Long Tom Watershed 1999 2006
←
→
Page content transcription
If your browser does not render page correctly, please read the page content below
Stream Health & Water Quality
in the Long Tom Watershed
1999 – 2006
This page intentionally left blank
Stream Health and Water Quality in the
     Long Tom Watershed: 1999 – 2006

                                       Prepared by

                       Cindy Thieman, Monitoring Coordinator
                         Long Tom Watershed Council
                                    751 S. Danebo Ave.
                                    Eugene, OR 97402
                                     www.longtom.org

                                     with support from

              Oregon Watershed Enhancement Board
            Oregon Department of Environmental Quality
             Long Tom Watershed Council contributors

                                          April 2007

Citation
Bibliography
Thieman, C. 2007. Stream Health and Water Quality in the Long Tom Watershed, 1999–2006. Eugene
(OR): Long Tom Watershed Council. Technical Report No. 2007-M-01. 2007. 36 p.

In Text:
(Thieman 2007)
This page intentionally left blank
Stream Health and Water Quality in the Long Tom Watershed: 1999 - 2006

Table of Contents
ACKNOWLEDGEMENTS ....................................................................................................................... 3

SUMMARY OF MAJOR ISSUES AND FINDINGS .............................................................................. 4

INTRODUCTION....................................................................................................................................... 5

BACKGROUND ON THE WATERSHED .............................................................................................. 6

ECOREGIONS ................................................................................................................................................ 6
LAND USE ..................................................................................................................................................... 6
PRECIPITATION ............................................................................................................................................ 7
WATER USE .................................................................................................................................................. 7
FISH AND AMPHIBIANS ................................................................................................................................ 8

MONITORING QUESTIONS AND STUDY DESIGN ........................................................................ 10

PHYSICAL AND CHEMICAL WATER QUALITY INDICATORS ................................................................... 11
MACROINVERTEBRATE AND PHYSICAL STREAM HABITAT SURVEYS ................................................... 12

METHODS ................................................................................................................................................ 13

PHYSICAL AND CHEMICAL WATER QUALITY MEASUREMENTS ............................................................ 13
MACROINVERTEBRATE AND PHYSICAL STREAM HABITAT SURVEYS ................................................... 14

QUALITY ASSURANCE ........................................................................................................................ 15

TRAINING ................................................................................................................................................... 15
PRECISION AND ACCURACY LEVELS ........................................................................................................ 15

WATER QUALITY RESULTS............................................................................................................... 16

TEMPERATURE AND DISSOLVED OXYGEN ............................................................................................... 16
BACTERIA ................................................................................................................................................... 20
CONDUCTIVITY AND PH ............................................................................................................................ 22
TURBIDITY ................................................................................................................................................. 22
NUTRIENTS ................................................................................................................................................. 24

MACROINVERTEBRATE AND PHYSICAL HABITAT SURVEY RESULTS.............................. 28

                                                                          -1-
Stream Health and Water Quality in the Long Tom Watershed: 1999 - 2006

CONCLUSIONS ....................................................................................................................................... 33

REFERENCES.......................................................................................................................................... 35

APPENDIX A. LONG TOM WATERSHED COUNCIL VOLUNTEER MONITORING INSTRUCTIONS
APPENDIX B. DEQ BENTHIC MACROINVERTEBRATE PROTOCOL FOR WADEABLE STREAMS
APPENDIX C. ABR SUMMARY REPORT
APPENDIX D. LONG TOM WATERSHED COUNCIL MACROINVERTEBRATE SAMPLING
     INSTRUCTIONS, DATA SHEET, AND DEQ HUMAN DISTURBANCE INDEX
APPENDIX E. SEASONAL KENDALL AND T-TEST ANALYSES AND RESULTS
APPENDIX F. PERCENT OF SAMPLES NOT MEETING STATE STANDARDS OR GUIDELINES

                                                                     -2-
Stream Health and Water Quality in the Long Tom Watershed: 1999 - 2006

Acknowledgements
This study was funded by grants from the Oregon Watershed Enhancement Board and the
Department of Environmental Quality as well as support from Long Tom Watershed Council
contributors. It was also made possible by hundreds of volunteer hours. The Long Tom
Watershed Council and Monitoring Coordinator wish to thank the funding agencies that made
this study possible and the dedicated volunteers and interns listed below.

Rolf Anderson                       Len Gillette                           Lane-Metro Youth Corps
Stephanie Astorino                  Andy Gilmore                           Lucy Murr
Paul Atkinson                       Cathy Glaudin                          Liz Myers
Nancy Blum                          Jules Gordon                           Allison Nabours
Cathy Boucher                       Brian Greene                           Eric Osborn
Jonathan Brown                      Nancy Hafner                           Chris Pendergrass
Jack Detweiler                      Bob Hager                              Jim Pendergrass
John Dillard                        Earl Hain                              Will Peters
Carl DiPaolo                        Brian Issa                             Sharmila Premdas
Barbara Dumesnil                    Michael James                          Lori Quillen
Jackie Fern                         Lafona Jensen                          Paul Reed
Adam Fleenor                        Andy Lanier                            Brad Schallert
Lita Furby                          Dawn Lesley                            Michele Stowe
Jenny Getty                         Bart Melton                            Andy Strickland

A number of scientists significantly improved the scope, quality, statistical validity, and data
analyses for this study. We wish to thank the following individuals for lending us their technical
expertise and for their commitment to citizen-based monitoring.

Phil Kaufman, Environmental Protection Agency, Western Ecology Division
Phil Larsen, Environmental Protection Agency, Western Ecology Division
Tony Olsen, Environmental Protection Agency, Western Ecology Division
Dave Peck, Environmental Protection Agency, Western Ecology Division
Tom Mendes, Environmental Data Analyst, City of Eugene
Karen Font-Williams, Department of Environmental Quality
Rick Hafele, Department of Environmental Quality
Steve Hanson, Department of Environmental Quality
Shannon Hubler, Department of Environmental Quality
Dave Huff, Department of Environmental Quality

The author would also like to thank Dana Erickson, Phil Larsen, Phil Kaufman, Tom Mendes,
Gary Nolan, Jim Pendergrass, and Mary Rae Thomson for reviewing a draft of this report; Jenna
Garmon for assistance with document preparation; and Brian Issa for creating the water quality
maps.

                                               -3-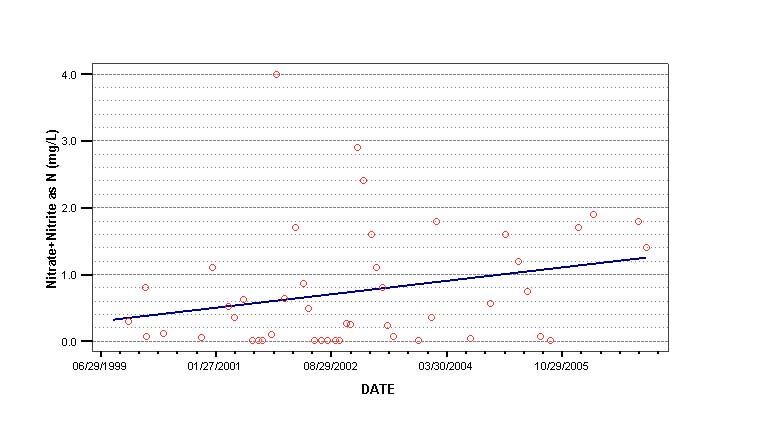
This page intentionally left blank
Stream Health and Water Quality in the Long Tom Watershed: 1999 - 2006

Summary of Major Issues and Findings
Water temperature and dissolved oxygen in most mid-elevation and lowland
stream reaches prevent cutthroat trout and other sensitive native species from
inhabiting them in the summer. (p. 16)
   x   Many lowland streams in the Long Tom Watershed reach lethal temperatures (22q C/72q
       F) for cutthroat trout during the warmest days of summer.
   x   Suitable temperatures and dissolved oxygen levels in the summer were found primarily in
       headwater streams.
   x   Restoring riparian areas to their natural potential could decrease instream temperatures by
       as much as 5q C.
   x   Stream gauge data show that summer flow in Coyote Creek decreased significantly
       between the 1930s and 1980s as surface water rights increased.
   x   Stream temperature models indicate that increasing stream flow could significantly
       reduce summer water temperatures in some parts of the watershed.
   x   Instream ponds have been documented to increase water temperature by as much as 8q C.

Bacteria concentrations do not meet state standards for the protection of
human health in several parts of the Watershed (p. 20).
   x   High concentrations of E. coli were found in upper Amazon Creek in Eugene, Ferguson
       Creek, and Bear Creek
   x   Moderate concentrations of E. coli were found in Poodle Creek, Fern Ridge Reservoir,
       and lower Amazon Creek.

Nutrient concentrations are highest in urban and agricultural stream
segments (p. 24)
   x   Seasonal average concentrations of total phosphorus were 1.5 to 4.5 times greater in
       lower Amazon Creek, which drains irrigated agricultural and urban land, than Coyote
       Creek, which drains forest and rural residential land.
   x   Seasonal average concentrations of nitrate during winter and spring were as much as 11
       times greater in lower Amazon Creek than Coyote Creek.
   x   Nitrate levels are increasing at sites in Bear Creek, Ferguson Creek, lower Amazon
       Creek, and the lower Long Tom River.

Diversity and abundance of aquatic macroinvertebrates varied with riparian
vegetation density and instream wood (p. 28)
   x   58% of stream miles in the Long Tom Watershed are in poor condition, 17% are in fair
       condition, and 25% are in good condition based on macroinvertebrate indices.
   x   Sites with dense, native riparian vegetation and good shade had higher macroinvertebrate
       scores.
   x   Sites with more instream wood had somewhat higher macroinvertebrate scores.

                                               -4-
This page intentionally left blank
Stream Health and Water Quality in the Long Tom Watershed: 1999 - 2006

Introduction
The water quality of streams and lakes is a significant concern to citizens both locally and
nationwide, and efforts to assess instream conditions have been conducted by many
organizations and public agencies. A recent study of wadeable streams conducted by the
Environmental Protection Agency (EPA) was the first to establish nationwide, baseline
conditions at a regional level (Stoddard et al., 2005). Researchers with the EPA found the best
instream conditions in the West, where 45% of stream miles were in good condition based on
macroinvertebrates. This compared to 29% in good condition for the Plains and Lowlands and
18% for the Eastern Highlands. Closer to home, the United States Geological Survey (USGS)
investigated surface and ground water quality in the Willamette Basin between 1990 and 1995.
USGS scientists found that nutrients and pesticides in streams are degrading water quality, and
that habitat and fish communities were most degraded in urban and agricultural study units
(Wentz et al., 1998).

The Oregon Department of Environmental Quality (DEQ) has been regulating and monitoring
water quality in the state since 1938 (www.oregon.gov/DEQ). Initially its mission was to
improve conditions in the Willamette that had been degraded by the discharge of untreated
sewage into the River. Over time the agency began regulating all point sources, requiring storm
water management plans for cities, and monitoring streams across the state. Now, streams that
do not meet water quality standards are placed on the 303(d) List of Water Quality Listed
Streams and the DEQ develops Total Maximum Daily Loads (TMDLs) for each listed water
quality attribute. These load limits are enforced through city storm water and industrial
discharge permits and water quality management plans implemented by the Oregon Departments
of Agriculture and Forestry. Recently, DEQ developed TMDLs for temperature, bacteria, and
mercury in the upper Willamette Basin as a result of many streams being listed for these
attributes.

As our population grows in the Willamette Valley, water quality problems are likely to intensify
as more land is converted from farms and forests to urban and rural residential landscapes. More
people will potentially mean more pollutants entering our streams and rivers; yet our
expectations for clean drinking water and healthy streams where people can fish, boat, and swim
will not decrease. Protecting these water resources starts with having an accurate understanding
of current conditions. This is what the Long Tom Watershed Council endeavored to do when it
began its monitoring program in 1999. Based on earlier monitoring conducted by the DEQ
(unpublished data), City of Eugene (unpublished data), Lane Council of Governments (1983),
and USGS (Rinella and Janet, 1998), we suspected low dissolved oxygen and high water
temperature, nutrient levels and bacteria to be problems in the watershed.

The findings of this 7-year study will enable the Council to target our watershed restoration and
enhancement efforts in areas of the watershed that need the most improvement. This information
will also allow us to promote better watershed stewardship by sharing the data directly with
landowners and collaborating on solutions to identified water quality and stream health
problems. Finally, results from the monitoring program have given us a comprehensive
understanding of conditions in the Watershed that we can share with local residents and policy-
makers alike.

                                               -5-
Stream Health and Water Quality in the Long Tom Watershed: 1999 - 2006
Background on the Watershed
The Long Tom River Watershed drains 410 square miles of land at the southern end of the
Willamette Valley. The headwaters of the Long Tom originate on the eastern side of the Coast
Range and flow south through forested hills and small farms until reaching Noti where the river
veers east near its confluence with Elk and Noti Creek. Coyote Creek, which drains the southern
portion of the basin, and upper Amazon Creek, which drains the eastern portion, both merge with
the upper Long Tom near what is now Fern Ridge Reservoir. The lower Long Tom starts at the
spillway of the reservoir and flows north approximately 25 miles before its confluence with the
Willamette River. Bear and Ferguson Creek, which drain from the Coast Range, and lower
Amazon Creek are the major tributaries entering the lower Long Tom River.
Ecoregions
An ecoregion is defined by a unique combination of physical geography, geology, climate, soils,
vegetation and land use (Omernik & Griffith 1991). Ecoregion designations are an important
tool for interpreting existing watershed conditions and setting appropriate goals for instream
habitat conditions, riparian zone conditions and water quality. The Long Tom Watershed
contains four ecoregions: Valley Foothills, Mid-Coastal Sedimentary, Prairie Terraces and
Willamette River and Tributaries Gallery Forest. The Valley Foothills and Mid-coastal
Sedimentary Ecoregions are within the foothills of the Coast Range. Near headwaters, stream
channels are confined within steep, narrow valleys, becoming more sinuous downstream where
the valleys widen. The underlying geology is mostly sedimentary rock with some igneous rock.
The combination of soft sedimentary rock and relatively high precipitation rates contributes to
higher erosion rates. Native vegetation in these ecoregions includes western hemlock, western
red cedar, Douglas fir, grand fir, big leaf maple, and red alder.
The Prairie Terraces Ecoregion covers most of the low gradient valley lands except for the Long
Tom River north of Monroe, which is part of the Willamette River and Tributaries Gallery Forest
Ecoregion. Historically, streams in these regions meandered across the valley floor and larger
streams were deeply entrenched in the thick sedimentary clay soils deposited by the Missoula
floods thousands of years ago. The native vegetation within the Prairie Terraces Ecoregion
includes white oak, ash, and a variety of shrubs, grasses, sedges, rushes, and forbs. Vegetation
of the Willamette River Gallery Forest includes cottonwood, alder, ash, bigleaf maple and
Douglas fir.
Land Use
Forestry, agricultural, urban, rural residential, and industrial are the primary land uses in the
watershed. Table 1 shows the proportion of land uses in each sub-watershed and their total
acreage.1 Eighty-eight percent of the watershed is privately owned with parcels ranging from
less than one to several thousand acres.
1
Land use acreage was determined from state-wide zoning maps.
-6-Stream Health and Water Quality in the Long Tom Watershed: 1999 - 2006
Table 1. Sub-watershed Land Use
Sub-basin Agri- Forestry Urban Rural Parks Rural Other Total
culture Resident & Rec. Industry Acres
Upper Long 8% 80%Stream Health and Water Quality in the Long Tom Watershed: 1999 - 2006
There are no instream water rights in the Long Tom Watershed. This means that no minimum
flow is required for the protection of fish and other aquatic organisms. Typically, this has not led
to streams going completely dry in the summer, but water withdrawals appear to have had an
increasingly significant impact on summer water levels. For example, Figure 1 shows minimum
flows for each water year and cumulative water rights in Coyote Creek between 1933 and 1987.
Increasing ground water withdrawals and land use changes may also have contributed to the
decrease in Coyote Creek’s summer flow.
Cumulative Point of Diversion Surface W ater Rights above gage
and n -day moving window minimum flows at Coyote Creek Gage
USGS Gage 14167000 at Crow, Oregon
(n = 1, 3, 7 days)
1.4
14
n -day minimum flow (cfs)
1.2
Permitted rights (cfs)
12
1
10
0.8
8
6 0.6
4 0.4
2 0.2
0 0
1-Jan-30
2-Jan-35
3-Jan-40
3-Jan-45
4-Jan-50
5-Jan-55
6-Jan-60
6-Jan-65
7-Jan-70
8-Jan-75
9-Jan-80
9-Jan-85
10-Jan-90
Figure 1. Cumulative water rights (left axis; blue line) and n-day minimum flows (right axis; red, orange,
green lines) for Coyote Creek at Crow, Oregon. Minimum flow is the lowest value recorded for a
consecutive n-day period anywhere within the water year. The 1, 3, and 7-day minimum flows are shown
in orange, red, and green, respectively. Graph courtesy of John Bauer, The Nature Conservancy
Fish and Amphibians
The Long Tom Watershed is home to a variety of fish and wildlife that rely on its network of
streams, lakes and wetlands. Some of these species are particularly sensitive to water quality
conditions such as water temperature, dissolved oxygen, and sediment levels. Native fish
sensitive to poor water quality include cutthroat trout, paiute, torrent and riffle sculpin, mountain
whitefish, and Pacific lamprey. Currently, no fish species that spawn in the Long Tom
Watershed are on the federal list of Threatened and Endangered Species. Historically, however,
Oregon chub inhabited the watershed, and this species is currently listed. In addition, the Oregon
Department of Fish and Wildlife (ODFW) considers the lower Long Tom River below Monroe
as suitable and likely winter rearing habitat for juvenile Spring Chinook (Galovich, pers.comm.).
Native amphibian species that are sensitive to poor water quality include red legged frog,
southern seep salamander, and tailed frog.
-8-Long Tom Watershed Ten Major Subbasins
W
Monroe
ILL
A
M
E TT
LOW ER
E RIV
LON G
·
Æ
Territorial Rd
·
Æ
ER
F erg uso
n 99W 99E
TOM
Cr
e
e
k
FERG USO N CREEK
Ferguson Rd.
¦
¨
§
Turnbow
I- 5
r
m R i ve
Junction City
n s C reek
Ow e High Pass Rd
To
ng
Lo
·
Æ
36 BEAR CREE K
·
Æ
36 W IL
LA
ME
Creek T
ea LOW ER
B
es r C r e ek
TE RIV E R
Jo n
UP PER
LON G
LON G Swamp C r
Ha
eek
yes
TOM LOW ER
Cr
eek
TOM e k
Cre
e et
Sw FERN AMAZO N
Poodle Creek Rd
ELK RI D G E CRE EK
P
d
lR
ar
ke
ria
CREE K Cr
r
rit o
Gre en C ee
reek k
r
Te
·
Æ ·
Æ UP PER AMAZO N
k
126
ee
126
Not i Cr
Veneta
Am
a z o n C r ee k
FERN CRE EK
D ive
Vaugh Rd
.
Eugene
r sion
nR d. RI D G E Cr
o w
C ana
k
ek
ee
l
Cr e
Cr
Co y ote
C e dar
penc e r Cr
e ek
S
SPEN CER CREEK
re ek COYO TE
eC
tl
B at
CRE EK
ox Hol lo w
F
y
e Hw
ek
re
C
er
n
av
Lora
´
Be
k
ee
D o ak C
r
Rebe l
Cre ek
k
0 1 2 4
C ree
Miles
on
s
ck
Ja
Source: Long Tom Watershed Council. Brian Issa 11/03Stream Health and Water Quality in the Long Tom Watershed: 1999 - 2006
Monitoring Questions and Study Design
In the initial phase of this study, from September Phase 1 Monitoring Questions
1999 to June 2003, our goals were to characterize
water quality in each sub-watershed and Do streams in the Long Tom
investigate the relationship between water quality Watershed meet state water quality
and land use. Our specific questions were: “Do standards?
streams in the Long Tom Watershed meet state
water quality standards?,” “Do they provide Do they provide sufficient water
sufficient water quality for the most sensitive quality for the most sensitive beneficial
beneficial uses of surface waters?,” and “How uses of surface waters?
does water quality correlate with land use in the
watershed?” To answer these questions we How does water quality correlate with
selected 18 monitoring sites around the land use in the watershed?
watershed, which included the mouths of each
sub-watershed, junctures between different land
uses, and varying elevations and stream sizes in the watershed. Results from this first phase of
monitoring are summarized in Water Quality in the Long Tom River Watershed: 1999-2003
(Thieman, 2003), which can be found at www.longtom.org.
Towards the end of our Phase 1 study we began sharing water quality results at Council meetings
and with small groups of landowners that had streams and wetlands on their property. At the
same time, we began working with private
landowners to enhance or restore streams and Phase 2 Monitoring Questions
wetlands. Out of this, we realized a need for more
spatially detailed water quality data and information
What proportion of our streams are
on the biological condition of our streams.
in poor, fair, and good biological
condition compared to reference sites
Our goals in the second phase of monitoring were
for the region?
to characterize the biological health of our streams
using benthic macroinvertebrates, narrow in on the
Where should we target our efforts at
spatial extent of water quality problems identified
improving known water quality
in Phase 1, begin to assess trends in water quality
problems?
over time, and provide focus for our restoration and
enhancement efforts. Our specific questions were:
What are the likely causes of poor
“What proportion of our streams are in poor, fair,
biological condition?
and good biological condition compared to
reference sites for the region?,” “Where should we
What areas of the watershed have
target our efforts at improving known water quality
high water quality and biological
problems?,” “What are the likely causes of poor
integrity?
biological condition?,” and “What areas of the
watershed have high water quality and biological
integrity?” To answer these questions we expanded our network of water quality monitoring
sites, collected macroinvertebrates at randomly selected locations, and measured physical habitat
quality at a sub-set of the macroinvertebrate sites.
- 10 -Stream Health and Water Quality in the Long Tom Watershed: 1999 - 2006
Physical and Chemical Water Quality Indicators
Table 2 summarizes the sampling frequency, data collector and general method for each
indicator.
Table 2. Physical & Chemical Water Quality Indicators & Sampling Frequency
# of Indicator General Data collection Comments
Sites Sampling responsibility
Frequency
71 Continuous Hourly: June – Monitoring Some of these sites were
Temperature October coordinator monitored multiple summers
and others were monitored
only one summer.
19 Single Reading Monthly Volunteers Monthly temperature,
Temperature turbidity, conductivity, &
19 Turbidity Monthly Volunteers dissolved oxygen were
measured monthly for almost
19 pH Monthly Volunteers 7 years at 16 sites, and every
month for 2 - 3 years at 3
19 Dissolved Monthly Volunteers additional sites. pH was
Oxygen measured once/month at 17
sites for 3 years. Starting in
19 Conductivity Monthly Volunteers
Fall of 2003, dissolved
oxygen was not measured
December through March.
29 E. coli Monthly (9/99- Monitoring E. coli data were collected at
6/03) Bi-monthly coordinator 29 sites. From September
(11/03 – 12/06) 1999 to June 2003 an
average of 18 sites were
sampled once/month; from
July 2003 to December 2006
29 sites were sampled once
every two months. In
addition, samples were
collected 5 times each
quarter within a 30-day
period at 17 sites from April
2000 to May 2001, allowing
us to evaluate these sites
based on DEQ’s 30-day
average standard.
30 Total Phosphorus Monthly (1999- Monitoring
2003) Bi-monthly coordinator
(2003 – 2006)
32 Nitrate Monthly (1999- Monitoring
2003) Bi-monthly coordinator
(2003 – 2006)
- 11 -Stream Health and Water Quality in the Long Tom Watershed: 1999 - 2006
Macroinvertebrate and Physical Stream Habitat Surveys
Benthic macroinvertebrates are organisms that lack backbones and are larger than ½ millimeter
long. They are aquatic for part or all of their life cycle, and can be found on rocks, wood, algae,
or other surfaces within a stream. Examples are crayfish, clams, snails, aquatic worms, and the
larval stage of dragonfly and caddisfly. We selected this group of organisms as an indicator of
the biological health of streams for several reasons. First, macroinvertebrates exist in all types of
streams and are not affected by the physical barriers that fish are susceptible to. Also unlike fish,
they cannot leave a stream when conditions are poor and return when they are better. Second,
they possess a range of sensitivities to pollutants and other stressors in the environment like
water temperature, riparian conditions, and stream bottom characteristics. Third, they are
relatively sedentary and live in a stream over a long period of time, so they reflect conditions in
the water that might not be detected by water quality samples that are collected at discrete points
in time. Finally, they help answer the question: “Does water quality support diverse and healthy
populations of organisms?”
Our objective in selecting a macroinvertebrate study design was to quantify instream conditions
at a watershed and sub-watershed level. We used a statistically valid, probability-based design
stratified by sub-watershed, which enabled us to assess the percentage of stream miles in each
sub-watershed that were in good, fair, or poor condition compared to reference site conditions.
To detect potential differences among the 10 sub-watersheds in the Long Tom, we needed
approximately 10 sites on average in each sub-watershed. The USEPA’s research division in
Corvallis, OR designed the survey by selecting a spatially balanced random set of sites in each of
the sub-watersheds. The set of sites consisted of 100 base sites and an additional 200 as back up
to be used when one of the original 100 sites could not be sampled. Descriptions of the design
process can be found at www.epa.gov/nheerl/arm.
We collected physical habitat measurements for a number of riparian and instream characteristics
that can affect macroinvertebrates directly or indirectly. Shade was selected due to its influence
on stream temperature. Presence of trees and density of understory and ground cover relate to
the amount of leafy material available for consumption by macroinvertebrates and the relative
amount of human disturbance. Streambed material can also influence the type of
macroinvertebrates present because of feeding and attachment methods. Thalweg depth, a
measurement of the deepest point in the stream taken every 1 meter or so, indicates the diversity
of stream habitat types (e.g., pools, riffles) and the total amount of aquatic habitat at a site. The
amount and size of instream wood also influences stream habitat types and the stream’s
resistance to flow (hydraulic roughness). This last point is significant, because high velocities
can scour the streambed to the point that macroinvertebrates and smaller bed material, such as
sand and gravel, get washed downstream.
- 12 -Stream Health and Water Quality in the Long Tom Watershed: 1999 - 2006
Methods
Physical and Chemical Water Quality Measurements
Measurements of stream temperature, pH, turbidity, conductivity and dissolved oxygen were
conducted using the standard protocols described in the Oregon Plan for Salmon and Watersheds
Water Quality Monitoring Technical Guidebook (1999). Appendix A includes specific
instructions given to volunteers for conducting each measurement. Table 3 lists equipment
specifications and analytical methods for both field and laboratory measurements.
Volunteers measured and recorded water temperature, pH, conductivity, dissolved oxygen, and
turbidity in the field on a monthly basis. One exception to this is that beginning in August 2001
pH measurements were made at the Council office. Volunteers collected water samples in dark
bottles, placed them in a cooler on ice, and took them back to the Council office. The
monitoring coordinator then measured the pH within 24 hours. We made this change because of
poor accuracy and precision levels when using the pH meters out in the field.
Surface water samples for E. coli and nutrients were collected either directly from the stream or
by drawing a bucket of water from a bridge above the stream. The former method was used
when streams were wadeable in the summer; the latter when stream flows were high in the
winter. We placed samples inside a cooler with ice and delivered them to a local laboratory
Table 3. Specifications for Monitoring Equipment and Analytical Methods
Indicator Equipment/Method Container Preservation Holding Time
Water Temperature: NIST Traceable Instream or N/A immediately
Single Reading Thermometer on bucket
Conductivity Meter
Water Temperature: Vemco data logger Instream N/A N/A
Continuous
Dissolved Oxygen HACH OX-DT Kit 300 ml BOD btl Winkler 8 hr.
Titration
Conductivity YSI Model 30 Meter Instream or none immediately
sampling bucket
Turbidity HACH 2100P Meter Screw top bottle none immediately
Total Phosphorus-P EPA 365.3 125 mL plastic Acidified to pH 28 days
bottleStream Health and Water Quality in the Long Tom Watershed: 1999 - 2006
within 24 hours of collection. Each sample was marked with the sample ID number, time, and
date of collection.
Continuous temperature loggers were checked for accuracy before and after field deployment
according to the procedures outlined in Chapter 6 of the Water Quality Monitoring Technical
Guidebook. Loggers were set to record a data point once an hour. The monitoring coordinator
conducted independent field audits at each site using a National Institute of Standards and
Technology (NIST) traceable thermometer at the time of deployment and retrieval.
Macroinvertebrate and Physical Stream Habitat Surveys
Macroinvertebrates were collected according to protocols developed by the DEQ (see Appendix
B). This included collecting macroinvertebrates using a 350-micron D-frame kicknet at 8 one-
square foot plots in one or more riffles throughout the sample reach. At sites where no riffles
existed, we collected samples in fast moving sections no more than 1.5 to 2 feet deep. Samples
from all 8 plots were combined in a 5-gallon bucket and the material was drained of all water
using a 350-micron sieve, placed in one-liter Nalgene containers, and immediately preserved
with alcohol. Samples were delivered to ABR in Forest Grove for sorting and identification. See
Appendix C for a complete description of ABR’s laboratory methods.
We developed our physical habitat survey by adapting protocols developed by the EPA for their
Western Region Wadeable Streams Assessment (Peck et al., 2006). Like the EPA protocol, we
determined survey length by multiplying the average wetted width by 40 or sampling 150
meters, whichever length was greatest. We measured streambed particle size using a Wolman
Pebble Count and thalweg depth using the EPA protocol. Surveyors also assessed the relative
degree of human impact on a site using the Human Disturbance Index developed by DEQ. The
remaining habitat measures we developed independently to enable the survey and
macroinvertebrate sampling to be conducted in a half day by volunteers. This included a visual
density estimate of shade, riparian understory and ground cover, documentation of tree presence
and non-native plant species in the riparian area, and tally of instream wood larger than 1’
diameter (see Table 4).
Table 4. Summary of Physical Habitat Measurements
Indicator Method
Riparian
Shade Visual Density Estimate (70%)
Trees Presence/Absence
Understory Density Visual Density Estimate (None, Sparse, Moderate, Dense)
Ground Cover Density Visual Density Estimate (None, Sparse, Moderate, Dense)
Stream Bed Substrate Wolman Pebble Count (5 measurements at 21 transects)
Thalweg Depth 100 – 150 measurements
Large Wood # Pieces 1’ – 2’ diameter; # Pieces > 2’ diameter
Invasive Plant Species Presence/Absence
- 14 -Stream Health and Water Quality in the Long Tom Watershed: 1999 - 2006
Because these protocols vary significantly from those used by EPA, our riparian, shade, and
large wood results cannot be directly compared with their studies. See Appendix D for the
Council’s protocol overview, physical habitat data sheet, and DEQ Human Disturbance Index.
Quality Assurance
Training
A DEQ led training session on water quality measurement methods and equipment was held in
August of 1999. Attendees were given hands-on experience in collecting and analyzing samples
for dissolved oxygen, pH, conductivity, turbidity, and water temperature. The monitoring
coordinator conducted subsequent training sessions for all new volunteers. In addition,
participants continued to receive feedback on results and technical support from the monitoring
coordinator throughout the program. The monitoring coordinator conducted a ½ day volunteer
training for macroinvertebrate sampling and stream habitat measurements after being trained by
EPA staff. The coordinator or monitoring assistant also assisted volunteers at their first site to
ensure they fully understood the methods.
Precision and Accuracy Levels
Methods for quality assurance and control for water quality measurements included: 1) DEQ
approved equipment, 2) regular calibration and accuracy checks of field equipment, 3) field
checks by the monitoring coordinator, 4) duplicate sampling at 2 out of the 17-18 sites for each
round of sample collection, and 5) pre and post-deployment accuracy checks and field audits of
continuous temperature loggers using a NIST certified thermometer. For more details see the
Quality Assurance Project Plan for the Long Tom Water Quality Monitoring Program
(www.longtom.org).
Most of the water quality data collected were rated A or B level based on accuracy and precision.
Accuracy evaluates whether equipment is calibrated correctly and/or whether that equipment
measures a known standard within an acceptable range. Precision reflects the degree of
repeatability between measurements.
A variety of steps have been implemented over the past several years to improve accuracy and
precision levels. The turbidity and pH meters lose their accuracy and precision when the
machines are cold. The coordinator reminded volunteers to keep equipment indoors overnight
and, if possible, use the equipment in their car on cold days. In August 2001, we changed our
pH sampling protocol by having volunteers bring in samples to be analyzed for pH in the office.
This step dramatically improved our accuracy and precision levels and allowed us to determine
that pH was in fact not a problem in the watershed. Another step we took to improve accuracy
was to tape the acceptable ranges for turbidity and conductivity to the machine so the user could
immediately see whether the machines were in range during accuracy checks. The coordinator
also visited each volunteer every 3 to 4 months during sampling to observe their technique and
make suggestions when necessary. We also conducted split sampling with the DEQ volunteer
monitoring coordinator twice in the past 4 years. There was a high level of agreement between
the DEQ coordinator’s results and Council monitoring volunteers’ results.
- 15 -Stream Health and Water Quality in the Long Tom Watershed: 1999 - 2006
Water Quality Results
Temperature and Dissolved Oxygen
The biologically-based numeric temperature criterion applicable to streams and tributaries within
the Long Tom Watershed is 18q C (64.4q F) for the protection of trout rearing and migration
from May 16 through October 14; the lower reach of the Long Tom River extending from Fern
Ridge Reservoir to the Willamette River is unassigned. This standard is based on a 7-day
moving average of daily maximum temperatures. Water temperatures above this can weaken or
kill fish, especially trout and salmon. High temperatures make them more susceptible to disease,
elevate their metabolism so they require more food to survive, and render them less able to
compete with introduced warm water game fish. Many sculpin, another type of native fish in the
Long Tom Watershed, are also sensitive to temperature (Thieman 2000). The primary causes of
high stream temperature include air temperature, direct solar radiation, and low stream flow.
The state dissolved oxygen standard requires that oxygen levels be at or above 8 mg/L to protect
cool-water aquatic life. One factor affecting the amount of dissolved oxygen in water is
temperature. The higher the temperature, the less oxygen water can hold. Another factor is the
amount of biological activity. If a lake or stream has high nutrient concentrations it stimulates
the growth of algae. This can lead to high dissolved oxygen levels on sunny days but low levels
at night when algae are respiring but not photosynthesizing. In addition, bacteria consume dead
algae and other organic matter, which further depletes dissolved oxygen. Low levels and large
diurnal fluctuations of dissolved oxygen are stressful and sometimes deadly to fish.
Water temperatures in the Long Tom Watershed do not meet state standards at many of our
monitoring sites during the summer. The map on page 17 shows that all of the lowland reaches
and many at mid-elevation do not meet the state standard for 16 or more days during the
summer. The dark red lines indicate stream segments that had four or more days above 22q C
(72q F), which is the lethal temperature for cutthroat trout based on laboratory studies conducted
at Oregon State University (Armantrout pers. comm. 1999). Orange lines indicate 40 or more
days above 17.8q C (64q F); yellow lines indicate 16 – 39 days over 17.8q C; and blue lines
indicate less than 16 days above 17.8q.3 The warmest water temperature days are typically in
August and early September when air temperatures are still high and flow is the lowest.
Streams closer to the headwaters that are well shaded generally show water temperatures that
remain cool and meet the state temperature standard despite very high air temperatures. Stream
temperature models show that if we established maximum potential shade on the mid to lower
reaches of all our streams, we could decrease average summer water temperatures by as much as
5q C. For the Long Tom River below Fern Ridge Reservoir, temperatures could decrease 1.5q to
2q C (Department of Environmental Quality, 2006). This would mean cutthroat trout could
inhabit mid-elevation and some lowland stream sections throughout the summer.
3
The new state temperature standard is 18q C (64.4q F). Our results were calculated using the old standard of 17.8 C
because we were not aware of the new standard at the time of analysis. For most sites, the difference between the
old and new standard would not change its status.
- 16 -Number of Days Not Meeting
Long Tom Watershed Council State Temperature Standard
Temperature Monitoring Results LL1 0-15 days at or below 17.8° C and
no days over 22° C
2000-2006
16 - 39 days over 17.8° C and
no days over 22° C
40 or more days over 17.8°
and no days over 22°
L O W E R
L O N G
4 or more days over 22 ° C
T O M
FCT5 ! Temperature Monitoring Site
FCT4 FC2
FCT3
Watershed Boundary
F E R G U S O N C R E E K
FCD FCT2 FC1
FCT1 Subbasin Boundary
BCT7 BCT4
BC1
BCT8 BCT5 LA1
B E A R C R E E K
ULT5 BCT1
ULT4 LL2
BCT3 BC2 BCT2
ULT9
L O W E R
UL2 ULT2 CCT1
LLT1L O N G
U P P E R ULT6
ULT1
T O M
PCT5 PCT4 ULT11 L O N G
ULT10
L O W E R
PCT3 ULT3T O M
LL3
ULT8 ULT7 IC1 CCT2
F E R N A M A Z O N
PCT2 R I D G E C R E E K
HC1
E L K
ECT2
EC2 C R E E K
ECT1 PCT1
NCT1 EC1
UL1
U P P E R A M A Z O N
UA1
UAT1
C R E E K UAT2
NCT2
CC1
SC1
CCT4
SC2
S P E N C E R C R E E K
CCT3
SCT1
CCT6 CCT7 CCT8
C O Y O T E
CC2
CC4 C R E E K
CCT9 CCT5
´
CCT10 CCT11 CCT13
CC3
CCT12
Note: The state temperature standard relevant
to the Long Tom is17.8°C (64°F). This is 0 1.25 2.5 5
calculated as the average of daily Miles
maximum temperature for 7 consecutive days. Source: Long Tom Watershed Council. Brian Issa 3/07Stream Health and Water Quality in the Long Tom Watershed: 1999 - 2006
Another significant factor affecting stream temperature is the amount of flow during the summer.
Streams with lower flow heat more quickly than those with higher flow. As noted in Figure 1
on page 8, withdrawals during the summer for irrigation (as indicated by cumulative water
rights) were associated with decreasing minimum stream flows in Coyote Creek.
Instream ponds or impoundments can also affect stream temperature. This can be seen at
sampling sites LL3, CCT7, CCT10, ULT4, CC4, EC1, and NCT1. Each of these sites has an
impoundment upstream of it. CCT7, which is located just below an impoundment on a small
Coyote Creek tributary, provides a particularly striking example. At this site, we were able to
place a probe immediately upstream of the impoundment’s backwater (CCT6) as well as below
the impoundment (CCT7). Temperatures above the impoundment met the state standard all
summer and were an average of 8q C cooler than below the impoundment.
Figure 2 shows the percentage of measurements from 2000 - 2006 that did not meet the state
dissolved oxygen standard. These were monthly measurements taken April through November
between 8 and 11 a.m. at all sites. Sites with a high percentage of low dissolved oxygen
measurements correspond with high temperature levels. However, some sites have lower
dissolved oxygen levels than temperature alone predicts. This is due to high biological oxygen
demand caused by excessive nutrients that fuel algal growth.
90
80
70
Percent Samples
60
50
40
30
20
10
0
BC1 BC2 CC1 CC2 CC3 CC4 EC1 EC2 FC1 FC2 LA1 LL1 LL2 LL3 SC1 UA1 UL1 UL2
Figure 2. Percent dissolved oxygen samples not meeting the state standard. These results are for monthly
measurements made April through November, 2000 – 2006. Site locations can be found on the maps on
pages 16, 19, 22, and 23. Site descriptions can be found in Appendix A.
- 18 -Stream Health and Water Quality in the Long Tom Watershed: 1999 - 2006
Several sites show a decreasing trend in dissolved oxygen levels, including upper Ferguson
Creek (FC2), lower Amazon Creek (LA1), and the lower Long Tom River (LL1, LL2). In the
case of lower Amazon Creek and the Long Tom River we also see an increasing trend in nitrate
levels. Figures 3 and 4 show trends for dissolved oxygen and nitrate between 2000 and 2006
for lower Amazon Creek. Appendix E lists additional trend results for the watershed and
describes the Seasonal Kendall Test statistic.
Figure 3. Trend for dissolved oxygen at monitoring station LA1 derived from Seasonal Kendall Test.
Analysis and graph courtesy of Tom Mendes, City of Eugene.
Figure 4. Trend for nitrate at monitoring station LA1 derived from Seasonal Kendall Test. Analysis and
graph courtesy of Tom Mendes, City of Eugene.
- 19 -Stream Health and Water Quality in the Long Tom Watershed: 1999 - 2006
Bacteria
E. coli originates from fecal matter and is an easily measured indicator of fecal contamination of
surface waters. Two state standards, based on E. coli concentrations, have been developed to
protect humans from pathogenic bacteria associated with fecal matter. One standard applies to
single samples and the other applies to the average of five samples taken within a 30-day period.
The single sample standard is 406-organisms/100 mL of water. The 5-sample average standard is
126 organisms/100 mL. Streams that have average levels above 126 organisms/100 mL indicate
chronic E. coli problems.
Bacteria levels vary greatly over the course of a year and tend to be highest just after soils
become saturated in the fall. Common sources include runoff carrying livestock manure, fecal
matter from wildlife or domestic pets, and human sewage from leaking septic systems or sewer
connections. Most of the drainages in the Long Tom meet both the single-sample and 5-sample
standard the majority of the time (see Appendix F). The map on page 21 shows stream
segment ratings according to the single-sample standard. Sections in red did not meet the
standard for 40% or more of samples. Yellow segments indicate 15 – 39% of samples did not
meet the standard, and blue indicates that 15% or less did not meet the standard.
The highest concentrations of E. coli are found at upper Amazon Creek (UA1), Bear Creek
(BC1), Owens Creek (BCT1), Jones Creek (BCT2), and Ferguson Creek (FC1, FCA). In the
case of upper Amazon Creek, with an average E. coli concentration of 786 cells/100 mL, bacteria
comes from a variety of urban sources, including illicit discharges, pet waste, ducks, geese and
nutria. Contrary to the trends in Bear and Ferguson Creek, E. coli levels are lower at the
downstream site (see Figure 5). Here the average concentration is 350 cells/100 mL and the
creek flows through irrigated agricultural land. It is likely that much of the E. coli at this site is
coming from upstream in the City of Eugene.
In Bear Creek, E. coli levels rise somewhat consistently the further you move downstream. The
upstream site drains primarily forestland, whereas the middle and downstream sites drain rural
residential and pasture land. In Ferguson Creek, land use follows a similar pattern. However in
this sub-watershed there is a distinct spike in E. coli concentrations downstream of Turnbow Rd.
(FCB). Livestock have access to the creek both upstream and downstream of here, but grazing
management practices differ significantly at one downstream site compared to the upstream
livestock operations. In both the Bear and Ferguson Creek sub-watersheds, the likeliest source
of E. coli appears to be runoff from pastures.
- 20 -Long Tom Watershed Council
E.coli Monitoring Results LL1
September 1999 - December 2006
L O W E R
L O N G
T O M
FC2
F E R G U S O N C R E E K
FCC FCB FC1
FCD FCA
B E A R C R E E K
BC1
LA1
BCT1
LL2
BC2 BCT2 BCA
L O W E R
UL2
L O N G
U P P E R LAB
T O M
L O N G
T O M L O W E R
F E R N A M A Z O N
R I D G E C R E E K
E L K
C R E E K
EC2
PCT1
NCT1 EC1
UL1
UA1
U P P E R A M A Z O N
F E R N
C R E E K
R I D G E
CC1
SC1
SC2 S P E N C E R C R E E K
CCT3 CC5
Percent Samples Not Meeting
State Bacteria Standard
(Greater than 406 cells/100ml) C O Y O T E
´
C R E E K
CC4
0 - 14%
15 - 39% CC3
>40%
! Bacteria Monitoring Site
3
Subbasin Boundary Miles
Source: Long Tom Watershed Council. Brian Issa 3/2007Stream Health and Water Quality in the Long Tom Watershed: 1999 - 2006
900
Average E. coli concentration
800
700
organisms/100 mL
600
Upstream
500
Middle
400
Downstream
300
200
100
0
Bear Cr. Ferguson Cr. Amazon Cr.
Figure 5. Upstream-downstream average E. coli levels for sites on Bear Creek, Ferguson Creek, and
Amazon Creek. Downstream levels are higher at Ferguson and Bear Creek, but lower on Amazon Creek.
Conductivity and pH
Conductivity is related to the total dissolved solids (typically salts) concentration in water and
can be used as an indicator of pollution levels in freshwater. We collected monthly data on
conductivity at 17 – 19 sites between 1999 and 2006. High conductivity levels did positively
correlate with sites that showed impairment from other attributes such as nitrates and total
phosphorus. For our study, conductivity was not as useful a measure of water quality compared
to the other attributes we measured.
The acceptable range for pH according to the state standard is 6.5 – 8.5. This measurement
reflects the relative acidity of a liquid, and is measured on a scale of 1 to 14 (1 = highly acidic, 7
= neutral, 14 = highly alkaline). The pH of rainwater in the Pacific Northwest is between pH 5
and 6. As water hits the ground and intercepts soil particles and other substances its pH
generally increases. The pH in a river or lake can be influenced by human activity (e.g., industry,
automobile exhaust), the soil and rock types in the watershed, and the amount of algae in the
water. Large concentrations of algae or aquatic plants can effect pH changes through
photosynthesis. During the day pH levels are higher because photosynthesis is occurring,
whereas at night pH levels are lower (i.e., more acidic) because no photosynthesis is occurring.
The Council monitored pH at its original 17 baseline sites from September 1999 through June
2003. During this time, all samples met the state standard for pH.
Turbidity
Conditions for fish and other aquatic life become impaired when suspended sediment levels
exceed natural background levels. Turbidity, which is measured by the amount of light that can
pass through a water sample, is often used as an indicator of suspended sediment concentrations
because it is inexpensive and easy to measure. High turbidity levels indicate suspended sediment
- 22 -Stream Health and Water Quality in the Long Tom Watershed: 1999 - 2006
concentrations that may interfere with visual feeding by fish, smother eggs, and impair gill
respiration. Typically turbidity levels increase substantially when there is a heavy rain event.
Significant sources of sediment to streams include landslides caused by road failures or clear cuts
on steep ground, exposed soil along ditches and road surfaces, stream bank erosion, and
construction sites in urban areas.
The state standard for turbidity requires that a source not increase turbidity levels by more than
10% of upstream levels. Our data show upstream-downstream differences of greater than 10% at
several sites in the watershed, as illustrated in Figure 6. The highest average turbidity levels are
downstream of Fern Ridge Reservoir. Average turbidity on Coyote Creek near its outlet into
Fern Ridge Reservoir (CC1) is 10 NTU, compared to 34 NTU in the lower Long Tom below
Fern Ridge (LL2). This is due to the reservoir’s shallow depth and heavy wave action that stirs
up bottom sediment. The downstream sites on Bear Creek, Ferguson Creek, and Elk Creek also
show significant increases in average turbidity compared to their upstream counterparts.
Amazon Creek at Danebo Ave. in Eugene (UA1) shows higher average turbidity than
downstream at High Pass Rd. (LA1). The same is true for Coyote Creek at Powell Rd. (CC2),
which has an average turbidity of 29 NTU compared to 24 NTU downstream at Petzold Rd.
(CC1). These comparisons differ from the first four in that CC2 and UA1 are mid-basin sites
and obviously have significant sources of upstream erosion.
40
35
30
Average Turbidity (NTU)
25
Upstream
20
Downstream
15
10
5
0
Bear Cr Coyote Cr Ferguson Cr Fern Ridge Elk Cr Amazon Cr
Figure 6. Average turbidity levels at several upstream-downstream sub-watershed sites. Four of the sub-
watersheds show an increase in turbidity of greater 10% compared to upstream levels. Amazon and
Coyote Creek show higher average turbidity levels at their mid-basin sites than downstream sites.
- 23 -Stream Health and Water Quality in the Long Tom Watershed: 1999 - 2006
Nutrients
No state standards exist to protect freshwater aquatic life from excessive nitrogen or phosphorus
concentrations. This is due to the natural variability of nutrient concentrations in streams and
lakes, which is influenced by watershed geology and plant communities. Although relative
concentrations of nitrogen and phosphorus vary in their impact on local water quality and stream
health, numerous studies have shown that water quality and instream habitat deteriorate when
nutrient concentrations increase over background levels (Horne & Goldman, 1994). Often, this
is associated with human impacts, such as an increasing number of septic systems adjacent to a
river or lake, impervious surfaces in urban areas, and fertilizer use on urban and agricultural
land.
For the purposes of this study, we have selected 0.1 mg/L of total phosphorus and 0.3 mg/L of
nitrate as indicators of poor water quality4. In the Long Tom Watershed, phosphorus and nitrate
concentrations above this are associated with dense blooms of algae in the summer, increased
turbidity, and low dissolved oxygen levels. The maps on pages 26 and 27 show the distribution
of nitrate and total phosphorus concentrations in relation to 0.1 mg/L for phosphorus and 0.3
mg/L for nitrate. Stream reaches in which more than 40% of samples were above these levels
are red. Sections with 15% - 39% of samples above are yellow and 0% - 14% are blue.
Phosphorus levels are the highest in upper and lower Amazon Creek (UA1, LA1, LAA, LAB,
LAC), Fern Ridge Reservoir (LL3), and upper Spencer Creek (SCA). The lower Long Tom R,
Ferguson Cr., Bear Cr., and Coyote Cr. have moderate levels of phosphorus in their lower
reaches, and the rest of the Watershed has relatively low levels of phosphorus. The distribution
of nitrate concentrations is somewhat different than phosphorus, although lower and upper
Amazon Creek again show very high levels. EC2, the most pristine sampling site in the
Watershed also shows high levels of nitrate. There are no residences, farms, or recent logging
operations upstream of this site, which suggests that a higher background level may exist in this
sub-watershed.
Without extensive historical data, distinguishing between natural levels and human contribution
can be difficult. But in the Amazon Creek basin the data provide strong evidence that human
contribution is significant. Figures 7 and 8 compare seasonal average concentrations of total
phosphorus and nitrate for lower Amazon Creek, upper Amazon Creek, and the mouth of Coyote
Creek. Upper Amazon Creek (UA1) drains urban land. The lower segment of Amazon Creek
(LA1) runs through irrigated agricultural land and receives input from industrial land to the east
of Highway 99. Coyote Creek (CC1) drains forest and rural residential land.
Average total phosphorus levels are 1.5 to 4.5 times higher in lower Amazon Creek than Coyote
Creek. The highest levels in lower Amazon Cr. occur in summer (May – July), whereas Coyote
Creek levels peak in the winter (November – January). Average nitrate levels are up to 11 times
greater in lower Amazon Creek than Coyote Creek between November and April, and then drop
below Coyote Creek levels July to October. These results are consistent with the USGS study of
the Willamette River showing the highest concentrations of nutrients in streams draining urban
and agricultural land (Wentz et al. 1998).
4
Nitrate is measured as nitrate-nitrite nitrogen.
- 24 -Stream Health and Water Quality in the Long Tom Watershed: 1999 - 2006
Nitrate levels show an increasing trend at several watershed sites, including the mouths of Bear
Creek (BC1), Ferguson Creek (FC1), Amazon Creek (LA1), and the Long Tom River (LL1).
Sites on the Long Tom River near Cheshire (LL2), Veneta (UL1), and Alderwood State Park
(UL2) are also increasing in nitrate concentrations. Only one site in the Watershed showed a
change in total phosphorus levels, which was a decreasing trend on the upper Long Tom River
near Veneta (UL1). See Appendix E for a description of the statistical test used to calculate
nutrient trends and other trend results for the Watershed.
0.3
Total Phosphorus (mg/L)
0.25
0.2
CC1
0.15 LA1
UA1
0.1
0.05
0
Nov - Jan Feb - Apr May - Jul Aug - Oct
Figure 7. Average seasonal concentrations of total phosphorus for Coyote Cr. at Petzold Rd. (CC1),
lower Amazon Cr. at High Pass Rd. (LA1), and upper Amazon Cr. at Danebo Ave. (UA1). Differences in
year round averages are statistically significant for all sites.
1.4
Nitrate-Nitrite-N (mg/L)
1.2
1
0.8 CC1
LA1
0.6
UA1
0.4
0.2
0
Nov - Jan Feb - Apr May - Jul Aug - Oct
Figure 8. Average seasonal concentrations of nitrate for Coyote Cr. at Petzold Rd. (CC1), lower Amazon
Cr. at High Pass Rd. (LA1), and upper Amazon Cr. at Danebo Ave. (UA1). Differences in year round
averages are statistically significant for CC1 compared to LA1 and CC1 compared to UA1, but not LA1
compared to UA1.
- 25 -You can also read