Reuse Opportunity - Wastewater Report 2018 - State of the Art Compendium Report on Resource Recovery from Water - International Water Association
←
→
Page content transcription
If your browser does not render page correctly, please read the page content below

Wastewater
Report 2018

The
Wastewater
Report 2017
Reuse    State of the Art Compendium Report

Opportunity
         on Resource Recovery from Water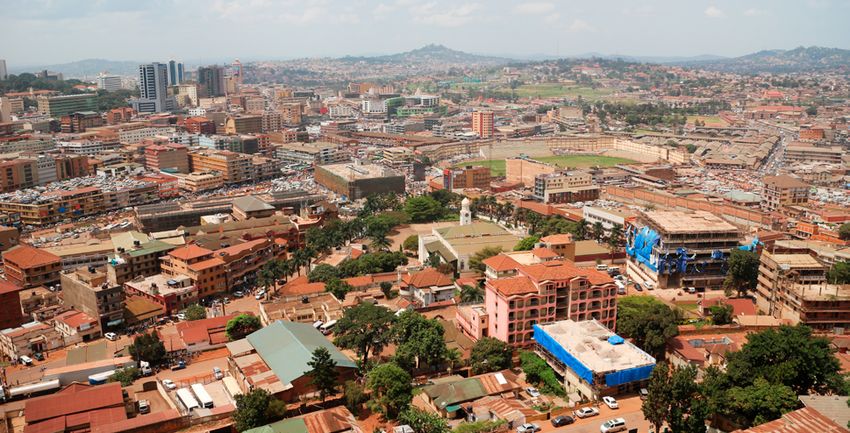
Contents
Cities seizing the reuse opportunity in a circular economy                                                                  02

Aqaba: A mid-size city turning its “zero discharge” challenge into a good opportunity                                       03
Bangkok: Using sludge as a resource and a valuable economic good                                                            05
Beijing: Building infrastructure to keep up with an ever expanding mega city                                                07
Chennai: Addressing water scarcity through accelerated wastewater reuse                                                     09
Durban: Wastewater as an economic good                                                                                      11
Kampala: Protecting its water source with an integrated plan to control, treat
and reuse wastewater and septic sludge                                                                                      13
Lima: Learning by doing under the urgency of shrinking glaciers                                                             15
Manila: A mega city regenerating its resources through wastewater treatment and reuse                                       17

Summary							                                                                                                              19
The IWA Principles for Water-Wise Cities                                                                                    21

List of acronyms
BOD - Biological Oxygen Demand
BOT - Build-Operate-Transfer
GHG - Greenhouse Gas
MBR - Membrane Reactor
MLD - Million Litre per Day
MWh - Megawatt hour                                     Infographics data
O&M - Operation and Maintenance
PPP - Public Private Partnership                        • The population data was searched on the web from most recent
SDG - Sustainable Development Goals                       sources available.
STP - Sewage Treatment Plant                            • The wastewater sewer and treatment coverage, as well as the
WWTP - Wastewater Treatment Plants                        water reuse, energy recovery and fertiliser value recovery was
                                                          provided by local city contacts.
                                                        • City wide GHG emissions data was available only for the following
                                                          cities:

                                                           •• Chennai. Source: Powerpoint presentation by Sumana
                                                              Bhattacharya, ICSD, India, Aug 2014, found on the web.
Acknowledgments                                            •• Lima. Source: Carbon Disclosure Project website.
                                                           •• Manila. Extrpolated from Source: Greenhouse Gas Emissions
City		         Contact                                        in the Philippines Factsheet, USAID
Aqaba          Yasser Hanaqtah, Hotaf Yassien              •• Beijing. Source: CO2 emissions inventory of Chinese Cities,
Bangkok        Pathan Banjongproo, Tantikom Supachai          Atmos. Chem. Phys. Discuss., doi:10.5194/acp-2016-176,
Beijing 		     Mr. Kuixiao Li                                 2016
Chennai        Shri Roy, Mr. Rajamohan                     •• Durban. Source: Summary Document: eThekwini Greenhouse
Durban		       Teddy Gounden                                   Gas Emissions Inventory 2015, Energy Office eThekwini
Kampala        Rose Kaggwa                                     Municipality
Lima		         Karina Valenzuela                        • GHG emissions from wastewater management was calculated
                                                          using the ECAM tool, made available by the WaCCliM project.
Manila		       Bernaliza Espina
Cities Seizing the
Reuse Opportunity in
a Circular Economy
The theme for UN-Water World Water Day in 2017 was              increase wastewater and fecal sludge treatment, reuse and
Wastewater which has helped to raise awareness of this          recycling. Cities should be empowered to take the lead on a
global problem and create momentum amongst like-mind-           resource revolution, with governments and the private sector
ed organisations to drive change. The change required is        investing heavily in infrastructure to enable a transition to a
captured within target 6.3 of the Sustainable Development       circular economy, bringing about significant environmental,
Goals (SDG), which commits governments to halving the           economic and social benefits. A portfolio of solutions includ-
proportion of untreated wastewater and substantially in-        ing centralised and decentralised, natural and built, wet and
creasing recycling and safe reuse by 2030.                      dry options.
   Today, around 80% of all wastewater is discharged into          The concept of circular economy, which aims to decouple
the world’s waterways where it creates health, environ-         economic growth and development from the consumption
mental and climate-related hazards. Urbanisation further        of finite resources, has emerged in response to the draw-
exacerbates this challenge with increasing wastewater           backs of the conventional ‘take-make-consume and dispose’
generation, while at the same time using more of Earth's        model of growth. Water, with the energy it consumes and
dwindling resources. Recovering the water, energy, nutri-       produces, and the materials it contains, has a critical role in
ents and other precious materials embedded in wastewa-          transitioning to the circular economy.
ter is a key opportunity to be seized.                             Used water is one of the most under-exploited resources
   The discharge of untreated effluent in water bodies          we have. Water from industrial or domestic use contains en-
does not only lead to eutrophication and human health           ergy, water, organics, phosphates, nitrogen, cellulose, rare
risks, it also contributes significantly to Greenhouse Gas      earths, and other resources. Technologies are increasingly
(GHG) emissions in the form of nitrous oxide and methane.       making resource recovery from wastewater commercially
Emissions from untreated sewage represents three times          feasible, including bio-gas, fertiliser, paper, metals, plastics
the emissions of conventional wastewater treatment. The         and, perhaps most importantly, it is a source of ‘new’ water.
emissions from untreated sewage can represent a signif-            For the water sector, transitioning to a circular economy
icant percentage of cities' global emissions, even when         presents an opportunity to fast track achieving the SDGs
treatment coverage is still poor as in many emerging cities.    through accelerating and scaling-up recent scientific and
   The SDGs demand we halve the amount of untreated             technological advances that support greater efficiency in
wastewater and provide universal access to adequate san-        the sector.
itation. During the same period, the global population is          This report aims to illustrate the wastewater challenge
estimated to rise to 8.5 billion people. These pressures will   and reuse opportunity in eight cities across the globe, pre-
drive cities to address the wastewater challenge and seize      senting a reuse roadmap and identifying priorities and ben-
the reuse opportunity. Of paramount importance are the          efits to meeting SDG target 6.3. The cities profiled in this
dual objectives of safeguarding human health and environ-       report are not the ‘usual suspects’ of pioneering cities who
mental protection, but beyond this, cities need to identify     have been on this trajectory for some time, but rather cities
ways of deriving value from the materials, energy and water     small and large from developing countries where the existing
that is embedded in wastewater streams.                         and future challenges are felt more acutely and the need for
   Decisive, urgent and large-scale action is needed to         change is pressing.

                                                                                                          WASTEWATER REPORT 2018   02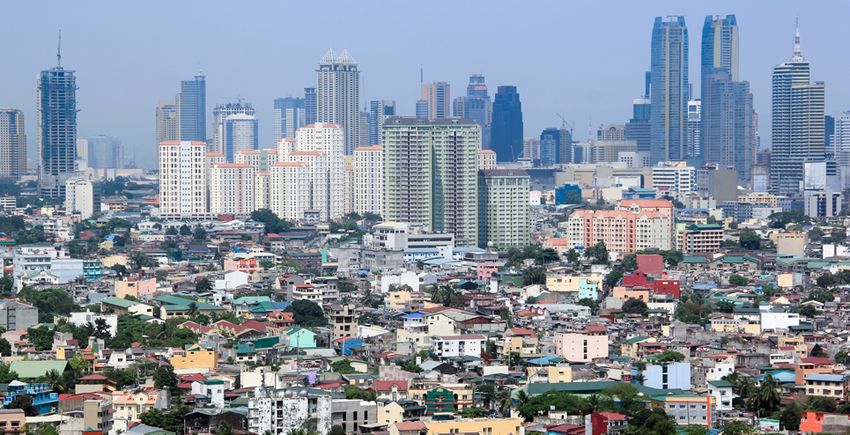
Aqaba: A mid-size city turning its “zero
      discharge” challenge into a good opportunity
      Aqaba, the largest city on the Gulf of Aqaba, lies at the crossroads of three continents
      as a major tourist destination and an attractive business centre. Benefitting from the
      special economic zone policies, Aqaba pioneered wastewater reuse in industries,
      boosted tourism and restored the world famous Aqaba Bird Observatory. The
      challenge to implement a zero sewage discharge policy is addressed by: (1) seizing the
      opportunity to supplement the city’s water resources with fit for purpose reuse water
      that is then sold; (2) recovering energy from wastewater to reduce the operating costs;
      and (3) drawing in private sector financing based on shared interests for an attractive
      and liveable city.

                                                                      DECENTRALISED MANAGEMENT
      KEY DRIVERS                                                     Aqaba is regulated under the Aqaba Special Economic
                                                                      Zone Authority (ASEZA), which enables local authorities
      WATER SCARCITY                                                  to adapt regulations to local needs, providing flexibility
      Jordan is one of the most water scarce countries in the         from the national regulations. ASEZ Law has helped the
      world, with a national average water demand of 120 l/c/d.       city to form and initiate laws and management tools that
      In Aqaba, the water scarce environment is exacerbated by a      provide the enabling environment for investment in the
      particularly high water demand (330 l/c/d) due to tourism.      wastewater reuse sector.

      INDUSTRY AND TOURISM
      Aqaba provides strategic access to regional and inter-          PRIORITIES
      national markets. The city strives to promote business
      opportunities and a high-quality lifestyle, shapes attrac-      ZERO DISCHARGE
      tive landscapes and protects seawater quality for tourism.      The "Zero Discharge" policy is being implemented to pro-
      Private sector investment is high in both the industrial zone   tect the quality of the marine environment and preserve the
      and in tourism.                                                 region’s attractiveness for tourism. In compliance with this

03   WASTEWATER REPORT 2018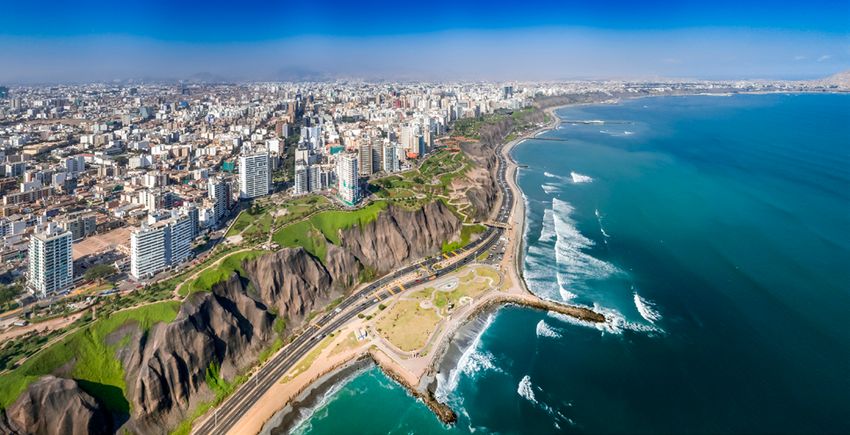
(PROJECTION BY 2030)
           258000                                                                                                                                                  100%
                                                                                                                                                                   ENERGY
                                                                                                                                                                   RECOVERED
0,20M                                10%
                                ON-SITE SANITATION                                                                                                                 NO
                                                                                                                                                                   FERTILISER
                                                                                                                                                                   RECOVERED
0,10M       194000                   90%
                                 SEWER SERVICE           100%
                                   COVERAGE              45M L/d
                                                                           69%
                                                                                                                      -81 000
                                                                                                      NA              ton CO2e/year                 4 RESPONSIBLE INSTITUTIONS
        POPULATION             WASTEWATER            WASTEWATER       TREATED                CITY-WIDE GHG            POTENTIAL TO                          NATIONAL LEVEL
        2016                                         TREATMENT        WASTEWATER             EMISSIONS                REDUCE EMISSIONS
                                                                      CURRENTLY REUSED                                FROM IMPROVED WW                      LOCAL LEVEL
                                                                                                                      MANAGEMENT

  policy, the Aqaba Water Company (AWC) has made huge
  investments available for sewer and wastewater treat-                                    BENEFITS
  ment capital costs in the past years. Currently, 90% of the
  wastewater is collected and treated, equaling 31,000 m3/d.                                •• The investment in infrastructure for wastewater treatment
  The treatment streams include a treatment pond of 9,000                                      and reuse pays off in terms of tourism, public health and
  m3/d, the northern treatment plant of 12,000 m3/d, and the                                   overall well-being of the residents and generates more
  southern plant, currently running at its capacity of 10,000                                  than 4 Million US $ in income for the AWC.
  m3/d, with plan for expansion to 24,000 m3/d.                                             •• Reuse of reclaimed water covers 30% of the City’s
                                                                                               water demand. It enables Aqaba to maintain the green
  COST RECOVERY                                                                                areas and urban landscape, as well as cover the water
  AWC is structured with full operation and maintenance                                        demand of development projects and the industrial zone.
  cost recovery. ASEZA’s commercial law enables AWC                                         •• The resource recovery strategy reduces carbon
  to ensure its financial sustainability through recovering                                    emissions through enhanced operation and energy
  energy and selling reclaimed water. The capital investment                                   efficiency, as well as through producing carbon neutral
  is paid off by the tourism sector, under a Public Private                                    power from solar farms and biogas.
  Partnership (PPP) contract. Aqaba enjoys low sewer en-
  ergy costs due to its flat environment, which minimises the
  pumping costs. Centralised WWTPs were selected as the                                    WASTEWATER ROADMAP
  best option combining the advantages of the economy of
  scale and the low pumping costs.                                                           By 2030:
                                                                                             • The Master Plan (dated July 2010) projects an increase of the
  WORKING WITH NATURE                                                                          wastewater daily flow rate to 61,000 m3 /day by 2030. Tenders to
  The treatment pond covers an area of 0.6km2 and lies at                                      expand the treatment capacity to 70,000 m3 /d have been initiated.
  the tip of the Gulf of Aqaba along a major migration bottle-
  neck between Eurasia and Africa. Maintaining this quality                                                                                                 2035
  habitat for migratory birds is a priority, even though the
  quality of the effluent produced is lower than with mechan-
                                                                                                                                2030
  ical treatments. The treated effluent is directed towards the
  Agricultural Reclaimed Water network, serving a number of
  customers for their seasonal irrigation.

                                                      2021                                                                               By 2035:
                                                                                                                                         • Increase wastewater
                                                                                                                                           treatment capacity by
                                                                                                                                           building new wastewater
  By 2021:                                                                                                                                 treatment plants in the south.
  Infrastructure                                                   Regulation                                                            • Reuse of treated wastewater
  • Rehabilitation of sewer networks in the                        • Strengthening the private sector participation                        in tourism (hotels and
    eastern part of the city (Alshabiaha).                           office.                                                               restoration centers).
  • Increase wastewater treatment capacity by                      • Attract foreign investments in the wastewater
    upgrading existing WWTPs.                                        sector in Aqaba (industrial reuse).

                                                                                                                                                    WASTEWATER REPORT 2018       04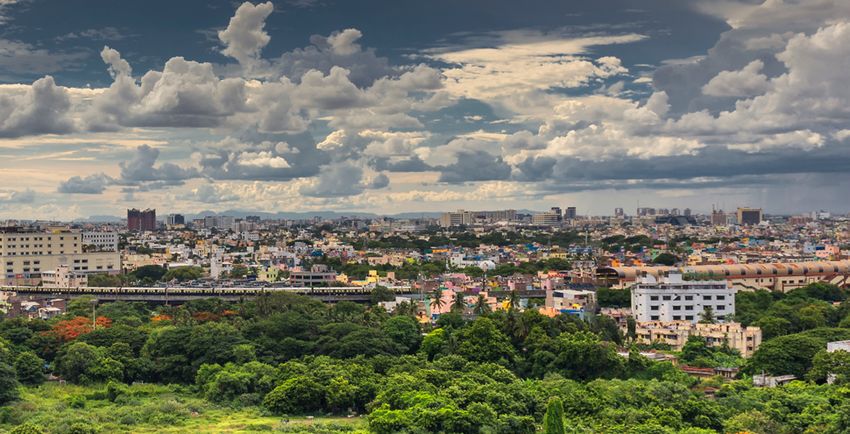
Bangkok: Using sludge as a resource
      and a valuable economic good
      Bangkok is a large metropolitan area with a population expected to reach 7 million
      inhabitants by 2030. Tackling the challenge of pollution is essential under the high
      rates of urbanisation. In Thailand, sludge is perceived as a valuable resource in the
      agricultural based economy. Sludge is collected, treated and transformed to be sold
      for reuse as fertiliser. The production of energy from sludge treatment is under further
      investigation for complete resource recovery.

                                                                      age infrastructure in Thailand separates black water from
      KEY DRIVERS                                                     grey water at the household level. Black water flows into a
                                                                      septic tank, which is emptied on a regular basis. The grey
      AGRICULTURE                                                     water flows directly to the combined sewer system, which
      The value of sludge as fertiliser is recognised by farm-        also collects all rainwater from the urban environment.
      ers, businesses, government and local researchers. More         These are then treated between eight centralised and 12
      than 60% of the population engages in agriculture, and          community WWTPs.
      agricultural export accounts for more than 60% of total ex-
      ports. Bangkok, though very urbanised, has kept a strong        SECTOR REFORM
      agricultural sector, with a total agricultural area of 21,000   Sludge reuse activities are shaped by two main nation-
      km2, representing about 14% of the total area of Bangkok        al programs: The National Economic and Social De-
      Metropolitan region.                                            velopment Five Year Plan and, the National Sewerage
                                                                      Development 32 Year Plan (2010-2041). The Office of
      POLLUTION                                                       Natural Resources and Environmental Policy and Planning
      Bangkok has made efforts to reduce pollution through            (ONEP) establishes the environmental policy and pro-
      increasing the combined sewage treatment volumes, as            grams, and checks the priority of sewerage projects at the
      well as enforcing stricter requirements on the emptying of      national level.
      domestic septic tanks and fecal sludge treatment. Sewer-

05   WASTEWATER REPORT 2018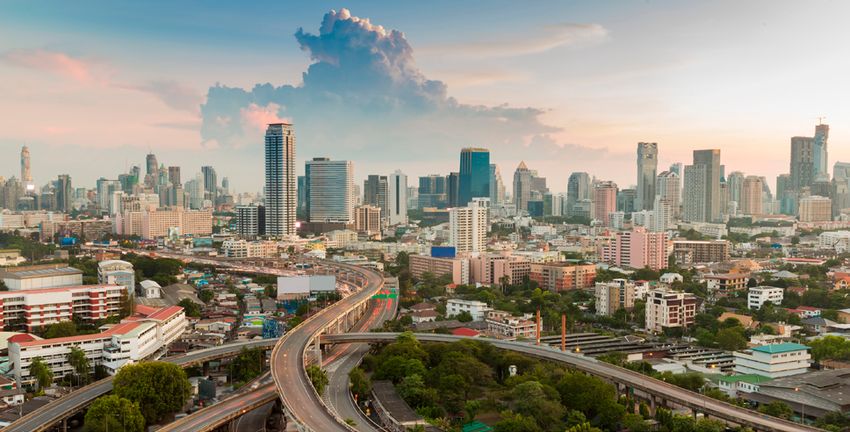
(PROJECTION BY 2030)
               7M                                                                                                                                    62%
                                                                                                                                                     ENERGY
                                                                                                                                                     RECOVERED

 5M
                                                                                                                                                     YES
                                    60%                                                                                                              FERTILISER
                                   ON-SITE
                                  SANITATION                                                                                                         RECOVERED
2,5M
             5,6M

                                    40%
                                 SEWER SERVICE
                                   COVERAGE
                                                     100%
                                                     1,3B L/d
                                                                                                          -638 000
                                                                     5%                     NA            ton CO2e/year            4 RESPONSIBLE INSTITUTIONS
       POPULATION              WASTEWATER        WASTEWATER     TREATED             CITY-WIDE GHG        POTENTIAL TO                           NATIONAL LEVEL
       2016                                      TREATMENT      WASTEWATER          EMISSIONS            REDUCE EMISSIONS
                                                                CURRENTLY REUSED                         FROM IMPROVED WW              LOCAL LEVEL
                                                                                                         MANAGEMENT

 PRIORITIES                                                                        BENEFITS

 STANDARDS                                                                         •• There is growing demand for both sewage collection
 The Ministry of Public Health released the “Manual on                                and fertiliser in the area which has resulted in sewage
 Integrated Septage Management” providing a general                                   treatment facilities.
 framework for designs of septic tanks, anaerobic treatment                        •• The collection of septic sludge and the sales of
 systems, and standards for health and safety. Bangkok                                transformed sludge are creating new markets and
 Metropolitan Administration (BMA) by-laws require that a                             generating income for businesses.
 wastewater treatment facility is installed for new housing                        •• Pollution has been progressively reduced from
 developments with more than ten detached houses and all                              untreated combined sewers and poorly managed septic
 industries and businesses.                                                           tanks.
                                                                                   •• As a result of BMA's by-laws for on-site treatment,
 SLUDGE MANAGEMENT                                                                    urbanisation has not led to increasing pollution.
 BMA's strategy is to collect and treat septic sludge to be
 used as fertiliser in the city’s public parks, surrounding
 green areas and farmland. It also aims to produce compost                         WASTEWATER ROADMAP
 with a mix of natural rice straw and the dewatered sludge
 from the 12 WWTPs to be used as manure. Both the use                                                               2030
 of treated septage and composted sludge are intended to
 grow to balance out the increase in wastewater treatment
 coverage and respond to a local demand in fertilisers.

 ENERGY RECOVERY                                                                              By 2030: There are plans to increase the production
 The interest to further valorise the reuse of sludge is high,                                capacity of the composting plant to meet the annual
 as it has created new markets and generated income for                                       demand of fertilisers estimated at 12,000 m 3 .
 businesses. Further research is on-going to investigate en-                                  BMA has a roadmap to tackle the 11 million m 3 /day of
 ergy production during treatment, which is challenging due                                   untreated combined sewer wastewater through increasing
 to the high dilution of organics in the combined sewer.                                      treatment capacity. However, much of this volume is
                                                                                              composed of rainwater, which could become a benefit to
                                                                                              the urban area rather than a nuisance, increasing energy
                                                                                              requirements for wastewater conveyance and reducing
                                      2020                                                    the energy recovery potential from wastewater due to
                                                                                              dilution. A balance between making use of rainwater from
                                                                                              sewers and increasing the wastewater treatment capacity
                                                                                              will lead Bangkok to become a water-wise city.

       By 2020: 60% of domestic wastewater is treated. So far, treated wastewater reuse has been limited to only 5% of total treated waste-
       water. This has to do with the low water tariffs in the country reducing the incentives for reusing treated wastewater. Building new
       infrastructure and the development of policies to leverage wastewater reuse will increase overall reuse up to potential to 7% by 2020.

                                                                                                                                   WASTEWATER REPORT 2018         06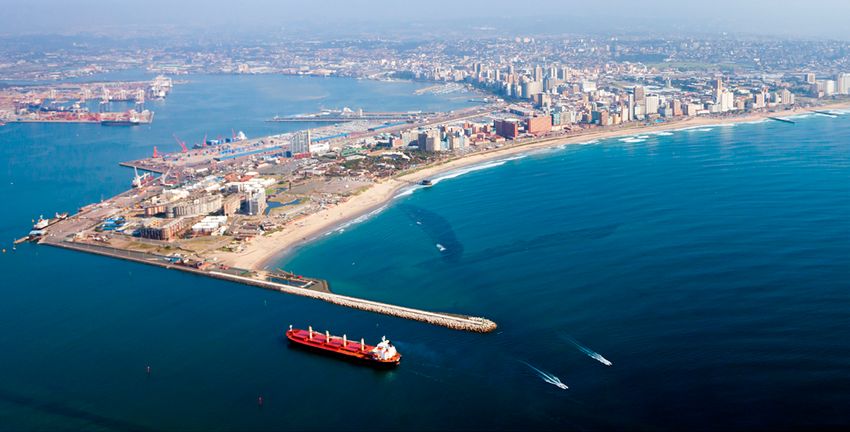
Beijing: Building infrastructure to keep
       up with an ever expanding mega city
       Beijing, the capital of the People’s Republic of China, is facing environmental concerns
       as a result of intense population growth and industrialisation. The city is adopting
       new business models and investing in ‘mega’ infrastructure to reduce pollution from
       increasing wastewater flows. In seeking investment efficiency, the city has adopted
       different technologies to foster wastewater reuse. With the new infrastructure, the city
       has recycled a quarter of its domestic wastewater and improved treatment of up to
       85% of industrial wastewater discharge.

                                                                    pollution discharge fees are currently too low to create a
      KEY DRIVERS                                                   cost incentive to treat wastewater to reuse standards.

      POPULATION GROWTH                                             WATER SCARCITY
      In the 10 years between the 2000 and 2010 censuses,           Beijing is a city where water shortages have become a
      the number of people living in the city grew by 44% - from    significant issue impeding social and economic develop-
      13.6 million in 2000 to 19.6 million in 2010. The popula-     ment. The recycling of wastewater provides an effective
      tion continued to grow at a significant speed, and in 2014,   solution to water scarcity.
      the population of Beijing increased by 1.52 million, 53%
      of which was located in downtown areas. By the end of
      2016, the population of Beijing reached 21.7 million. Ac-
      cording to the 13th Five-Year Plan (2016-2020), the num-
      ber of permanent residents should not exceed 23 million.

      STANDARDS
      Reclaimed and reused water standards are much more
      stringent than the wastewater discharge standards. The

07   WASTEWATER REPORT 2018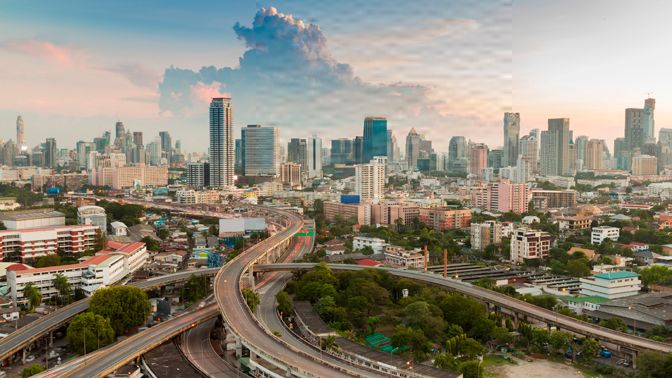
(PROJECTION BY 2030)
            23M                     5%
                              ON-SITE SANITATION                                                                                                             45%
                                                                                                                                                             ENERGY
20M
                                                                                                                                                             RECOVERED

                                                                                        10M
                                                                                                    173M                 -0,6%                               YES
                                   95%                                                                                                                       FERTILISER
                                                                                                  ton CO2e
10M
           21,7M               SEWER SERVICE              88%                                                                                                RECOVERED
                                 COVERAGE                 4,4B L/d

                                                                                                                   -1044 000
                                                                          15%                                      ton CO2e/year
                                                                                                                                            3 RESPONSIBLE INSTITUTIONS
      POPULATION             WASTEWATER            WASTEWATER        TREATED                  CITY-WIDE GHG       POTENTIAL TO                   NATIONAL LEVEL
      2016                                         TREATMENT         WASTEWATER               EMISSIONS           REDUCE EMISSIONS
                                                                     CURRENTLY REUSED                             FROM IMPROVED WW                   LOCAL LEVEL
                                                                                                                  MANAGEMENT

 PRIORITIES                                                                              BENEFITS

                                                                                          •• Full coverage of sewage treatment is possible in the
 WASTEWATER TREATMENT CAPACITY                                                               six main urban districts in the short term.
 By the end of 2015, there was a sewerage treatment                                       •• The water quality of the Liangshui River has
 capacity deficit of 500,000 m3/day. In addition, there                                      improved through enforcement of industrial wastewater
 were about 20 municipal sewage treatment plants and                                         treatment that reached 85%, and is expected to increase
 reclaimed water plants with lower effluent quality, which                                   to 100% treatment in 2018.
 needed to be upgraded urgently. The lagging sewage net-                                  •• Approximately 47% of reused water is used for
 work construction is one of the main factors that restricts                                 agricultural irrigation, 30% for environmental
 further improvements in sewage treatment efficiency.                                        reuse and 20% for industrial reuse.

 FINANCING INFRASTRUCTURE
 The local authority revised the public procurement proce-                               WASTEWATER ROADMAP
 dures in order to create new business models that encour-
 age private investment and social capital engagement in
 financing wastewater infrastructure. The wastewater treat-                                                                  2030

 ment projects are operated now on turnkey models.

 INTEGRATED WASTEWATER PROGRAM
 The cost of treated wastewater reuse is determined by the
 technology and the degree of treatment. Beijing's integrat-                                                                         By 2030:
 ed wastewater program is about planning recycled water                                                                              Infrastructure: Investment in
 quality standards for specific applications. Membrane re-                                                                           expanding reclaimed wastewa-
 actor (MBR) technology is widely used in Beijing and has                                                                            ter networks to different users
                                                                                                                                     according to the treatment
 increased cost efficiency in adjusting the treatment level to
                                                                                                                                     standards.
 the reuse application. Although new wastewater infrastruc-
 ture is built to achieve reuse standards, transporting the
 final product to the end-users remains complex.

                                     2020          2021                                            By 2021:
                                                                                                   In terms of regulation:
                                                                                                   Reviews of the pollution discharge fees and wastewater
                                                                                                   reuse tariff will encourage capital investment in
                                                                                                   wastewater treatment projects. This will also introduce
                                                                                                   new business models as an alternative to long-term
                                                                                                   ownership.

                                                                                                   Infrastructure:
                                                                                                   Investment in wastewater treatment and sewer networks
                                                                                                   to achieve 100% domestic and industrial wastewater
                                                                                                   treatment.

                                                                                                                                            WASTEWATER REPORT 2018        08
Chennai: Addressing water scarcity
      through accelerated wastewater reuse
      Rapid population and economic growth have resulted in increasing water scarcity in
      Chennai, the capital of the Indian state of Tamil Nadu. The city has therefore established
      water recycling through strong coordination and good governance. As the first Indian
      metropolitan area to achieve 100% sewage collection, the Chennai Metropolitan
      Water Supply and Sewerage Board (CMWSSB), located in Tamil Nadu, formulated a
      set of service standards setting the scene for accelerated wastewater reuse and the
      “Zero Water Discharge in Chennai” program. All stakeholders, including government
      authorities, the private sector and citizens, are mandated by a set of regulations and by-
      laws to ensure maximum reuse of water and wastewater to safe quality standards.

                                                                    SECTOR REFORM
      KEY DRIVERS                                                   Over several years, CMWSSB has made serious steps to
                                                                    close the water loop and make the most of available water
      WATER SCARCITY                                                in Chennai. A bundle of laws and regulations to increase
      Water stress has become a perennial concern in Chen-          incentives for reusing water been launched. This was
      nai with the per capita availability of water dropping from   followed by strict application of rules and implementing
      1,816 cubic meters (CM) in 2001, to 1,545 CM per year         innovations in close partnership with the private sector and
      today. With a growing population and flourishing econo-       inter-governmental agencies.
      my linked to higher industrial inputs and greater energy
      demand, there is a domino effect; with water demand from
      households, industries and power plants growing simulta-      PRIORITIES
      neously adding to the urban water stress. This has caused
      a serious strain on the ability of CMWSSB to maintain city    LEGISLATION
      water supply to acceptable standards for all users.           In harmony with the CMWSSB water reuse plan, the
                                                                    Greater Chennai Corporation launched a by-law that sets

09   WASTEWATER REPORT 2018
77%
(PROJECTION BY 2030) ENERGY
12M 4M
11M RECOVERED
-6,2% NO
FERTILISER
6M 2M
3,82M RECOVERED
8,5M 100% ton CO2e
SEWER SERVICE
COVERAGE 70%
769M L/d -235 000
49% ton CO2e/year
4 RESPONSIBLE INSTITUTIONS
POPULATION WASTEWATER WASTEWATER TREATED CITY-WIDE GHG POTENTIAL TO NATIONAL LEVEL
2016 TREATMENT WASTEWATER EMISSIONS REDUCE EMISSIONS
CURRENTLY REUSED FROM IMPROVED WW LOCAL LEVEL
MANAGEMENT
the rules for mandatory wastewater recycling. Permits for
all new developments will only be awarded with wastewa- BENEFITS
ter recycling planned into the design. The rules state that
only water from toilets are to be connected to the sewerage •• Chennai has achieved around 15% of the city’s water
network, the rest should be used for groundwater recharge demand through water recycling. Around 8% of the
after a simple organic filtration. In case of multi-storied treated wastewater is sold to industries and up to 40.7%
apartments, the rules say that the recycled water should be of domestic water needs in newly built houses are
used for toilet flushing. CMWSSB started implementing a secured from in-situ wastewater reuse.
rain water harvesting program in 2002. Under this program •• In-situ wastewater reuse in residential areas and rain
it is mandated that new or renewed water and sewer con- water harvesting has reduced nearly 60% of water
nections must include the installation of rain water harvest- reaching the sewer system that has contributed to
ing systems, to reduce the burden on existing water supply improved operation of sewer networks.
and loading into the combined sewer networks. •• The utilisation of biogas for energy production
reduces the GHG emissions and also electricity
ZERO DISCHARGE consumption from the city grid.
In addition to increasing the water tariff for industrial use, •• As demand for onsite wastewater treatment systems
it is mandatory for industries and manufacturers to achieve increased, new markets for wastewater treatment
zero liquid discharge in their operations. That means no manufacturers and businesses were created.
wastewater is discharged to the environment, and all
wastewater is treated to be reused. CMWSSB, through a
PPP model, treats wastewater to a standard and sells it to WASTEWATER ROADMAP
large industries in Chennai that further treat it to tertiary 2030
standards.
ENERGY EFFICIENCY
PPP models have been highly successful in continuously
ensuring performance and service standards are met. In
By 2030:
the last 8 years, CMWSSB has commissioned six Sew-
• Construct 24
age Treatment Plants (STPs) with a total capacity of 378
decentralised
MLD. Biogas from these plants powers the majority of the STPs with
STP's electricity demand. This has reduced the depend- tertiary treatment
By 2021:
ence of the STPs on electricity drawn from the public grid technologies for
• CMWSSB is planning total of 360 MLD.
by about 77%.
another two (45MLD)
• Achieve 100%
treatment plants to be
wastewater
2020 2021 commissioned for the
recycling.
private sector.
• Full reuse of 90MLD
IPIDERUM
treated wastewater for FUGA POPULATION
industries.
WASTEWATER REPORT 2018 10Durban: Wastewater as an economic good
The city of Durban in the eThekwini municipality proved that innovative approaches to
water, environmental and institutional management can yield exceptional results. Water
scarcity, high tariffs and the increasing cost of discharge have led industries in this South
African city to adopt innovative approaches to water recycling. Alternative solutions,
such as wastewater reuse, have become more attractive and economically viable.
of the Ministry of Environment and Water Affairs. Since the
KEY DRIVERS local government elections in 2000, it has become possi-
ble for local governments to assume full responsibility for
URBAN SPRAWL ensuring water and sanitation services, as provided for in
Projected growth in water demand is based on spatial de- the Constitution.
velopment plans approved by the eThekwini Municipality.
One implication of this planned growth is that a reliance on
conventional water resources will be unsustainable in the
future; supply through other means must be explored. PRIORITIES
INDUSTRY INDUSTRIAL REUSE
The eThekwini Municipal region is the economic power- 23% of the city’s treated wastewater is reused by local
house of KwaZulu-Natal, and also contributes significantly industries in their production processes. Industrial users
to the South African economy. Identified priority sectors include companies from the mining and oil and gas indus-
for growth include automotive, chemicals, clothing and tex- tries, reducing their environmental footprint and operating
tiles, food and beverage, furniture, metals, electronics and costs.
electrical machinery, and green industries. All of which put
increasing demands on water management. PRIVATE SECTOR
The first build-operate-transfer (BOT), reducing in Durban
DECENTRALISED MANAGEMENT was awarded with an overall objective to treat approxi-
The city council enjoys full financial and administrative au- mately 10% of the city’s wastewater to potable standards,
tonomy, while policies and regulations remain in the hands and sell the same to industrial customers. Following a
11 WASTEWATER REPORT 2018(PROJECTION BY 2030)
4M
8%
ENERGY
20M
RECOVERED
20M
-1,6% YES
84% 27,1M FERTILISER
ON-SITE SANITATION 100% ton CO2e RECOVERED
10M 3,7M 108M L/d 10M
16%
SEWER SERVICE
COVERAGE 44%
-438 000
ton CO2e/year 2 RESPONSIBLE INSTITUTIONS
POPULATION WASTEWATER WASTEWATER TREATED CITY-WIDE GHG POTENTIAL TO NATIONAL LEVEL
2016 TREATMENT WASTEWATER EMISSIONS REDUCE EMISSIONS
CURRENTLY REUSED FROM IMPROVED WW LOCAL LEVEL
MANAGEMENT
formal tender process, Durban Water Recycling (Pty) Ltd.
(DWR), was awarded a 20-year concession contract for WASTEWATER ROADMAP
the production of high quality reclaimed water.
The Water Services Development Plan adopted in 2012,
DECENTRALISED WASTEWATER TREATMENT includes the council strategic plan for the water supply
The implementation of decentralised solutions are driv- and sanitation services for the mid- and long-term.
en by the high demand for housing, services, and land
availability for new buildings going beyond the catchment 2030
areas. As well as providing basic services, such treatment
systems are designed to have minimal impact on the local
environment and provide opportunities for potential reuse
for agriculture.
BENEFITS Long-term:
• Upgrade wastewater treatment
•• Recycling effluent has reduced the demand for works (sewer, pump stations and
potable water by 7% and reduced the quantity of wastewater treatment plants) by
effluent directly discharged into the environment 50%.
by 10%. • Reuse of 96MLD of treated
wastewater for drinking purposes.
•• The use of recycled water for industries and agriculture
in Durban has contributed to an additional 300,000 • Increasing the total capacity of
treated sewer effluent from five
people being served with potable water.
wastewater catchment areas
•• Industrial users of recycled water pay 50% less than the would equate to 256MLD by 2030.
cost of water from the conventional system.
2020
Mid-term:
Remix water system for reusing wastewater for drinking purposes: A re-
mix water system consists of a combination of desalinated seawater and
treated effluent from a wastewater treatment plant. The water is treated
through the use of membrane bioreactor technology will provide demand
of approximately 65MLD.
WASTEWATER REPORT 2018 12Kampala: A growing city dealing with more
people and impacts of climate variability
Kampala, the capital of Uganda, has received worldwide recognition as an African
pioneer in integrated water management. To address the challenges of growing
urbanisation, resource scarcity and climate variability, the National Water and
Sewerage Corporation (NWSC) and Kampala Capital City Authority (KCCA) have
teamed up to accelerate Kampala’s transition towards sustainable wastewater
management. These two organisations have actively involved a range of additional
city-based stakeholders, including citizens, in delivering solutions. A central pillar
of this approach is the establishment of call centers for septic tank emptying and
setting up decentralised sanitation systems. Kampala is taking an inclusive, city-wide
approach to work towards increased treatment and reuse of wastewater and fecal
sludge, on the path towards a circular economy.
URBANISATION
KEY DRIVERS Kampala has a high urbanisation rate of 5.2% per year, with
the population currently around 1.5 million. This population
TOPOGRAPHY nearly doubles during the day due to the influx of commut-
Kampala city originally stretched across seven hills, which ers, increasing the burden on public services and systems.
has since expanded creating an undulating landscape Approximately 60% of the population lives in informal
of peaks and valleys. Currently 10% of the population is settlements, with unplanned infrastructure and high rates
served by a sewerage system and 90% by onsite systems; of inadequate access to services such as drinking water
a ratio that may not significantly change in the future due and sanitation. Urbanised wetlands exposes the population
to the nature of the topography. Effluent from such onsite to flood risks and reduces the natural drainage capacity.
systems often finds its way into the Nakivubo channel and
ultimately into the Inner Murchison Bay of Lake Victoria, POLLUTION
which is inhabited by a large population of fishermen, and Lake Victoria is also the discharge point of all water drain-
is also the source of abstraction for the drinking water ing from the City. Thousands of urban inhabitants live in
supply of Kampala. flood-prone slum areas that are at risk to epidemic diseas-
13 WASTEWATER REPORT 2018227000
KWh/y
ENERGY
RECOVERED
(PROJECTION BY 2030)
5M
4,5M YES
FERTILISER
RECOVERED
2,5M 60%
ON-SITE 40%
SANITATION SEWER
100%
1,5M
SERVICE
COVERAGE 87M L/d 100% -114 000
NA ton CO2e/year 3 RESPONSIBLE INSTITUTIONS
POPULATION WASTEWATER WASTEWATER TREATED CITY-WIDE GHG POTENTIAL TO NATIONAL LEVEL
2016 TREATMENT WASTEWATER EMISSIONS REDUCE EMISSIONS
CURRENTLY REUSED FROM IMPROVED WW LOCAL LEVEL
MANAGEMENT
es related to unsanitary conditions, and send uncontrolled
pollution to Lake Victoria. The pollution of Lake Victoria is BENEFITS
also correlated with built-up areas in the wetlands, which
can no longer play their purifying role. Pollution could reach •• NWSC and local small businesses were able to increase
unacceptable levels and have a significant impact on urban their income, as now around 15% of NWSC’s income
income and food production. is generated from sewerage services and septic tank
emptying.
•• The health and safety conditions for pit emptiers
PRIORITIES and utility workers were improved through training.
This included the level of compliance with hygienic
RISK MANAGEMENT measures during fecal sludge emptying and transport
Sanitation Safety Plans (SSPs) – a risk management ap- operations, and use of PPE among cesspool emptiers.
proach that identifies health risks in the sanitation system, •• Alleviation of pollution in Lake Victoria and restoration
are being implemented. As part of this, an improvement of wetlands in its basin by reducing the illegal dumping of
plan is being developed and regular monitoring protocols. fecal sludge.
Both NWSC and KCCA are now working on SSPs and aim •• GHG emissions have also been reduced through the
to make them city-wide, as the tool offers a way to address use of energy from biogas.
the complexity with the sanitation service chain and man-
age the associated health risks. The SSP implementation
has also been part of an important process to engage with WASTEWATER ROADMAP
all key stakeholders, and to ensure coordination that im-
2030
proves day-to-day operations and service delivery.
EXPANDING SEWER NETWORK AND
WASTEWATER TREATMENT CAPACITY
The Kampala Sanitation project of extended infrastructure By 2021: To increase sewerage
in the sewer area is a key achievement of NWSC. The service coverage from 6.4% to
project includes implementation of the wastewater treat- at least 30% by 2018 and to
ment plant and expansion and rehabilitation of the sewer increase wastewater treatment
quality to comply with national
network. It includes biogas production, and electricity
standard will be achieved by:
generation which will be used to power the treatment plant
• The delivery of Kampala By 2030:
and any surplus will be sent back to the grid.
Sanitation Program of
To increase reuse of
Bugolobi WWTP and its
resources by:
ENABLING ENVIRONMENT sewer network.
KCCA has created a legal environment for safe reuse of • Implementation of
• Implement packaged waste
the new trunk sewer
wastewater products and by-products. This was character- water treatment.
and pump stations to
ised by a number of polices, reuse guidelines and a wide • Small scale sewage collection connect new areas to
capacity building campaign for the sector workers and key and treatment systems for the STPs.
local community players. The establishment of a call center small urban communities.
• Generation of power
for septic tanks emptying and sludge treatment and reuse from the STPs.
2021
are key outcomes of the enabling environment.
WASTEWATER REPORT 2018 14Lima: Learning by doing under
the urgency of shrinking glaciers
Peru, in western South America, is losing its glaciers in the Andean Mountains as natural
water sources. This is a result of climate variability and recovering from long periods of
drought caused by the La Niña phenomenon. At the same time, intense urbanisation of its
capital Lima generates an increasing demand for water, an already scarce resource. Peru has
an urgent need to identify and develop adequate and timely solutions given these alarming
trends. Peru was forced to act very quickly and “learn by doing” to fight the effects of
climate variability. Reusing wastewater proved to be an irresistible choice.
DECENTRALISED MANAGEMENT
KEY DRIVERS Despite the centrally planned economy in Peru, especially
in public utilities such as water, the Peruvian government
WATER SCARCITY has relaxed its control in the Lima region. Lima’s Water
Lima is considered the world’s second most extensive and Sewer Company SEDAPAL (Servicio de Agua Pota-
city built on a desert after Cairo, and receives hardly any ble y Alcantarillado de Lima – Sedapal S.A.), has enjoyed
rainfall. Only 2% of Peru’s water resources are located in relative autonomy in managing water. It promotes a more
coastal areas such as Lima. Lima abstracts from surface flexible decision making process to address urgent is-
waters and groundwater, with abstraction rates of the lat- sues, and opens the door for all stakeholders to partici-
ter outstripping resource availability. pate in delivering solutions to water scarcity.
CLIMATE VARIABILITY
Lima depends on glaciers in the Andean Mountains (An-
des) to provide 60% of its water supply. The glacial melt-
ing caused by climate change has pushed Lima to the top
of the list of cities on the frontline of combating impacts of
climate variability.
15 WASTEWATER REPORT 2018(PROJECTION BY 2030) LOW
12M ENERGY
12M
17% RECOVERED
ON-SITE SANITATION 20M
-4,2% NO
95% FERTILISER
6M
10M SEWER SERVICE RECOVERED
10M COVERAGE
83% 10M
15,4M
SEWER SERVICE
COVERAGE ton CO2e
15%
240M L/d -652 000 7 RESPONSIBLE INSTITUTIONS
5% ton CO2e/year
NATIONAL LEVEL
POPULATION WASTEWATER WASTEWATER TREATED CITY-WIDE GHG POTENTIAL TO LOCAL LEVEL
2016 TREATMENT WASTEWATER EMISSIONS REDUCE EMISSIONS
CURRENTLY REUSED FROM IMPROVED WW NGO
MANAGEMENT
PRIORITIES BENEFITS
RECYCLING •• Increased ownership and responsibility towards
The growing demand in urban and peri-urban areas for reusing wastewater through building trust between all
food, energy and water is challenging the traditional dis- stakeholders.
tribution of resources, rural-urban resource flows, and •• Reuse of 3.5 m3/s of treated wastewater to irrigate
nutritional cycles. For this reason, the recovery of water, 3,400 hectares of parks and gardens managed by
nutrients and energy from liquid and solid waste generated Lima’s Parks Service (SERPAR).
in urban and peri-urban sanitation systems, becomes an •• Wastewater reuse is incentivised through the
increasing priority for local public authorities. creation of a legal framework and enabling environment.
WASTEWATER TREATMENT CAPACITY
SEDAPAL operates 21 WWTPs with a total capacity
of 2.775 m3/s. That is only 15.3% of the total wastewa- WASTEWATER ROADMAP
ter generated by the city. The major wastewater flow is
directed to water channels or the ocean with only primary 2030 2035
treatment.
WASTEWATER REUSE
Lima started using treated wastewater in horticulture and
irrigation for green urban spaces. This has paved the way
for a wider range of application in industries, agriculture
and potentially drinking water.
2021
By 2021:
Promote consensus agreements to integrate and coordinate city, water
and climate risk management.
Increase indirect wastewater reuse by increasing domestic wastewater
secondary treatment to 7 m3/s, and develop 9,000 ha of green areas and By 2035:
4,000 ha of farming areas in Lima with treated wastewater. Increase direct reuse of wastewater by implementing proper infra-
structure for treated sewer effluent reuse. By 2035, it is expected
that 100% of the 24.8 l/s of generated wastewater will be treated
to various levels, each adequate with the intended use.
WASTEWATER REPORT 2018 16Manila: A mega city
regenerating its resources
Manila, the capital of the Philippines, is a rapidly growing mega city. Urbanisation and
industrialisation, in combination with low sanitation coverage and poor wastewater
management, are key drivers of pollution in Manila Bay and Laguna Lake. A citizen’s
petition drove to several activities and successful reforms in the sanitation sector
where the supreme court ordered key governmental organisations to take action, which
paved the way to privatisation. The Manila water sector privatisation story is one of the
most successful in the Asia region and continues to strive for excellence.
tion to sewer networks was only 8% in 2008, due to the
KEY DRIVERS lack of financial resources, cumbersome procurement
procedures and densely populated areas. These issues
POLLUTION resulted in untreated wastewater discharge into the envi-
Every year, millions of cubic meters of untreated wastewater ronment, threatening public health and urban liveability.
are disposed in Manila Bay and Laguna Lake. In 2008, the
annual Bilogical Oxygen Demand (BOD) load from the 58 SECTOR REFORM
sub-basins at point source in Manila Bay and Laguna Lake In 1995, national executive and legislative actions led to
was estimated at 232,764 MT/yr. Discharge of untreated bidding out two concession contracts by the Metropolitan
domestic wastewater and overflows from septic tanks have Waterworks and Sewerage System. Under the conces-
been the major source of pollution. Both Manila Bay and sion agreements, the operational and financial burden of
Laguna Lake are sources of drinking water and habitat for utility management and investment fell on private compa-
native fish that people depend on for their livelihood and nies Maynilad Water Services Inc., for the western side,
primary food source. and Manila Water Company Inc., for the eastern side. Two
concession agreements were signed for a 25-year period
POPULATION GROWTH and have since been extended for an additional 15 years.
Metro Manila has an estimated population of 12.8 million A regulatory framework and relevant acts were developed
and is predicted to reach 16,7 million by 2030. Connec- and passed to facilitate the planning and implementation
17 WASTEWATER REPORT 2018(PROJECTION BY 2030) 30M
13,5M LOW
ENERGY
12M
RECOVERED
20M
-5,8% YES
29M FERTILISER
85%
ON-SITE SANITATION 100% ton CO2e RECOVERED
6M 12,2M
510M L/d
10M
15%
SEWER SERVICE
COVERAGE
-1680 000 6 RESPONSIBLE INSTITUTIONS
ton CO2e/year
0% NATIONAL LEVEL
POPULATION WASTEWATER WASTEWATER TREATED CITY-WIDE GHG POTENTIAL TO LOCAL LEVEL
2016 TREATMENT WASTEWATER EMISSIONS REDUCE EMISSIONS
CURRENTLY REUSED FROM IMPROVED WW PRIVATE COMPANIES
MANAGEMENT
of several programmes to increase sanitation coverage,
reduce untreated wastewater discharge, and increase BENEFITS
wastewater reuse.
•• Sector reform and privatisation has led to strengthened
partnerships among inter-governmental agencies and the
PRIORITIES private sector to accelerate sanitation coverage in
Metro Manila.
EXPANDING THE SEWER NETWORK •• A regulatory framework and legislation have paved the
15% of the population is connected to sewer networks way to the development and implementation of plans that
and 85% have access to onsite sanitation (septic tanks), of commit all stakeholders to 100% coverage and safely
which 44% of the fecal sludge and effluent is safely man- managed/reuse of wastewater and sludge by
aged. The flexibility of the private sector offers a range of 2028.
technical solutions to speed up connections to the sewer- •• Implementation of the polluter pays approach rather than
age network. Existing storm water infrastructure has been issuing fines has been a key driver in incentivising
used as a temporary solution for a combined sewer system. industries and residential compounds to install
More than 58 decentralised treatment plants were con- onsite/decentralised treatment systems.
structed (in addition to the existing centralised plants), seek- •• Combined efforts from government agencies, private
ing low operation costs and the most potential for energy sector and residents has reduced pollutant loads to
production while ensuring effluent standards were met. the environment and regenerated key resources that are
key sources of drinking water and food.
EXPANDING SANITATION COVERAGE
The private concessionaries and the local government
agencies have committed to increase connection to the WASTEWATER ROADMAP
sewer network by 100% and safely manage 100% of fecal 2030 2036
sludge from on-site sanitation systems by 2028.
REDUCING POLLUTION
A combined effort from government agencies and private 2028
operators to initiate decentralised treatment facilities and
reuse of wastewater for flushing toilets, watering of gar-
dens and street cleaning has reduced loading of pollutants By 2028:
and nutrients to Manila Bay and the Laguna Bay tributar-
• 100% Sewer Connection
ies, while reducing pressure on water resources. Further, by Manila Water
strict implementation of the polluter pays principle (where (east zone of the city).
a fee is collected for discharge of untreated wastewater) • Increase on site
has incentivised industries and “gated” communities to wastewater reuse. By 2036:
install onsite/decentralised treatment plants. These efforts • 100% sewer
have led to the restoration the Laguna Lake which is used connection by
Maynilad (west
as a source of drinking water and aquaculture.
zone of the city).
WASTEWATER REPORT 2018 18Summary
It is estimated that current wastewater treatment capacity In megacities such as Beijing, where population growth
is 70% of the generated wastewater in high-income coun- and urban sprawl will continue, there is a need to build out
tries, and only 8% in low-income countries (Sato et al, infrastructure to keep up with demand. This build out needs
20131). Decisive, urgent and large scale action is needed. to happen with less available land, with technologies which
Cities should be empowered to take the lead on a re- are less energy intensive and can cope with increasing
source revolution, with governments and the private sec- nutrient loads and can extract useful materials from waste-
tor investing heavily in infrastructure to enable a transition water. Cities are looking at social, environmental and health
to a circular economy, which in turn will bring significant benefits of these approaches and understanding the true
environmental, economic and social benefits. value of sustainable water management.
There is a well-established suite of technologies Cities across the globe are establishing ambitious tar-
that a number of cities and countries have successfully gets, and developing policies to support ‘zero discharge’
deployed to increase the amount of wastewater that is concepts, such as in Aqaba and Chennai for example. Such
recycled and reused. The Global market for wastewater policies are often targeted towards industry and require
recycling and reuse reached nearly $12.2 Billion in 2016 meaningful incentives. Partnering with industry, such as in
and should reach $22.3 billion by 2021 (BCC Research, Durban, where 98% of wastewater is treated and used by
20172). This market expansion is in response to a growing industry, can have a financial impact on reducing operation-
demand from cities and industry for water against a back- al costs, for example.
drop of increased urbanisation, population growth and Sector reform, in places like Manila have granted greater
climate variability. autonomy to utilities, sharpened legislation to decrease
The most significant driver for wastewater reuse is polluting effluent and created incentives for private sector
water scarcity. Nations and cities are compelled to look participation. In combination, these changes are having a
beyond their traditional sources of water supply and look positive effect on wastewater management. These com-
at portfolio approaches that include treated wastewater. binations are critical, with no silver bullets; cities need to
At the same time, there is a sharper focus on preventing look at integrated approaches that look across sectors and
pollution of source waters, reducing the amount of systems. In Kampala, approaching sanitation and waste-
untreated wastewater that is discharged and tapping into water management – onsite and sewered options – is an
the inherent value found in wastewater streams, which important step to rethinking urban waste management. With
is further galvanised by the Sustainable Development an effective partnership between the National Water and
Goals (SDGs). Whilst the SDGs set an ambitious Sewerage Corporation (NWSC) and Kampala Capital City
target for reuse, it also presents a great opportunity to Authority (KCCA), there is a great opportunity to not only
address water security, public health and socio-economic provide good public services, but to protect Africa’s largest
development. lake for millions of people.
Whilst the necessity of wastewater reuse in places like Getting the regulatory and market conditions right for
Aqaba and Lima, where water scarcity has been the norm commercialisation of reuse products is important. In Bang-
for many years, is apparent, cities are increasingly taking kok, with a large agricultural sector there are opportuni-
proactive actions to improve their water security. Cit- ties to create a market for fertiliser produced from treated
ies recognise water as an essential resource for growth sludge for a variety of applications. But they are not stop-
and prosperity. In a number of countries, cities and their ping there, by exploring opportunities to produce energy
institutions are given greater autonomy; decision making from sludge; they are seeking further benefits to incentivise
is decentralised and systems are being adapted to local partnerships and action to deal with an increased demand
drivers and demands. for wastewater treatment.
1
Sato, T., Qadir, M., Yamamoto, S., Endo, T. and Zahoor, A. 2013. Global, regional, and country level need for data on wastewater generation, treatment, and use. Agricultural Water Management, Vol.
130, pp. 1–13. dx.doi.org/10.1016/j.agwat.2013.08.007
2
https://www.bccresearch.com/market-research/environment/water-wastewater-treatment-markets-report-env008d.html
19 WASTEWATER REPORT 2018Within the context of the SDGs, countries, cities and industries are committing themselves to a future with universal
access to safe water and adequate sanitation and where half of wastewater is reused. Such commitments require new
ways of thinking; no longer do we think about removing a problem, but rather how to create opportunities - ones that
can be created through incentives and shared for mutual benefits.
WASTEWATER REPORT 2018 20Lessons learned
The cities covered in this report were carefully selected to 4. REUSE CAN DRIVE INNOVATION
cover a wide range of conditions and most importantly, the In all eight cities, innovations and tailored made solutions
governance framework that enable these practices. The were introduced. In Durban, for example, stakeholders
lessons learned offer examples to leaders in other cities created business opportunities for wastewater reuse as
of how wastewater reuse can be achieved. Each city will a solution for the high cost of outfall upgrade. In Aqaba,
be different, but the approaches being pioneered in these regulators creatively introduced different standards for dif-
cities are applicable and scalable globally. The wide varie- ferent reuse options as a starting point for wastewater in-
ty of examples covered aims to inspire further research to frastructure planning. They introduced a new planning path
synthesise and customize solutions for all cities. based on first identifying use: the selection of location and
design to minimize cost and increase efficiency, compared
1. ESTABLISHING THE RIGHT ENABLING to the conventional path of identifying the discharge stand-
ENVIRONMENT ard, designing the facility and then finding the location.
Improving the enabling environment was the first step in Financing wastewater infrastructure remains the most
almost all cases. National programs, plans, revision of challenging part for most governments. Beijing, a mega
water rights and laws have been achieved by a strong city, offers a procurement method that brings investor in-
commitment from the central government in Lima, Durban terest and generates new financing mechanisms.
and Manila. National policies promoted wastewater reuse
and river cleaning master plans, and offered the legal 5. TOOLS NEED TO BE CONTEXT SPECIFIC
framework for local government action and international In Chennai, the effective use of different management tools
and public funding. Support from international develop- such as financial incentives, building permits and standard-
ment cooperation has also significantly contributed to the ization, enabled greater cooperation for effective wastewa-
successful implementation of new regulations. ter reuse. While the financial incentives for water recycling
were missing in Bangkok due to low water tariffs, sludge as
2. ENGAGE WITH THE PUBLIC a fertilizer was the main product in the supply chain in con-
There are many different ways for effective public engage- trast to other cases where it is only considered a by-prod-
ment to take place, where trust is built between the public, uct of treatment. In Durban, the financial incentives proved
institutions and operators to increase the acceptance of to be effective tools to influence market dynamics and shift
wastewater reuse. Awareness raising and promotion of from supply to demand management on newly emerging
reuse practices, like in Kampala and Durban, or encour- economic goods, including recycled water.
aging active participation of NGOs and local communities Adaptive management in Lima helped to understand the
in the supply chain of wastewater reuse, such as in Lima, context and uncertainties involved in finding the most sus-
demonstrate good examples of trust-building. The bottom tainable solution. A continuous learn-by-doing approach was
up approach in Manila is an example of effective public en- able to respond to the urgency of water supply in the area.
gagement. The petition that the residents of Manila signed
drove the change of laws and regulation enforcement.
3. DECENTRALIZATION CAN IMPROVE DECISION
MAKING OUTCOMES
Decentralisation of decision-making seems to be an effec-
tive mechanism that increases investor interest, as seen in
Durban and Aqaba, and to accelerate progress and reduce
bureaucracy like in Lima and Manila. Yet, decentralization
takes different forms in each case: complete decentralisa-
tion as a free economic zone in Aqaba; municipal autonomy
laws in Durban; informal power delegation to the local level
in Lima; and empowering local communities and involvement
of the public in Kampala. It is crucial to note that the willing-
ness to take responsibilities and leadership at local level is a
pre-condition to avoid delegating up responsibilities.
21 WASTEWATER REPORT 2018The IWA Principles for Water-Wise Cities
A good plan for wastewater reuse will be embedded within a broader urban planning framework that positions water
cycle management as a key connector and enabler for other services, sectors and systems. The IWA Principles for Wa-
ter-Wise Cities provide 17 principles across four levels of action and five building blocks to support cities in developing
and realising a vision for a water-wise future. The eight case studies presented in this report provide useful examples of
how cities can take action towards the wastewater reuse opportunity using the five building blocks.
Vision Planning Tools
Recognising the opportunity to close Enabling the assessment of treatment
the loop on resources when handling requirement, costs and co-benefits, as
wastewater. well as the demand for recycled products.
Vision may be driven by national plans like in Bangkok Durban and Aqaba show that planning tools can be used
or Beijing or by the local government like in Kampala or to convey to multiple stakeholders the benefit of invest-
Chennai. The development of a local vision can also be en- ing in reuse infrastructure beyond the mandatory waste-
abled by the national policies like in Aqaba, where a spe- water treatment mandate. The ability to demonstrate the
cial economic zone was created, or in Durban, where the benefit of clean waterways for tourism, or the benefit of
city council was given full autonomy to address the water ensuring water supply to industries, supports coordinated
and sanitation issues. The case of Manila raises aware- action and investments by the public and private sector
ness on the power of citizens, who initiated the vision with stakeholders.
their drive to clean the Manila Bay.
Knowledge & Capacity Implementation Tools
Implementing the vision starts with the Tools such as financing schemes and
existing capacities of urban stakeholders regulatory or financial incentives are key
and increasing them step by step. to drive change.
A great example comes from Lima, where “learning by doing” Tariffs as seen in Durban, or by-laws in Bangkok and Chen-
has become a moto given the urgency of initiating change to- nai, drive the behavior of urban stakeholders to support the
wards more sustainable resources. It’s about starting to take implementation of the vision. Chennai, Aqaba, Durban and
action where staff already have competencies and to build Manila, have set successful PPP contracts. Models to sell
from there. Beijing has built and is still building capacities in recycled goods from sludge or treated effluent have been
energy recovery and treated effluent reuse. implemented in Bangkok, Durban and Aqaba.
Governance
Providing the framework for urban
stakeholders to work together on
implementing the vision.
Bringing stakeholders together is exemplified in Kampa-
la, as the city developed an integrated plan to tackle their
wastewater challenge while also recovering energy, nutri-
ents and water for industries.
WASTEWATER REPORT 2018 22You can also read