PUBLICATIONS Water Resources Research
←
→
Page content transcription
If your browser does not render page correctly, please read the page content below
PUBLICATIONS
Water Resources Research
RESEARCH ARTICLE                           Uncertainty in global groundwater storage estimates in a Total
10.1002/2015WR017351
                                           Groundwater Stress framework
Key Points:                                Alexandra S. Richey1, Brian F. Thomas2, Min-Hui Lo3, James S. Famiglietti1,2,4, Sean Swenson5,
 Groundwater resilience is defined
                                           and Matthew Rodell6
  and quantified with remote sensing
  from GRACE                               1
                                             Department of Civil and Environmental Engineering, University of California, Irvine, California, USA, 2NASA Jet Propulsion
 Timescales of aquifer depletion are
  assessed as a Total Groundwater          Laboratory, California Institute of Technology, Pasadena, California, USA, 3Department of Atmospheric Sciences, National
  Stress ratio                             Taiwan University, Taipei, Taiwan, 4Department of Earth System Science, University of California, Irvine, California, USA,
                                           5
 The volume of usable global                Climate and Global Dynamics Division, National Center for Atmospheric Research, Boulder, Colorado, USA, 6Hydrologic
  groundwater storage is found to be       Sciences Laboratory, NASA Goddard Space Flight Center, Greenbelt, Maryland, USA
  largely unknown

Supporting Information:                    Abstract Groundwater is a finite resource under continuous external pressures. Current unsustainable
 Supporting Information S1
                                           groundwater use threatens the resilience of aquifer systems and their ability to provide a long-term water
 Tables S1
 Tables S2                                source. Groundwater storage is considered to be a factor of groundwater resilience, although the extent to
 Tables S3                                which resilience can be maintained has yet to be explored in depth. In this study, we assess the limit of
 Tables S4
                                           groundwater resilience in the world’s largest groundwater systems with remote sensing observations. The
                                           Total Groundwater Stress (TGS) ratio, defined as the ratio of total storage to the groundwater depletion rate, is
Correspondence to:
                                           used to explore the timescales to depletion in the world’s largest aquifer systems and associated groundwater
J. S. Famiglietti,
jfamigli@uci.edu                           buffer capacity. We find that the current state of knowledge of large-scale groundwater storage has uncer-
                                           tainty ranges across orders of magnitude that severely limit the characterization of resilience in the study aqui-
Citation:                                  fers. Additionally, we show that groundwater availability, traditionally defined as recharge and redefined in
Richey, A. S., B. F. Thomas, M.-H. Lo,     this study as total storage, can alter the systems that are considered to be stressed versus unstressed. We find
J. S. Famiglietti, S. Swenson, and
                                           that remote sensing observations from NASA’s Gravity Recovery and Climate Experiment can assist in provid-
M. Rodell (2015), Uncertainty in global
groundwater storage estimates in a         ing such information at the scale of a whole aquifer. For example, we demonstrate that a groundwater deple-
Total Groundwater Stress framework,        tion rate in the Northwest Sahara Aquifer System of 2.69 6 0.8 km3/yr would result in the aquifer being
Water Resour. Res., 51, doi:10.1002/
                                           depleted to 90% of its total storage in as few as 50 years given an initial storage estimate of 70 km3.
2015WR017351.

Received 7 APR 2015
Accepted 29 MAY 2015
Accepted article online 16 JUN 2015        1. Introduction
                                           Changes in Earth’s climate and the increased use of groundwater resources to meet global water demands
                                           [Kundzewicz and Do   €ll, 2009; Famiglietti, 2014] restrict efforts to sustainably govern the common pool resource
                                           [Schlager et al., 1994; Dietz et al., 2003; Steward et al., 2009]. Traditionally studied by estimating fluxes, it is now
                                           widely recognized that both groundwater fluxes (i.e., discharge and recharge) and stocks (i.e., storage volumes)
                                           are necessary to effectively monitor the state of groundwater [Schlager et al., 1994; Steward et al., 2009]. Globally,
                                           large uncertainty in global groundwater storage exists [Alley, 2006] limiting our ability to characterize ground-
                                           water resilience, a function of aquifer storage, as perturbations to the aquifer result from climatic and anthropo-
                                           genic influences. The insufficient knowledge of total groundwater supplies will continue to limit effective
                                           governance of groundwater systems until a significant effort is made to improve groundwater storage estimates.
                                           Groundwater storage estimates commonly cited in global groundwater assessments [Graham et al., 2010;
                                           Perlman, 2012] can be traced to decades-old studies [Korzun, 1974, 1978; Baumgartner and Reichel, 1975;
                                           Nace, 1969; Lvovich, 1974; Berner and Berner, 1987]. The historical estimates, however, vary from 7 3 106
                                           cubic kilometers (km3) to 23 3 106 km3 [UN World Water Assessment Program, 2003]. These largely uncertain
C 2015. The Authors.
V
                                           values have filtered into the global groundwater literature, and although they were derived only heuristi-
This is an open access article under the
                                           cally, they have become commonly accepted. For example, although there is no observational basis, it is
terms of the Creative Commons Attri-
bution-NonCommercial-NoDerivs              commonly accepted that groundwater comprises 30% of global freshwater [Shiklomanov, 1993] as calcu-
License, which permits use and distri-     lated using the upper estimate of global groundwater storage by Korzun [1978].
bution in any medium, provided the
original work is properly cited, the use
                                           Hashimotoet al. [1982] put forth the concept of quantifying resilience of water resource systems with an
is non-commercial and no modifica-          application to a water supply reservoir. Sharma and Sharma [2006] define groundwater resilience as the
tions or adaptations are made.             ‘‘ability of the system to maintain groundwater reserves in spite of major disturbances.’’ Remote sensing of

RICHEY ET AL.                              STORAGE ESTIMATES IN A TOTAL GROUNDWATER STRESS FRAMEWORK                                                                  1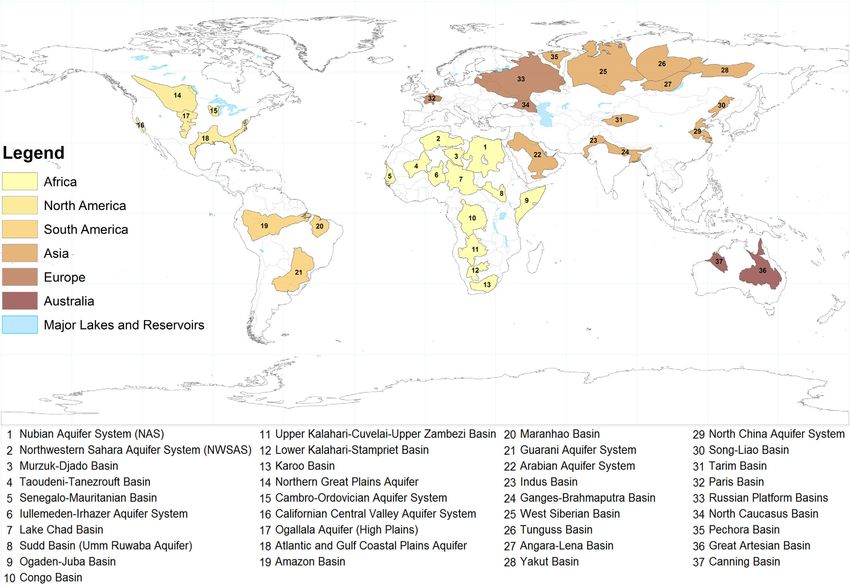
Water Resources Research                                                                   10.1002/2015WR017351

                    terrestrial water storage changes provides a valuable tool to observe and isolate changes in subsurface
                    water storage that result from disturbances, both natural and anthropogenic, that influence the resilience
                    of groundwater systems.
                    The concepts of stability and resilience in reference to ecological systems state that a natural system undergoes
                    perturbations from an equilibrium state. Stability accounts for the time to return to normal and resilience
                    accounts for the amount of disturbance while maintaining a state of equilibrium [Holling, 1973]. The ability of
                    groundwater to provide resilience is rooted in the large storage capacity of groundwater systems [Anderies et al.,
                    2006; Sharma and Sharma, 2006; Shah, 2009; MacDonald et al., 2011; Hugman et al., 2012; Katic and Grafton, 2011;
                    Taylor et al., 2013] and the residence time of groundwater, typically orders of magnitude larger than residence
                    times for surface water [MacDonald et al., 2011; Lapworth et al., 2012]. However, additional negative impacts of
                    pumping can significantly reduce the resilience of systems even with large volumes of water in storage. These
                    factors include the influence of pumping on subsidence, streamflow depletion, increased drilling and pumping
                    costs, decreasing water quality with increased use, and the volume actually recoverable from an aquifer, which is
                    less than total storage [Alley, 2007]. A number of studies have assessed groundwater resilience during drought
                    [Peters et al., 2005; Hugman et al., 2012] or resulting from hydroclimatic variability [Lapworth et al., 2012].
                    We apply the definition of resilience from Holling [1973] and Sharma and Sharma [2006] to groundwater
                    such that the resilience of a coupled human-groundwater system is the ability of the system to increase
                    recharge and decrease base flow, termed ‘‘capture’’ [Lohman, 1972], to maintain equilibrium or to reach a
                    new equilibrium as suggested by Theis [1940]. When equilibrium is unattainable, at least over the timescales
                    of interest, there is a loss of groundwater storage [Theis, 1940; Alley et al., 2002; Alley and Leake, 2004] identi-
                    fied as a tipping point for when the limit of the system’s resilience is surpassed.
                    Numerous groundwater studies have shown that groundwater is being used at rates that exceed natural
                    rates of recharge globally [Do €ll, 2009; Wada et al., 2010; Gleeson et al., 2012; Richey et al., 2015]. The impor-
                    tance of groundwater resilience lies in the fact that groundwater is a coupled human-natural system [Stew-
                    ard et al., 2009] providing critical services to human and natural ecosystems. Its ability to do so indefinitely
                    relies on the balance between the volume of water that enters a groundwater system and the volume that
                    leaves the system. In a natural system and over long time periods, the average input (i.e., recharge) is bal-
                    anced by average output (i.e., base flow and evapotranspiration).
                    Groundwater pumping is a perturbation to the natural system that disrupts the long-term equilibrium state
                    [Theis, 1940; Bredehoeft et al., 1982; Alley et al., 2002; Mays, 2013; Steward et al., 2013]. Such a perturbation
                    can require tens to hundreds of years to work through the system and re-establish equilibrium, if equilib-
                    rium is attainable at all [Bredehoeft et al., 1982; Alley et al., 2002; Alley and Leake, 2004]. The combination of
                    hydroclimatic driven variations from steady state, including the potential influence of climate change [Do      €ll,
                    2009; Taylor et al., 2013], and human perturbations from agricultural and urban development [Alley et al.,
                    1999; Alley and Leake, 2004; Mays, 2013] will continue to produce deviations from steady state in ground-
                    water systems. These deviations could lead to long-term depletion of groundwater storage on human time-
                    scales [Mays, 2013] resulting in reduced resilience and increased groundwater stress. The resilience of an
                    aquifer system against unsustainable pumping can be improved with human intervention, but only where
                    transparent knowledge of the system exists [Liu et al., 2007; Folke et al., 2002]. This study increases the trans-
                    parency of knowledge on the state of fluxes and stocks in large aquifer systems to assess aquifer resilience.
                    NASA’s Gravity and Recovery and Climate Experiment (GRACE) satellite provides vertically and spatially inte-
                    grated observations of changes in snow, soil water, surface water, and groundwater storage over a region
                    [Tapley et al., 2004]. Using auxiliary data sets, we can use GRACE observations to provide the first-ever
                    observation-based quantification of groundwater resilience whereby subsurface storage changes are com-
                    bined with aquifer storage estimates to assess the limits of groundwater resilience. The goals of this study
                    are threefold: (1) to summarize and evaluate estimates of global groundwater storage by characterizing the
                    large variability of current estimates using traditional hydrogeologic characteristics; (2) to evaluate ground-
                    water resilience as a function of global groundwater storage estimates and the net average subsurface stor-
                    age flux as observed using remote sensing; and (3) to highlight how the current, uncertain knowledge of
                    global groundwater storage severely undermines efforts to quantify resilience. We conduct our evaluation
                    on the 37 ‘‘Large Aquifer Systems of the World’’ [WHYMAP and Margat, 2008] (Figure 1). Simplifying assump-
                    tions are made to the study due to limited data availability and consistency across the study aquifers.

RICHEY ET AL.       STORAGE ESTIMATES IN A TOTAL GROUNDWATER STRESS FRAMEWORK                                                         2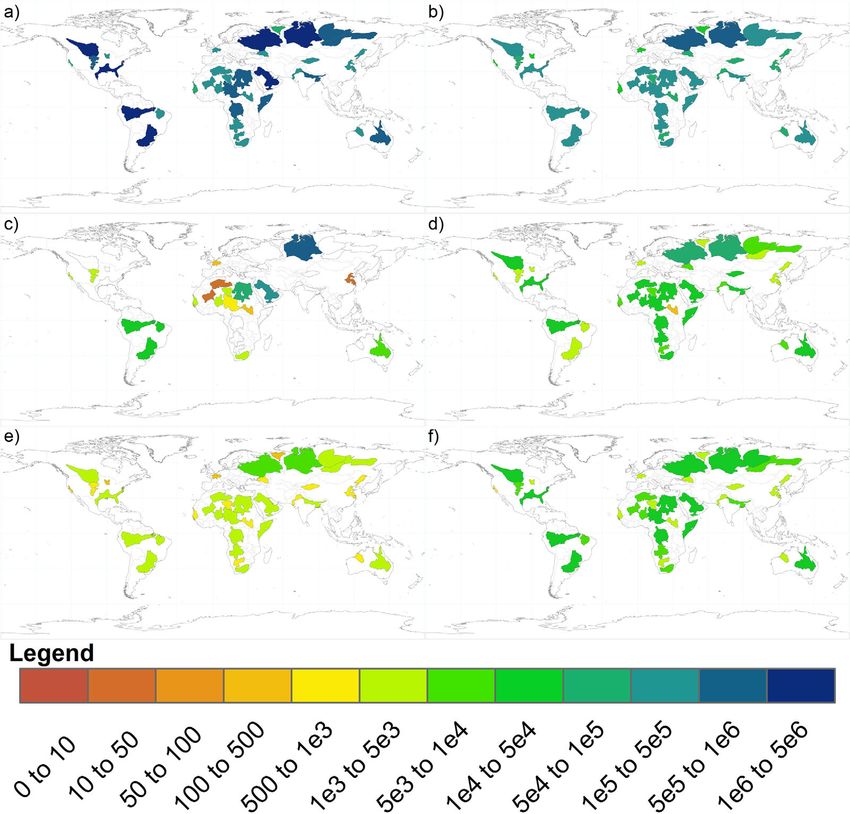
Water Resources Research                                                                                           10.1002/2015WR017351

Figure 1. Study aquifers by continent based on the WHYMAP delineations of the world’s large aquifer systems [WHYMAP and Margat, 2008]. The number represents the aquifer identifi-
cation number associated with the aquifer name listed below for each system. The world’s largest lakes and reservoirs are based on the Global Lake and Wetland Database Level-1 lakes
and reservoirs [Lehner and D€
                            oll, 2004].

                                             2. Data and Methods
                                             Previous water stress studies [Alcamo et al., 1997; Vo €ro
                                                                                                      €smarty et al., 2000; Oki and Kanae, 2006; Do€ll, 2009;
                                             Richey et al., 2015] evaluated the ratio of water use to water availability, where groundwater availability was
                                             defined as the volume of recharge to the aquifer system. Such approaches highlight historical groundwater
                                             use in relation to renewable groundwater recharge to manage groundwater systems yet fail to account for
                                             the buffer capacity of aquifer storage. For example, an aquifer system with little storage has a limited ability
                                             to buffer against drought and excessive groundwater pumping as compared to an aquifer system with large
                                             storage volumes.

                                             2.1. Subsurface Depletion
                                             We use observations from the Gravity Recovery and Climate Experiment (GRACE) satellite mission [Tapley
                                             et al., 2004] to quantify changes in subsurface storage in the study aquifers. GRACE is a joint mission
                                             between the United States and the Deutsche Forschungsanstalt f€   ur Luft und Raumfahrt (DLR) in Germany
                                             to monitor changes in Earth’s gravity field that can be used to isolate time-variable anomalies in terrestrial
                                             water storage. The Center for Space Research at the University of Texas at Austin provided the 132 months
                                             of GRACE gravity coefficients from Release-05 data used in this study.
                                             Gravity anomalies from GRACE observations are processed for the study period (January 2003 to December
                                             2013) to produce average terrestrial water storage anomalies for each of the 37 study aquifers [Swenson
                                             and Wahr, 2002; Wahr et al., 2006; Swenson and Wahr, 2006]. The processing results in some lost signal

RICHEY ET AL.                                STORAGE ESTIMATES IN A TOTAL GROUNDWATER STRESS FRAMEWORK                                                                              3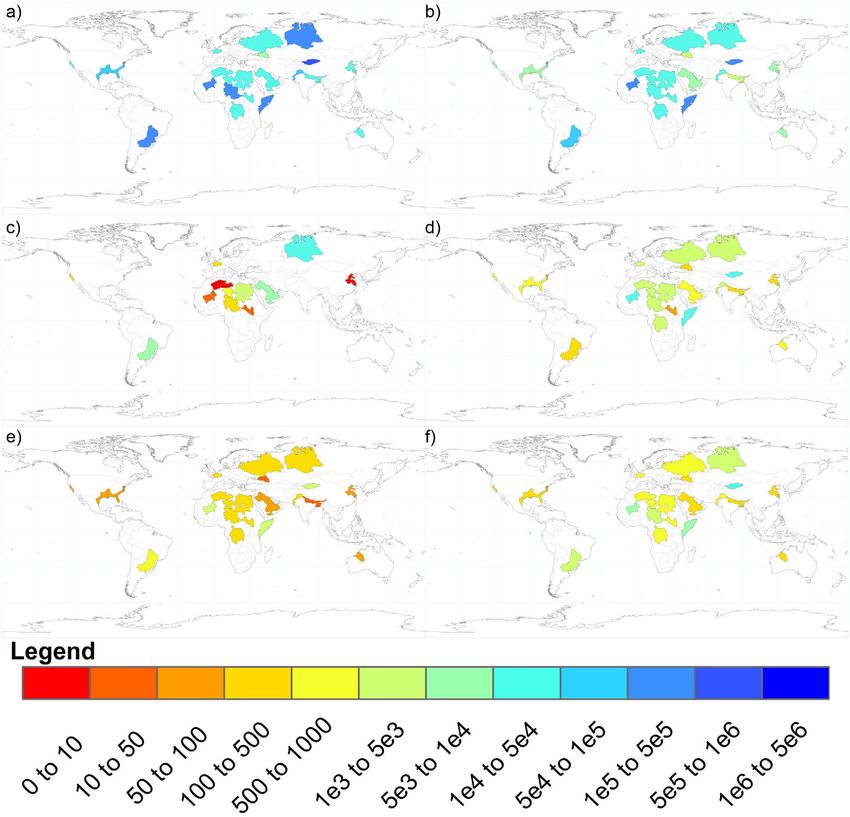
Water Resources Research                                                                  10.1002/2015WR017351

                    power from truncating the gravity coefficients (at degree and order 60) and filtering. Aquifer-specific scaling
                    factors are used to account for the lost signal power and to estimate unbiased mass change in each aquifer
                    system [Velicogna and Wahr, 2006]. The truncation has a greater influence on smaller regions, therefore
                    accuracy of GRACE estimates increases as the area of the region of interest increases [Wahr et al., 2006].
                    Total water storage anomalies are isolated from the total gravity anomalies as the time-variable component
                    of the GRACE signal, representing combined natural (N), and anthropogenic (A) anomalies in snow water
                    equivalent (SWE), soil moisture (SM), groundwater (GW), and surface water (SW) according to equation (1).
                    Anomalies in individual storage components can be isolated by removing anomalies in the remaining stor-
                    age terms from DSN1A with independent estimates of these components according to equation (2) [Rodell
                    and Famiglietti, 2002; Swenson et al., 2006; Yeh et al., 2006; Strassberg et al., 2007, 2009; Rodell et al., 2004b,
                    2007, 2009; Swenson et al., 2008; Famiglietti et al., 2011; Scanlon et al., 2012]. In equation (2), we isolate sub-
                    surface storage, defined as the combination of soil moisture and groundwater, to be consistent with total
                    storage estimates that begin at the ground surface as defined in section 2.2. Auxiliary data sets for SWE and
                    SW are necessary to separate subsurface anomalies for the remaining storage terms.
                                                          DSN1A 5DðSW1SWE1SM1GWÞN1A                                                 (1)

                    In our evaluation, we use model output from the NASA Global Land Data Assimilation System (GLDAS)
                    [Rodell et al., 2004a] including the Noah [Chen et al., 1996; Koren et al., 1999], Community Land Model 2.0
                    (CLM2) [Dai et al., 2003], and Variable Infiltration Capacity (VIC) [Liang et al., 1994] models to quantify natural
                    changes in SWE and canopy surface water (CAN). Surface water storage (SW) as stocks in lakes, reservoirs,
                    and river channels is not included in the GLDAS modeling system; thus, for SW, we use the sum of routed
                    surface water discharges (RIV) from the Community Land Model 4.0 (CLM 4.0) [Oleson et al., 2010] and CAN.
                    CLM 4.0 was driven in an offline simulation by 3 hourly precipitation, near surface air temperature, solar
                    radiation, specific humidity, wind speed, and air pressure from GLDAS Version-1 [Rodell et al., 2004a]. The
                    model was run for the study period at 0.98 3 1.258 spatial resolution and linearly interpolated to 18 3 18
                    and monthly temporal resolution.
                                                           DSUBN1A 5DSN1A 2DðSW1SWEÞN                                               (2)

                    Anomalies in subsurface storage are computed as the residual between the GRACE total water storage
                    anomalies and the model-based storage anomalies of SWE and SW for each study aquifer. We assume the
                    anthropogenic influence on the storage anomalies is dominated by subsurface variations, particularly from
                    groundwater, and that the direct anthropogenic influence on the remaining storage components is negligi-
                    ble in comparison. This is due to the spatial scale of the infrastructure necessary to capture snow and sur-
                    face water for anthropogenic uses being significantly smaller than the aquifer study areas [Vo €ro
                                                                                                                    €smarty et al.,
                    2000; Richey and Famiglietti, 2012].
                    The subsurface error was calculated using equation (3) for each month (i), assuming the errors from each
                    storage component are independent. Aquifer-specific satellite measurement and leakage error from proc-
                    essing the gravity anomalies is computed following Wahr et al. [2006] to estimate error in the total GRACE
                    signal. Variance of SWE and CAN was determined using the three-model ensemble and thus represents a
                    combination of estimate error and model representation error. The U.S. Geological Survey errors for hydro-
                    logic measurements range from excellent (5% error) to fair (15% error) [U.S. Geological Survey, 2014]; for our
                    evaluation, we assume measurement error of 50% for RIV to represent a conservative uncertainty in GRACE
                    subsurface variability.
                                                                qffiffiffiffiffiffiffiffiffiffiffiffiffiffiffiffiffiffiffiffiffiffiffiffiffiffiffiffiffiffiffiffiffiffiffiffiffiffiffiffiffiffiffiffiffiffiffiffiffi
                                                       rDSUB;i 5 r2S;i 1r2SWE;i 1r2CAN;i 1r2RIV;i                               (3)

                    A conservative estimate of groundwater trends can be identified if we attribute observed subsurface trends
                    solely to groundwater storage. Such an approach is considered here, as the majority of soil mass trends are
                    not significant globally [Sheffield and Wood, 2008; Dorigo et al., 2012]. We consider the groundwater trend,
                    DGWtrend, to be representative of the net flux of water storage resulting from groundwater use (DGWN1A),
                    including the aquifer response to pumping, and natural climatic variability. Annual trend magnitudes were
                    estimated using the weighted regression in equation (4). The weights, wi, are a function of the variance in
                    the monthly estimates of subsurface storage anomalies. Aquifers with a negative coefficient were

RICHEY ET AL.       STORAGE ESTIMATES IN A TOTAL GROUNDWATER STRESS FRAMEWORK                                                        4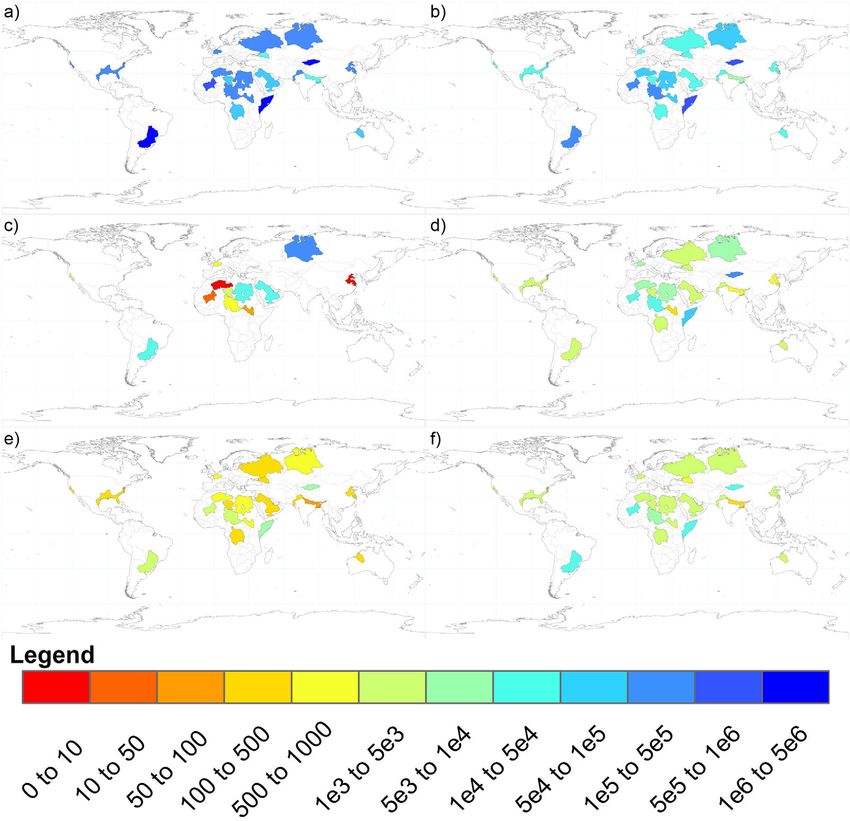
Water Resources Research                                                                 10.1002/2015WR017351

                    considered to be depleting in aquifer storage while positive coefficients were considered to be recharging
                    systems. Here, we evaluate only the magnitude of trends without regard to trend significance. Figure 4d
                    from Richey et al. [2015] demonstrates this method by showing the time series and associated trend in sub-
                    surface storage anomalies for the Ganges-Brahmaputra Basin (Aquifer 24, ‘‘Ganges’’). A comparison between
                    depletion estimates from this study are compared to available depletion estimates in eight study aquifers
                    (supporting information Text S1).
                                                                                                 1
                                                        Y i 5b0 1b1 w i x i 1ei where w i 5                                     (4)
                                                                                              r2DSUB;i

                    2.2. Water Availability
                    Groundwater is frequently pumped beyond the renewable rate thus depleting groundwater storage over
                    time [Theis, 1940; Sahagian et al., 1994; Konikow and Kendy, 2005; Famiglietti, 2014]. This study revises the
                    definition of groundwater availability from recharge, as previously used in a stress framework [Do   €ll, 2009;
                    Wada et al., 2010; Richey et al., 2015], to total groundwater storage, as recommended by Taylor [2009].
                    Defining groundwater availability as the total volume of groundwater in storage allows for the concepts of
                    resiliency and buffer capacity to be explored as a component of groundwater stress. This is important in
                    regions that may be considered stressed based on renewable supplies of groundwater but that contain a
                    large volume of storage [MacDonald et al., 2012].
                    We group available and revised storage estimates into three categories: historical, regional, and revised esti-
                    mates. The historical estimates distribute the range of most commonly cited global groundwater storage
                    estimates into the study aquifers. The regional estimates are comprised aquifer-specific storage estimates
                    from readily accessible regional case studies. We develop the revised estimates based on modifications to
                    the historical methods to constrain the large uncertainty range in existing aquifer storage estimates. Aqui-
                    fers with high and low volumes of storage are compared to aquifers with high and low volumes of recharge
                    to show the influence of defining availability based on a renewable flux or total stocks. Basin-averaged
                    mean annual recharge from Richey et al. [2015] is used to quantify recharge in this study. Negative values of
                    recharge highlight basins where upward capillary fluxes are the dominant subsurface flux and positive val-
                    ues indicate a downward flux [Richey et al., 2015].

                    2.2.1. Historical Storage Estimates
                    Nace [1969] and Korzun [1978] provide lower and upper total estimates of global groundwater storage,
                    respectively. The storage limits were calculated by equation (5), with the difference between the estimates
                    originating in the respective values used for effective thickness (b) and porosity (n) in the subsurface. The
                    historical approaches assume uniform groundwater supply across the global land area (A), excluding Green-
                    land and Antarctica; however, it is unrealistic to assume uniform groundwater across the global land area
                    [Alley, 2006].
                                                                         V5bnA                                                  (5)

                    The lower storage boundary (7 3 106 km3) assumed an effective subsurface thickness as 1000 m and an
                    effective porosity of 1% over the global land area. An arbitrary increase to the resulting volume was applied
                    based on the author’s belief that the total storage should be approximately five times greater than the cal-
                    culated storage [Nace, 1969]. The upper boundary (23 3 106 km3) calculated storage for each continent by
                    dividing the subsurface into three zones of varying thickness with associated porosity of 15%, 12%, and 5%
                    depending on depth (Table 1) totaling 2000 m. Continental groundwater storage was then summed to
                    obtain the global storage estimate. Shiklomanov [1993] warned that these estimates are inaccurate approxi-
                    mations based on coarse assumptions.
                    In the present study, we distribute the global values by Nace [1969] and Korzun [1978] into the study aqui-
                    fers based on an area weighted scheme by assuming the majority of global groundwater in storage exists
                    in the largest global aquifers (supporting information Table S1) [Margat, 2007; Margat and van der Gun,
                    2013]. The lower global groundwater estimate by Nace [1969] (7 3 106 km3) was distributed into the study
                    aquifers based on a ratio of each aquifer’s area to the total global aquifer area. The upper global ground-
                    water estimate by Korzun [1978] (23 3 106 km3) first calculated continental groundwater storage with

RICHEY ET AL.       STORAGE ESTIMATES IN A TOTAL GROUNDWATER STRESS FRAMEWORK                                                    5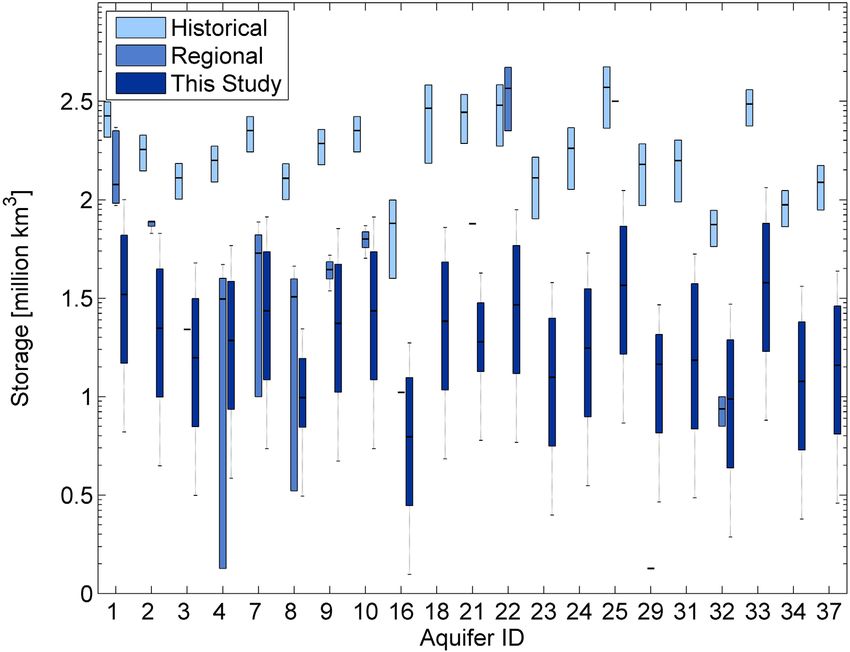
Water Resources Research 10.1002/2015WR017351
varying saturated thickness by con-
Table 1. Adapted From Korzun [1978] as Inputs to Equation (5) to Provide the
Upper Bound of the Historical Estimate of Storage tinent. Therefore, the continental
Thickness Groundwater Groundwater storage estimates (Table 1) are indi-
Total of Effective Volume Volume vidually distributed based on the
Area Zone Porosity by Zone by Continent
Continent (106 km2) (m) (%) (106 km3) (106 km3)
ratio of each aquifer’s area to total
aquifer area for each continent.
Europe 10.5 100 15 0.2 1.6
200 12 0.3 2.2.2. Regional Storage Estimates
2000 5 1.1
Where available, regional estimates
Asia 43.5 200 15 1.3
7.8
400 12 2.1 of storage for individual study aqui-
2000 5 4.4 fers are used from a combination
Africa 30.1 200 15 1
5.5
400 12 1.5
of regional case studies [Al-Ibrahim,
2000 5 3 1991; Llamas et al., 1992; Swezey,
North America 24.2 200 15 0.7
4.3 1999; Wallin et al., 2005; Tujchneider
400 12 1.2
2000 5 2.4
et al., 2007] and compilations of
South America 17.8 100 15 0.3
3 regional data [Sahagian et al., 1994;
400 12 0.9 Vrba and van der Gun, 2004; Margat
2000 5 1.8
Australia 8.9 100 15 0.1
1.2 and van der Gun, 2013; MacDonald
and Oceania 200 12 0.2 et al., 2012] as summarized in sup-
2000 5 0.9
porting information Table S1. The
Total
23.4
historical and revised estimates are
compared to the regional esti-
mates, when available. The regional
estimates are most commonly derived from groundwater models [e.g., Cao et al., 2013] or measured esti-
mates of saturated thickness and aquifer parameters [e.g., Williamson et al., 1989]. Therefore, the regional
estimates provide both an initial constraint on the range of possible storage and summarize the state of
knowledge on aquifer-specific storage estimates.
Additional processing was applied to the original storage estimates by MacDonald et al. [2012]. They pro-
vide a gridded range of groundwater storage estimates across Africa at five kilometer spatial resolution.
These estimates were linearly interpolated to 18 3 18 resolution and our 13 study aquifers in Africa were iso-
lated from the available data. We determine total storage in the study aquifers based on the minimum,
mean, and maximum values across the range of storage estimates.
2.2.3. Revised Storage Estimates
We implement two revisions to the approaches of Nace [1969] and Korzun [1978] to constrain aquifer stor-
age estimates using hydrogeologic assumptions. The first constraint replaces the porosity in equation (5)
with specific yield (Sy) to represent the volume of groundwater that is extractable from storage [Johnson,
1967; Williamson et al., 1989; Alley, 2006]. Using specific yield instead of porosity reduces the estimate of
storage, since not all water in the pore space is extractable as is indicated by the use of porosity [Alley,
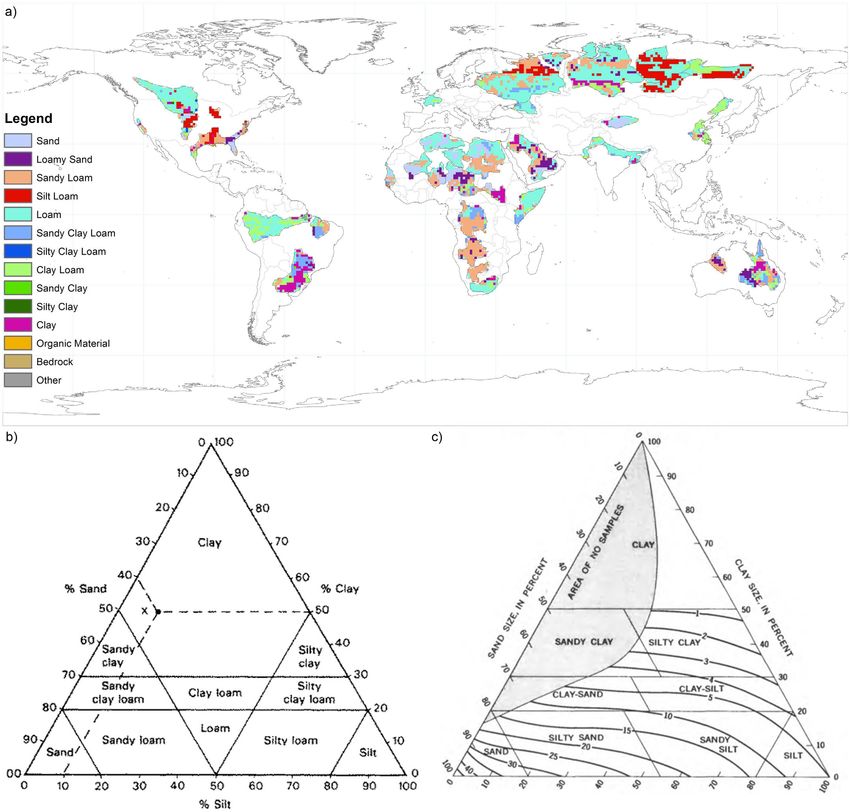
2006]. To estimate specific yield, we apply a 18 3 18 global, USDA soil texture class map that was derived for
GLDAS [Rodell et al., 2004a] based on percentages of sand, silt, clay from the soils data set of Reynolds et al.
[2000] (Figure 2a). The most common soil class in each aquifer is determined as the mode for each aquifer.
We then overlay the simplified soil classification triangle in Figure 2b [International Labour Organization
(ILO), 1987] with the specific yield triangle in Figure 2c [Johnson, 1967]. The soil classification and specific
yield triangles are used to determine a range of specific yield values (Sy) for each aquifer’s dominant soil class
to be used in equation (6) to calculate aquifer storage. These values are summarized in Table 2. We follow the
suggestion of 200 m as an average limit to the active zone of groundwater exchange to represent saturated
thickness in equation (6) along with aquifer area (Aaq) [Margat and van der Gun, 2013].
V aq 5ð200mÞSy Aaq (6)
V aq 5bð1%ÞAaq (7)
The second constraint focuses on the saturated thickness in equation (5). Nace [1969] and Korzun [1978]
used 1000 and 2000 m, respectively, although it is unlikely that the water at these depths is fully accessi-
ble and of a high enough quality to use, given that groundwater quality generally decreases with depth
RICHEY ET AL. STORAGE ESTIMATES IN A TOTAL GROUNDWATER STRESS FRAMEWORK 6Water Resources Research 10.1002/2015WR017351
Figure 2. (a) 18 3 18 global-gridded USDA soil texture class map in the study aquifers derived for GLDAS [Rodell et al., 2004a] based on percentages of sand, silt, clay from the soils data
set of Reynolds et al. [2000] used to determine the dominant soil type in each aquifer system. (b) Simplified soil classification triangle based on percentages of sand, silt, and clay [ILO,
1987]. (c) Soil classification triangle coupled with estimates of specific yield from Johnson [1967] to determine the range of specific yields associated with each soil type. The contours
represent specific yield as a percentage.
[Alley 2006, 2007; Faunt, 2009]. In this analysis, we evaluate a range of aquifer thickness including 20, 50,
100, 200, 500, and 1000 m. We use a constant porosity of 1% following Nace [1969] and aquifer area as
the remaining inputs to equation (7). This method identifies the potential storage in the aquifer systems,
but does not explicitly identify the depth interval across which the saturated thickness is located. Identify-
ing the water table depth combined with the depth to bedrock would further constrain the accessibility
of groundwater as a water supply source. However, this is beyond the scope of the current study, which is
limited to quantifying total storage.
RICHEY ET AL. STORAGE ESTIMATES IN A TOTAL GROUNDWATER STRESS FRAMEWORK 7Water Resources Research 10.1002/2015WR017351
2.3. Total Groundwater Stress
Table 2. Determination of Specific Yield for the Study Aquifersa
We quantify groundwater resilience to
Aquifer ID Soil Type Minimum Sy Mean Sy Maximum Sy
explore the impact of natural and anthropo-
1 Loam 10 16.5 23
2 Loam 10 16.5 23 genic disturbance as observed from GRACE
3 Loam 10 16.5 23 and our revised estimates of groundwater
4 Loam 10 16.5 23 storage. We introduce the Total Groundwater
5 Sandy loam 10 22.5 35
6 Sandy loam 10 22.5 35 Stress (TGS) ratio that estimates the number
7 Sandy loam 10 22.5 35 of years until the aquifer is depleted in equa-
8 Clay 0.5 2.5 4.5
tion (8) to evaluate aquifer resilience. The net
9 Loam 10 16.5 23
10 Sandy loam 10 22.5 35 groundwater storage changes (DGWtrend),
11 Sandy loam 10 22.5 35 termed groundwater depletion, are quanti-
12 Sandy loam 10 22.5 35
fied with the GRACE-derived groundwater
13 Loam 10 16.5 23
14 Loam 10 16.5 23 trend from section 2.1. For the purpose of
15 Silt loam 4 14 24 this study, we assume that the rate of deple-
16 Sandy loam 10 22.5 35
17 Silt loam 4 14 24
tion will remain constant into the future.
18 Sandy loam 10 22.5 35
V p%
19 Loam 10 16.5 23 TGSp% 5 (8)
20 Sandy clay Loam 4 8.5 13 DGW trend
21 Clay 0.5 2.5 4.5
22 Loam 10 16.5 23 The total storage estimates from section 2.2
23 Loam 10 16.5 23 are used to estimate groundwater storage (V)
24 Loam 10 16.5 23
25 Loam 10 16.5 23 for each study aquifer. It is unrealistic to fully
26 Silt loam 4 14 24 deplete an aquifer system as changes in water
27 Silt loam 4 14 24
quality, accessibility, and soil properties will
28 Silt loam 4 14 24
29 Clay loam 4 7 10 limit the amount of groundwater that can be
30 Clay loam 4 7 10 extracted [Alley, 2007]. To account for the pos-
31 Sand 15 30 45
32 Loam 10 16.5 23
sible range of usable groundwater storage,
33 Loam 10 16.5 23 TGS is computed for percentages (p%) of V to
34 Loam 10 16.5 23 determine the number of years until the vol-
35 Loam 10 16.5 23
36 Sandy clay Loam 4 8.5 13
ume in storage is depleted by p percent. We
37 Sandy loam 10 22.5 35 quantify the number of years until the study
a
The dominant soil type is determined as the mode of the soil type
aquifers are depleted to thresholds set at 25%
based on Figure 2a. The soil triangles in Figures 2b and 2c are overlaid and 90% of total capacity. For example,
to determine the minimum and maximum specific yield value for each TGS90% computes the number of years until
aquifer. The average of these values is determined as the mean.
the total volume in storage is depleted by 90%
of the total storage capacity. The percentage
values can also account for the influence of depletion that may have occurred prior to the study period. Support-
ing information Text S2 provides additional discussion on the influence of prior depletion for the aquifers that
have available long-term depletion estimates.
3. Results
3.1. Total Groundwater Storage
3.1.1. Comparison of Historical and Regional Estimates
Figure 3 summarizes the range of storage estimates representing the groundwater availability input in the
Total Groundwater Stress (TGS) ratio for the depleting aquifers. For each aquifer, estimates delineate histori-
cal estimates (left), regional estimates from section 2.2.2 (middle) and revised estimates (right) based on
ranges of specific yield and saturated thickness as described in section 2.2.3. For nine of the aquifers, the
regional estimates and revised estimates are within a similar range. In comparison, the historical estimates
are above the range of either the regional or revised estimates. Eight of these depleting aquifers do not
have regional estimates for comparison. This suggests that the revised estimates can provide a new base-
line storage estimate based on hydrogeologic parameters for the aquifer systems that lack regional esti-
mates. The range of storage estimates is summarized in supporting information Table S1.
Figures 4a and 4b show the distributed historical estimates of storage in the study aquifers. Within the historical
estimates, the differences between the lower and upper limits of storage vary by a factor between about
RICHEY ET AL. STORAGE ESTIMATES IN A TOTAL GROUNDWATER STRESS FRAMEWORK 8Water Resources Research 10.1002/2015WR017351
Figure 3. Estimates of total storage (million km3) in the depleting study aquifers on a log scale based on the historical, regional, and
revised estimates of storage (‘‘This Study’’). The median is present within the boxplots. The outliers have been removed. Aquifers with a
single estimate of storage in a category are marked with a single median marker (–).
2 and 6. The discrepancy is a function of the saturated thickness value as either 1000 or 2000 m and the value of
porosity assumed as a constant 1% or varying with depth. The difference between storage estimates is increased
when comparing the historical and regional estimates in the 23 study aquifers with independent estimates of
storage (Figure 4c). A comparison between Figures 4c and 4a–4b highlights the large discrepancy between the
commonly cited historical estimates and the regional case studies, as they differ over 3–4 orders of magnitude
(supporting information Table S1). For example, Swezey [1999] cite the volume of storage in the Northwest
Sahara Aquifer System (Aquifer #2, ‘‘Sahara’’) as between 28 and 70 km3 as compared to 450,000 km3 from the
distributed estimate by Korzun [1978]. This comparison shows that the majority of the historical estimates pro-
vide large overestimations of the volume of water in storage when compared to available regional estimates.
3.1.2. Revised Estimates
The revised estimates constrain the range of historical and regional estimates of aquifer storage. Figures
4d–4f select three combinations of equations (6) and (7) to illustrate the influence of changing hydrogeo-
logic constraints from the historical methods. The remaining combinations of equations (6) and (7) are dis-
cussed below and listed in supporting information Table S1. Figure 4d shows storage in the study aquifers
according to equation (6), where storage is the product of the minimum specific yield, 200 m saturated
thickness, and the aquifer area. Figures 4e and 4f maintain the 1% porosity assumption from Nace [1969],
with aquifer area and saturated thickness of 200 and 1000 m, respectively.
A comparison is made between the minimum regional estimates and the revised estimates to determine the
combination of hydrogeologic characteristics that produce the closest estimate to regional values. Supporting
information Table S1 shows which hydrogeologic characteristics can be combined to reproduce the regional
storage estimates. We find that the majority of the study aquifers require the minimum specific yield estimate
in equation (6) or a saturated thickness less than 500 m from equation (7). For example, the 110 km3 storage
capacity estimate in the Sudd Basin (Aquifer #8, ‘‘Sudd’’) [Margat and van der Gun, 2013] can be reproduced
with an assumed 1% porosity and a saturated thickness between 20 and 50 m. This is 2 orders of magnitude
RICHEY ET AL. STORAGE ESTIMATES IN A TOTAL GROUNDWATER STRESS FRAMEWORK 9Water Resources Research 10.1002/2015WR017351
Figure 4. Estimates of total storage in each study aquifer based on the historical, regional, and revised estimates in cubic kilometers. (a)
Distributed upper historical limit by Korzun [1978], (b) distributed lower historical limit by Nace [1969], (c) the minimum available regional
estimate, (d) revised storage estimated according to equation (6) with minimum estimate of specific yield, (e) revised storage estimated
according to equation (7) with 200 m saturated thickness, (f) revised storage estimated according to equation (7) with 1000 m saturated
thickness. Outlined aquifers without colors indicate systems that lack available regional storage estimates. Note that, many cases, the his-
torical estimates of Nace [1969] and Korzun [1978] are 1–3 orders of magnitude larger than the regional estimates, and as such, we place
little confidence in them. See supporting information Table S1 and the text for more information.
less than the assumed saturated thickness by Nace [1969] and Korzun [1978]. Additionally, Margat and van der
Gun [2013] report a storage range for the Paris Basin (Aquifer #32, ‘‘Paris’’) as between 500 and 1000 km3. The
reported range for the Paris can be reproduced with 1% porosity and between 200 and 500 m saturated thick-
ness, less than half the thickness reported by Nace [1969] and Korzun [1978]. These discrepancies imply that
these historical assumptions result in a severe overestimation of aquifer storage.
3.2. Distribution and Severity of Total Groundwater Stress
3.2.1. Total Groundwater Stress
Figures 5 and 6 present Total Groundwater Stress (TGS) as the ratio of total groundwater storage to ground-
water depletion for 25% and 90% depletion, respectively. The TGS ratio results in the number of years to
depletion, in this case assuming depletion continues at a constant rate into the future. Supporting information
Tables S2 and S3 summarize the results of TGS for the range of storage estimates presented in this study. The
TGS ratio varies over orders of magnitude within an aquifer system, depending on the storage estimate used,
indicating that the uncertainty in aquifer storage severely limits the calculation of aquifer resilience.
Supporting information Table S4 shows that the depletion, storage, and TGS estimates from the current
study are within the range of available published estimates for eight study aquifers. Supporting information
RICHEY ET AL. STORAGE ESTIMATES IN A TOTAL GROUNDWATER STRESS FRAMEWORK 10Water Resources Research 10.1002/2015WR017351
Figure 5. Total Groundwater Stress as the number of years to 25% depletion (TGS25%). (a) Distributed upper historical limit by Korzun
[1978], (b) distributed lower historical limit by Nace [1969], (c) the minimum available regional estimate, (d) revised storage estimated
according to equation (6) with minimum estimate of specific yield, (e) revised storage estimated according to equation (7) with 200 m sat-
urated thickness, (f) revised storage estimated according to equation (7) with 1000 m saturated thickness. See text for discussion of lack of
confidence in TGS estimates using the historical storages from Nace [1969] and Korzun [1978].
Text S2 presents a detailed discussion of this comparison and assesses the influence of depletion prior to
the study period on the TGS estimates. Prior depletion was found to have the greatest influence in the Cen-
tral Valley, resulting in a 12% decrease in TGS. Prior depletion had negligible influence on the remaining
aquifers with records of 20th century depletion, discussed further in supporting information Text S2.
The Ganges has the highest rate of depletion from GRACE of 19.6 6 1.2 millimeters per year (mm/yr)
(12.2 6 0.8 km3/yr). The TGS ratio in the Ganges ranges from approximately 10 years to 90% depletion
based on the lowest revised estimate of storage to nearly 10,000 years with the lower historical estimate.
Conversely, the Tarim Basin (Aquifer #31, ‘‘Tarim’’) has the lowest depletion rate by GRACE of
0.23 6 0.3 mm/yr (0.11 6 0.1 km3/yr) and low water availability based on recharge, the lower historical esti-
mate, and the revised estimate by equation (7). The Tarim is a small aquifer by area, but the low depletion
rate results in approximately 800 years to 90% depletion by the smallest storage estimate.
3.3. A Comparison of Total and Renewable Groundwater Stress
Renewable Groundwater Stress (RGS) as defined by Richey et al. [2015] evaluates aquifer stress resulting
from renewable groundwater availability as the estimated groundwater recharge rate. Table 3 summarizes
the differences in groundwater availability in the study aquifers depending on whether recharge or storage
RICHEY ET AL. STORAGE ESTIMATES IN A TOTAL GROUNDWATER STRESS FRAMEWORK 11Water Resources Research 10.1002/2015WR017351
Figure 6. Total Groundwater Stress as the number of years to 90% depletion (TGS90%). (a) Distributed upper historical limit by Korzun
[1978], (b) distributed lower historical limit by Nace [1969], (c) the minimum available regional estimate, (d) revised storage estimated
according to equation (6) with minimum estimate of specific yield, (e) revised storage estimated according to equation (7) with 200 m sat-
urated thickness, (f) revised storage estimated according to equation (7) with 1000 m saturated thickness. See text for discussion of lack of
confidence in TGS estimates using the historical storages from Nace [1969] and Korzun [1978].
is used to define availability. It shows that the definition can change whether a system is considered to
have limited or plentiful supplies. The Nubian Sandstone Aquifer System (Aquifer #1, ‘‘Nubian’’) has negligi-
ble renewable supplies but a large volume of water in storage.
The definition of water availability as storage or recharge further influences the assessment of groundwater
resilience and stress, based on the RGS and TGS ratios. Although the estimate of groundwater depletion
remains the same between the renewable [Richey et al., 2015, Figure 9] and total (Figures 5 and 6)
stress ratios, the distribution and severity of each type of stress differs as a function of the definition of avail-
ability as a renewable flux or as a total storage volume. In our comparison, we only consider depleting aqui-
fers to assess differences between RGS and TGS since aquifers that have positive trends in groundwater
storage anomalies are considered to be resilient systems over the study period.
The aquifers that are considered overstressed or highly stressed from the RGS ratio and that remain highly
stressed from the TGS ratio are indicative of aquifers that lack resilience due to high depletion with limited
buffer capacity. There are eight aquifers that are overstressed by the RGS ratio, which is considered the least
sustainable characteristic RGS stress regime. Only two of these systems remain highly stressed by TGS based
on the minimum of regional estimates, including the Sahara. The Sahara has about 10 years to 90%
RICHEY ET AL. STORAGE ESTIMATES IN A TOTAL GROUNDWATER STRESS FRAMEWORK 12Water Resources Research 10.1002/2015WR017351
Table 3. A Comparison of Groundwater Availability Estimates Defined as Mean Annual Recharge and as Total Storagea
Margat
and van der Equation (6):
Mean Annual Aquifer Nace Aquifer Gun [2013]- Aquifer Minimum Sy, Aquifer Equation (7):
Aquifer ID Recharge (mm) ID [1969] (km3) ID Minimum (km3) ID b 5 200 m (km3) ID b 5 20 m (km3)
8 218.4 16 16,000 4 18 8 490 16 16
12 212.3 15 28,000 29 18 15 1,100 15 27
13 211.8 32 33,000 8 110 16 1,600 32 38
9 25.9 35 40,000 32 500 21 1,800 35 44
23 24.6 5 41,000 7 1,000 30 2,100 30 53
17 23.7 34 53,000 16 1,100 29 3,400 5 55
22 22.6 30 54,000 32 3,800 34 57
31 20.7 23 64,000 17 4,100 23 63
1 20.3 37 79,000 35 4,400 37 83
2 20.3 29 87,000 20 4,500 29 85
3 20.2 12 88,000 27 4,800 12 86
4 1.0 31 95,000 5 5,500 31 93
7 6.0 3 100,000 5 1,500 34 5,700 8 98
37 6.1 8 100,000 13 3,000 23 6,300 3 99
14 8.4 17 100,000 3 4,800 28 6,900 17 100
6 11.2 20 110,000 36 8,700 37 8,300 20 110
36 13.7 6 120,000 6 10,000 12 8,600 6 120
28 16.5 13 120,000 17 15,000 3 9,900 13 120
10 19.0 27 120,000 20 18,000 26 9,900 24 120
30 20.2 24 130,000 6 12,000 27 120
16 24.1 4 150,000 13 12,000 4 150
34 28.8 28 170,000 24 12,000 28 170
5 34.4 2 200,000 31 14,000 2 200
26 36.2 11 210,000 36 14,000 11 200
27 36.4 9 220,000 4 15,000 9 220
25 39.4 18 230,000 2 20,000 18 230
29 96.6 26 250,000 11 20,000 26 250
33 98.6 7 300,000 9 22,000 7 300
11 101.1 10 300,000 18 23,000 10 300
32 133.6 14 310,000 7 30,000 14 300
15 151.8 22 350,000 10 30,000 22 340
35 161.3 36 350,000 19 32,000 14 30,000 36 350
18 168.4 21 370,000 21 57,000 22 34,000 21 360
24 214.4 1 430,000 2 60,000 1 44,000 1 440
21 225.7 19 470,000 1 540,000 19 46,000 19 460
20 323.0 25 530,000 25 1,000,000 25 54,000 25 540
19 546.6 33 560,000 22 2,200,000 33 57,000 33 570
a
The determination of low (high) availability is determined as the lowest (highest) third of available supplies across the study aquifers. A negative value of recharge refers to sys-
tems that are dominated by the upward flow of capillary fluxes away from the water table as opposed to the positive (downward) flux of recharge.
depletion from the minimum regional estimate of storage. However, the uncertainty in storage estimates is
highlighted in the Sahara where TGS90% ranges from about 10 years to 150,000 years within different
regional estimates.
The majority of the aquifers characterized by low renewable stress have high levels of total stress. The
Ganges is a highly depleting system, but has a high rate of mean annual recharge that result in low renew-
able stress ratios. These systems have low numbers of years to 90% depletion based on the revised esti-
mates of storage, but there is no regional estimate for comparison. These aquifers are vulnerable to
increases in depletion or decreases in recharge that might result in a shift from low to high renewable stress
conditions, which could pressure the long-term buffer capacity of the aquifer.
4. Discussion
We show that a wide range of variability exists in estimates of total storage, leading to great uncertainty in
the state of global groundwater stocks. Even within a single aquifer, storage estimates vary over multiple
orders of magnitude. This finding supports the warnings by Shiklomanov [1993] and Famiglietti [2014] that
the historical estimates providing our current knowledge of global groundwater storage are inaccurate. The
uncertainty range clearly indicates that in most cases, we do not know how much groundwater exists in
RICHEY ET AL. STORAGE ESTIMATES IN A TOTAL GROUNDWATER STRESS FRAMEWORK 13Water Resources Research 10.1002/2015WR017351
storage to maintain unsustainable groundwater depletion. Therefore, the ability to quantify aquifer resil-
ience is severely limited.
The previous state of knowledge on groundwater stocks relied on the historical estimates that likely overes-
timate groundwater volume for the study aquifers by multiple orders of magnitude. The historical estimates,
based on the assumption that there is a constant and extensive groundwater supply across the global land
surface, create a severe misrepresentation of the volume of global groundwater. Such overestimates can
lead to an assumption that groundwater is an infinite resource: as such they should no longer be blindly
accepted as realistic estimates of groundwater storage. By comparing historical and regional estimates of
storage, we show that such an assumption is not valid in all of the study aquifers, for example, in the Sahara,
Taoudeni-Tanezrouft Basin (Aquifer #4, ‘‘Taoudeni’’), and North China Aquifer System (Aquifer #29, ‘‘North
China’’) with minimum reported regional estimates of less than 30 km3. Simple hydrogeologic assumptions
were made that constrain the estimates of groundwater storage to within a range that more closely
matches available regional estimates. Aquifer-specific estimates of saturated thickness and specific yield
based on in situ observations are essential to further constrain the revised storage estimates and provide
realistic TGS ratios.
The influence of total storage on aquifer resilience is highlighted by a comparison between the Nubian and
the Sahara. The depletion rates in the aquifers are similar at 6.08 6 1.9 and 2.69 6 0.8 cubic kilometers per
year (km3/yr), respectively. The depletion rate in the Sahara is comparable to the reported rate of greater
than 2.2 km3/yr by Mamou et al. [2006]. The GRACE-based depletion rate in the Nubian is greater than the
value of 2.17 km3/yr from Bakhbakhi [2006], although this value was reported for the year 2000 and has not
been updated for the GRACE period. The overstressed Renewable Groundwater Stress (RGS) ratios of 10.6
for the Nubian and 10.8 for the Sahara are also similar between the aquifers. However, the estimates of total
storage in each aquifer result in contrasting estimates of TGS. The minimum regional estimate of storage in
the Sahara is 28 km3, which results in about 10 years to 90% depletion. An independent storage estimate
from Mamou et al. [2006] is not available as a comparison point to our estimate of depletion timescales.
Conversely, the minimum regional estimate of storage in the Nubian is 150,000 km3, which results in a
buffer capacity that is 4 orders of magnitude greater than in the Sahara. Bakhbakhi [2006] shows the usable
lifespan of the Nubian diminishes exponentially as a function of current extraction rates and the remaining
volume of water in storage that the author considers recoverable, limited by rising extraction costs, and
decreasing water quality. Such a comparison suggests the importance of accounting for both renewable
fluxes and total stocks when assessing the sustainability of groundwater use in an aquifer system.
The Ganges and North China systems represent an alternative case. Despite high rates of depletion, high
rates of mean annual recharge place both aquifers in the low stress category of the Variable Stress RGS
regime. However, low regional and revised storage estimates result in a limited number of years to 90%
depletion. The depletion estimate in the North China system by Liu et al. [2011] of 3.52 km3/yr is within the
GRACE-derived depletion error range of 3.2 6 0.6 km3/yr. The storage estimate by Liu et al. [2011] is also
comparable to the minimum estimate used in our study, at 23.8 km3. These are systems that have limited
resilience and buffer capacity that could make them vulnerable to increased rates of depletion and
decreases in renewable available supplies. Additionally, the three aquifers with the highest rates of deple-
tion do not have regional estimates of storage to provide a further constraint on available supplies.
The timescales presented here offer maximum estimates of TGS. The study period is limited by the length
of the GRACE satellite record. In the results presented here, we implicitly assume that the volume of storage
in the study aquifers is at full capacity at the start of the study period in 2003. In reality, pumping has
already been occurring, leaving legacy effects on the system [Liu et al., 2007] such that the years to deple-
tion are less than indicated by our results (supporting information Text S1). We assume the range of per-
centage values (p%) of storage provides baseline depletion timescales that encompass the influence of
decreasing accessibility and usability of storage with continued external pressures that, as well as the legacy
effects of depletion prior to the study period, could alter TGS timescales. It is possible that the 25% deple-
tion estimates still provide an optimistic estimate of depletion timescales, for example, in the Nubian where
the volume of recoverable freshwater in storage is less than 3% of the total storage capacity [Bakhbakhi,
2006]. Accounting for the difference in recoverable freshwater versus total storage reduces the time to
depletion by a factor of 36 using the storage and depletion estimates of Bakhbakhi [2006] (supporting infor-
mation Table S4). A further limit on available storage may exist due to regulatory structures, often
RICHEY ET AL. STORAGE ESTIMATES IN A TOTAL GROUNDWATER STRESS FRAMEWORK 14Water Resources Research 10.1002/2015WR017351
associated with maintaining base flow to streams, such as in the Central Valley and High Plains [Scanlon
et al., 2012].
It is critical to note that the spatial scale used in this study averages the changes in storage across the
entirety of each study aquifer. Local and regional variations within the aquifers can present a contrasting
picture of total stress and time to depletion at a smaller scale or across national boundaries within an aqui-
fer [Wada and Heinrich, 2013]. In the High Plains, for example, Scanlon et al. [2012] and Famiglietti and Rodell
[2013] show that the northern High Plains is dominated by recharge while the southern High Plains is heav-
ily pumped and parts of it could be depleted within 30 years. However, the spatial averaging across the
aquifer in this study finds a near zero trend in groundwater storage change across the aquifer. In fact, many
of the aquifers in this study have regions with more severe depletion rates that are balanced by less severe
depletion or gaining storage. Previous GRACE studies that focus explicitly on high depletion regions instead
of aquifer averages have higher magnitudes of depletion than occur in this study [e.g., Rodell et al., 2009;
Voss et al., 2013].
We assume the rate of depletion will remain constant to provide a baseline estimate of TGS timescales, fol-
lowing the steady rise in groundwater depletion in large aquifers by Konikow [2011]. However, the rate will
likely vary geographically as a function of socio-economic and physical factors [Hardin, 1968; Dietz et al.,
2003; Alcamo et al., 2007]. For example, Wada et al. [2014] found a global average increase in groundwater
use of about 3%/yr from 1990 to 2010, especially in North America, Central America, and parts of Asia, due
largely to growing population and associated food demand. The combination of population growth and
increased food demand with the potential for increased hydrologic extremes due to climate change may
further increase the rate of use in groundwater systems as surface supplies become less accessible [Kundze-
wicz and Do €ll, 2009; Famiglietti, 2014]. These combined influences would act to shorten the timescales of
depletion found in this study. Additionally, some regions, such as Sub-Saharan Africa have yet to experience
an agricultural boom. Only about 5% of land is currently irrigated in this area, as opposed to the greater
than 60% of irrigated land during India’s Green Revolution [Rockstro €m et al., 2007]. The expansion of irri-
gated agriculture has resulted in severe groundwater depletion in parts of India [Rodell et al., 2009] as well
as an influx of arsenic in agriculture through increased irrigation of contaminated groundwater [Brammer
and Ravenscroft, 2009]. Growing food demand and agricultural pressure may expand the need for irrigation
and further increase the rate of depletion. Conversely, water-use efficiency practices could decrease the
rate of depletion. While we recognize that increasing or decreasing the rate of future depletion can account
for changes in climate and use patterns, it is beyond the scope of the present study.
5. Conclusions
The results presented herein explore the concepts of groundwater resilience and the buffer capacity of
groundwater storage in a water stress framework. We define a Total Groundwater Stress (TGS) ratio as a
measure of groundwater resilience in the world’s largest aquifer systems. In this study, we highlight the
state of knowledge on both fluxes and stocks in the world’s largest aquifer systems at the aquifer scale. We
compare available estimates of total storage, and further constrain these estimates, to assess groundwater
stocks. Remote sensing observations from GRACE assess the trend in combined fluxes within a system, by
integrating the influence of recharge, discharge, pumping, and capture into a single trend of water mass
anomalies.
GRACE observations allow for the first-ever quantification of groundwater resilience by identifying the sys-
tems that can no longer increase capture to balance external perturbations to an equilibrium state. The
GRACE-based estimates of depletion integrate the dynamic, nonlinear links that exist in coupled human-
natural systems like groundwater. This is necessary in a groundwater sustainability study to account for
both human actions such as pumping and the dynamic response of the aquifer [Liu et al., 2007; Zhou, 2009].
Traditionally, the study of such a coupled system has been limited to either the human or natural dimen-
sion, though fully assessing resilience must account for both dimensions [Liu et al., 2007]. The spatial scale
of GRACE allows for system-wide basin averages to address the resilience across the totality of the system
as recommended by Turner et al. [2003].
Long-term storage loss is the limit of groundwater resilience, indicating an aquifer system’s inability to
maintain equilibrium despite perturbations. Groundwater is largely unregulated, although the influence of
RICHEY ET AL. STORAGE ESTIMATES IN A TOTAL GROUNDWATER STRESS FRAMEWORK 15Water Resources Research 10.1002/2015WR017351
human management is often required to improve the resilience of natural systems [Liu et al., 2007]. An aqui-
fer that increases capture by decreasing base flow may not be considered resilient in a coupled surface
water-groundwater system, increasing the importance of management to improve system-wide resilience.
Transparent information exchange on the state of fluxes and stocks in common pool resources, such as
groundwater, is the first step toward effective management [Schlager et al., 1994; Dietz et al., 2003]. We
have shown that transparent knowledge on groundwater stocks is lacking in the majority of the world’s
large aquifer systems.
This work clearly demonstrates that it is no longer adequate to continue citing decades-old, heuristically
derived, highly uncertain estimates of total groundwater storage. The lack of ground-based measures of
total storage will continue to prevent a full characterization of aquifer stress and resilience until large scale
efforts are implemented to improve the state-of-knowledge on groundwater stocks. To improve current
storage estimates require a significant investment in regional monitoring and measuring systems to better
characterize saturated thickness and soil properties within an aquifer. Konikow [2011, 2013] cites the most
reliable methods to assess the state of a groundwater system as using observations of groundwater levels
and storage coefficients, with temporally varying observations of gravity, and with a calibrated model. Fami-
glietti [2014] calls for detailed hydrogeologic exploration of the world’s major aquifers. All of these methods
require in situ observations for direct measurements, model calibration, and an assessment of subregional
conditions. Without these measurements, the extrapolations of limited data across large land areas is
required often with a high level of uncertainty. The continuation of remote sensing missions is crucial to
provide an integrated perspective of the combined human and natural influences on a groundwater system
[Famiglietti and Rodell, 2013]. Improved assessments of soil moisture over large scales [Entekhabi et al.,
2010] would benefit the isolation of groundwater storage changes from estimates of total terrestrial water
storage. Additionally, it is important to incorporate decision makers into an assessment of recoverable stor-
age capacity for transparency on the quality of information regarding available supplies and to ultimately
create water use regulations that holistically and sustainably address the combined human and natural
impacts on a groundwater system.
Until improved storage estimates exist to determine a system’s full capacity to buffer against Renewable
Groundwater Stress, continued pressure on aquifer systems could lead to irreversible depletion that seri-
ously threaten the sustainability of groundwater dependent regions. Additionally, large volumes of water in
storage may not be representative of resilient systems without also considering the negative impacts of
pumping and limitations on recoverable storage as a function of soil properties and well design, which
reduce the usable storage volume.
The uncertainty in total groundwater storage and estimates of depletion timescales is particularly relevant
in regions that are prone to drought and lack active management of groundwater resources. For example,
the highly stressed Central Valley lacks sufficient natural recharge to balance current use rates [Richey et al.,
2015], which is exacerbated by an increased dependence on groundwater during drought [Famiglietti et al.,
2011; Scanlon et al., 2012]. The first regulations to govern groundwater use across the state were passed in
2014 and do not require sustainable groundwater management until 2040. The current depletion rate
shows that the aquifer is unable to balance the combined impact of groundwater use and drought, either
through capture or active management, and is therefore not a resilient system. The best available estimates
of total storage in the Central Valley trace to estimates made in the 1970s and 1980s [Department of Water
Resources (DWR), 1975; Williamson et al., 1989]. The earlier of these studies estimated the volume of recover-
able storage at that time to be 176 km3 versus 1600 km3 of total capacity [DWR, 1975], implying the lifespan
of usable groundwater today that is highly threatened and may be expended in a matter of decades given
current rates of groundwater depletion [Famiglietti et al., 2011]. This work highlights the need to improve
active management of groundwater by both reducing demand and by increasing supply, for example,
through artificial recharge [Scanlon et al., 2012].
Here, we highlight the ability to provide bounds on groundwater resilience and buffer capacity based on
available and constrained storage estimates in the study aquifers. We show how remote sensing observa-
tions from GRACE can improve our understanding of groundwater stress and resilience by quantifying
depletion; however, the large uncertainty in storage remains a barrier. As continued efforts increase the
transparency and availability of information on the state of large aquifer systems, the ability to manage
these systems to increase resilience will be enhanced.
RICHEY ET AL. STORAGE ESTIMATES IN A TOTAL GROUNDWATER STRESS FRAMEWORK 16You can also read